Embed Size (px)
Citation preview

Antonio Chessa, Stefan Boumans and Jan Walschots Scanner data workshop, Rome, 1-2 Oct. 2015
Towards a new methodology for
scanner data in the Dutch CPI
Outline
2
• Historical background
• Motivation and aims of new methodology
• Integration in CPI framework
• The index method
• Results
• Future plans
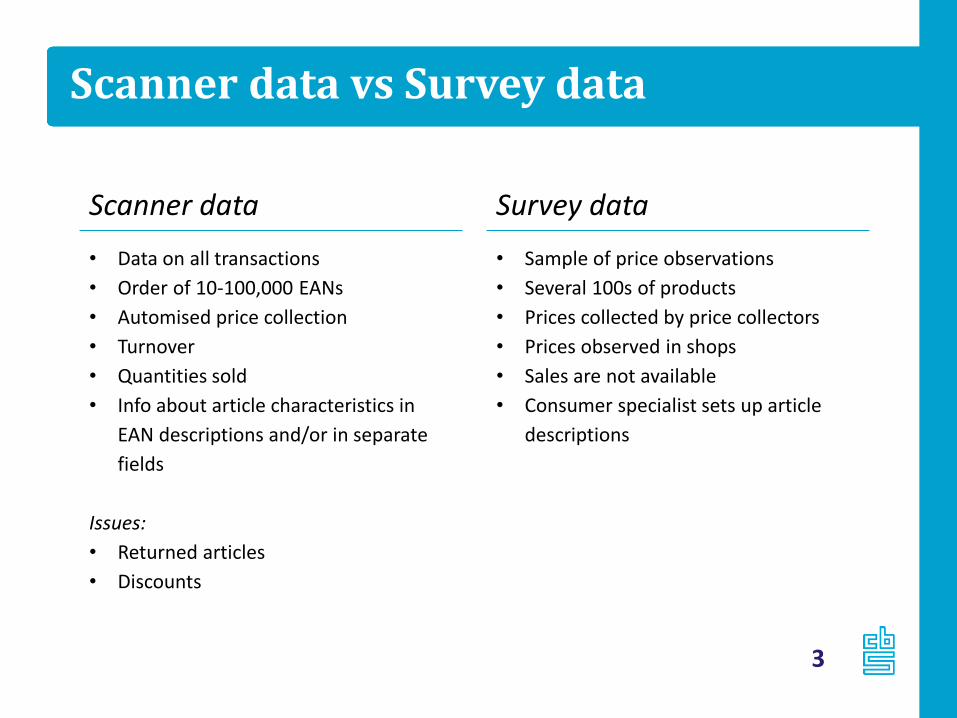
Scanner data vs Survey data
Scanner data
• Data on all transactions
• Order of 10-100,000 EANs
• Automised price collection
• Turnover
• Quantities sold
• Info about article characteristics in
EAN descriptions and/or in separate
fields
Issues:
• Returned articles
• Discounts
Survey data
• Sample of price observations
• Several 100s of products
• Prices collected by price collectors
• Prices observed in shops
• Sales are not available
• Consumer specialist sets up article
descriptions
3
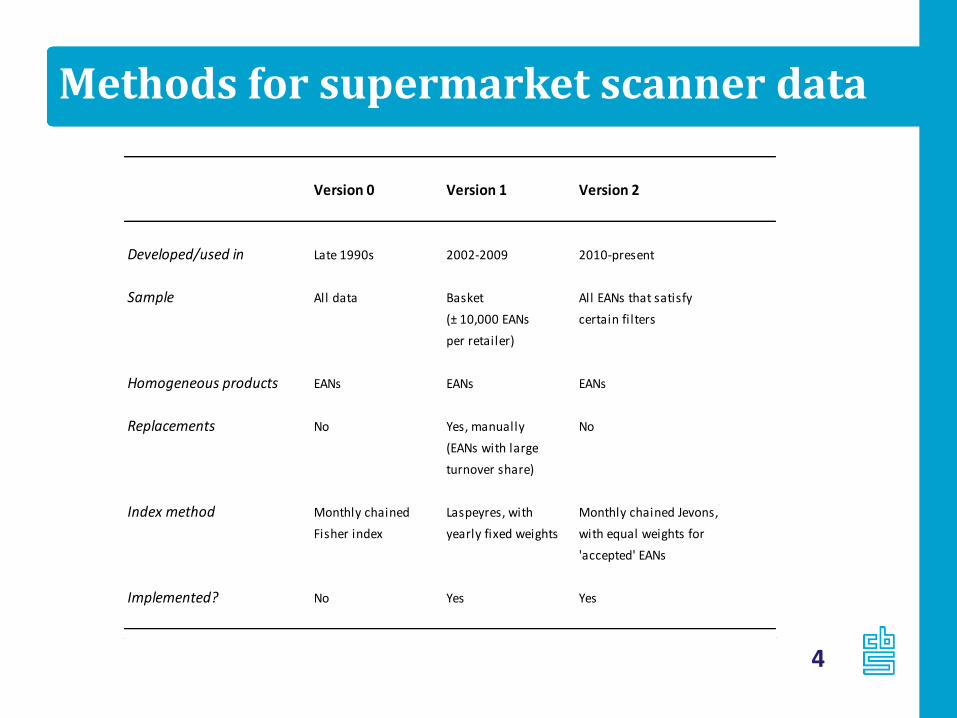
Methods for supermarket scanner data
4
Version 0 Version 1 Version 2
Developed/used in Late 1990s 2002-2009 2010-present
Sample All data Basket All EANs that satisfy
(± 10,000 EANs certain fi lters
per retailer)
Homogeneous products EANs EANs EANs
Replacements No Yes, manually No
(EANs with large
turnover share)
Index method Monthly chained Laspeyres, with Monthly chained Jevons,
Fisher index yearly fixed weights with equal weights for
'accepted' EANs
Implemented? No Yes Yes
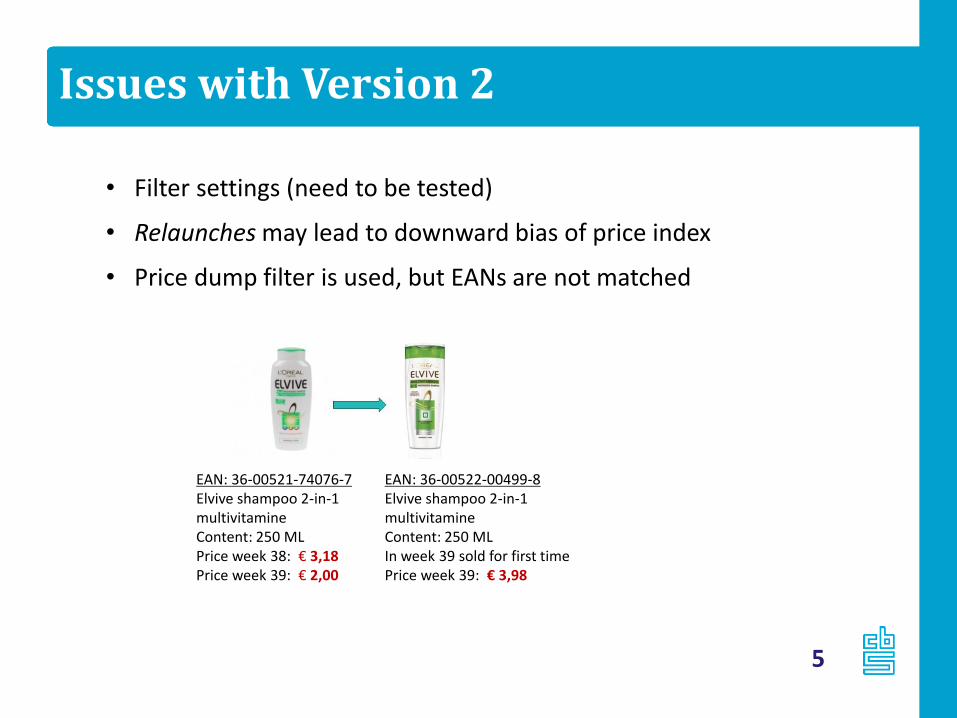
Issues with Version 2
5
EAN: 36-00521-74076-7 Elvive shampoo 2-in-1 multivitamine Content: 250 ML Price week 38: € 3,18 Price week 39: € 2,00
EAN: 36-00522-00499-8 Elvive shampoo 2-in-1 multivitamine Content: 250 ML In week 39 sold for first time Price week 39: € 3,98
• Filter settings (need to be tested)
• Relaunches may lead to downward bias of price index
• Price dump filter is used, but EANs are not matched
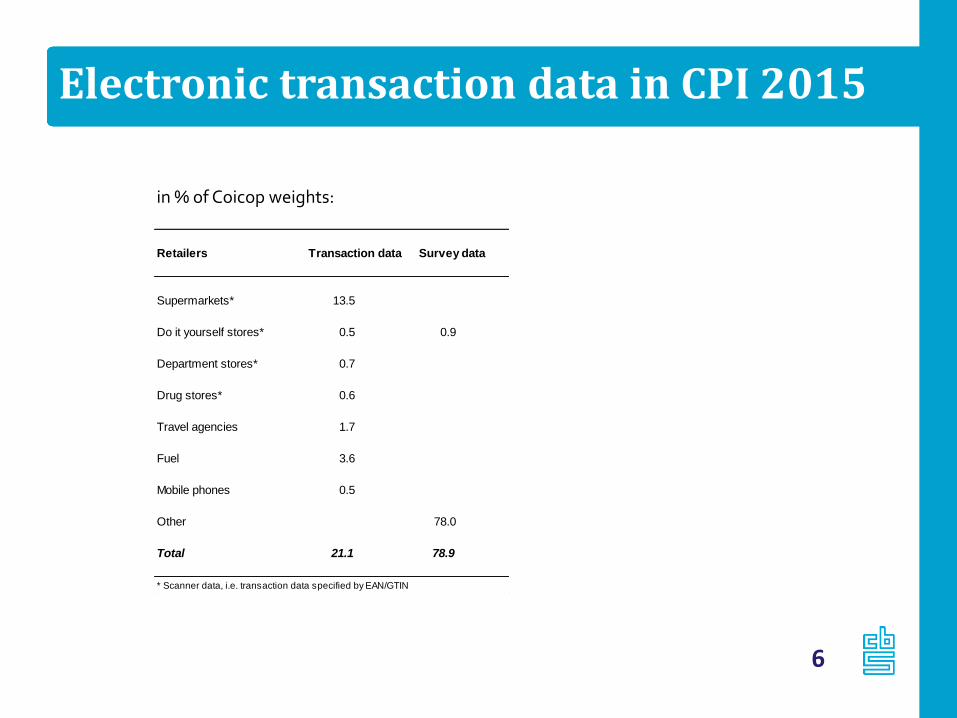
Electronic transaction data in CPI 2015
6
Retailers Transaction data Survey data
Supermarkets* 13.5
Do it yourself stores* 0.5 0.9
Department stores* 0.7
Drug stores* 0.6
Travel agencies 1.7
Fuel 3.6
Mobile phones 0.5
Other 78.0
Total 21.1 78.9
* Scanner data, i.e. transaction data specified by EAN/GTIN
in % of Coicop weights:
Research objective:
7
Investigate whether a generic method can be developed that can be
applied to scanner data of different retailers/consumer goods
Specific focus:
• Process all articles/EANs
• Timely include new articles
• Reduce use of filters
• Handle relaunches
New methodology within CPI
8
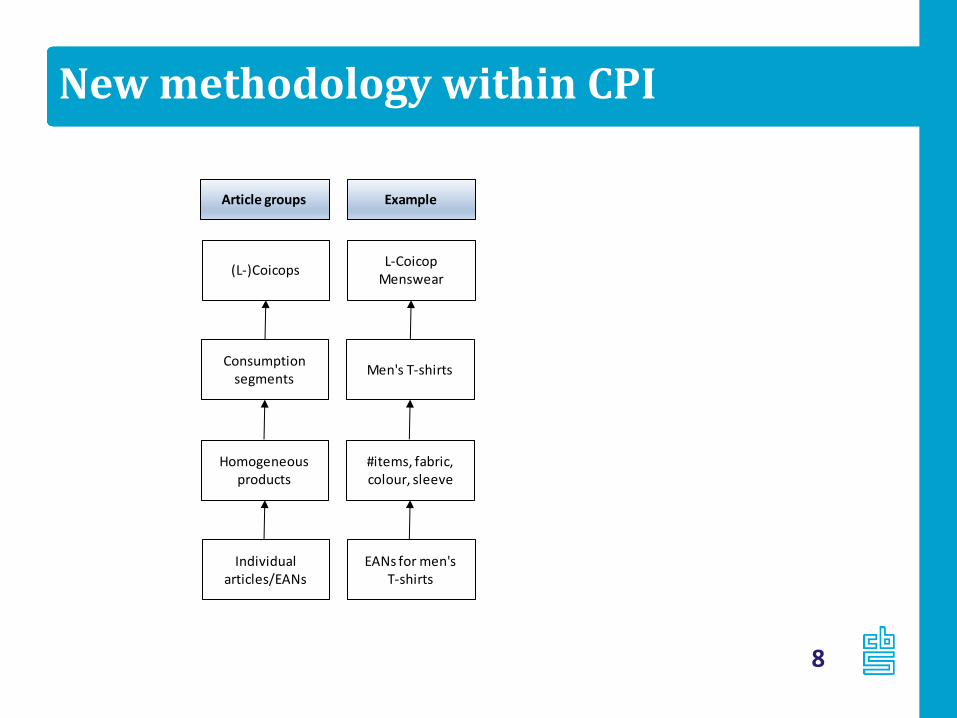
(L-)Coicops
Consumption segments
Homogeneous products
Individual articles/EANs
Laspeyres type indices
QU-indices
Product prices (unit values)
Transaction prices
Article groups Index calculation
Men's T-shirts
#items, fabric, colour, sleeve
EANs for men's T-shirts
Example
L-Coicop Menswear
New methodology within CPI
9
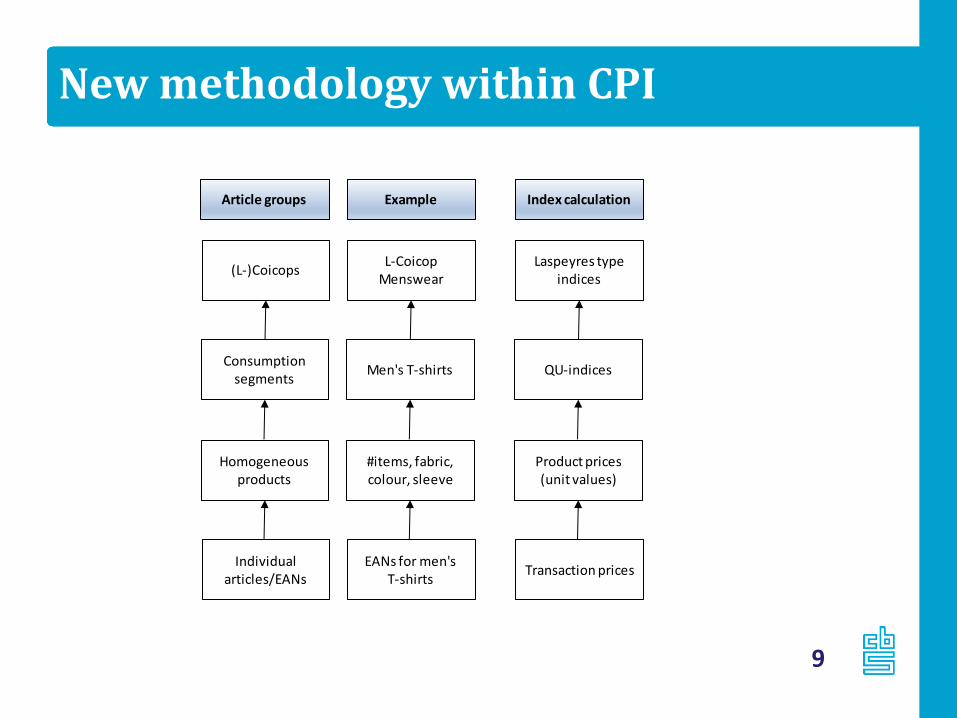
(L-)Coicops
Consumption segments
Homogeneous products
Individual articles/EANs
Laspeyres type indices
QU-indices
Product prices (unit values)
Transaction prices
Article groups Index calculation
Men's T-shirts
#items, fabric, colour, sleeve
EANs for men's T-shirts
Example
L-Coicop Menswear
Index method (“QU-method”)
10
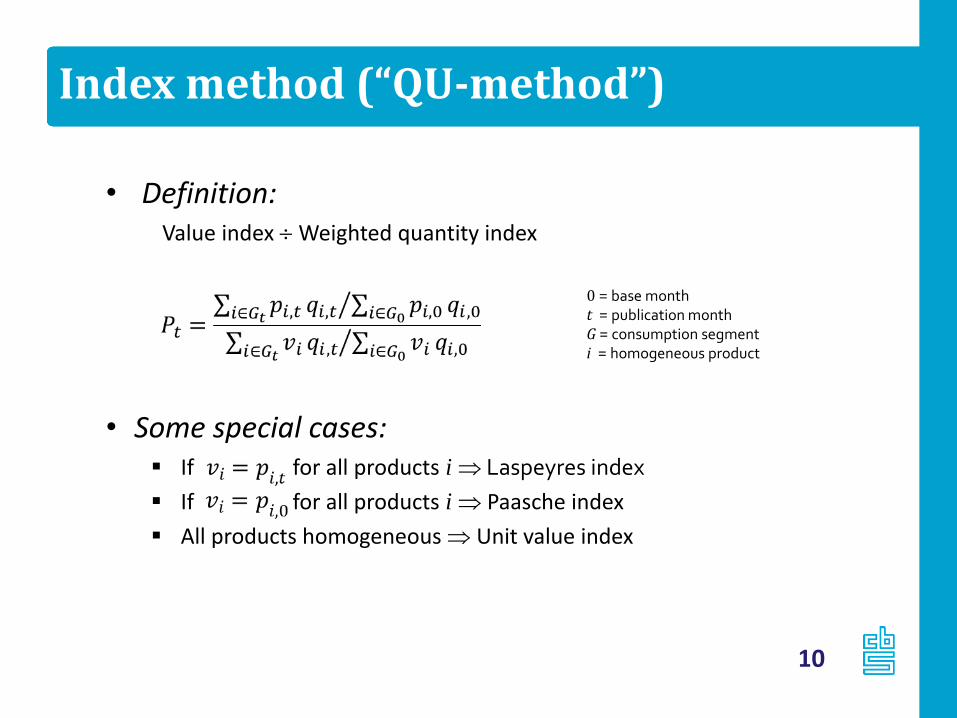
• Definition: Value index Weighted quantity index
• Some special cases: If for all products i Laspeyres index
If for all products i Paasche index
All products homogeneous Unit value index
0 = base month t = publication month G = consumption segment i = homogeneous product
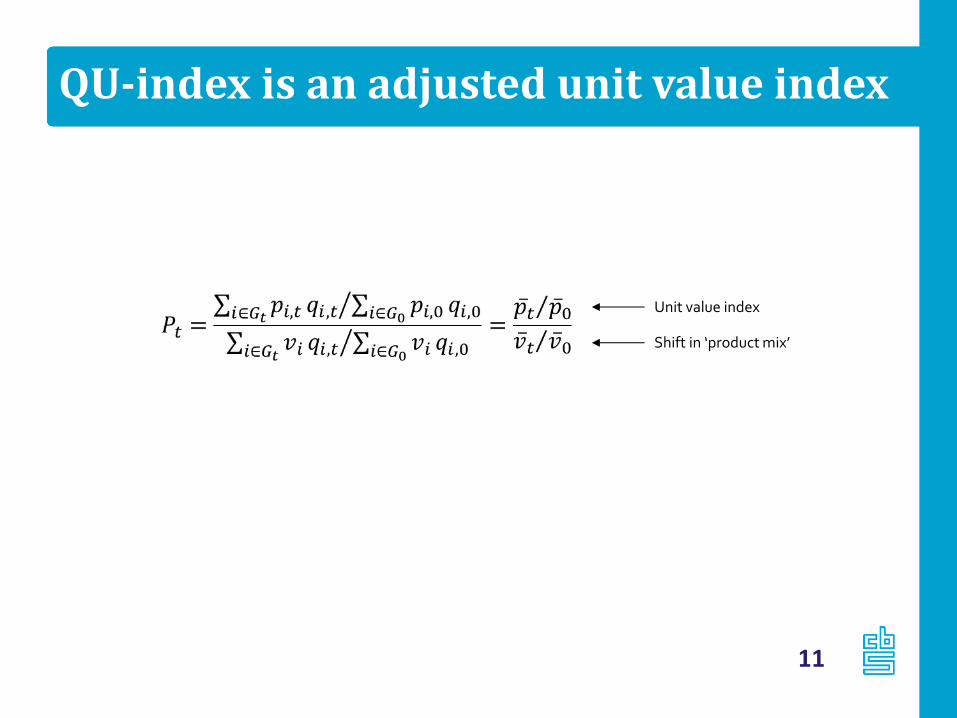
QU-index is an adjusted unit value index
11
Unit value index
Shift in ‘product mix’
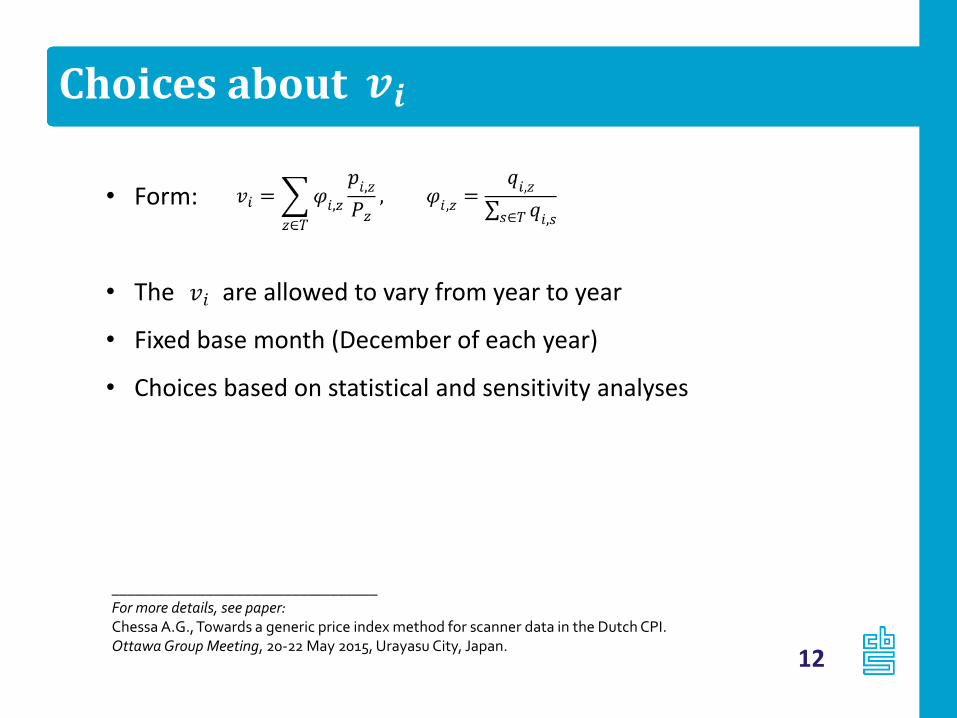
Choices about
12
• Form:
• The are allowed to vary from year to year
• Fixed base month (December of each year)
• Choices based on statistical and sensitivity analyses
__________________________________ For more details, see paper: Chessa A.G., Towards a generic price index method for scanner data in the Dutch CPI. Ottawa Group Meeting, 20-22 May 2015, Urayasu City, Japan.
Computational method
13
• Iterative method (alternate updates of index and product weights)
• Monthly update of weights with product prices and quantities
• Direct index with updated weights
• Index with yearly fixed product weights is used as benchmark (transitive)
Tests
14
• Department store scanner data and mobile phone data
• Results validated
• Move towards CPI production for both data sets by January 2016
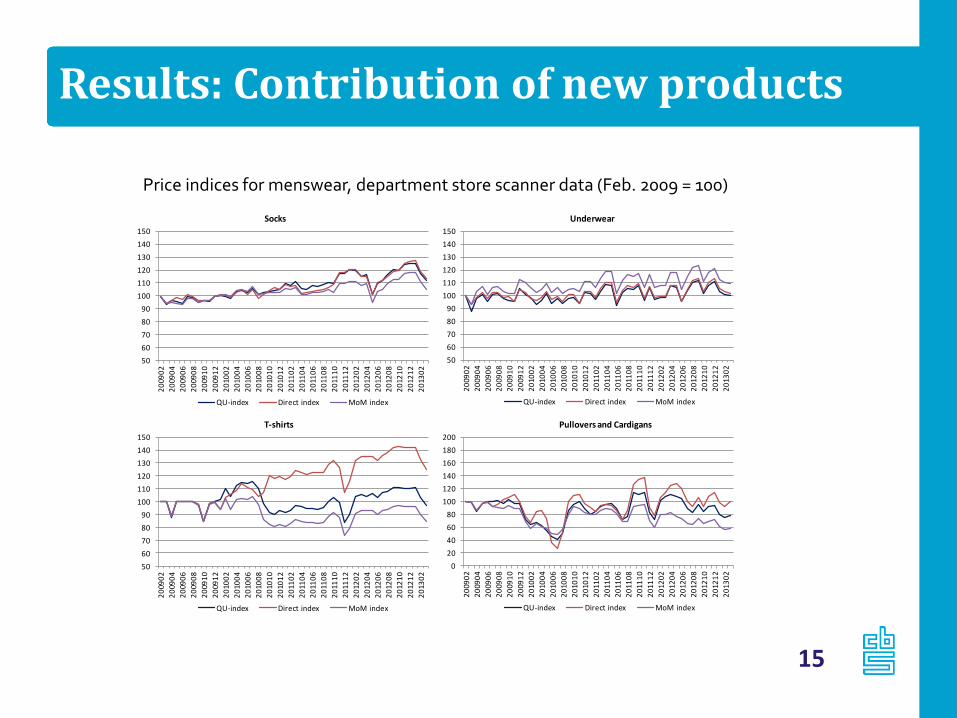
Results: Contribution of new products
15
50
60
70
80
90
100
110
120
130
140
150
20
090
2
20
090
4
20
090
6
20
090
8
20
091
0
20
091
2
20
100
2
20
100
4
20
100
6
20
100
8
20
101
0
20
101
2
20
110
2
20
110
4
20
110
6
20
110
8
20
111
0
20
111
2
20
120
2
20
120
4
20
120
6
20
120
8
20
121
0
20
121
2
20
130
2
Underwear
QU-index Direct index MoM index
50
60
70
80
90
100
110
120
130
140
150
20
090
2
20
090
4
20
090
6
20
090
8
20
091
0
20
091
2
20
100
2
20
100
4
20
100
6
20
100
8
20
101
0
20
101
2
20
110
2
20
110
4
20
110
6
20
110
8
20
111
0
20
111
2
20
120
2
20
120
4
20
120
6
20
120
8
20
121
0
20
121
2
20
130
2
Socks
QU-index Direct index MoM index
0
20
40
60
80
100
120
140
160
180
200
20
090
2
20
090
4
20
090
6
20
090
8
20
091
0
20
091
2
20
100
2
20
100
4
20
100
6
20
100
8
20
101
0
20
101
2
20
110
2
20
110
4
20
110
6
20
110
8
20
111
0
20
111
2
20
120
2
20
120
4
20
120
6
20
120
8
20
121
0
20
121
2
20
130
2
Pullovers and Cardigans
QU-index Direct index MoM index
50
60
70
80
90
100
110
120
130
140
150
20
090
2
20
090
4
20
090
6
20
090
8
20
091
0
20
091
2
20
100
2
20
100
4
20
100
6
20
100
8
20
101
0
20
101
2
20
110
2
20
110
4
20
110
6
20
110
8
20
111
0
20
111
2
20
120
2
20
120
4
20
120
6
20
120
8
20
121
0
20
121
2
20
130
2T-shirts
QU-index Direct index MoM index
Price indices for menswear, department store scanner data (Feb. 2009 = 100)
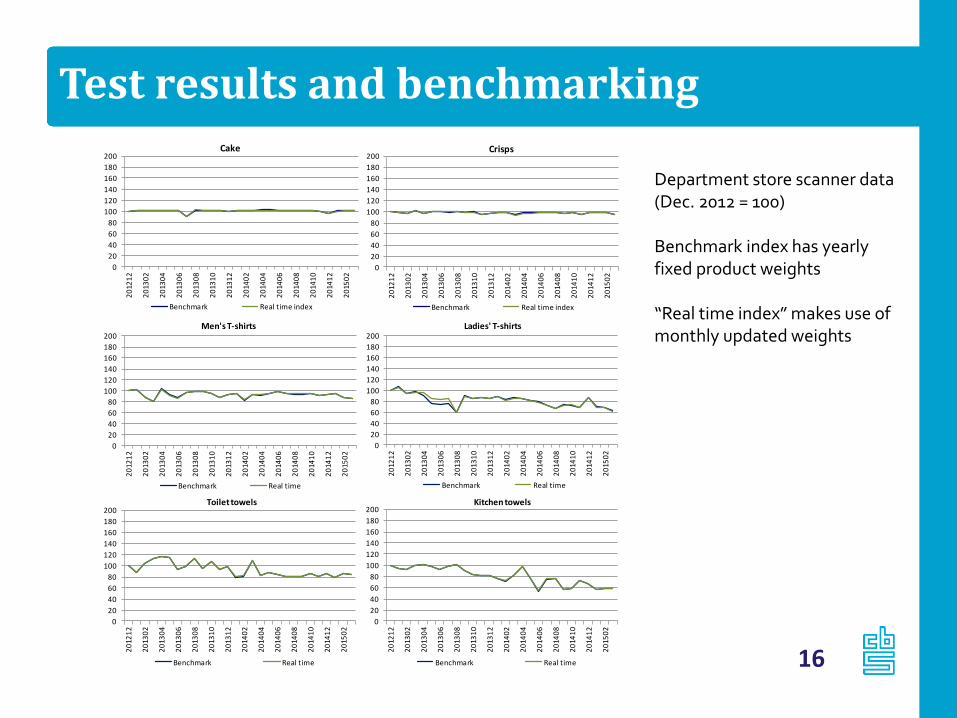
Test results and benchmarking
16
0
20
40
60
80
100
120
140
160
180
200
20
121
2
20
130
2
20
130
4
20
130
6
20
130
8
20
131
0
20
131
2
20
140
2
20
140
4
20
140
6
20
140
8
20
141
0
20
141
2
20
150
2
Cake
Benchmark Real time index
0
20
40
60
80
100
120
140
160
180
200
20
121
2
20
130
2
20
130
4
20
130
6
20
130
8
20
131
0
20
131
2
20
140
2
20
140
4
20
140
6
20
140
8
20
141
0
20
141
2
20
150
2
Crisps
Benchmark Real time index
0
20
40
60
80
100
120
140
160
180
200
20
121
2
20
130
2
20
130
4
20
130
6
20
130
8
20
131
0
20
131
2
20
140
2
20
140
4
20
140
6
20
140
8
20
141
0
20
141
2
20
150
2
Men's T-shirts
Benchmark Real time
0
20
40
60
80
100
120
140
160
180
200
20
121
2
20
130
2
20
130
4
20
130
6
20
130
8
20
131
0
20
131
2
20
140
2
20
140
4
20
140
6
20
140
8
20
141
0
20
141
2
20
150
2
Ladies' T-shirts
Benchmark Real time
0
20
40
60
80
100
120
140
160
180
200
20
121
2
20
130
2
20
130
4
20
130
6
20
130
8
20
131
0
20
131
2
20
140
2
20
140
4
20
140
6
20
140
8
20
141
0
20
141
2
20
150
2
Toilet towels
Benchmark Real time
0
20
40
60
80
100
120
140
160
180
200
20
121
2
20
130
2
20
130
4
20
130
6
20
130
8
20
131
0
20
131
2
20
140
2
20
140
4
20
140
6
20
140
8
20
141
0
20
141
2
20
150
2
Kitchen towels
Benchmark Real time
Department store scanner data (Dec. 2012 = 100) Benchmark index has yearly fixed product weights “Real time index” makes use of monthly updated weights
Short term plans
17
• Current state: Methodology tested for department store and mobile phones
Work is in progress for other sectors
• Future plans and aims: January 2016: In production for dept store and mobile phones
From second half of 2015: Method applied to drugstore scanner data
Additional data needed (discounts, maybe also on article characteristics)
Preliminary research for DIY-stores (additional data was needed, test data received)
Started with supermarkets (small scale research)