Embed Size (px)
Citation preview
ReimaginEd 2015
Trends in K12 Education
David Havens
@eduhavens
#ReimaginED2015
Vivek Murali
@vivmurali
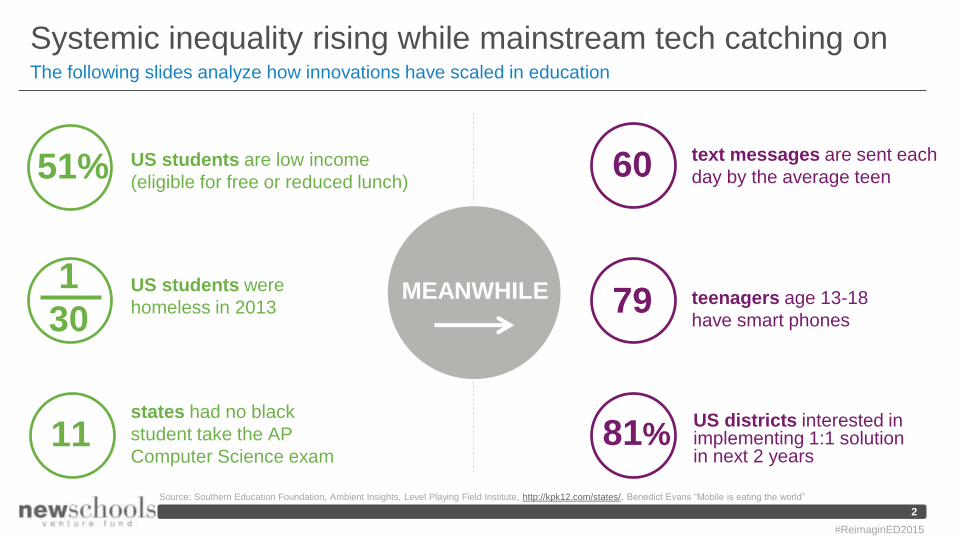
US students are low income
(eligible for free or reduced lunch)51%
US districts interested in implementing 1:1 solution in next 2 years
teenagers age 13-18
have smart phones
text messages are sent each
day by the average teen
MEANWHILE
60
79
81%
2
Source: Southern Education Foundation, Ambient Insights, Level Playing Field Institute, http://kpk12.com/states/, Benedict Evans “Mobile is eating the world”
US students were
homeless in 2013
states had no black
student take the AP
Computer Science exam
1
30
11
#ReimaginED2015
The following slides analyze how innovations have scaled in education
Systemic inequality rising while mainstream tech catching on
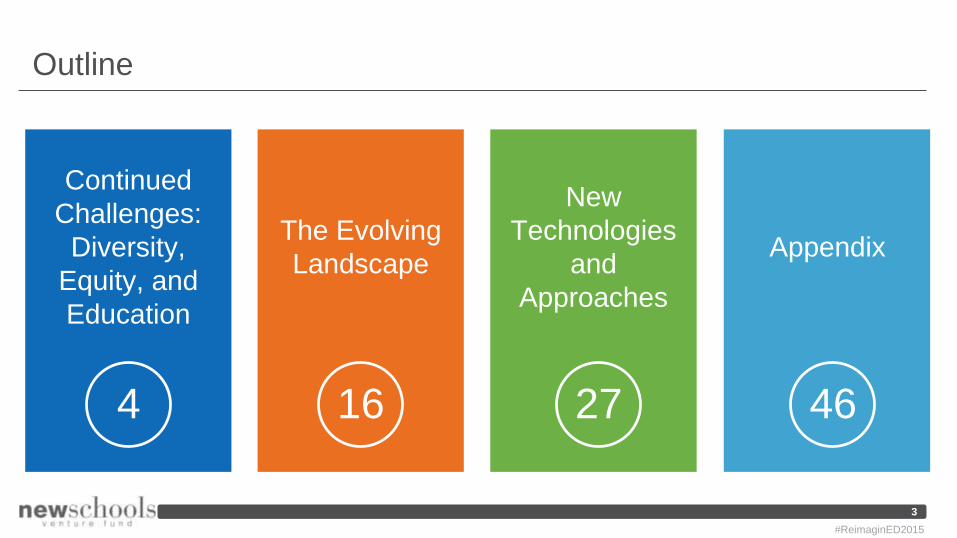
Outline
Continued
Challenges:
Diversity,
Equity, and
Education
The Evolving
LandscapeAppendix
New
Technologies
and
Approaches
4627164
3
#ReimaginED2015
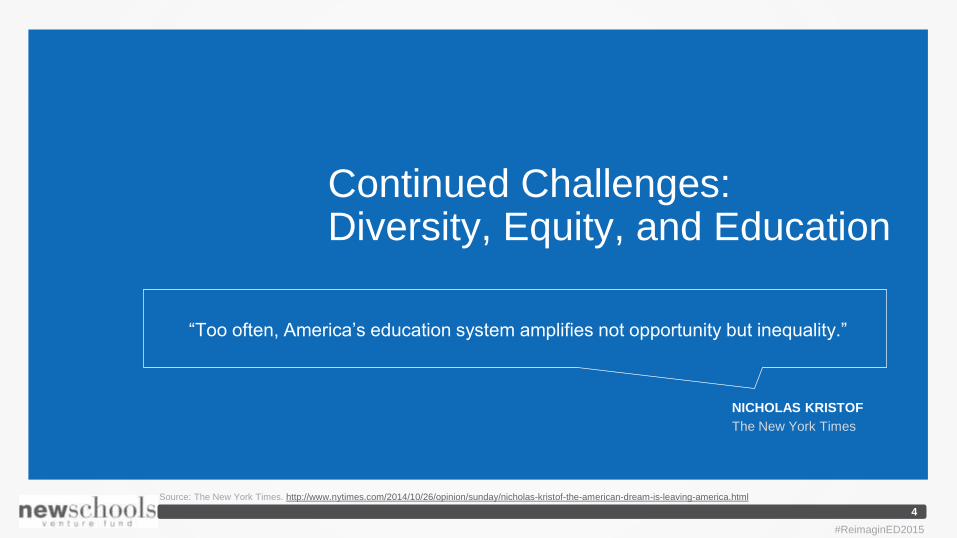
Continued Challenges: Diversity, Equity, and Education
“Too often, America’s education system amplifies not opportunity but inequality.”
NICHOLAS KRISTOF
The New York Times
Source: The New York Times. http://www.nytimes.com/2014/10/26/opinion/sunday/nicholas-kristof-the-american-dream-is-leaving-america.html
4
#ReimaginED2015
Russian Federation*
Korea
Finland
Flanders (Belgium)
France
Ireland
Poland
Netherlands
Canada
Estonia
Sweden
Japan
Australia
Average
Spain
England / N. Ireland (UK)
Danemark
Norway
Italy
Slovak Republic
United States
Austria
Germany
Czech Republic
0% 10% 20% 30% 40% 50% 60% 70%
Upward mobility
Downward mobility
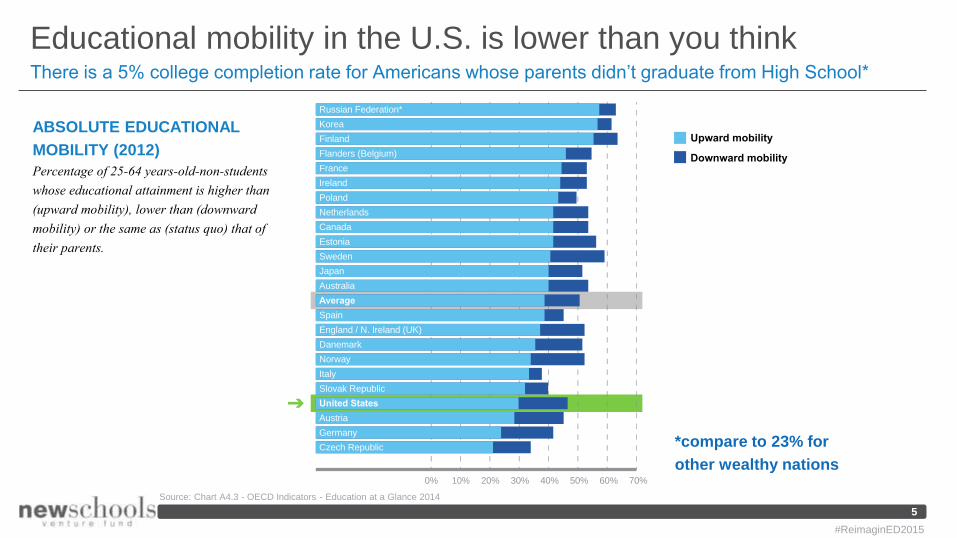
There is a 5% college completion rate for Americans whose parents didn’t graduate from High School*
Educational mobility in the U.S. is lower than you think
ABSOLUTE EDUCATIONAL
MOBILITY (2012)
Percentage of 25-64 years-old-non-students
whose educational attainment is higher than
(upward mobility), lower than (downward
mobility) or the same as (status quo) that of
their parents.
*compare to 23% for
other wealthy nations
5
Source: Chart A4.3 - OECD Indicators - Education at a Glance 2014
#ReimaginED2015
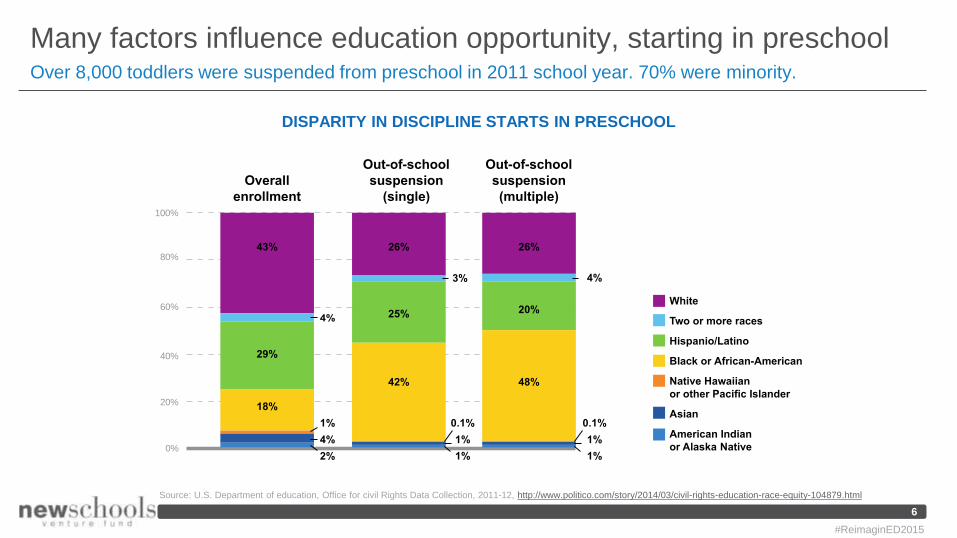
Many factors influence education opportunity, starting in preschoolOver 8,000 toddlers were suspended from preschool in 2011 school year. 70% were minority.
DISPARITY IN DISCIPLINE STARTS IN PRESCHOOL
43%
4%
29%
18%
1%
4%
2%
26%
3%
42%
25%
0.1%
1%
1%
0.1%
1%
1%
26%
4%
20%
48%
0%
20%
40%
60%
80%
100%
Overall
enrollment
Out-of-school
suspension
(single)
Out-of-school
suspension
(multiple)
White
Two or more races
Hispanio/Latino
Black or African-American
Native Hawaiian
or other Pacific Islander
Asian
American Indian
or Alaska Native
6
Source: U.S. Department of education, Office for civil Rights Data Collection, 2011-12, http://www.politico.com/story/2014/03/civil-rights-education-race-equity-104879.html
#ReimaginED2015
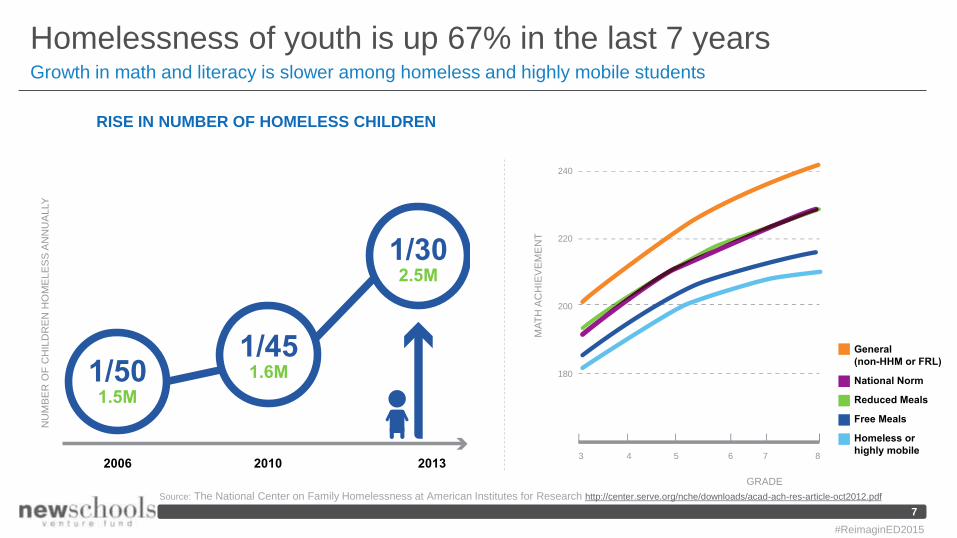
2006 2010 2013
1/501.5M
1/451.6M
1/302.5M
NU
MB
ER
OF
CH
ILD
RE
N H
OM
EL
ES
S A
NN
UA
LLY
General
(non-HHM or FRL)
National Norm
Reduced Meals
Free Meals
Homeless or
highly mobile
180
200
220
240
3 4 5 6 7 8
GRADE
MA
TH
AC
HIE
VE
ME
NT
Homelessness of youth is up 67% in the last 7 yearsGrowth in math and literacy is slower among homeless and highly mobile students
7
Source: The National Center on Family Homelessness at American Institutes for Research http://center.serve.org/nche/downloads/acad-ach-res-article-oct2012.pdf
RISE IN NUMBER OF HOMELESS CHILDREN
#ReimaginED2015
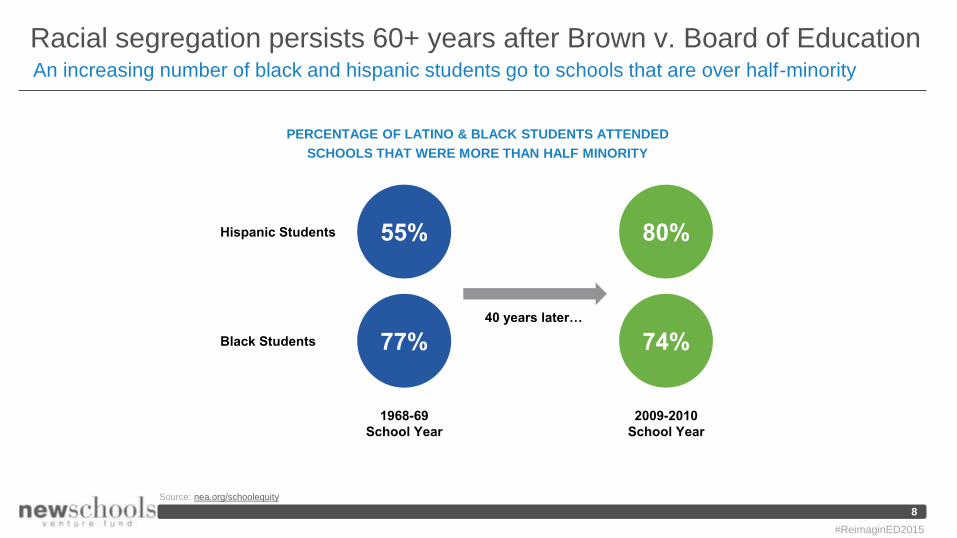
Racial segregation persists 60+ years after Brown v. Board of EducationAn increasing number of black and hispanic students go to schools that are over half-minority
8
Source: nea.org/schoolequity
#ReimaginED2015
PERCENTAGE OF LATINO & BLACK STUDENTS ATTENDED
SCHOOLS THAT WERE MORE THAN HALF MINORITY
Hispanic Students
Black Students
55%
77%
80%
74%
1968-69
School Year
2009-2010
School Year
40 years later…
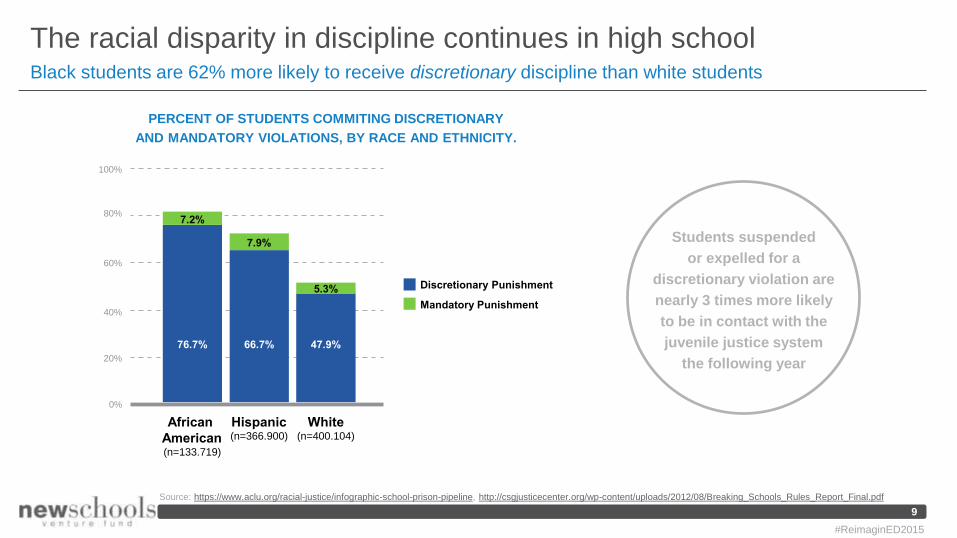
Black students are 62% more likely to receive discretionary discipline than white students
The racial disparity in discipline continues in high school
9
Source: https://www.aclu.org/racial-justice/infographic-school-prison-pipeline, http://csgjusticecenter.org/wp-content/uploads/2012/08/Breaking_Schools_Rules_Report_Final.pdf
#ReimaginED2015
PERCENT OF STUDENTS COMMITING DISCRETIONARY
AND MANDATORY VIOLATIONS, BY RACE AND ETHNICITY.
Students suspended
or expelled for a
discretionary violation are
nearly 3 times more likely
to be in contact with the
juvenile justice system
the following year
Discretionary Punishment
Mandatory Punishment
0%
20%
40%
60%
80%
100%
African
American(n=133.719)
Hispanic(n=366.900)
White(n=400.104)
76.7%
7.2%
66.7%
7.9%
47.9%
5.3%
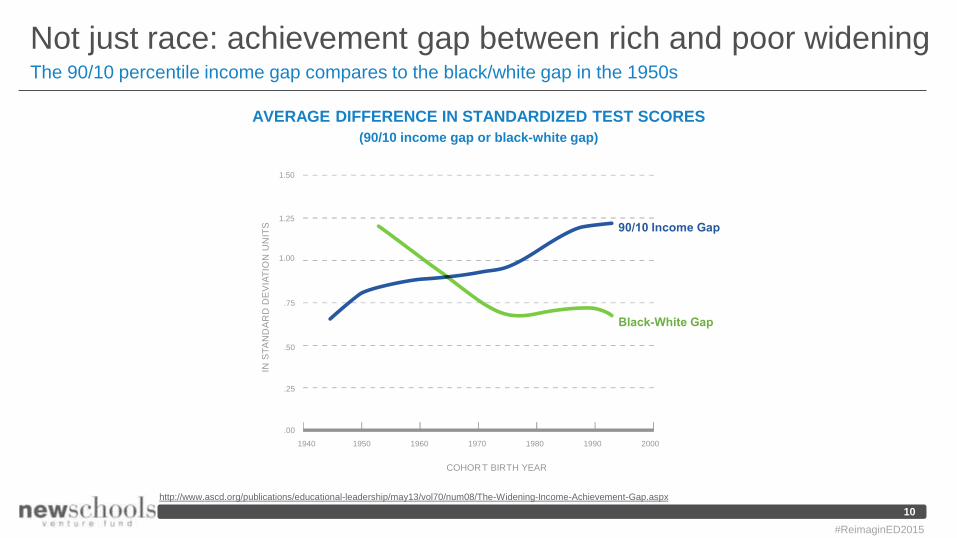
The 90/10 percentile income gap compares to the black/white gap in the 1950s
Not just race: achievement gap between rich and poor widening
10
http://www.ascd.org/publications/educational-leadership/may13/vol70/num08/The-Widening-Income-Achievement-Gap.aspx
AVERAGE DIFFERENCE IN STANDARDIZED TEST SCORES
(90/10 income gap or black-white gap)
90/10 Income Gap
Black-White Gap
.00
1940 1950 1960 1970 1980 1990 2000
.25
.50
.75
1.00
1.25
1.50
COHORT BIRTH YEAR
INS
TA
ND
AR
DD
EV
IAT
ION
UN
ITS
#ReimaginED2015
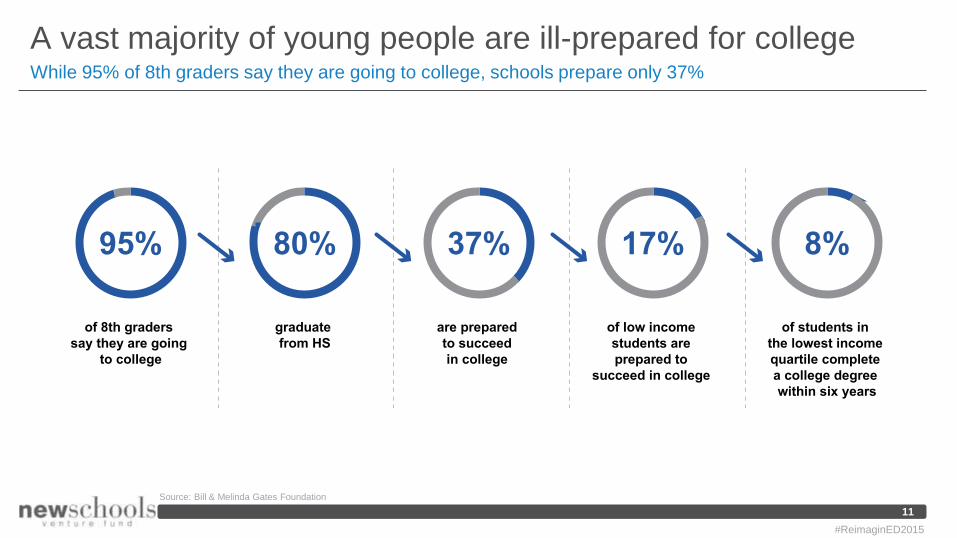
of 8th graders
say they are going
to college
95%
graduate
from HS
80%
are prepared
to succeed
in college
37%
of low income
students are
prepared to
succeed in college
17%
of students in
the lowest income
quartile complete
a college degree
within six years
8%
While 95% of 8th graders say they are going to college, schools prepare only 37%
A vast majority of young people are ill-prepared for college
11
Source: Bill & Melinda Gates Foundation
#ReimaginED2015
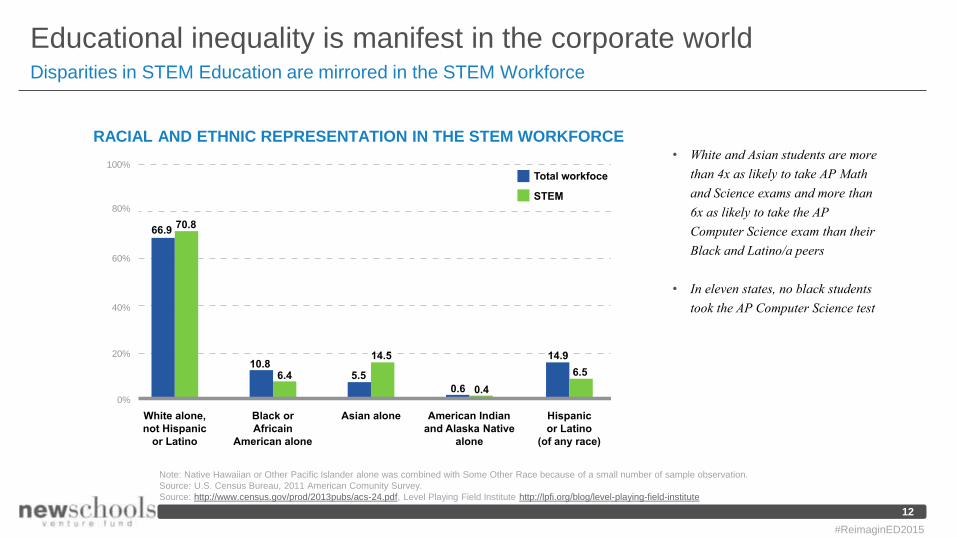
Educational inequality is manifest in the corporate worldDisparities in STEM Education are mirrored in the STEM Workforce
12
• White and Asian students are more
than 4x as likely to take AP Math
and Science exams and more than
6x as likely to take the AP
Computer Science exam than their
Black and Latino/a peers
• In eleven states, no black students
took the AP Computer Science test
RACIAL AND ETHNIC REPRESENTATION IN THE STEM WORKFORCE
Total workfoce
STEM
0%
20%
40%
60%
80%
100%
White alone,
not Hispanic
or Latino
Black or
Africain
American alone
Asian alone American Indian
and Alaska Native
alone
Hispanic
or Latino
(of any race)
66.970.8
10.86.4 5.5
14.5
0.6 0.4
14.9
6.5
Note: Native Hawaiian or Other Pacific Islander alone was combined with Some Other Race because of a small number of sample observation.
Source: U.S. Census Bureau, 2011 American Comunity Survey.
Source: http://www.census.gov/prod/2013pubs/acs-24.pdf, Level Playing Field Institute http://lpfi.org/blog/level-playing-field-institute
#ReimaginED2015
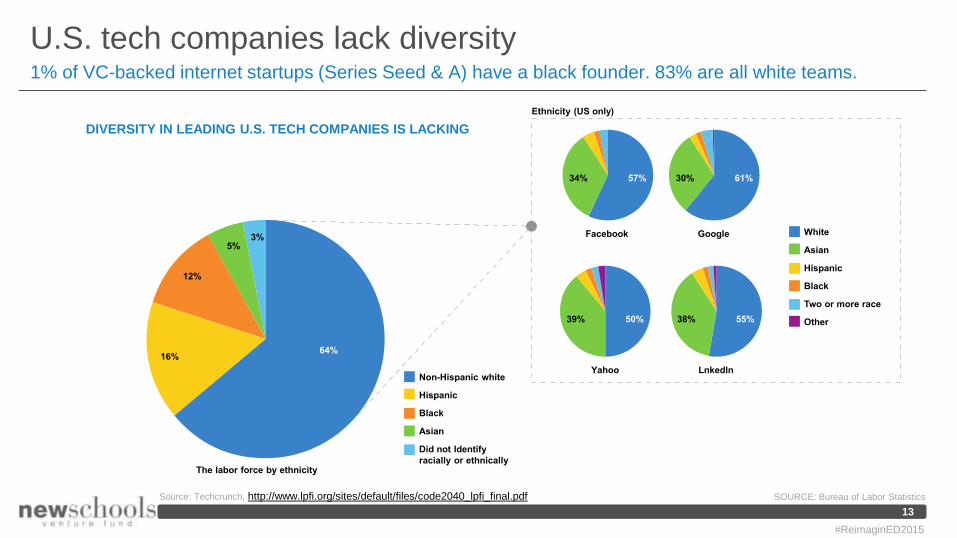
U.S. tech companies lack diversity1% of VC-backed internet startups (Series Seed & A) have a black founder. 83% are all white teams.
13
Source: Techcrunch, http://www.lpfi.org/sites/default/files/code2040_lpfi_final.pdf SOURCE: Bureau of Labor Statistics
DIVERSITY IN LEADING U.S. TECH COMPANIES IS LACKING
White
Asian
Hispanic
Black
Two or more race
Other
Facebook Google
Yahoo LnkedlnNon-Hispanic white
Hispanic
Black
Asian
Did not Identify
racially or ethnically
64%16%
12%
5%3%
The labor force by ethnicity
Ethnicity (US only)
34% 57% 30% 61%
38% 55%39% 50%
#ReimaginED2015
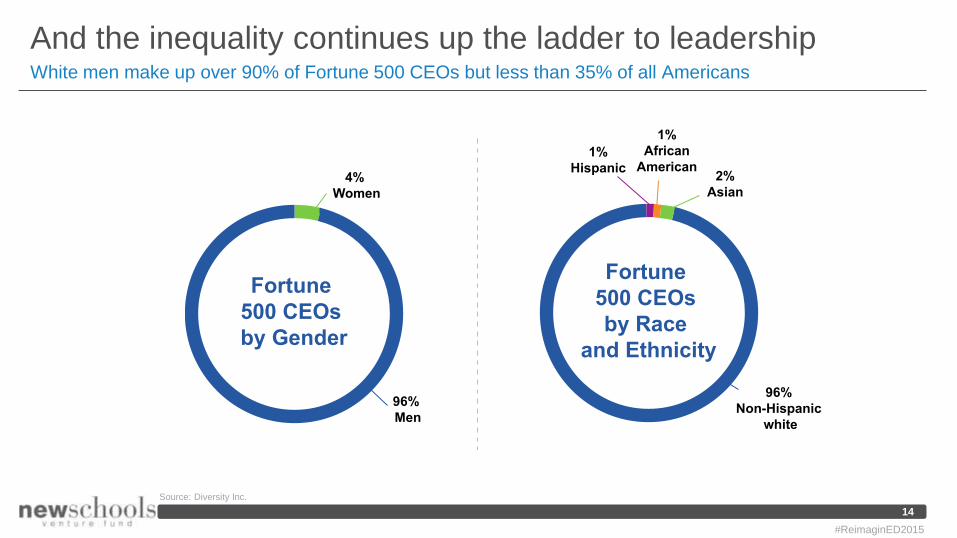
Fortune
500 CEOs
by Gender
96%
Men
4%
Women
Fortune
500 CEOs
by Race
and Ethnicity
96%
Non-Hispanic
white
1%
Hispanic
1%
African
American2%
Asian
And the inequality continues up the ladder to leadershipWhite men make up over 90% of Fortune 500 CEOs but less than 35% of all Americans
14
Source: Diversity Inc.
#ReimaginED2015
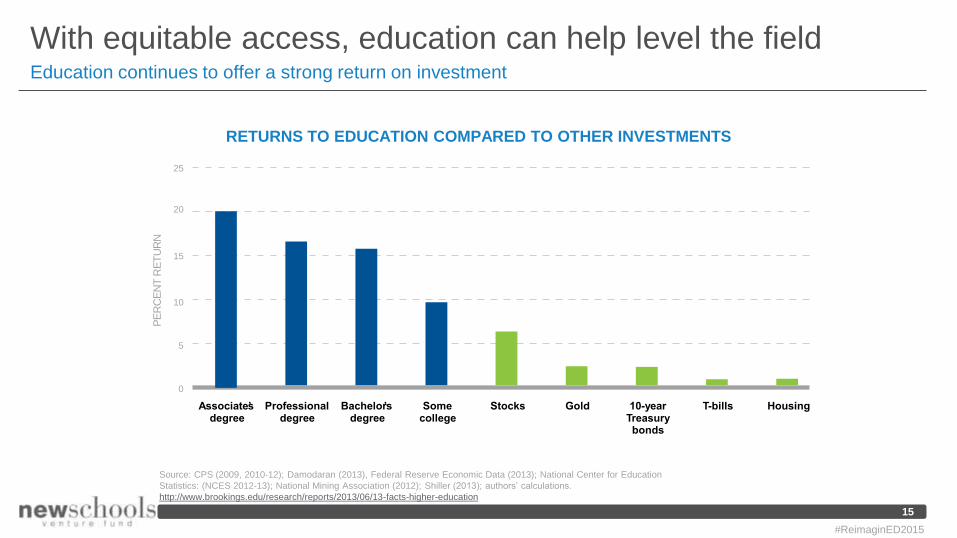
With equitable access, education can help level the fieldEducation continues to offer a strong return on investment
RETURNS TO EDUCATION COMPARED TO OTHER INVESTMENTS
15
Source: CPS (2009, 2010-12); Damodaran (2013), Federal Reserve Economic Data (2013); National Center for Education
Statistics: (NCES 2012-13); National Mining Association (2012); Shiller (2013); authors’ calculations.
http://www.brookings.edu/research/reports/2013/06/13-facts-higher-education
0
5
10
15
20
25
Associate’sdegree
Professional degree
Bachelor’sdegree
Somecollege
Stocks Gold 10-yearTreasurybonds
T-bills Housing
PE
RC
EN
TR
ET
UR
N
#ReimaginED2015
The evolving landscape
“School is where childhood happens. Even if civil war dates are forgotten and geometry
becomes a blur, one lesson must stick: the love of learning.”
LILY ESKELSON
NEA President
16
#ReimaginED2015
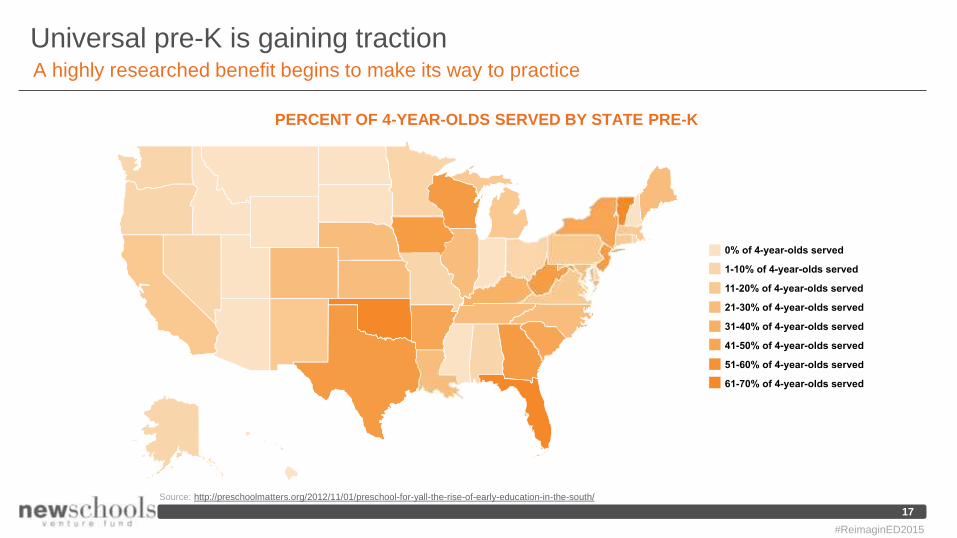
Universal pre-K is gaining tractionA highly researched benefit begins to make its way to practice
0% of 4-year-olds served
1-10% of 4-year-olds served
11-20% of 4-year-olds served
21-30% of 4-year-olds served
31-40% of 4-year-olds served
41-50% of 4-year-olds served
51-60% of 4-year-olds served
61-70% of 4-year-olds served
17
Source: http://preschoolmatters.org/2012/11/01/preschool-for-yall-the-rise-of-early-education-in-the-south/
#ReimaginED2015
PERCENT OF 4-YEAR-OLDS SERVED BY STATE PRE-K
Adopted
Not adopted
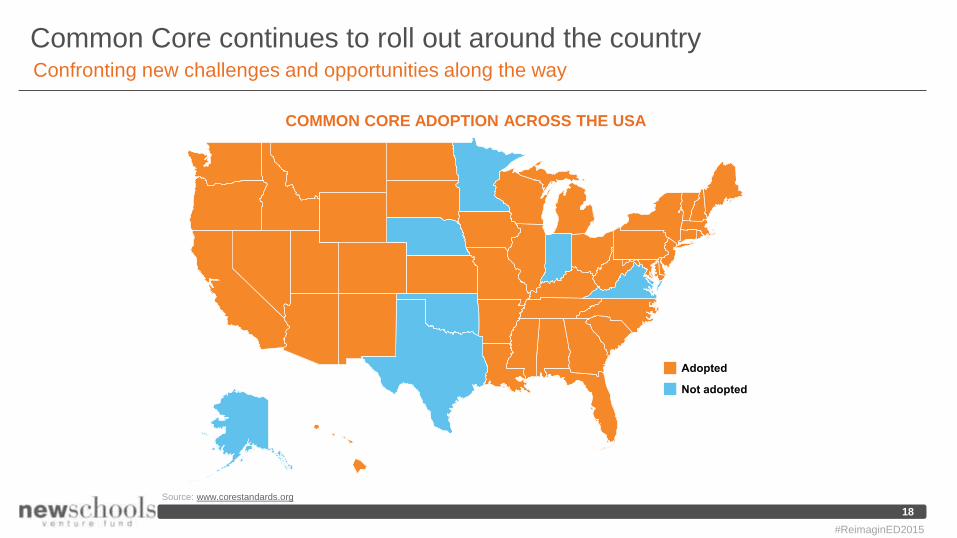
Common Core continues to roll out around the countryConfronting new challenges and opportunities along the way
COMMON CORE ADOPTION ACROSS THE USA
18
Source: www.corestandards.org
#ReimaginED2015
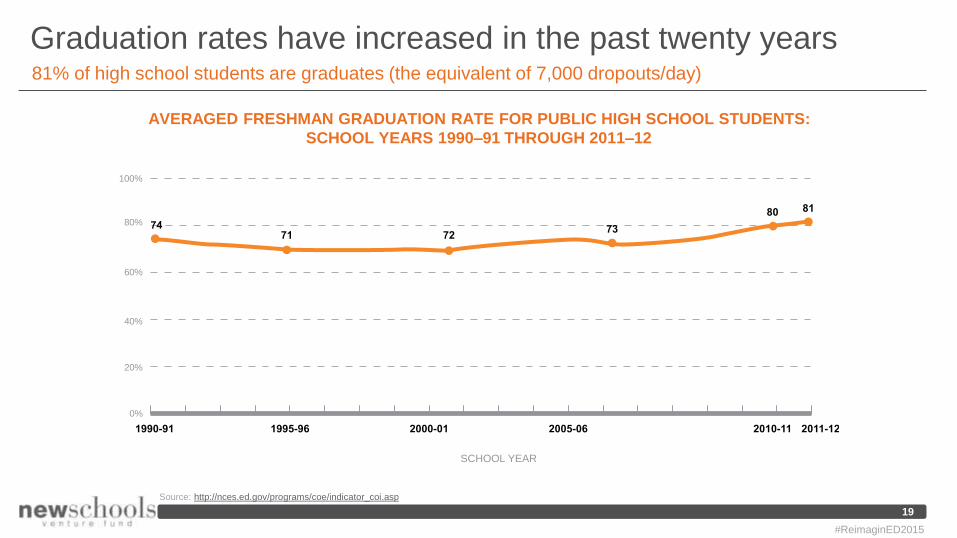
Graduation rates have increased in the past twenty years81% of high school students are graduates (the equivalent of 7,000 dropouts/day)
AVERAGED FRESHMAN GRADUATION RATE FOR PUBLIC HIGH SCHOOL STUDENTS:
SCHOOL YEARS 1990–91 THROUGH 2011–12
0%
20%
40%
60%
80%
100%
2011-121990-91
7471 72
73
80 81
1995-96 2000-01 2005-06 2010-11
SCHOOL YEAR
19
Source: http://nces.ed.gov/programs/coe/indicator_coi.asp
#ReimaginED2015
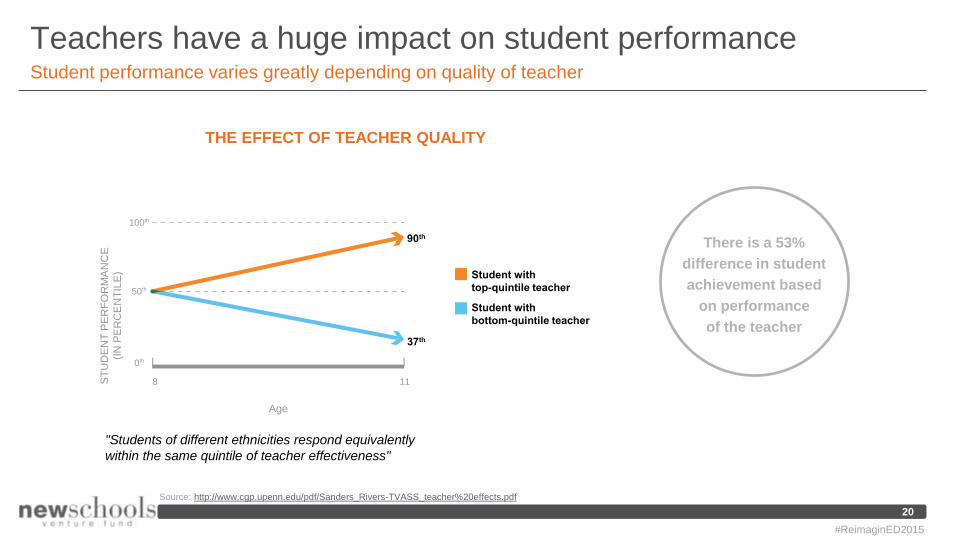
Teachers have a huge impact on student performanceStudent performance varies greatly depending on quality of teacher
20
Source: http://www.cgp.upenn.edu/pdf/Sanders_Rivers-TVASS_teacher%20effects.pdf
THE EFFECT OF TEACHER QUALITY
There is a 53%
difference in student
achievement based
on performance
of the teacher
100th
50th
0th
8 11
Age
ST
UD
EN
TP
ER
FO
RM
AN
CE
( IN
PE
RC
EN
TIL
E) Student with
top-quintile teacher
Student with
bottom-quintile teacher
90th
37th
#ReimaginED2015
"Students of different ethnicities respond equivalently
within the same quintile of teacher effectiveness"
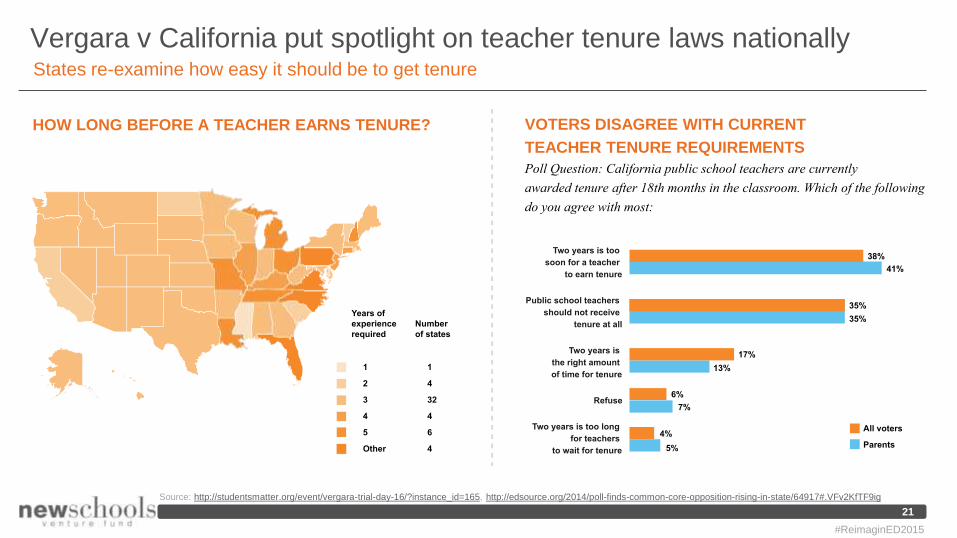
1
2
3
4
5
Other
1
4
32
4
6
4
Years of
experience
required
Number
of states
Two years is too
soon for a teacher
to earn tenure
Public school teachers
should not receive
tenure at all
Two years is
the right amount
of time for tenure
Refuse
Two years is too long
for teachers
to wait for tenure
38%
41%
35%
35%
17%
13%
6%
7%
4%
5%
All voters
Parents
VOTERS DISAGREE WITH CURRENT
TEACHER TENURE REQUIREMENTS
Poll Question: California public school teachers are currently
awarded tenure after 18th months in the classroom. Which of the following
do you agree with most:
Vergara v California put spotlight on teacher tenure laws nationallyStates re-examine how easy it should be to get tenure
HOW LONG BEFORE A TEACHER EARNS TENURE?
21
Source: http://studentsmatter.org/event/vergara-trial-day-16/?instance_id=165, http://edsource.org/2014/poll-finds-common-core-opposition-rising-in-state/64917#.VFv2KfTF9ig
#ReimaginED2015
Total working hours
Hours spent on teaching
Hours per week
United States
Chile
Alberta (Canada)
Brazil
Mexico
Abu Dhabi (UAE)
Estonia
Portugal
Finland
Slovak Republic
England (United Kingdom)
Croatia
Average
Latvia
Flanders (Belgium)
Iceland
Denmark
Korea
Spain
Poland
France
Australia
Bulgaria
Serbia
Israel
Czech Republic
Japan
Sweden
Italy
Singapore
0 10 20 30 40 50
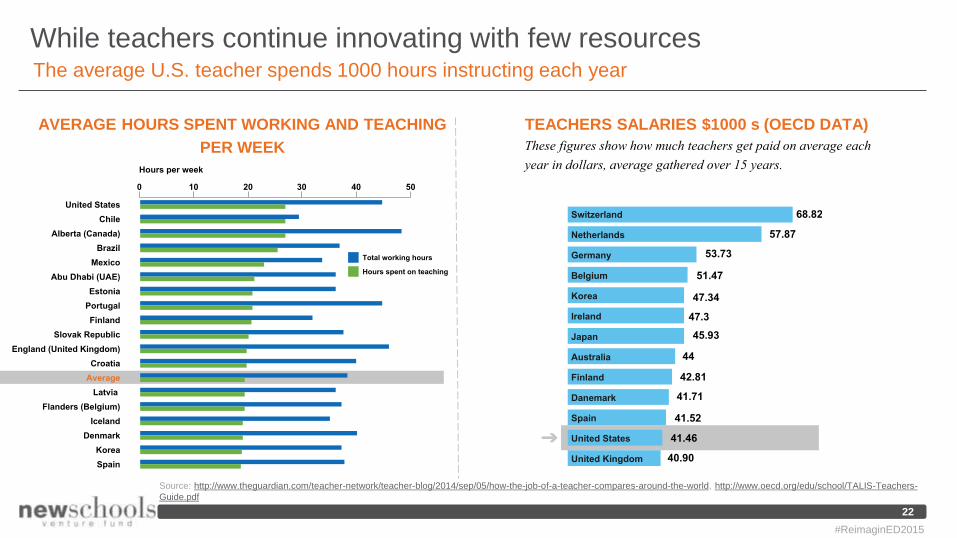
While teachers continue innovating with few resourcesThe average U.S. teacher spends 1000 hours instructing each year
TEACHERS SALARIES $1000 s (OECD DATA)
These figures show how much teachers get paid on average each
year in dollars, average gathered over 15 years.
AVERAGE HOURS SPENT WORKING AND TEACHING
PER WEEK
68.82
57.87
53.73
51.47
47.34
47.3
45.93
44
42.81
41.71
41.52
41.46
40.90
Switzerland
Netherlands
Germany
Belgium
Korea
Ireland
Japan
Australia
Finland
Danemark
Spain
United States
United Kingdom
Source: http://www.theguardian.com/teacher-network/teacher-blog/2014/sep/05/how-the-job-of-a-teacher-compares-around-the-world, http://www.oecd.org/edu/school/TALIS-Teachers-
Guide.pdf
22
#ReimaginED2015
Total working hours
Hours spent on teaching
Hours per week
United States
Chile
Alberta (Canada)
Brazil
Mexico
Abu Dhabi (UAE)
Estonia
Portugal
Finland
Slovak Republic
England (United Kingdom)
Croatia
Average
Latvia
Flanders (Belgium)
Iceland
Denmark
Korea
Spain
Poland
France
Australia
Bulgaria
Serbia
Israel
Czech Republic
Japan
Sweden
Italy
Singapore
0 10 20 30 40 50
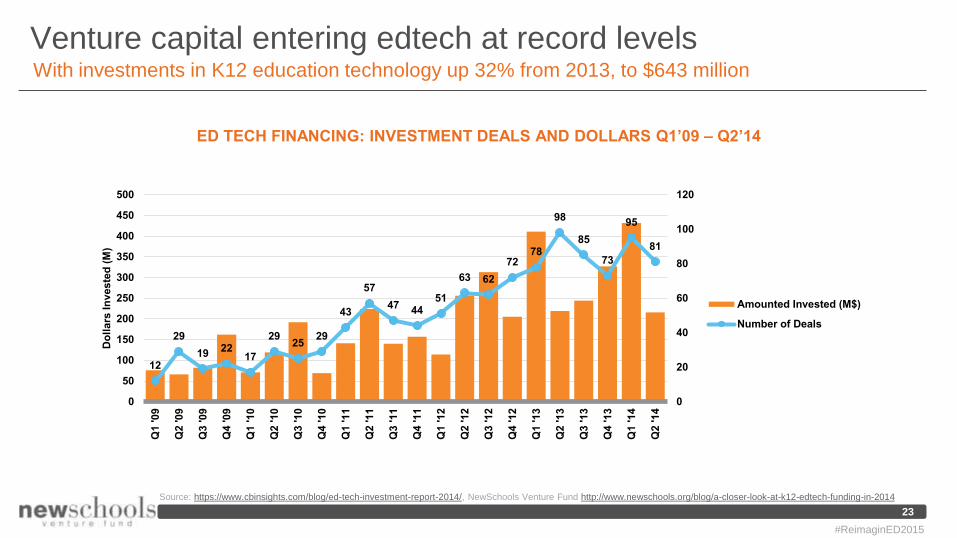
Venture capital entering edtech at record levelsWith investments in K12 education technology up 32% from 2013, to $643 million
ED TECH FINANCING: INVESTMENT DEALS AND DOLLARS Q1’09 – Q2’14
23
Source: https://www.cbinsights.com/blog/ed-tech-investment-report-2014/, NewSchools Venture Fund http://www.newschools.org/blog/a-closer-look-at-k12-edtech-funding-in-2014
12
29
1922
17
2925
29
43
57
4744
51
63 62
7278
98
85
73
95
81
0
20
40
60
80
100
120
0
50
100
150
200
250
300
350
400
450
500
Q1 '09
Q2 '09
Q3 '09
Q4 '09
Q1 '10
Q2 '10
Q3 '10
Q4 '10
Q1 '11
Q2 '11
Q3 '11
Q4 '11
Q1 '12
Q2 '12
Q3 '12
Q4 '12
Q1 '13
Q2 '13
Q3 '13
Q4 '13
Q1 '14
Q2 '14
Do
llars
In
veste
d (
M)
Amounted Invested (M$)
Number of Deals
#ReimaginED2015
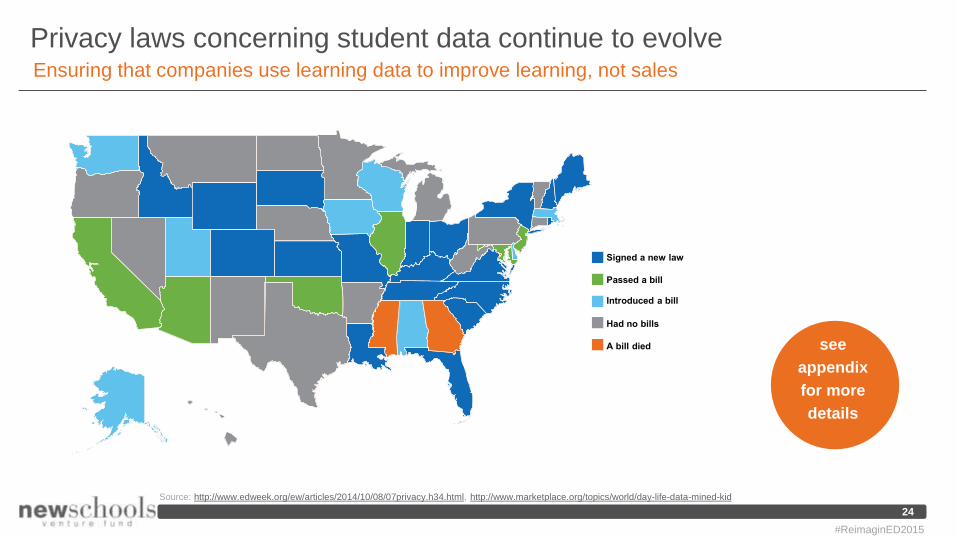
Signed a new law
Passed a bill
Introduced a bill
Had no bills
A bill died
Ensuring that companies use learning data to improve learning, not sales
Privacy laws concerning student data continue to evolve
see
appendix
for more
details
24
Source: http://www.edweek.org/ew/articles/2014/10/08/07privacy.h34.html, http://www.marketplace.org/topics/world/day-life-data-mined-kid
#ReimaginED2015
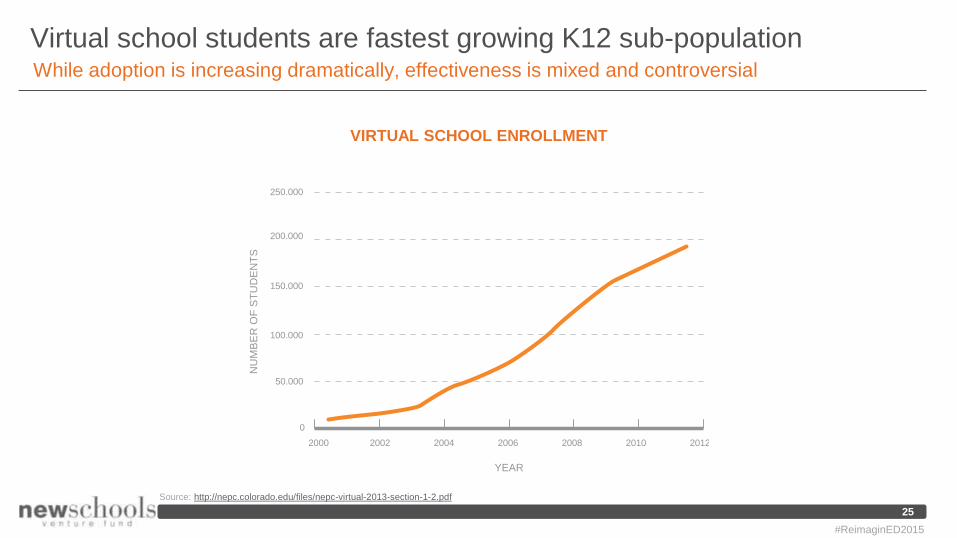
Virtual school students are fastest growing K12 sub-populationWhile adoption is increasing dramatically, effectiveness is mixed and controversial
VIRTUAL SCHOOL ENROLLMENT
0
2000 2002 2004 2006 2008 2010 2012
50.000
100.000
150.000
200.000
250.000
NU
MB
ER
OF
ST
UD
EN
TS
YEAR
25
Source: http://nepc.colorado.edu/files/nepc-virtual-2013-section-1-2.pdf
#ReimaginED2015
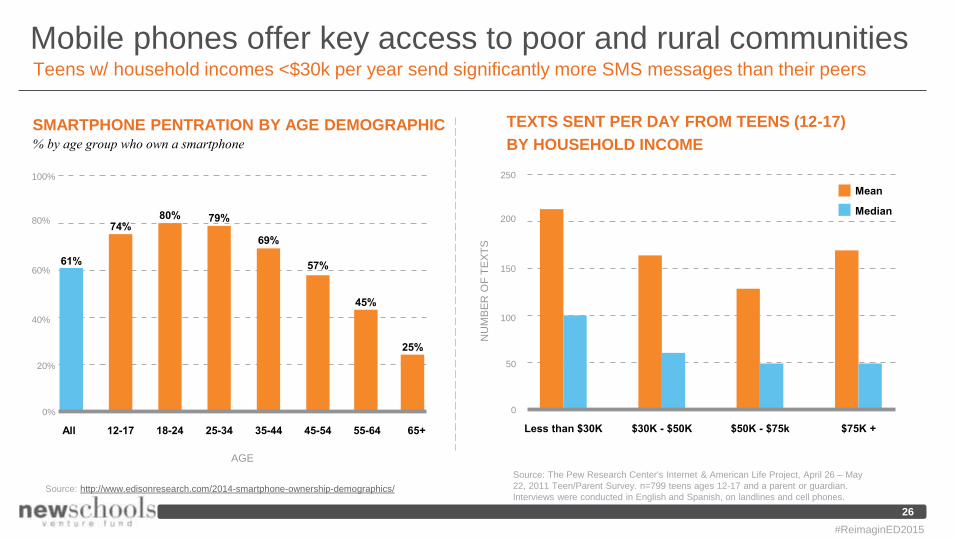
Source: The Pew Research Center's Internet & American Life Project, April 26 – May
22, 2011 Teen/Parent Survey. n=799 teens ages 12-17 and a parent or guardian.
Interviews were conducted in English and Spanish, on landlines and cell phones.
Mobile phones offer key access to poor and rural communitiesTeens w/ household incomes <$30k per year send significantly more SMS messages than their peers
TEXTS SENT PER DAY FROM TEENS (12-17)
BY HOUSEHOLD INCOME
SMARTPHONE PENTRATION BY AGE DEMOGRAPHIC% by age group who own a smartphone
26
Source: http://www.edisonresearch.com/2014-smartphone-ownership-demographics/
AGE
0%
20%
40%
60%
80%
100%
All
61%
74%80% 79%
69%
57%
45%
25%
12-17 18-24 25-34 35-44 45-54 55-64 65+
NU
MB
ER
OF
TE
XT
S
Mean
Median
0
50
100
150
200
250
Less than $30K $30K - $50K $50K - $75k $75K +
#ReimaginED2015
New Technologies and Approaches
“With the energy, creativity and money being invested recently in [education],
I am optimistic that this time will indeed be different”
UMANG GUPTA
Silicon Valley Technology
Entrepreneur, wrote Oracle’s first
business plan
27
#ReimaginED2015
Evolution of student and school data
28
#ReimaginED2015
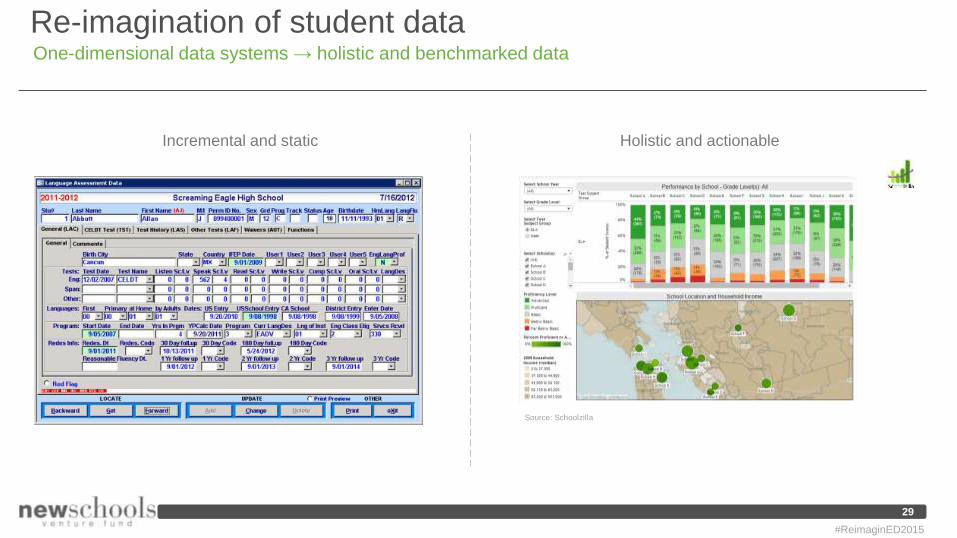
Re-imagination of student dataOne-dimensional data systems → holistic and benchmarked data
Incremental and static Holistic and actionable
Source: Schoolzilla
29
#ReimaginED2015
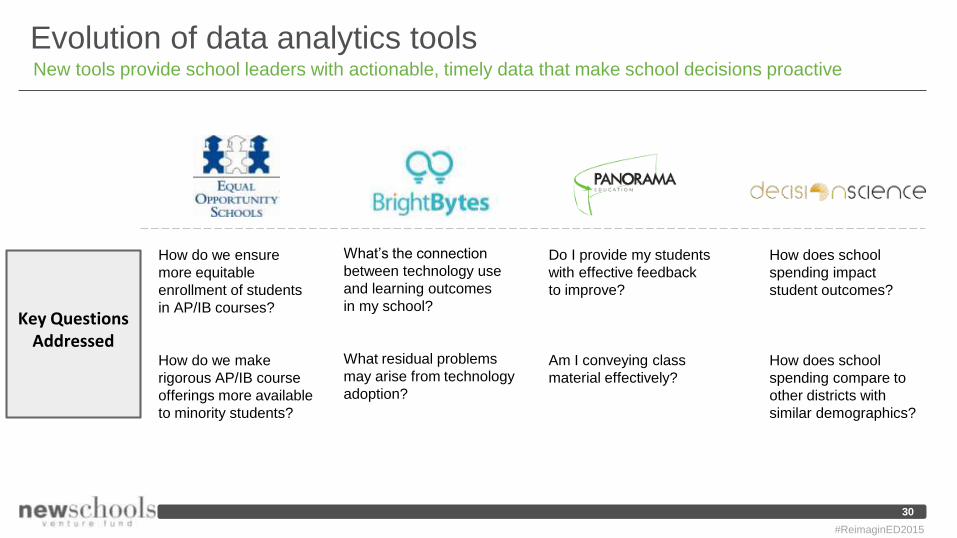
Evolution of data analytics toolsNew tools provide school leaders with actionable, timely data that make school decisions proactive
Key Questions Addressed
30
How do we ensure
more equitable
enrollment of students
in AP/IB courses?
How do we make
rigorous AP/IB course
offerings more available
to minority students?
What’s the connection
between technology use
and learning outcomes
in my school?
What residual problems
may arise from technology
adoption?
Do I provide my students
with effective feedback
to improve?
Am I conveying class
material effectively?
How does school
spending impact
student outcomes?
How does school
spending compare to
other districts with
similar demographics?
#ReimaginED2015
Evolution of assessments
31
#ReimaginED2015
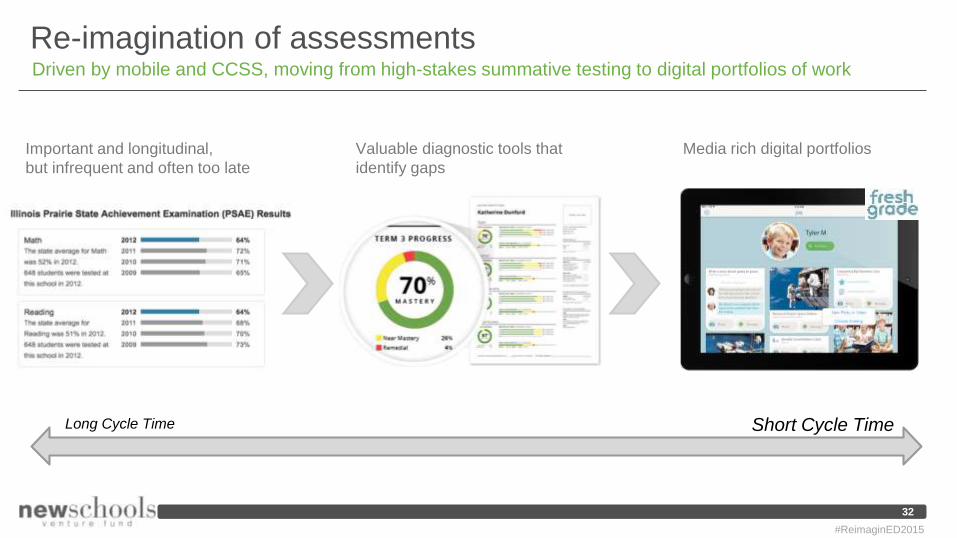
Re-imagination of assessmentsDriven by mobile and CCSS, moving from high-stakes summative testing to digital portfolios of work
Important and longitudinal,
but infrequent and often too late
Valuable diagnostic tools that
identify gaps
Media rich digital portfolios
Long Cycle Time Short Cycle Time
32
#ReimaginED2015
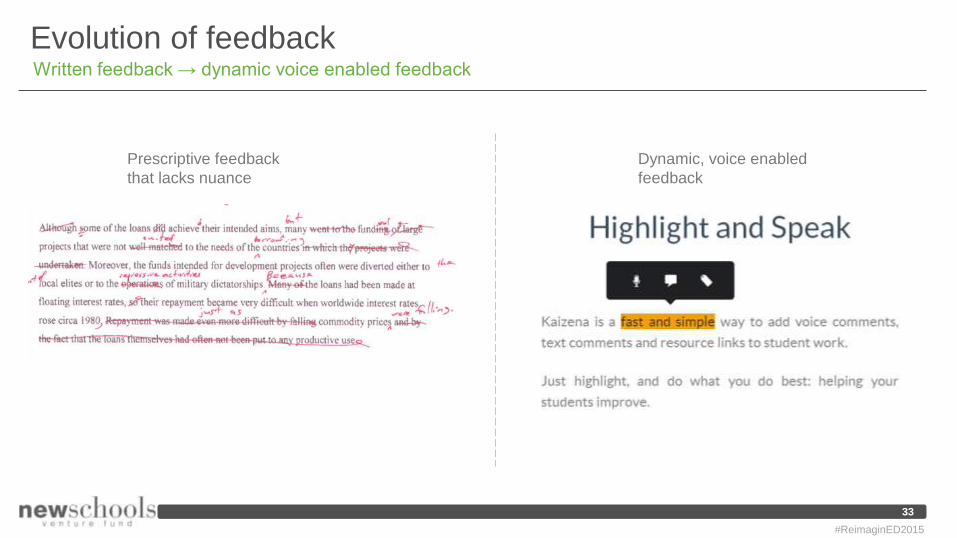
Evolution of feedbackWritten feedback → dynamic voice enabled feedback
Dynamic, voice enabled
feedback
Prescriptive feedback
that lacks nuance
33
#ReimaginED2015
Evolution of school-to-home communication
34
#ReimaginED2015
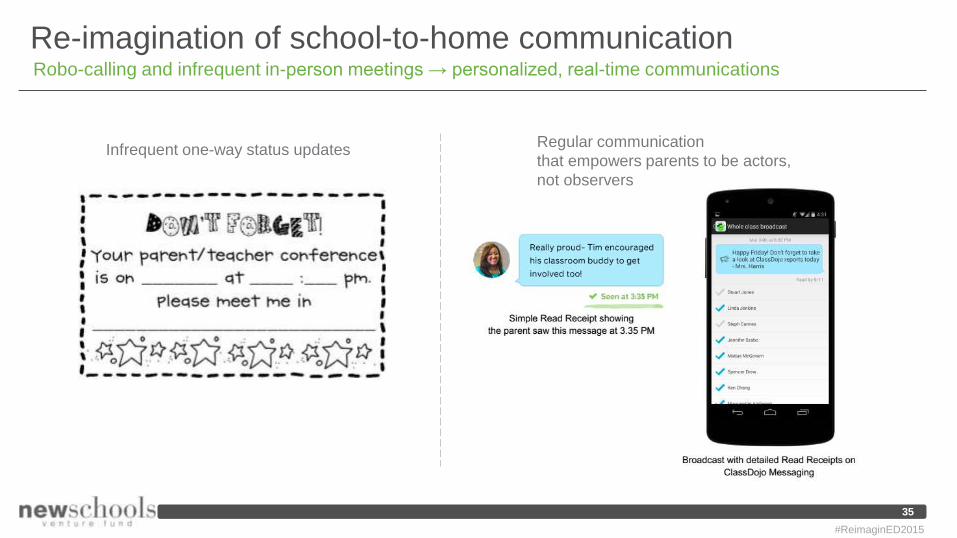
Re-imagination of school-to-home communicationRobo-calling and infrequent in-person meetings → personalized, real-time communications
Infrequent one-way status updatesRegular communication
that empowers parents to be actors,
not observers
35
#ReimaginED2015
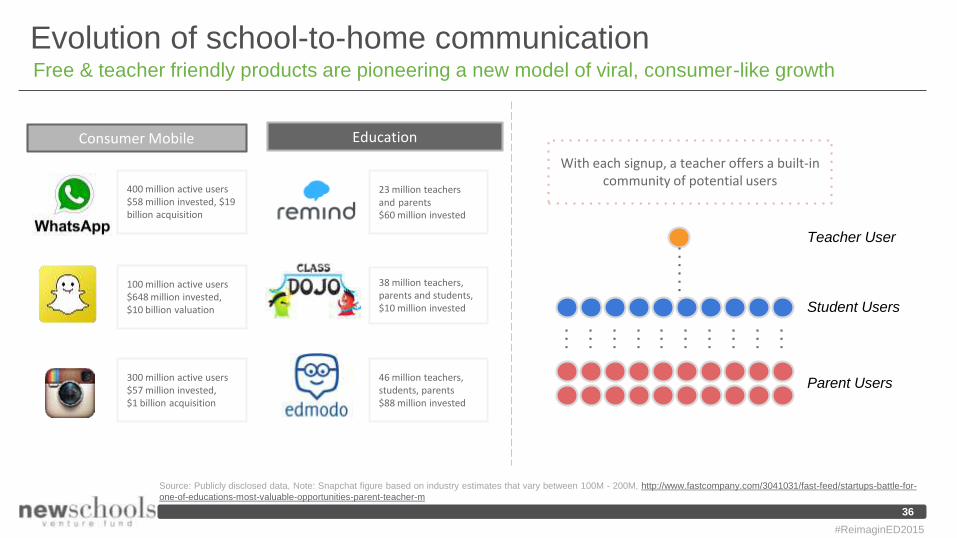
Evolution of school-to-home communicationFree & teacher friendly products are pioneering a new model of viral, consumer-like growth
23 million teachers and parents$60 million invested
Consumer Mobile
38 million teachers, parents and students, $10 million invested
46 million teachers, students, parents$88 million invested
400 million active users$58 million invested, $19 billion acquisition
100 million active users$648 million invested,$10 billion valuation
300 million active users$57 million invested, $1 billion acquisition
Teacher User
Student Users
Parent Users
Education
With each signup, a teacher offers a built-in community of potential users
36
Source: Publicly disclosed data, Note: Snapchat figure based on industry estimates that vary between 100M - 200M, http://www.fastcompany.com/3041031/fast-feed/startups-battle-for-
one-of-educations-most-valuable-opportunities-parent-teacher-m
#ReimaginED2015
Evolution of teacher professional development
37
#ReimaginED2015
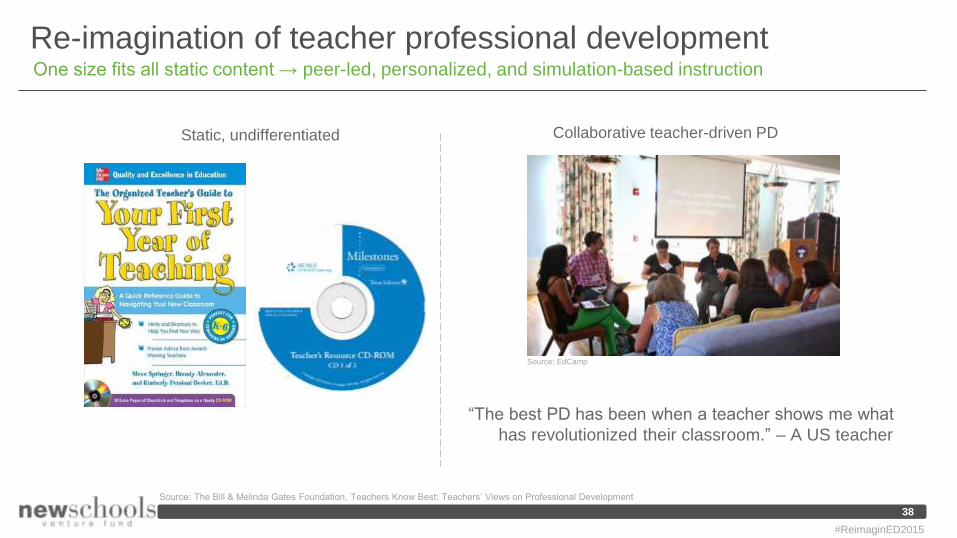
Re-imagination of teacher professional developmentOne size fits all static content → peer-led, personalized, and simulation-based instruction
Static, undifferentiated Collaborative teacher-driven PD
Source: EdCamp
“The best PD has been when a teacher shows me what
has revolutionized their classroom.” – A US teacher
38
Source: The Bill & Melinda Gates Foundation, Teachers Know Best: Teachers’ Views on Professional Development
#ReimaginED2015
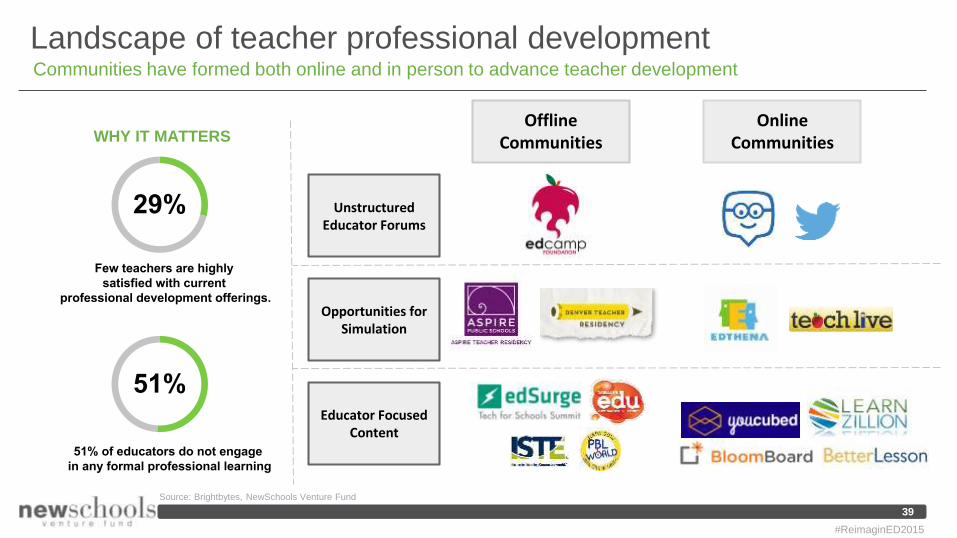
29%
51%
Few teachers are highly
satisfied with current
professional development offerings.
51% of educators do not engage
in any formal professional learning
Landscape of teacher professional developmentCommunities have formed both online and in person to advance teacher development
WHY IT MATTERSOffline
CommunitiesOnline
Communities
Educator Focused Content
Opportunities for Simulation
Unstructured Educator Forums
39
Source: Brightbytes, NewSchools Venture Fund
#ReimaginED2015
Emerging Evolutions
40
#ReimaginED2015
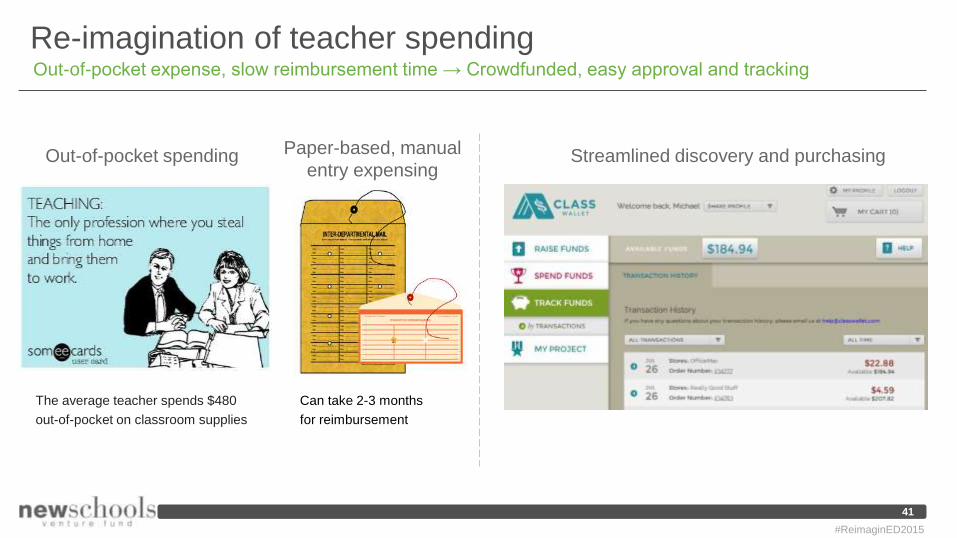
Re-imagination of teacher spendingOut-of-pocket expense, slow reimbursement time → Crowdfunded, easy approval and tracking
Paper-based, manual
entry expensingStreamlined discovery and purchasingOut-of-pocket spending
The average teacher spends $480
out-of-pocket on classroom supplies
Can take 2-3 months
for reimbursement
41
#ReimaginED2015
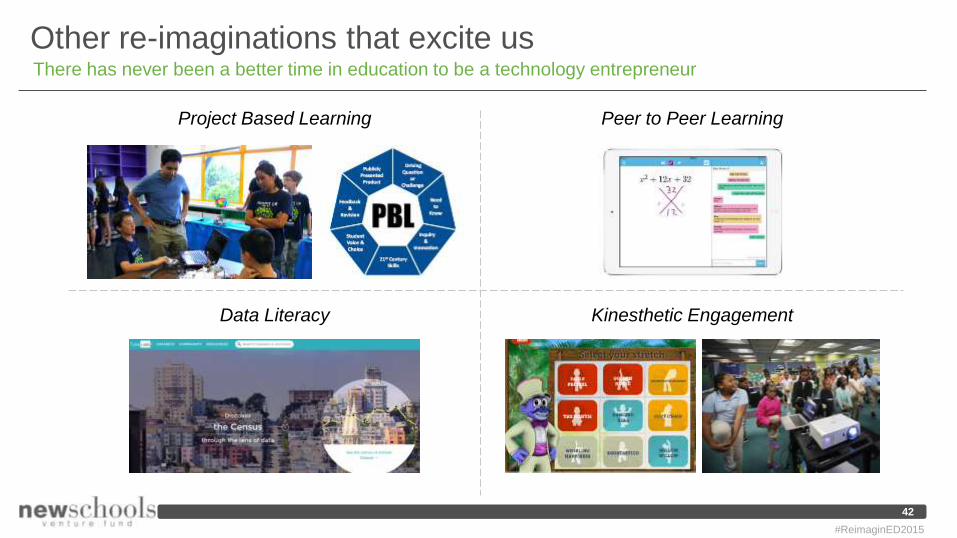
Other re-imaginations that excite usThere has never been a better time in education to be a technology entrepreneur
Project Based Learning Peer to Peer Learning
Data Literacy Kinesthetic Engagement
42
#ReimaginED2015
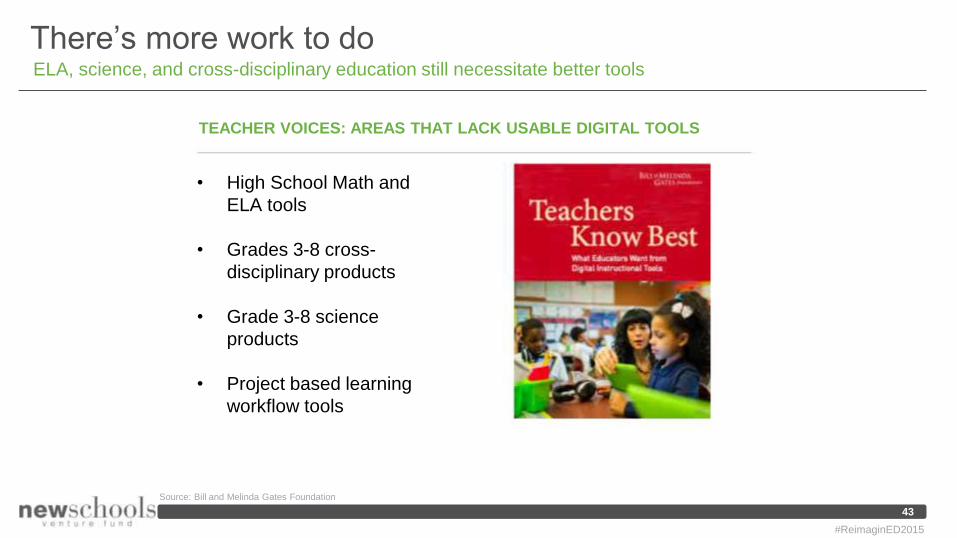
There’s more work to doELA, science, and cross-disciplinary education still necessitate better tools
43
TEACHER VOICES: AREAS THAT LACK USABLE DIGITAL TOOLS
• High School Math and
ELA tools
• Grades 3-8 cross-
disciplinary products
• Grade 3-8 science
products
• Project based learning
workflow tools
Source: Bill and Melinda Gates Foundation
#ReimaginED2015
So, you want to re-imagine education?
#ReimaginED2015
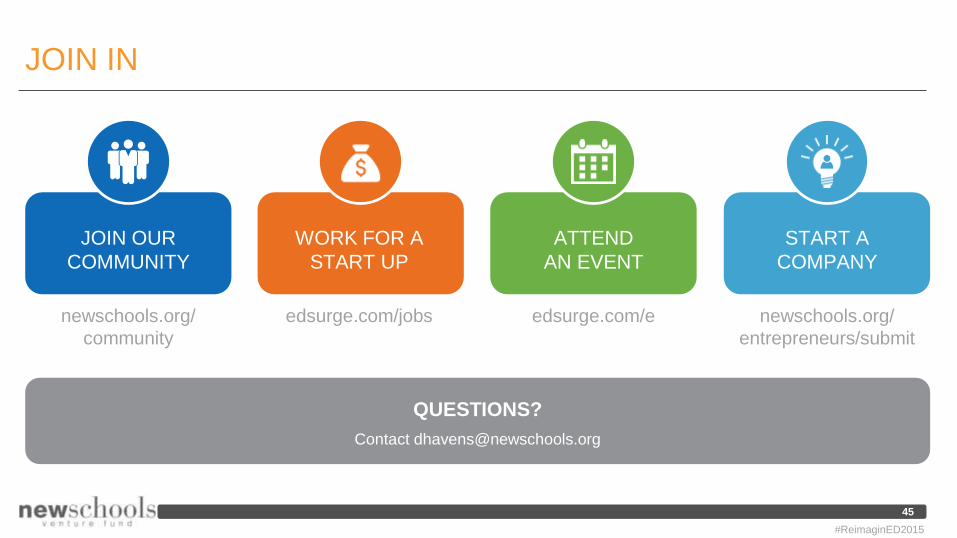
QUESTIONS?
Contact [email protected]
JOIN IN
45
#ReimaginED2015
JOIN OUR
COMMUNITY
WORK FOR A
START UP
ATTEND
AN EVENT
START A
COMPANY
newschools.org/
community
edsurge.com/jobs edsurge.com/e newschools.org/
entrepreneurs/submit
Appendix
#ReimaginED2015
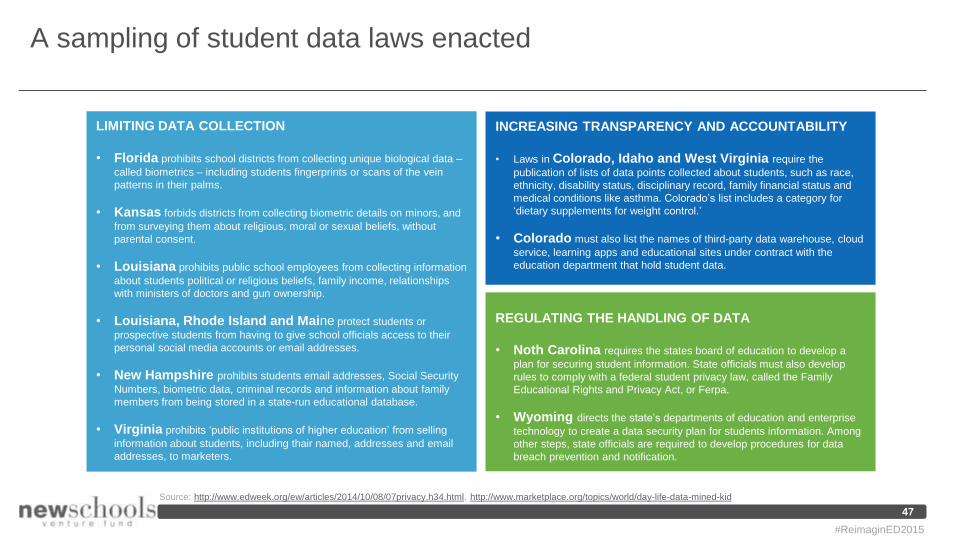
A sampling of student data laws enacted
LIMITING DATA COLLECTION
• Florida prohibits school districts from collecting unique biological data –
called biometrics – including students fingerprints or scans of the vein
patterns in their palms.
• Kansas forbids districts from collecting biometric details on minors, and
from surveying them about religious, moral or sexual beliefs, without
parental consent.
• Louisiana prohibits public school employees from collecting information
about students political or religious beliefs, family income, relationships
with ministers of doctors and gun ownership.
• Louisiana, Rhode Island and Maine protect students or
prospective students from having to give school officials access to their
personal social media accounts or email addresses.
• New Hampshire prohibits students email addresses, Social Security
Numbers, biometric data, criminal records and information about family
members from being stored in a state-run educational database.
• Virginia prohibits ‘public institutions of higher education’ from selling
information about students, including thair named, addresses and email
addresses, to marketers.
INCREASING TRANSPARENCY AND ACCOUNTABILITY
• Laws in Colorado, Idaho and West Virginia require the
publication of lists of data points collected about students, such as race,
ethnicity, disability status, disciplinary record, family financial status and
medical conditions like asthma. Colorado’s list includes a category for
‘dietary supplements for weight control.’
• Colorado must also list the names of third-party data warehouse, cloud
service, learning apps and educational sites under contract with the
education department that hold student data.
REGULATING THE HANDLING OF DATA
• Noth Carolina requires the states board of education to develop a
plan for securing student information. State officials must also develop
rules to comply with a federal student privacy law, called the Family
Educational Rights and Privacy Act, or Ferpa.
• Wyoming directs the state’s departments of education and enterprise
technology to create a data security plan for students information. Among
other steps, state officials are required to develop procedures for data
breach prevention and notification.
47
Source: http://www.edweek.org/ew/articles/2014/10/08/07privacy.h34.html, http://www.marketplace.org/topics/world/day-life-data-mined-kid
#ReimaginED2015
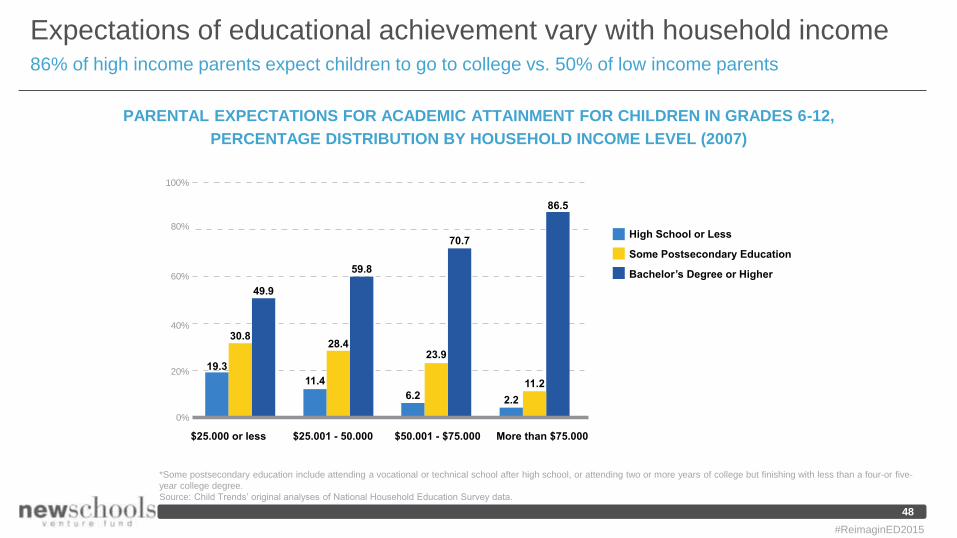
Expectations of educational achievement vary with household income86% of high income parents expect children to go to college vs. 50% of low income parents
PARENTAL EXPECTATIONS FOR ACADEMIC ATTAINMENT FOR CHILDREN IN GRADES 6-12,
PERCENTAGE DISTRIBUTION BY HOUSEHOLD INCOME LEVEL (2007)
High School or Less
Some Postsecondary Education
Bachelor’s Degree or Higher
0%
20%
40%
60%
80%
100%
$25.000 or less
19.3
11.4
28.4
59.8
6.2
23.9
70.7
2.2
11.2
86.5
30.8
49.9
$25.001 - 50.000 $50.001 - $75.000 More than $75.000
48
*Some postsecondary education include attending a vocational or technical school after high school, or attending two or more years of college but finishing with less than a four-or five-
year college degree.
Source: Child Trends’ original analyses of National Household Education Survey data.
#ReimaginED2015
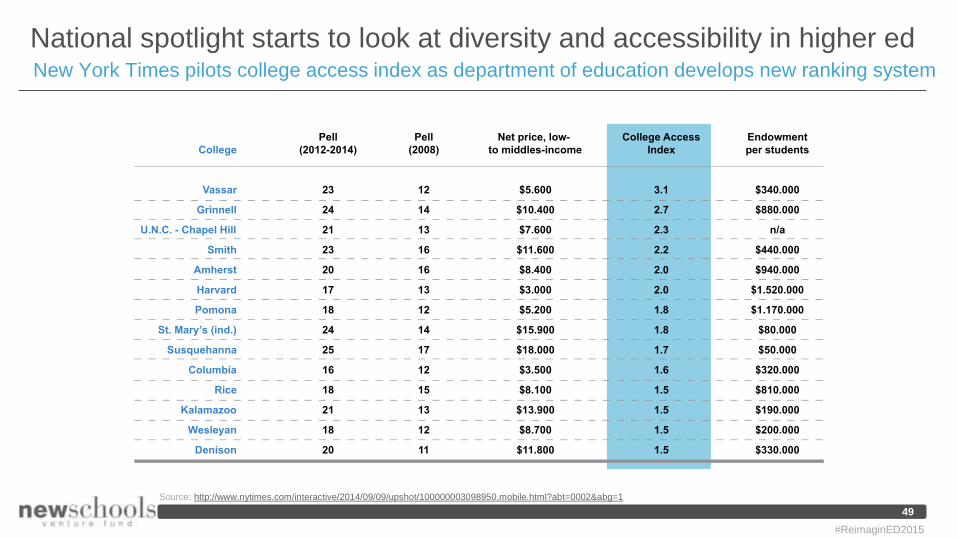
National spotlight starts to look at diversity and accessibility in higher edNew York Times pilots college access index as department of education develops new ranking system
College
Vassar
Grinnell
U.N.C. - Chapel Hill
Smith
Amherst
Harvard
Pomona
St. Mary’s (ind.)
Susquehanna
Columbia
Rice
Kalamazoo
Wesleyan
Denison
Pell
(2012-2014)
23
24
21
23
20
17
18
24
25
16
18
21
18
20
Pell
(2008)
12
14
13
16
16
13
12
14
17
12
15
13
12
11
Net price, low-
to middles-income
$5.600
$10.400
$7.600
$11.600
$8.400
$3.000
$5.200
$15.900
$18.000
$3.500
$8.100
$13.900
$8.700
$11.800
College Access
Index
3.1
2.7
2.3
2.2
2.0
2.0
1.8
1.8
1.7
1.6
1.5
1.5
1.5
1.5
Endowment
per students
$340.000
$880.000
n/a
$440.000
$940.000
$1.520.000
$1.170.000
$80.000
$50.000
$320.000
$810.000
$190.000
$200.000
$330.000
49
Source: http://www.nytimes.com/interactive/2014/09/09/upshot/100000003098950.mobile.html?abt=0002&abg=1
#ReimaginED2015
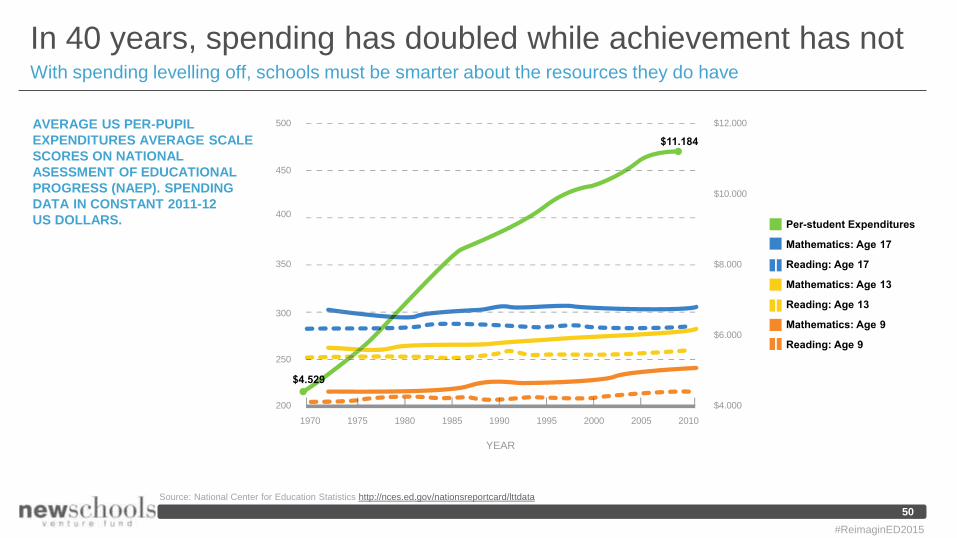
In 40 years, spending has doubled while achievement has notWith spending levelling off, schools must be smarter about the resources they do have
200
1970 1975 1980 1985 1990 1995 2000 2005 2010
250
300
350
400
450
500
$4.000
$6.000
$8.000
$10.000
$12.000
YEAR
Per-student Expenditures
Mathematics: Age 17
Reading: Age 17
Mathematics: Age 13
Reading: Age 13
Mathematics: Age 9
Reading: Age 9
$11.184
$4.529
AVERAGE US PER-PUPIL
EXPENDITURES AVERAGE SCALE
SCORES ON NATIONAL
ASESSMENT OF EDUCATIONAL
PROGRESS (NAEP). SPENDING
DATA IN CONSTANT 2011-12
US DOLLARS.
50
Source: National Center for Education Statistics http://nces.ed.gov/nationsreportcard/lttdata
#ReimaginED2015
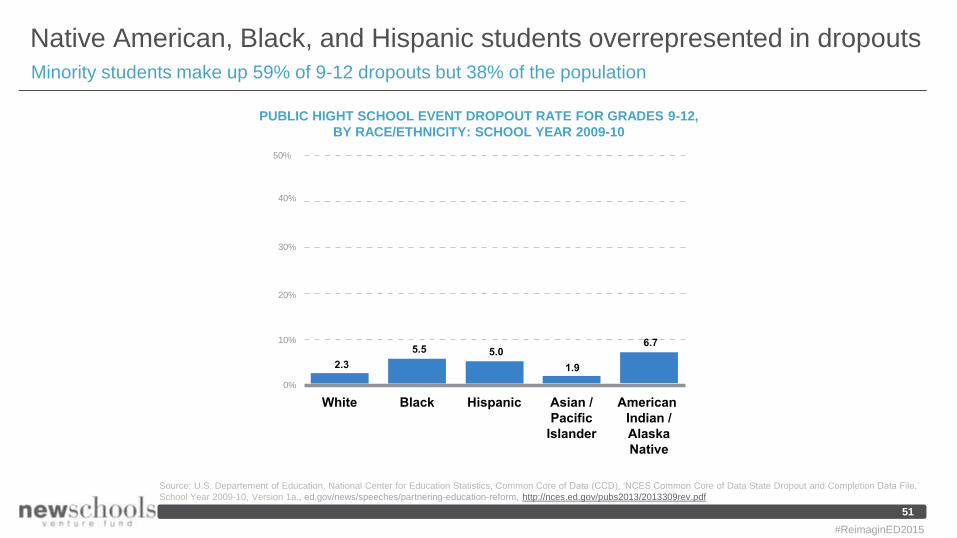
Native American, Black, and Hispanic students overrepresented in dropouts
Minority students make up 59% of 9-12 dropouts but 38% of the population
PUBLIC HIGHT SCHOOL EVENT DROPOUT RATE FOR GRADES 9-12,
BY RACE/ETHNICITY: SCHOOL YEAR 2009-10
0%
10%
20%
30%
40%
50%
White Black Hispanic Asian /
Pacific
Islander
American
Indian /
Alaska
Native
2.3
5.5 5.0
1.9
6.7
51
Source: U.S. Departement of Education, National Center for Education Statistics, Common Core of Data (CCD), ‘NCES Common Core of Data State Dropout and Completion Data File,’
School Year 2009-10, Version 1a., ed.gov/news/speeches/partnering-education-reform, http://nces.ed.gov/pubs2013/2013309rev.pdf
#ReimaginED2015