Embed Size (px)
Citation preview

Rose Wolterbeek, SNS, MANevada Department of AgricultureApril 1, 2015

• Local Sources-Student income
• State Sources-Grant funds
• Federal Sources-NSLP Reimbursement
• Miscellaneous Sources-PTA funds
• Fund Transfers-In-General Fund
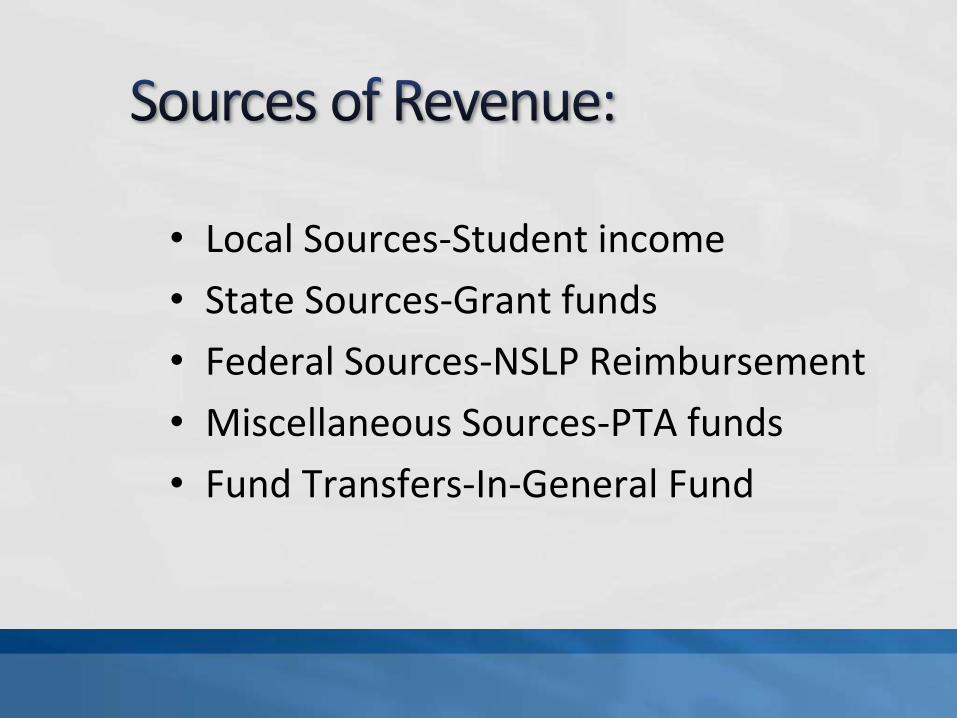
• Labor-Salary, Extra duty, OT pay
• Employee Benefit Load
• Purchased Foods including USDA Foods
• Supplies/disposables
• Contracted services: repairs, out of house contracts
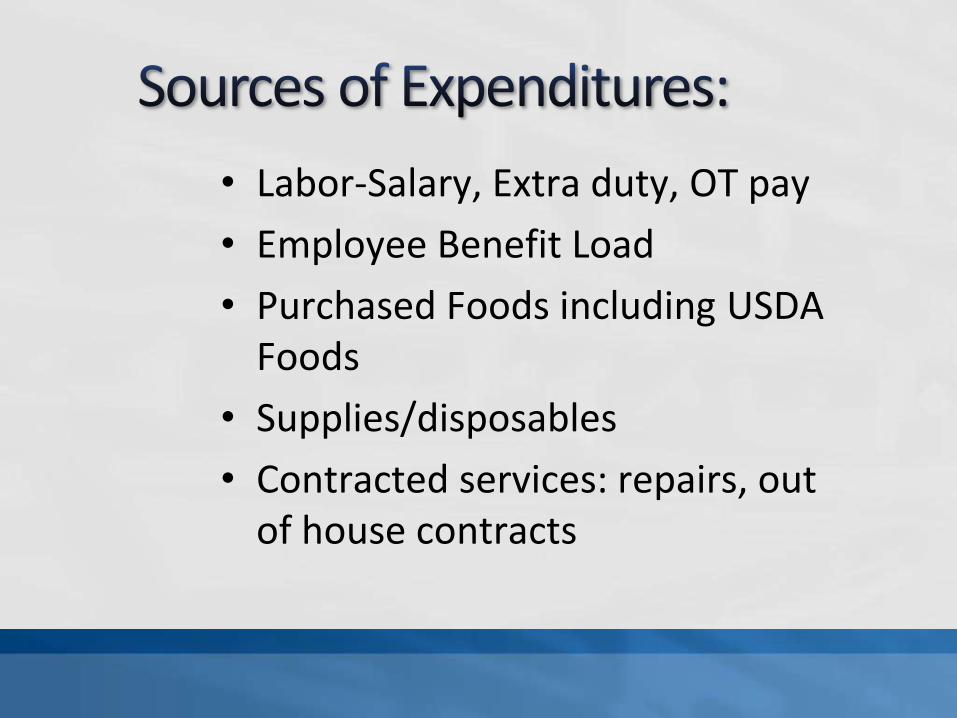
• Capital Assets-Equipment
• Travel/professional development
• Miscellaneous
• Indirect Costs-District Overhead charge
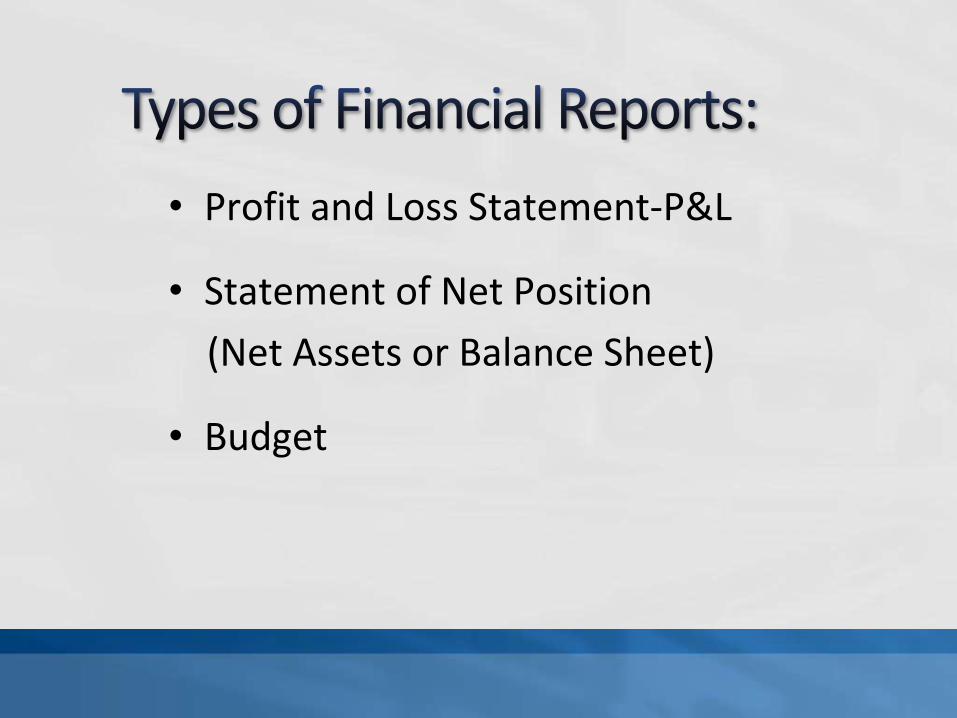
• Profit and Loss Statement-P&L
• Statement of Net Position
(Net Assets or Balance Sheet)
• Budget
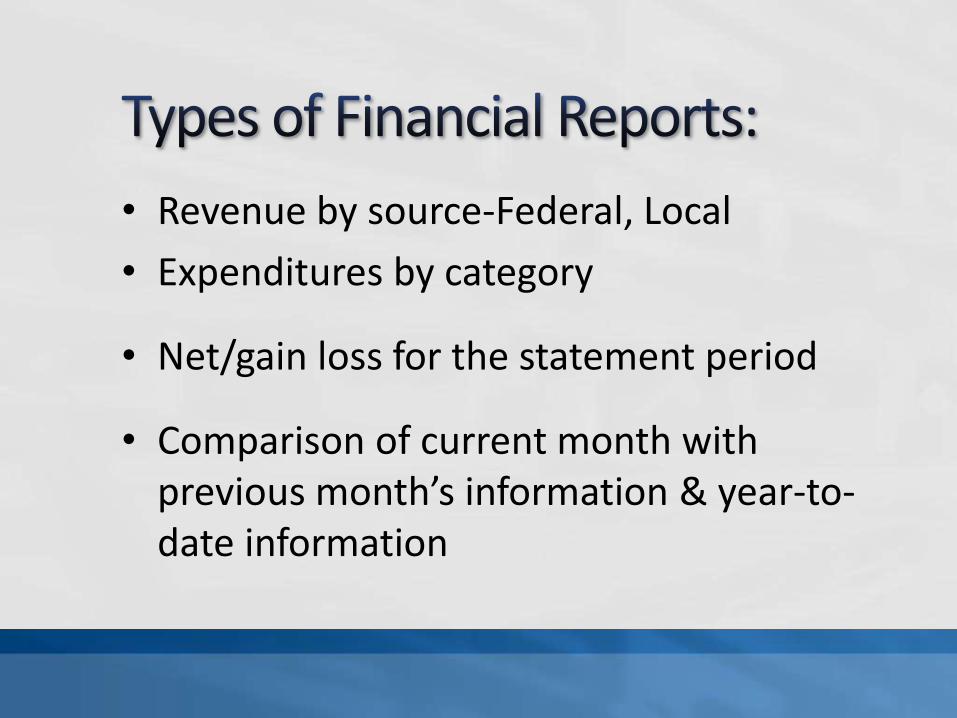
• Revenue by source-Federal, Local
• Expenditures by category
• Net/gain loss for the statement period
• Comparison of current month with previous month’s information & year-to-date information
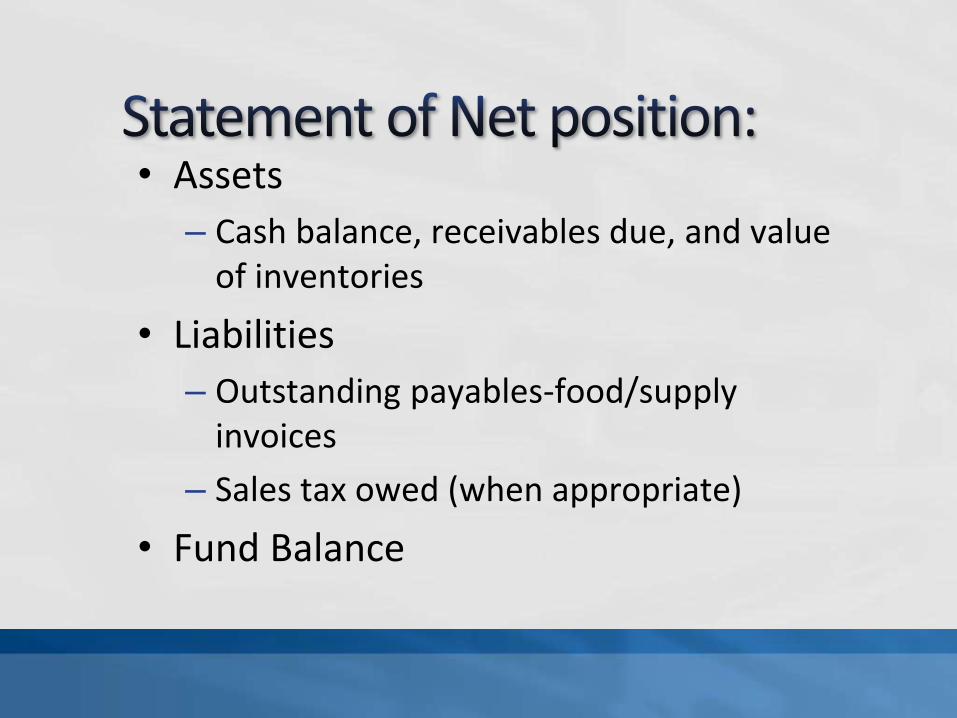
• Assets
– Cash balance, receivables due, and value of inventories
• Liabilities
– Outstanding payables-food/supplyinvoices
– Sales tax owed (when appropriate)
• Fund Balance
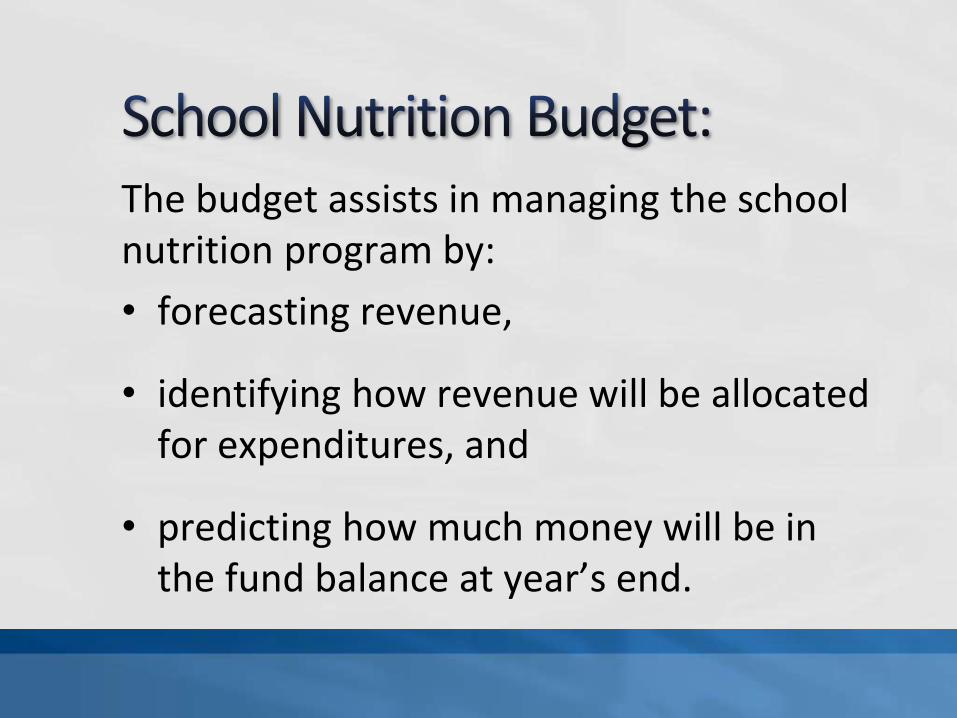
The budget assists in managing the school nutrition program by:
• forecasting revenue,
• identifying how revenue will be allocated for expenditures, and
• predicting how much money will be in the fund balance at year’s end.
By converting food sales to meal equivalents, the school nutrition director
• can determine
– meal cost,
– labor productivity ratios, and
– the average revenue earned per meal/meal equivalent.
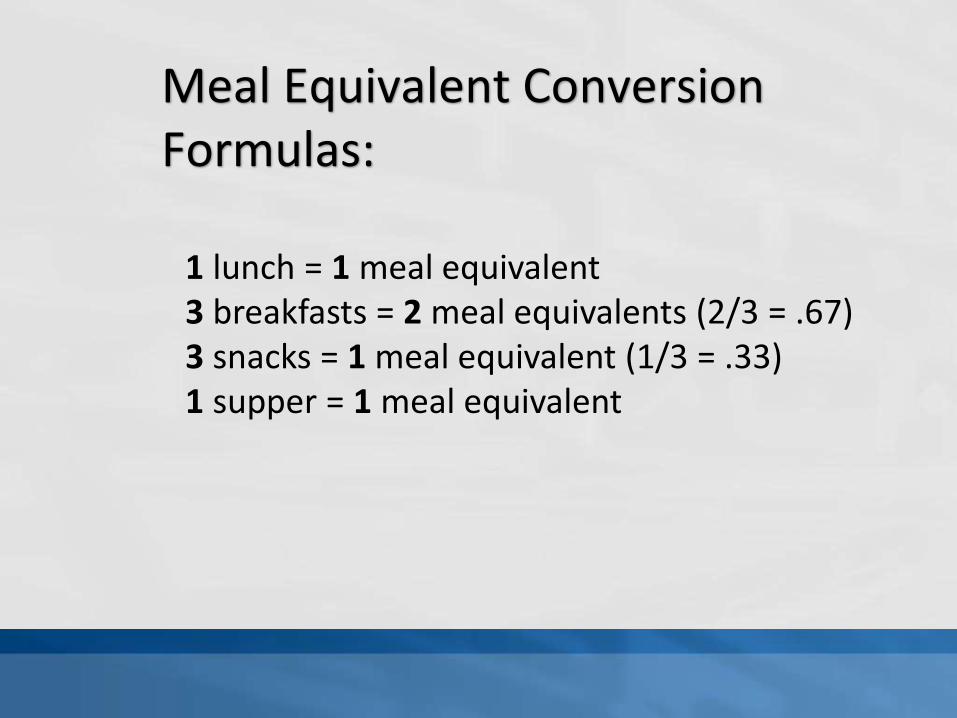
1 lunch = 1 meal equivalent3 breakfasts = 2 meal equivalents (2/3 = .67)3 snacks = 1 meal equivalent (1/3 = .33)1 supper = 1 meal equivalent
Meal Equivalent Conversion Formulas:
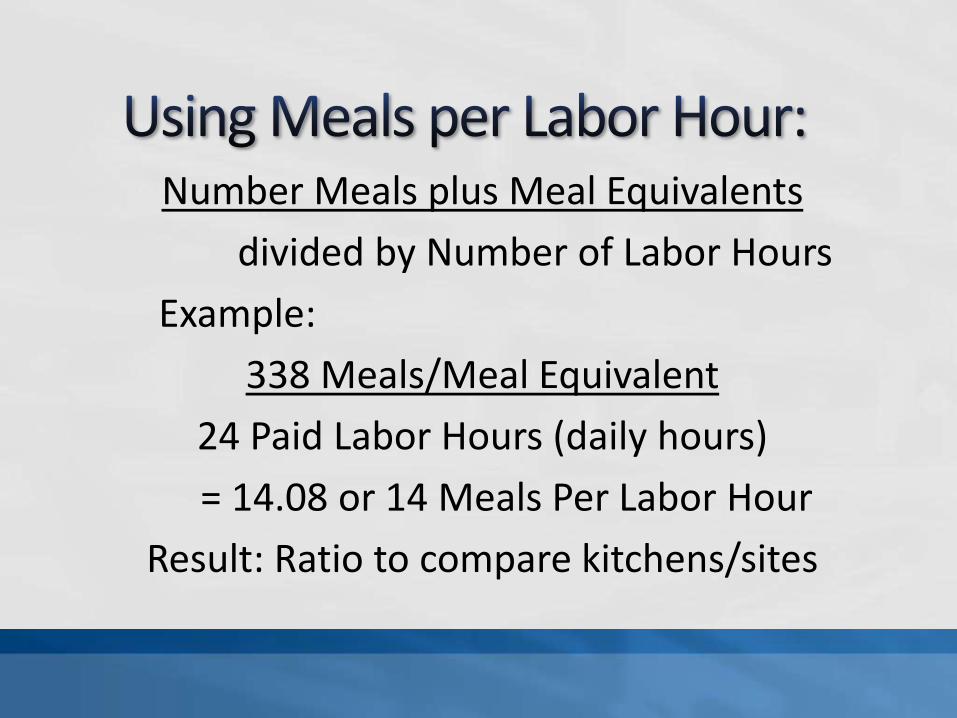
Number Meals plus Meal Equivalents
divided by Number of Labor Hours
Example:
338 Meals/Meal Equivalent
24 Paid Labor Hours (daily hours)
= 14.08 or 14 Meals Per Labor Hour
Result: Ratio to compare kitchens/sites
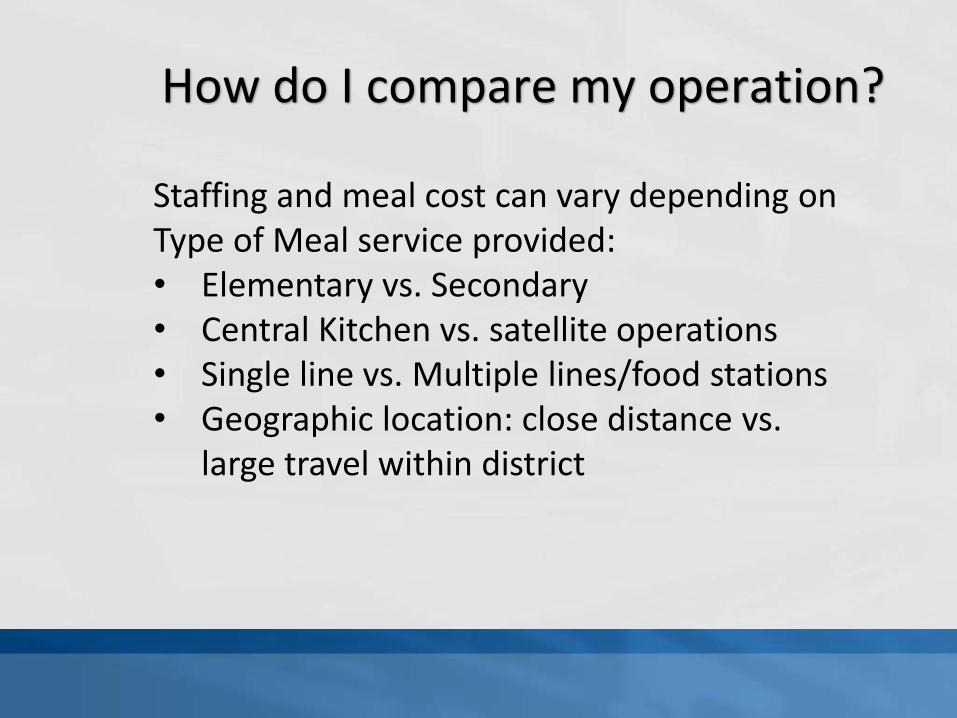
How do I compare my operation?
Staffing and meal cost can vary depending on Type of Meal service provided:• Elementary vs. Secondary• Central Kitchen vs. satellite operations• Single line vs. Multiple lines/food stations• Geographic location: close distance vs.
large travel within district
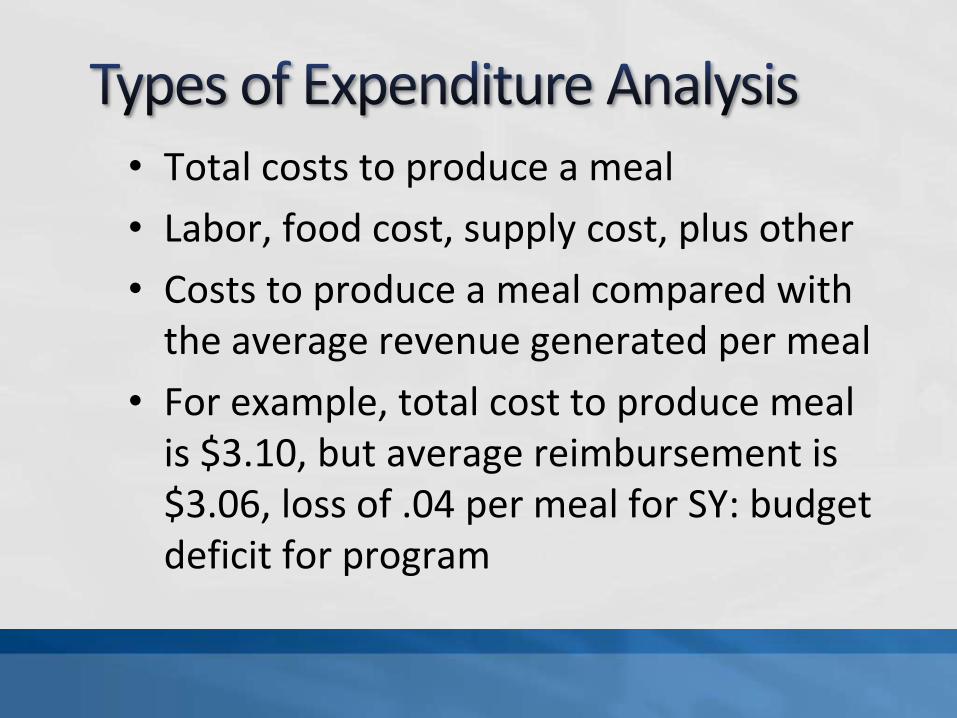
• Total costs to produce a meal
• Labor, food cost, supply cost, plus other
• Costs to produce a meal compared with the average revenue generated per meal
• For example, total cost to produce meal is $3.10, but average reimbursement is $3.06, loss of .04 per meal for SY: budget deficit for program
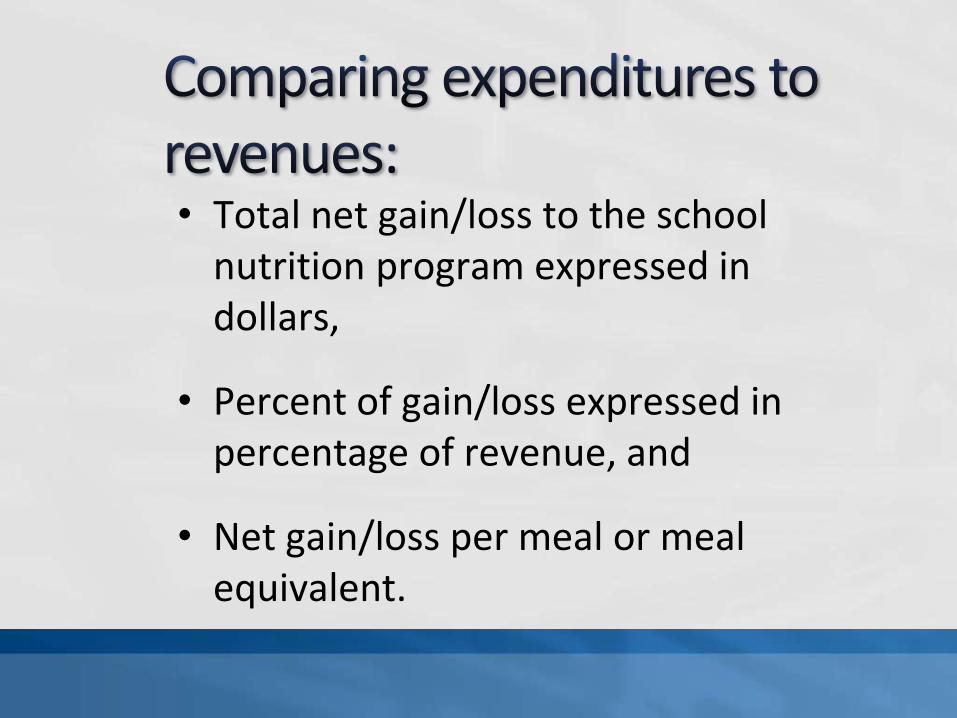
• Total net gain/loss to the school nutrition program expressed in dollars,
• Percent of gain/loss expressed in percentage of revenue, and
• Net gain/loss per meal or meal equivalent.
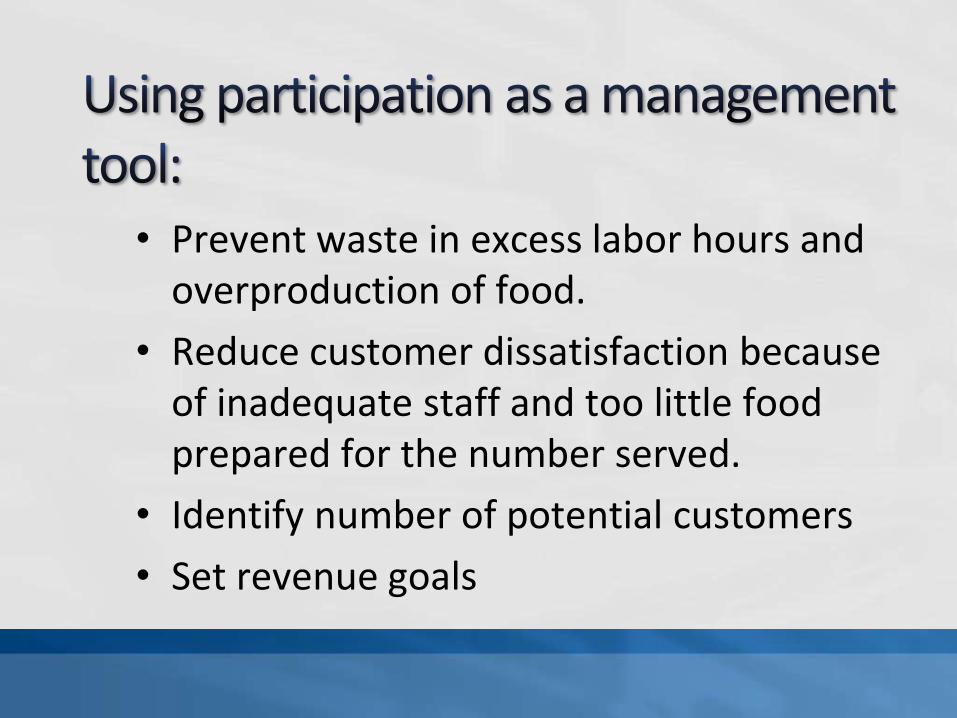
• Prevent waste in excess labor hours and overproduction of food.
• Reduce customer dissatisfaction because of inadequate staff and too little food prepared for the number served.
• Identify number of potential customers
• Set revenue goals
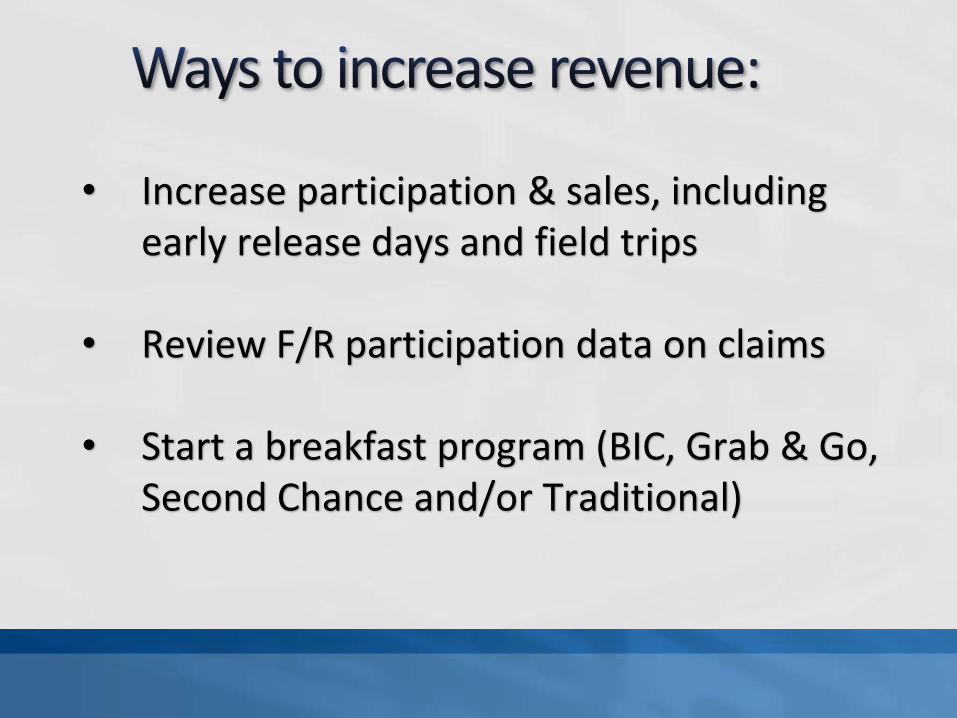
• Increase participation & sales, including early release days and field trips
• Review F/R participation data on claims
• Start a breakfast program (BIC, Grab & Go, Second Chance and/or Traditional)
• Start a catering program (staff in-services)
• Add contracted meals (preschools in area, & kindergarten classes)
• Look at pricing models & USDA tools
• Evaluate CEP option for your district/schools
• Look at food cost: portion control, analyze per meal cost data, inventory, ordering, preparing, USDA Food utilization, extras/condiments, involve all staff with process
• Look at labor cost: productivity by site/staffing levels, extra hours, overtime, non contract days, substitutes
• Early Release Days: look at staffing with all staff, especially substitute labor pool
• Consider Offer versus Serve meal concept: less food needed for reimbursable meal
• Other areas: look at “Charging Policy” and/or collection efforts, & staff meals
Nevada Department of Agriculture Food & Nutrition Divisionhttp://nutrition.nv.gov
NFSMI website www.nfsmi.org“Financial Management: A Course for School Nutrition Directors 2nd Edition”
Your District’s Business Manager/Finance Officer

Direct Certification
ReportingCatrina Peters MS, RD
School Nutrition Services Manager
Nevada Department of Agriculture
Food and Nutrition Division
What Are The Requirements?
Per Federal Regulations
NDA is required to provide notification on:
Districts with an Identified Student Percentage (percentage of Direct Certification matches) of at least 40% and >30% but <40%
Notification letters have been sent using Verification Summary Data as a proxy
School Districts are required to provide notification on:
School level data must be reported to the State Agency reflecting April 1st data to determine eligibility and participation in CEP
NDA is then required to publish a report with the ISP data for each school
How Will This Information Be Used?
Data submitted will be published on our website
Used to determine CEP Eligibility and if elected,
claiming percentages
HUGE national interest and support of expanded
CEP
Hunger advocates
Elected officials
Members of the Public
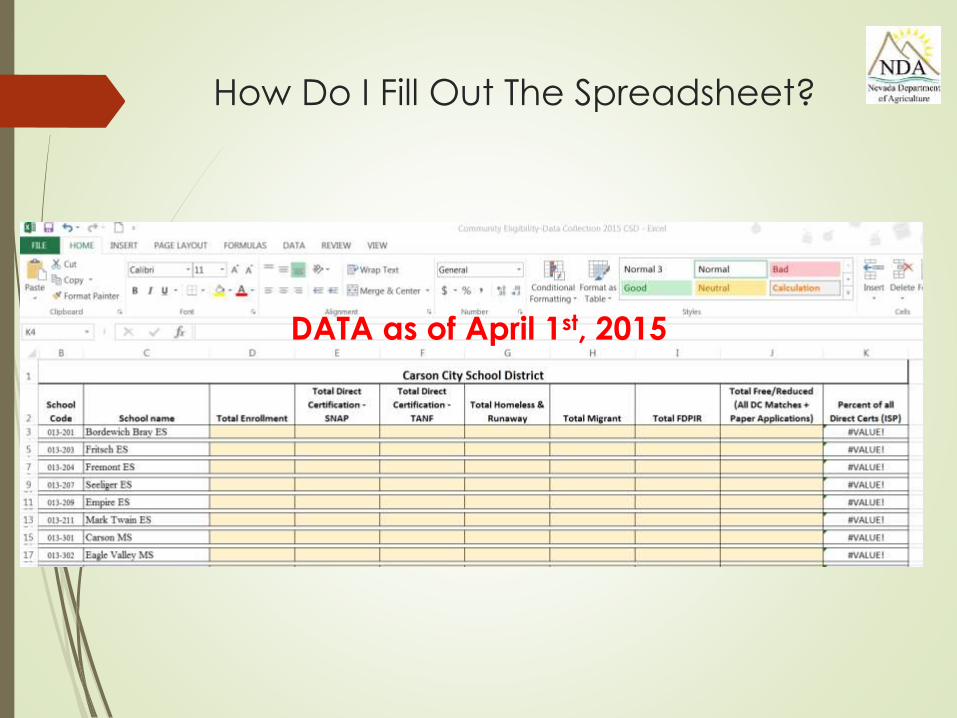
How Do I Fill Out The Spreadsheet?
DATA as of April 1st, 2015
When Is It Due?
Completed spreadsheets must be submitted COB April 10th, 2015
Send completed spreadsheets to Shawna Sabo ([email protected])
Will we have to complete this spreadsheet next year?
Yes, this reporting will be required annually for the foreseeable future
Deadline to adopt CEP for SY 15/16 was extended to August 31st,
2015
Memo NSLP 2015-44
Need a refresher on CEP?
https://www.youtube.com/watch?v=3SoiWxBmpEU&list=PLGdlCTs4dQTfYTLj7Vg9VXzDfmqApGipq&index=20

Contact Info
What if I need help?
Catrina Peters
775-353-3751
Rose Wolterbeek
775-353-3750
Shawna Sabo—Submit completed spreadsheets to Shawna by April 10th
775-353-3758