Embed Size (px)
Citation preview

VeLA: A Visual eLearning Analytics tool Juan Cruz-Benito Francisco J. García-Peñalvo GRIAL Research Group Departament of Computers and Automatics University of Salamanca [email protected] / @_juancb [email protected] / @frangp
LASI 2015 Bilbao: Learning Analytics Summer Institute Bilbao, Spain, June 22nd and 23rd
Outline
1. Introduction
2. VeLA foundations
3. Video demo
4. Conclusions
5. References
VeLA: A Visual eLearning Analytics tool. Learning Analytics Summer Institute (LASI). Bilbao 2015 2
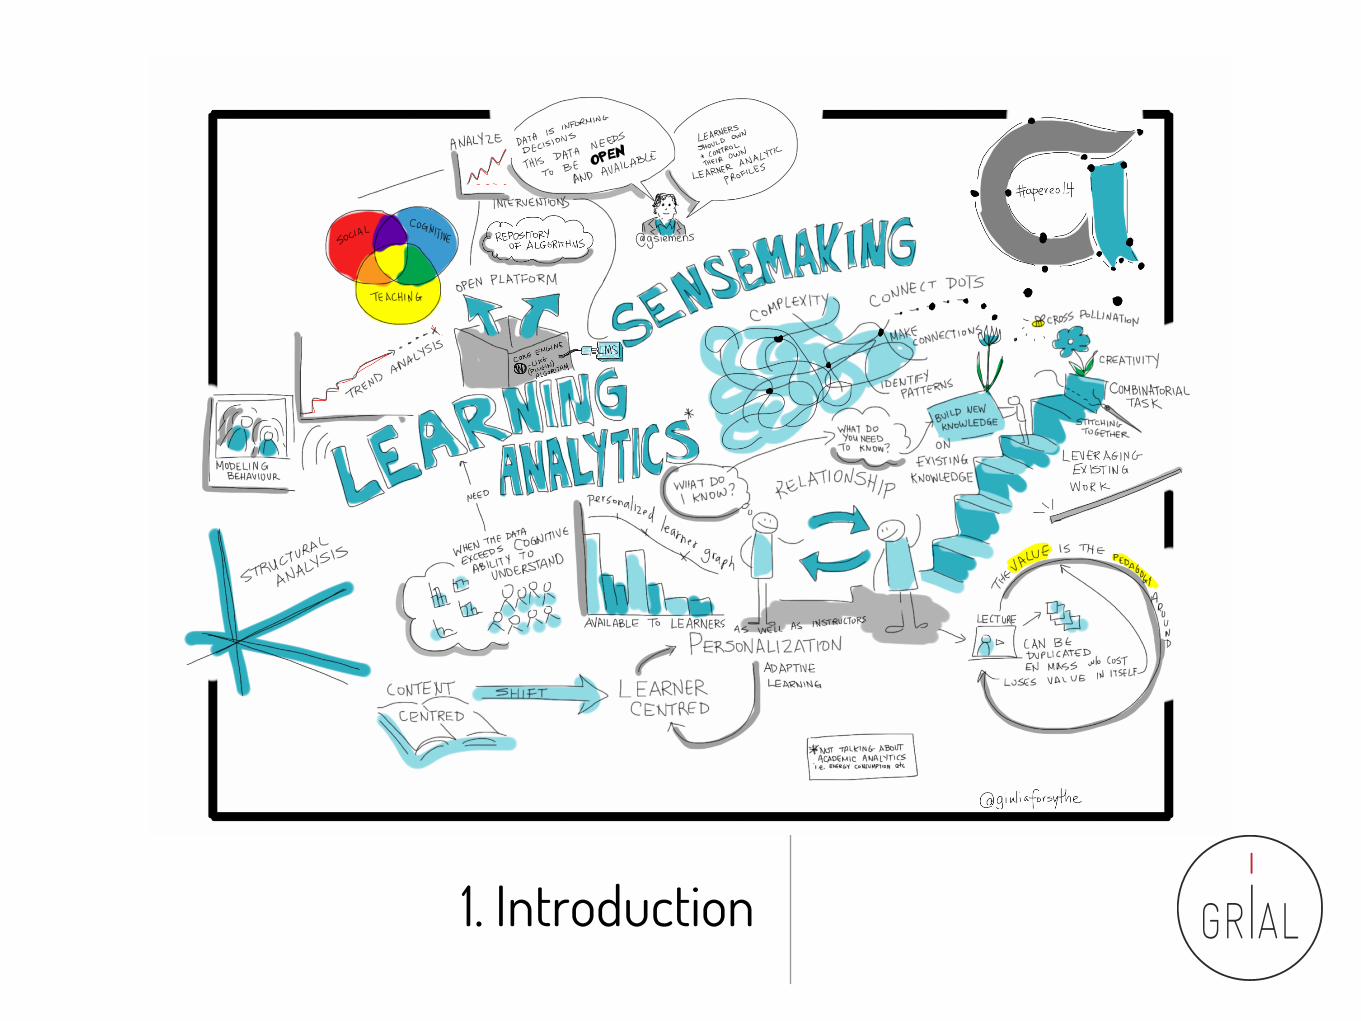
1. Introduction
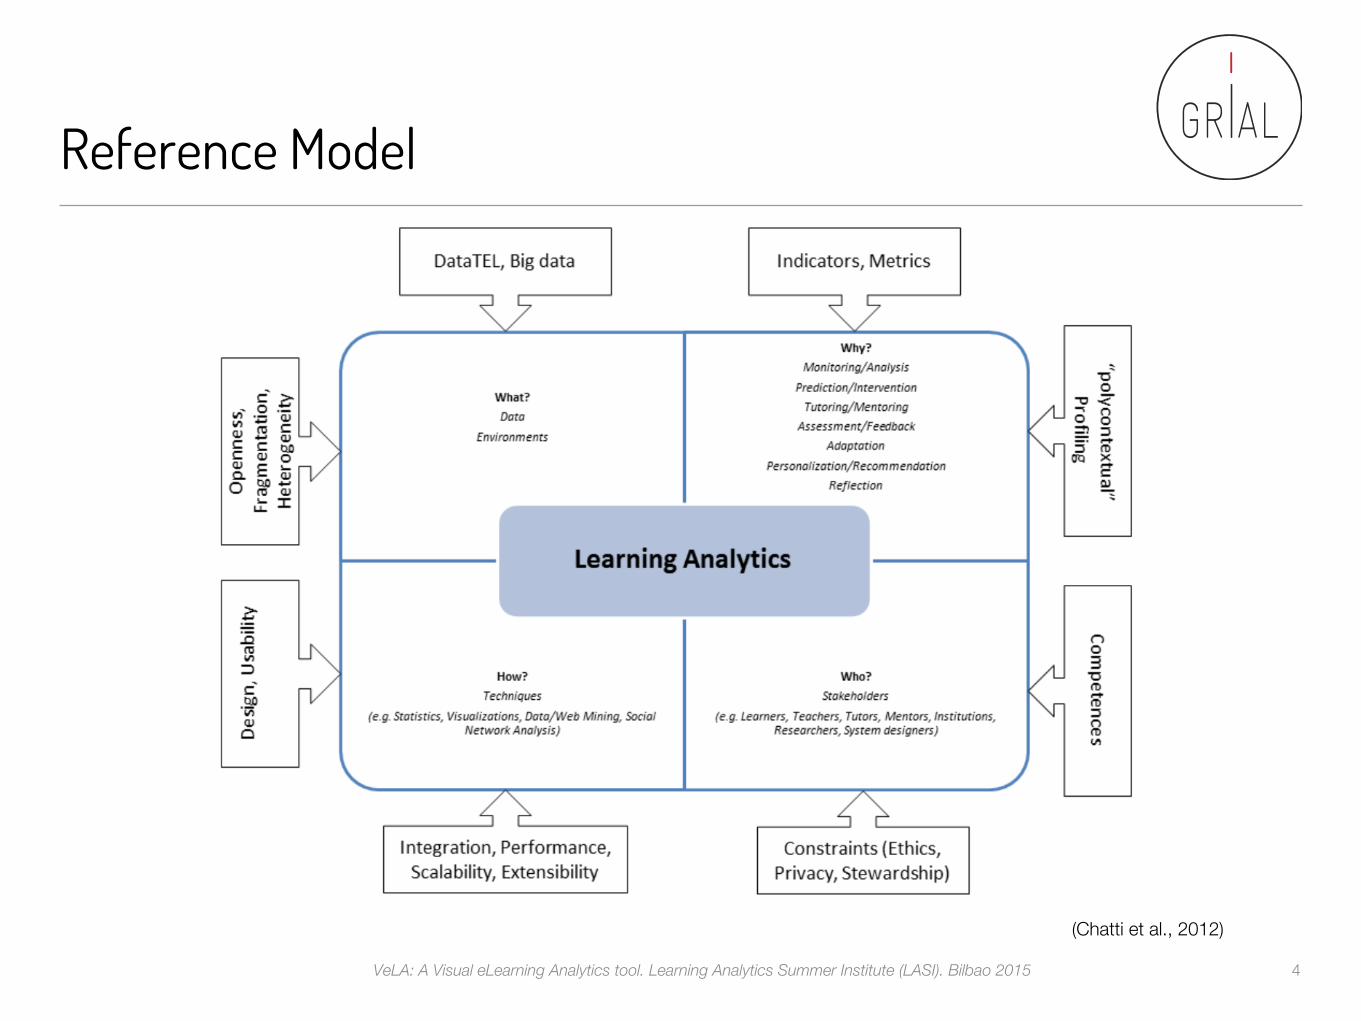
Reference Model
(Chatti et al., 2012)
VeLA: A Visual eLearning Analytics tool. Learning Analytics Summer Institute (LASI). Bilbao 2015 4
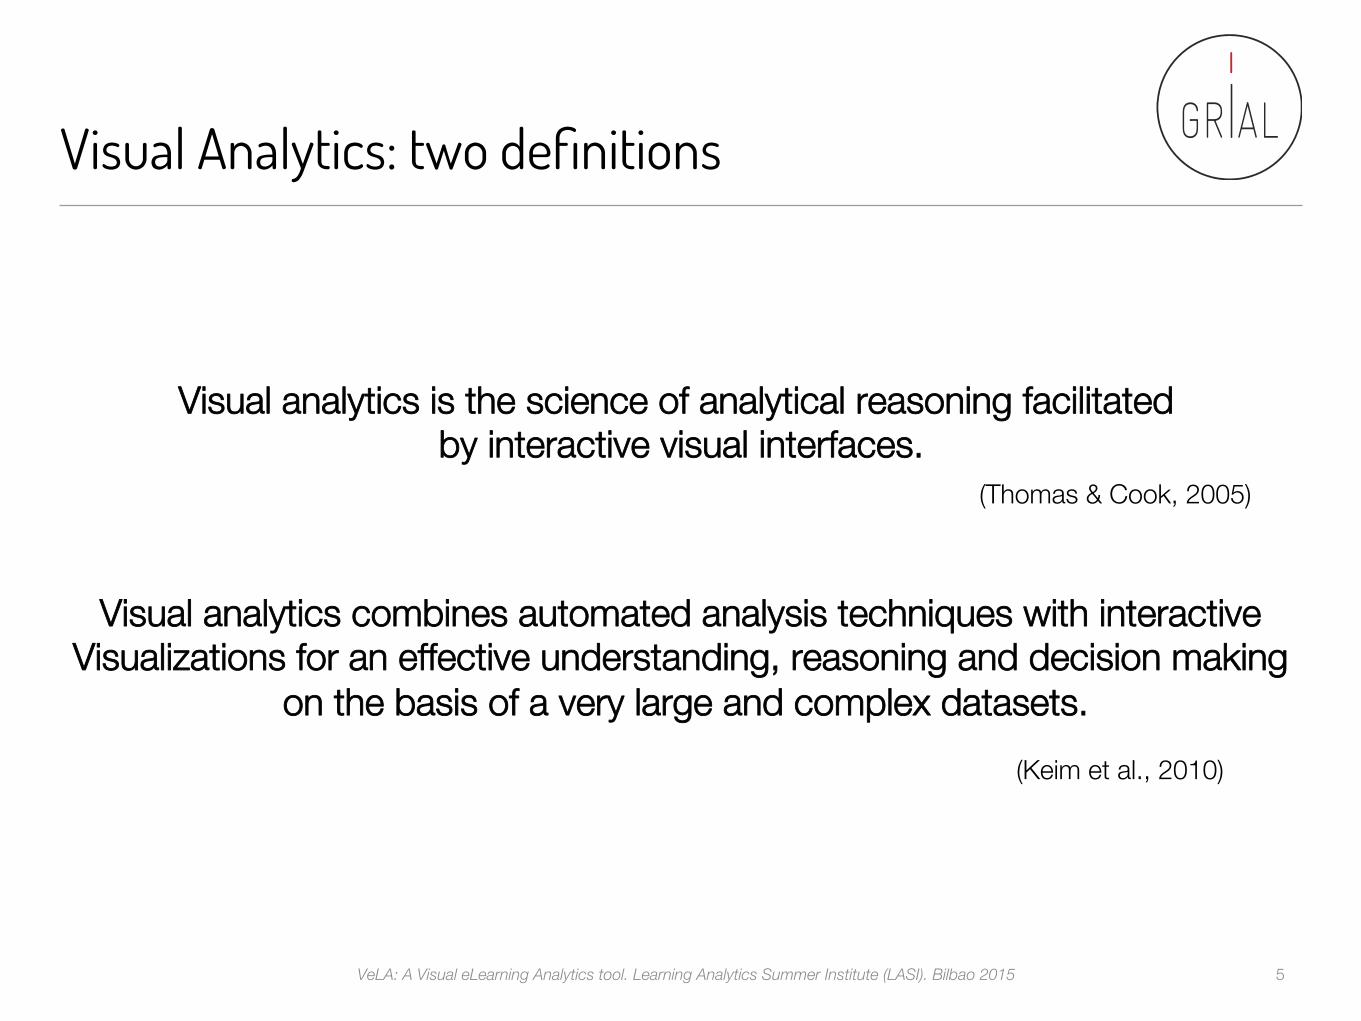
Visual Analytics: two definitions
Visual analytics is the science of analytical reasoning facilitated by interactive visual interfaces.
(Thomas & Cook, 2005)
VeLA: A Visual eLearning Analytics tool. Learning Analytics Summer Institute (LASI). Bilbao 2015 5
Visual analytics combines automated analysis techniques with interactive Visualizations for an effective understanding, reasoning and decision making
on the basis of a very large and complex datasets. (Keim et al., 2010)
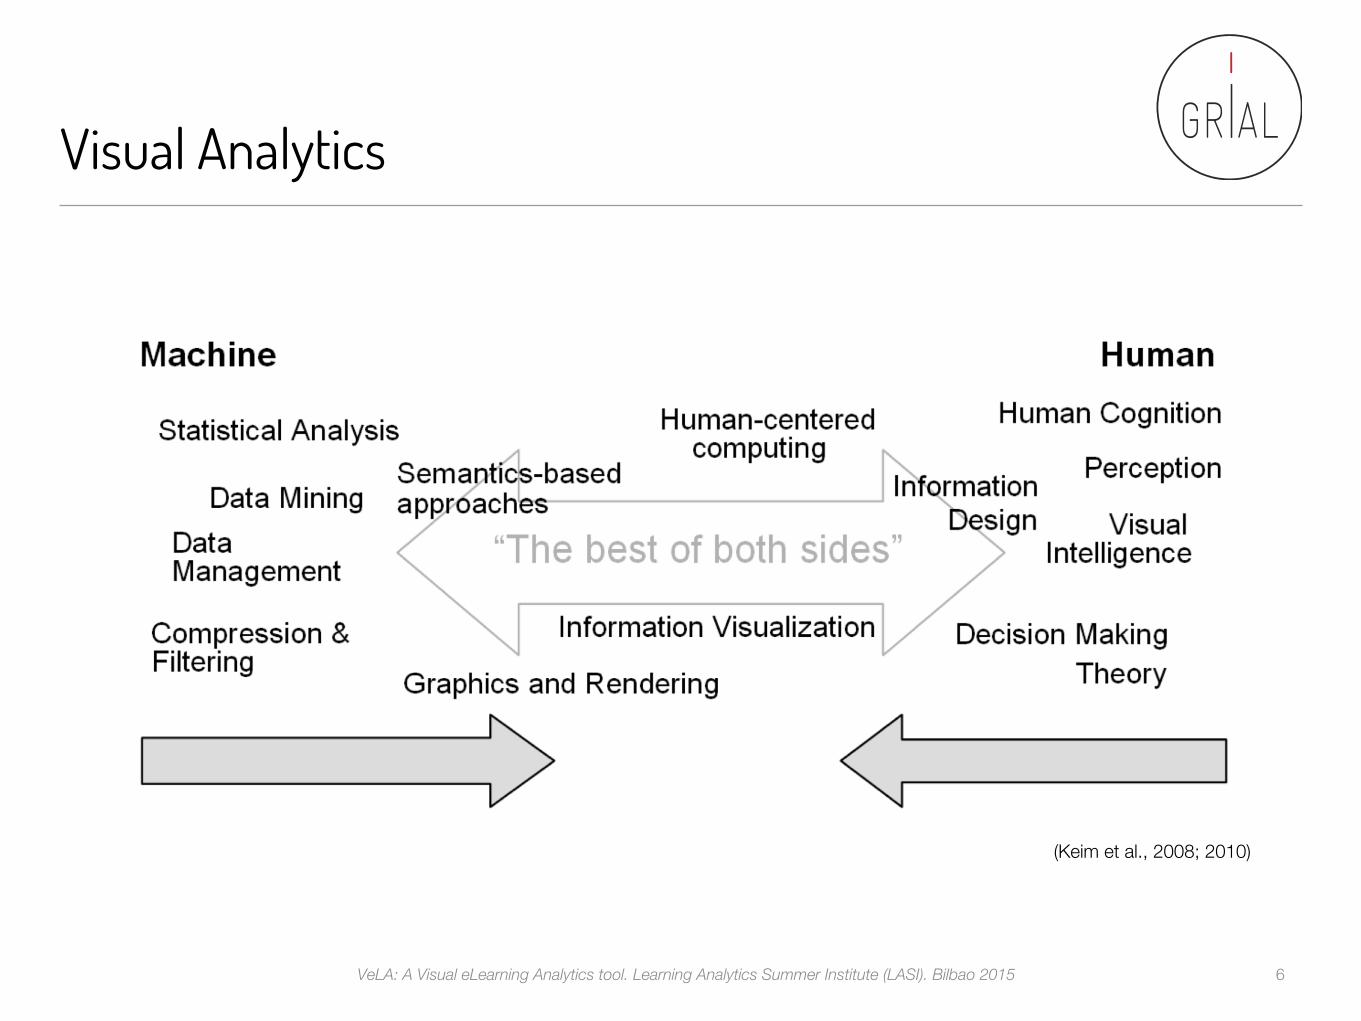
Visual Analytics
(Keim et al., 2008; 2010)
VeLA: A Visual eLearning Analytics tool. Learning Analytics Summer Institute (LASI). Bilbao 2015 6
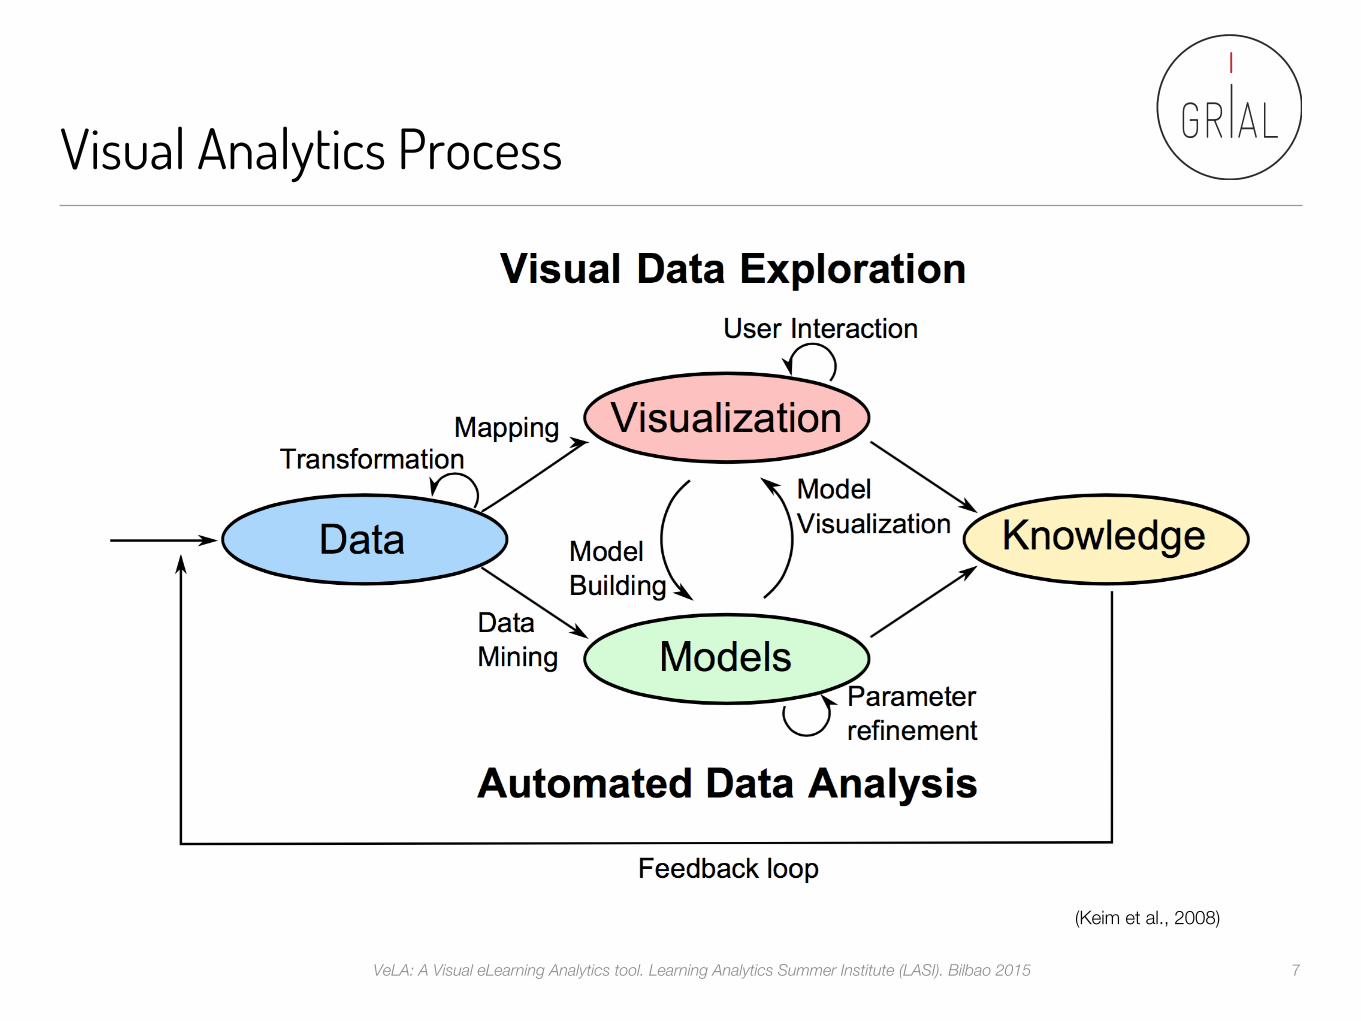
Visual Analytics Process
(Keim et al., 2008)
VeLA: A Visual eLearning Analytics tool. Learning Analytics Summer Institute (LASI). Bilbao 2015 7
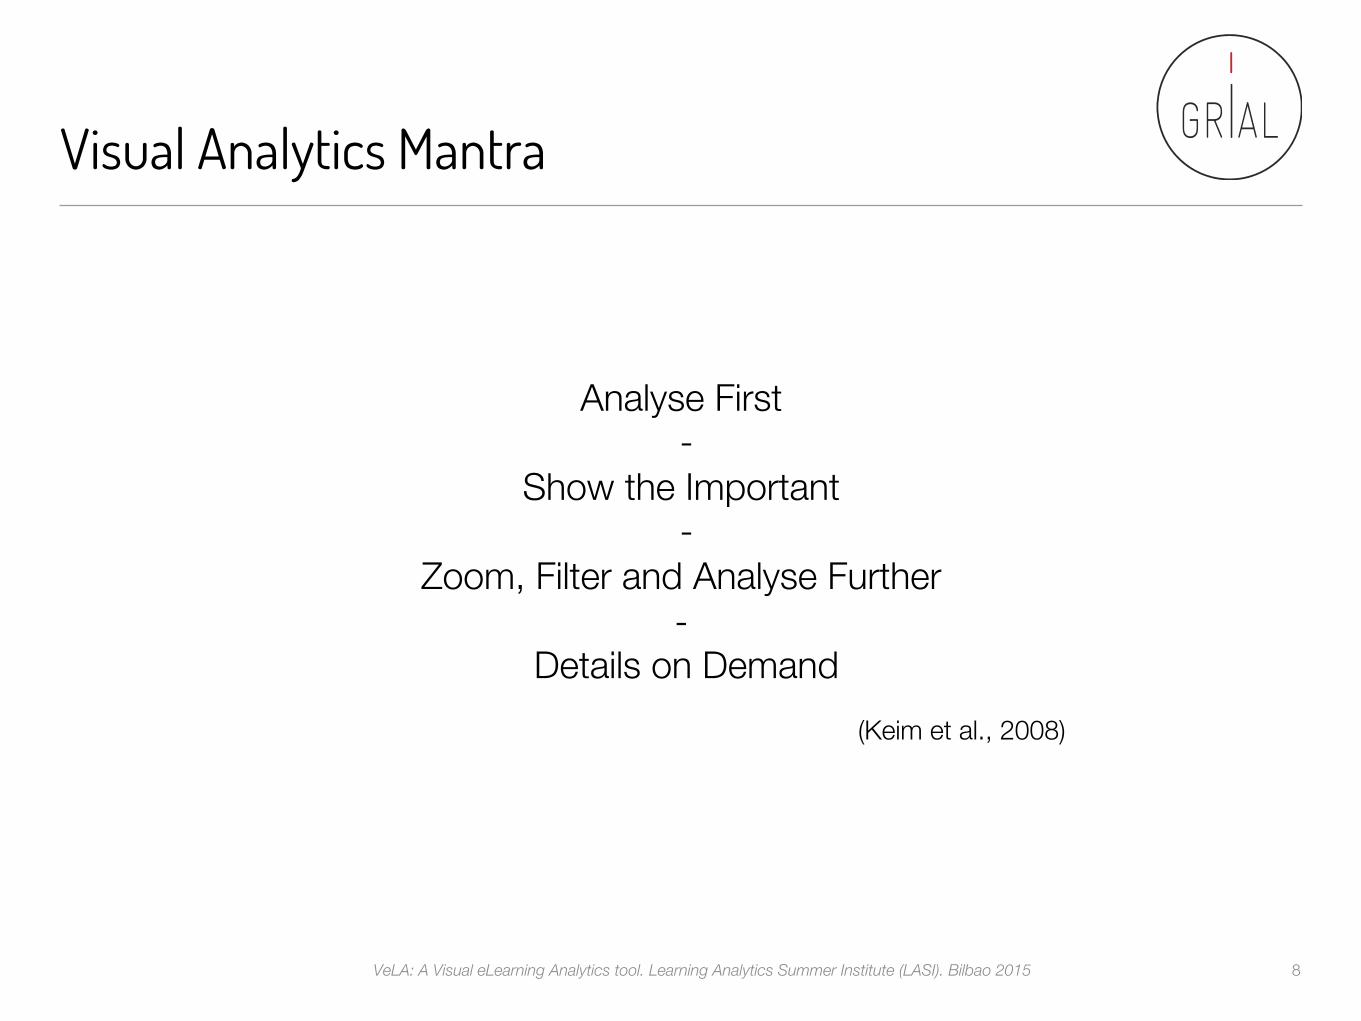
Visual Analytics Mantra
Analyse First -
Show the Important -
Zoom, Filter and Analyse Further -
Details on Demand (Keim et al., 2008)
VeLA: A Visual eLearning Analytics tool. Learning Analytics Summer Institute (LASI). Bilbao 2015 8
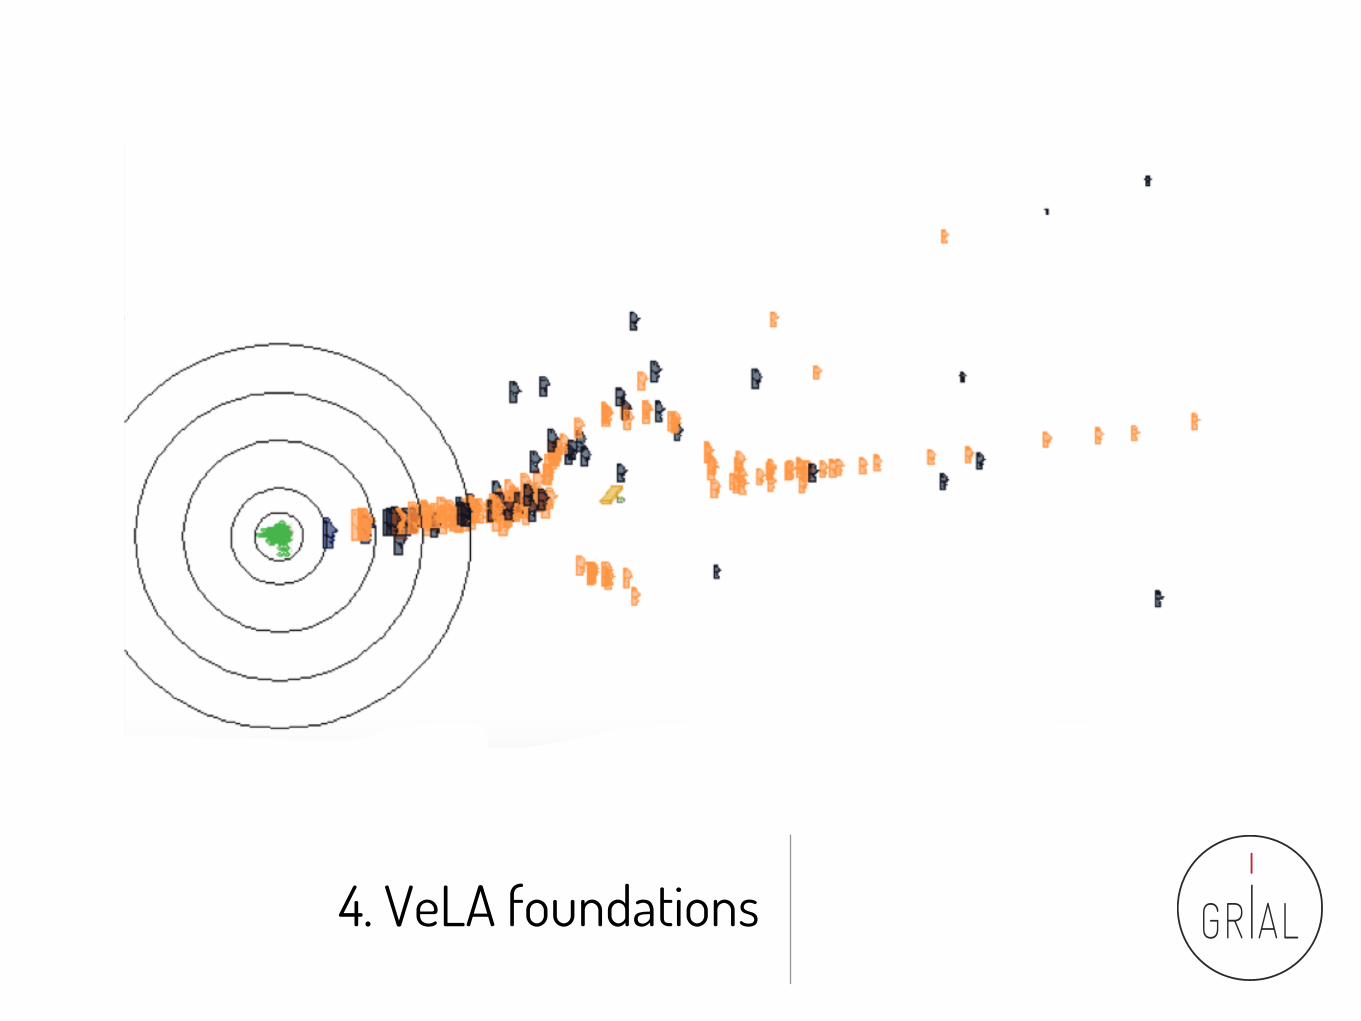
4. VeLA foundations
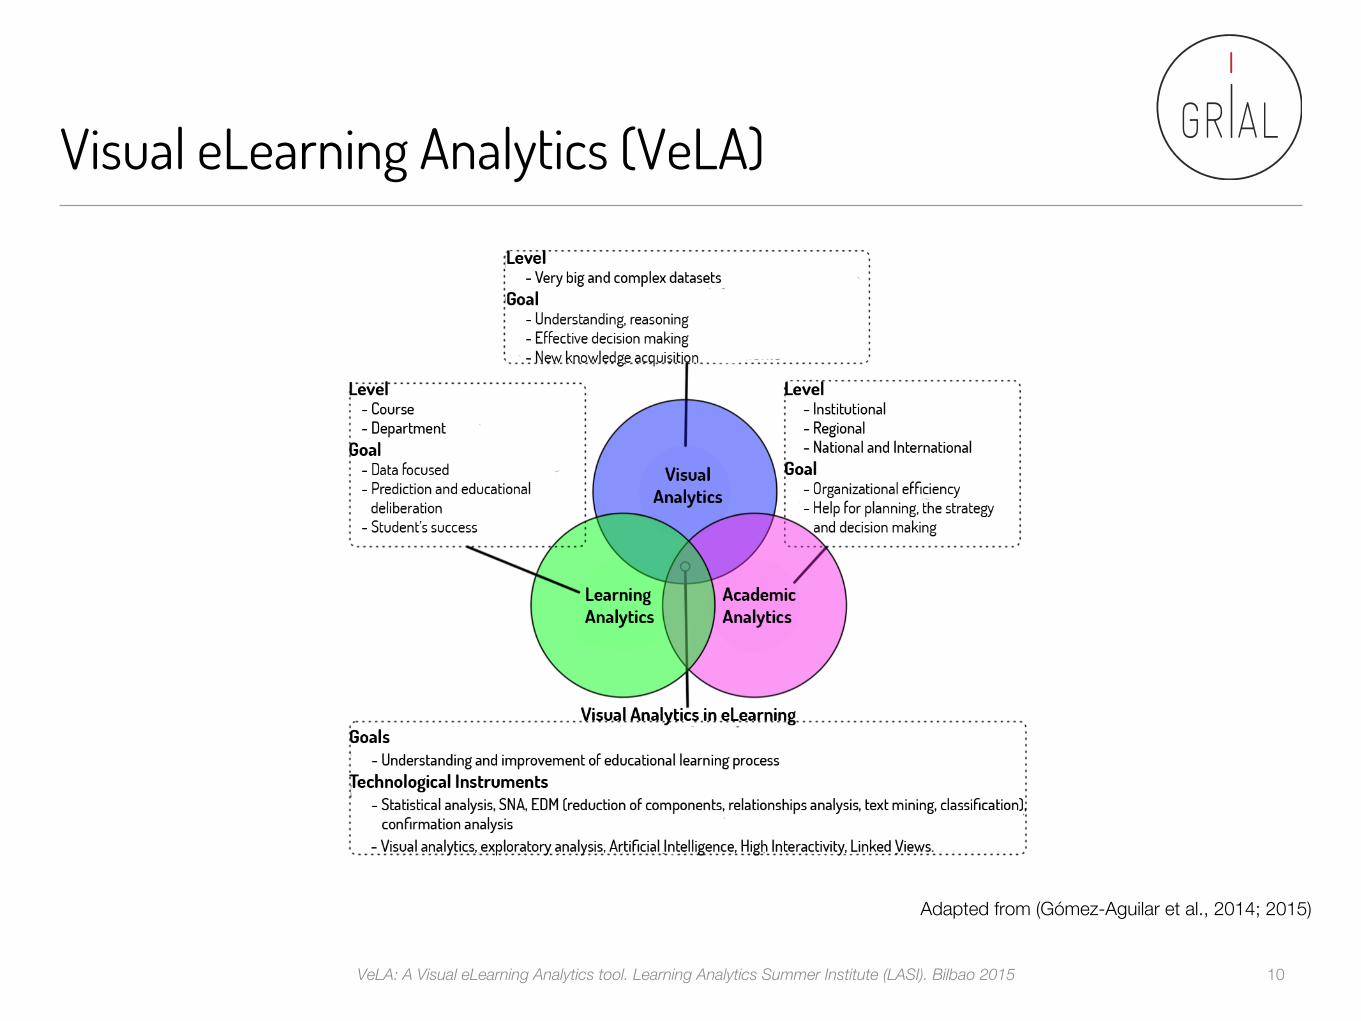
Visual eLearning Analytics (VeLA)
Adapted from (Gómez-Aguilar et al., 2014; 2015)
VeLA: A Visual eLearning Analytics tool. Learning Analytics Summer Institute (LASI). Bilbao 2015 10
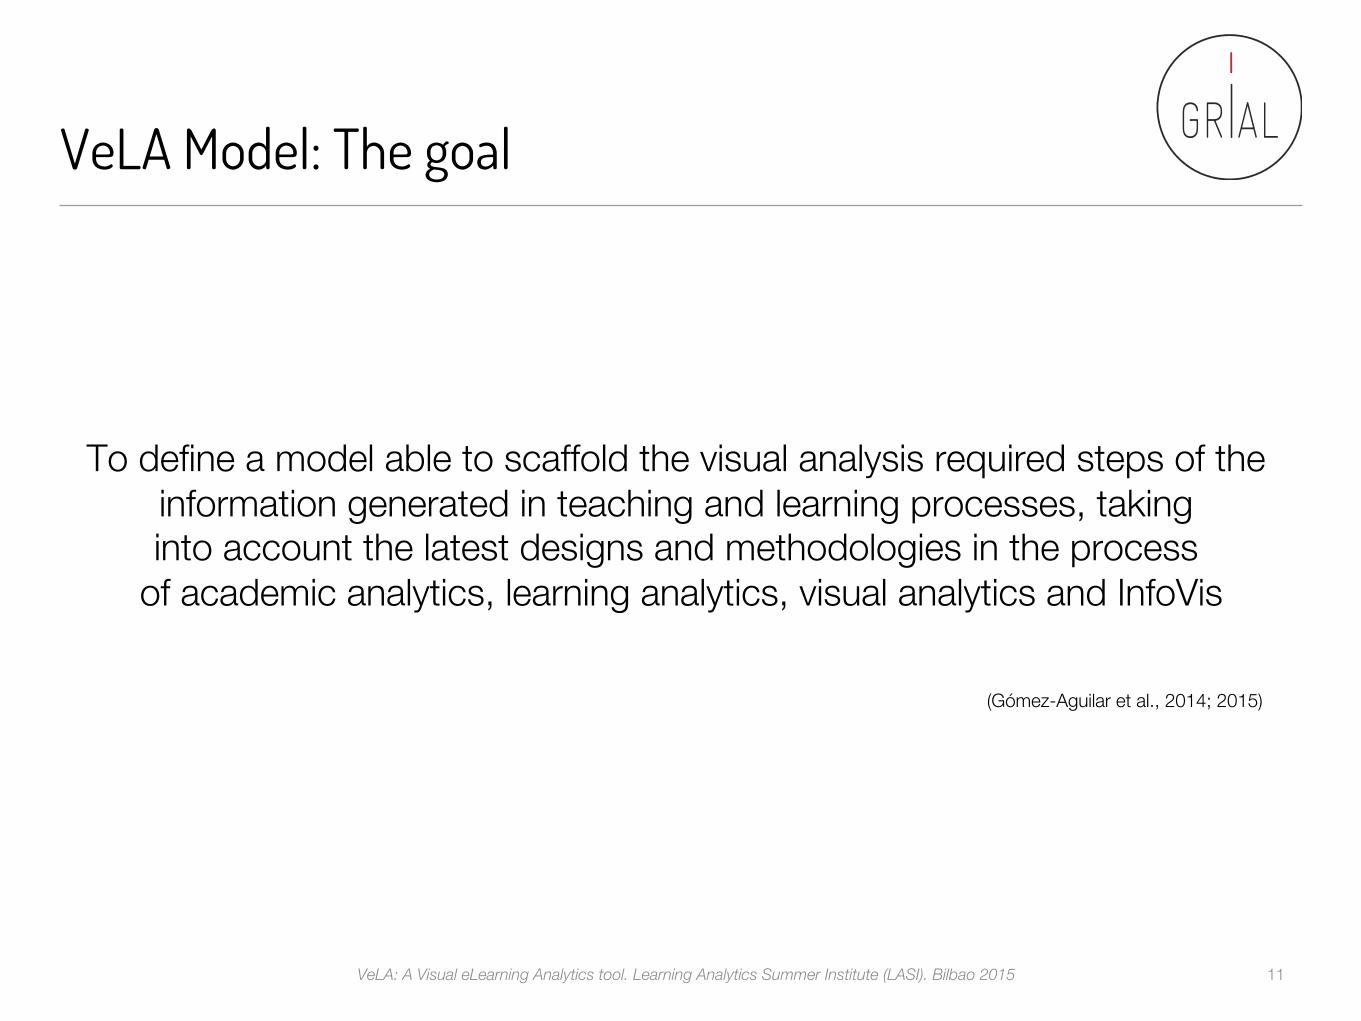
VeLA Model: The goal
To define a model able to scaffold the visual analysis required steps of the
information generated in teaching and learning processes, taking into account the latest designs and methodologies in the process
of academic analytics, learning analytics, visual analytics and InfoVis
VeLA: A Visual eLearning Analytics tool. Learning Analytics Summer Institute (LASI). Bilbao 2015 11
(Gómez-Aguilar et al., 2014; 2015)
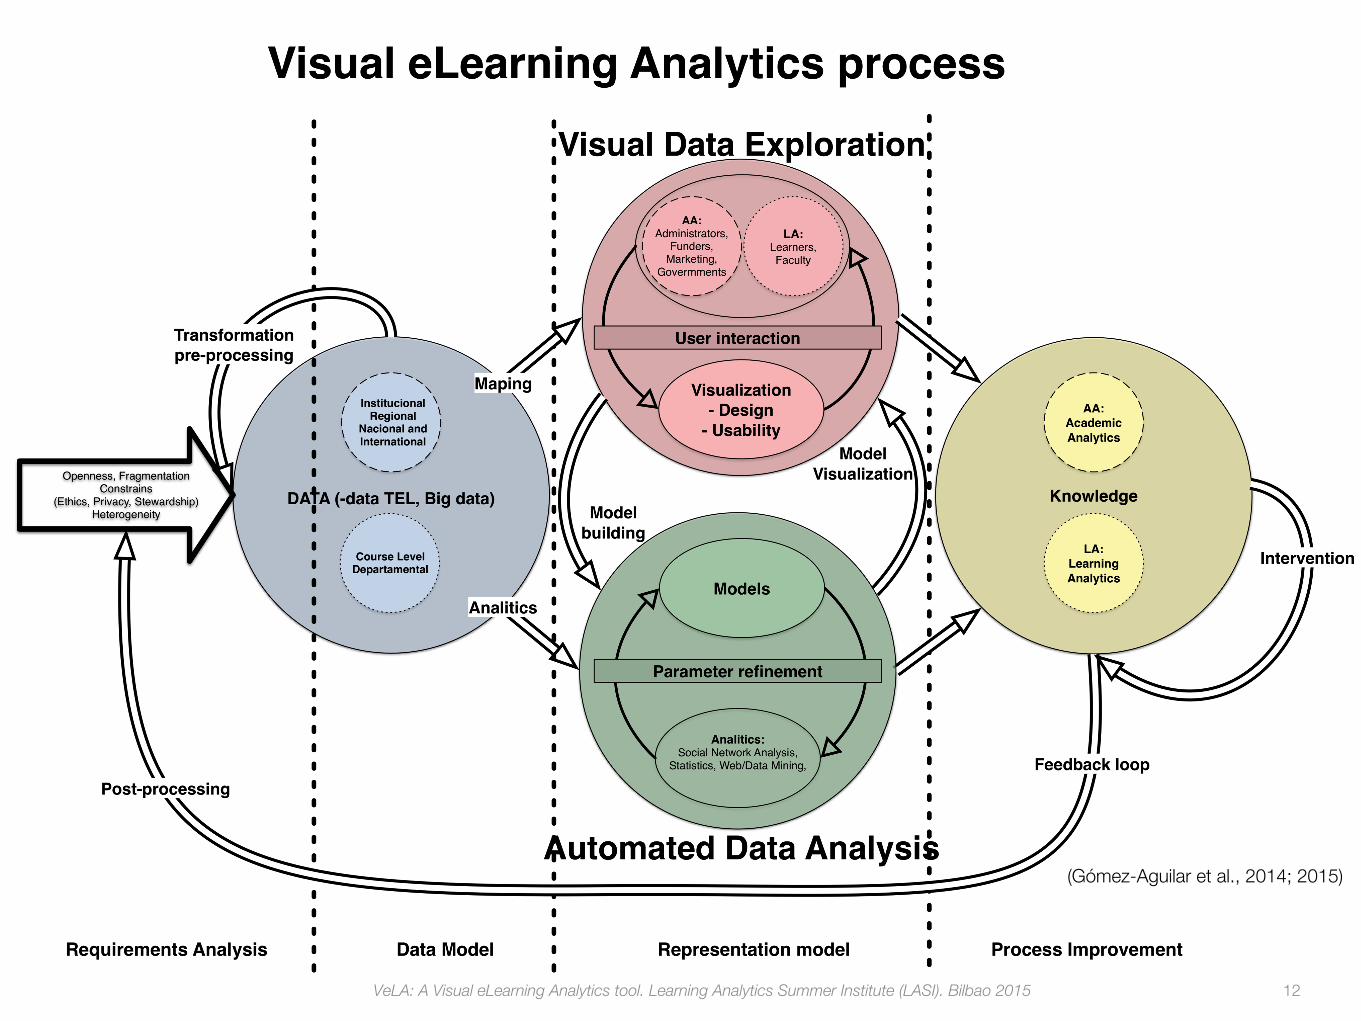
(Gómez-Aguilar et al., 2014; 2015)
VeLA: A Visual eLearning Analytics tool. Learning Analytics Summer Institute (LASI). Bilbao 2015 12
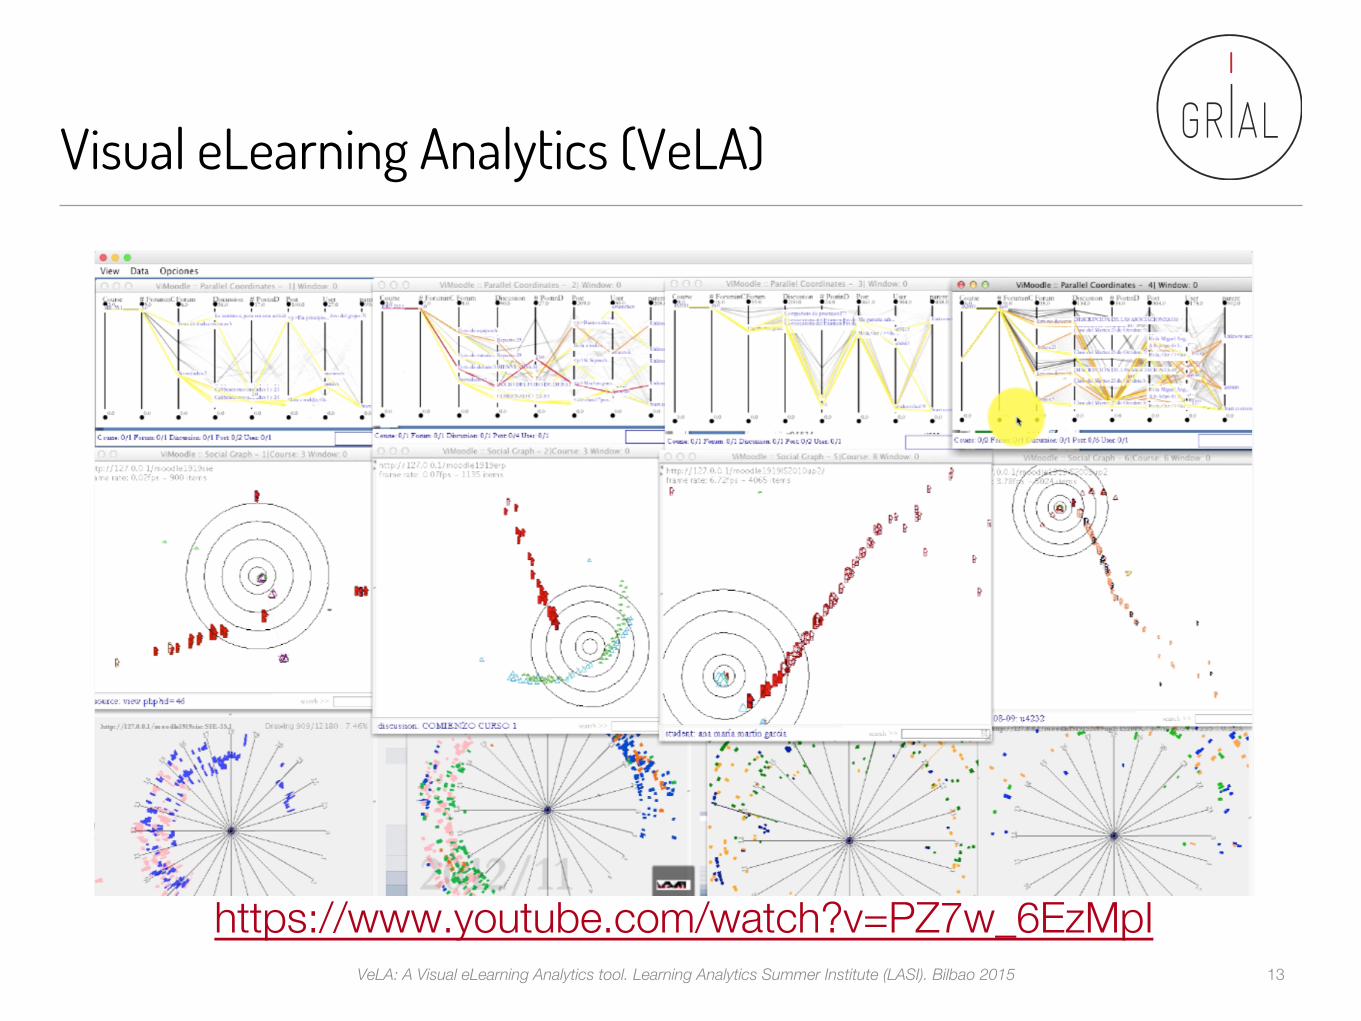
Visual eLearning Analytics (VeLA)
https://www.youtube.com/watch?v=PZ7w_6EzMpI VeLA: A Visual eLearning Analytics tool. Learning Analytics Summer Institute (LASI). Bilbao 2015 13
5. Conclusions
Digital-eye by onix15 http://www.deviantart.com/
Conclusions
VeLA: A Visual eLearning Analytics tool. Learning Analytics Summer Institute (LASI). Bilbao 2015 15
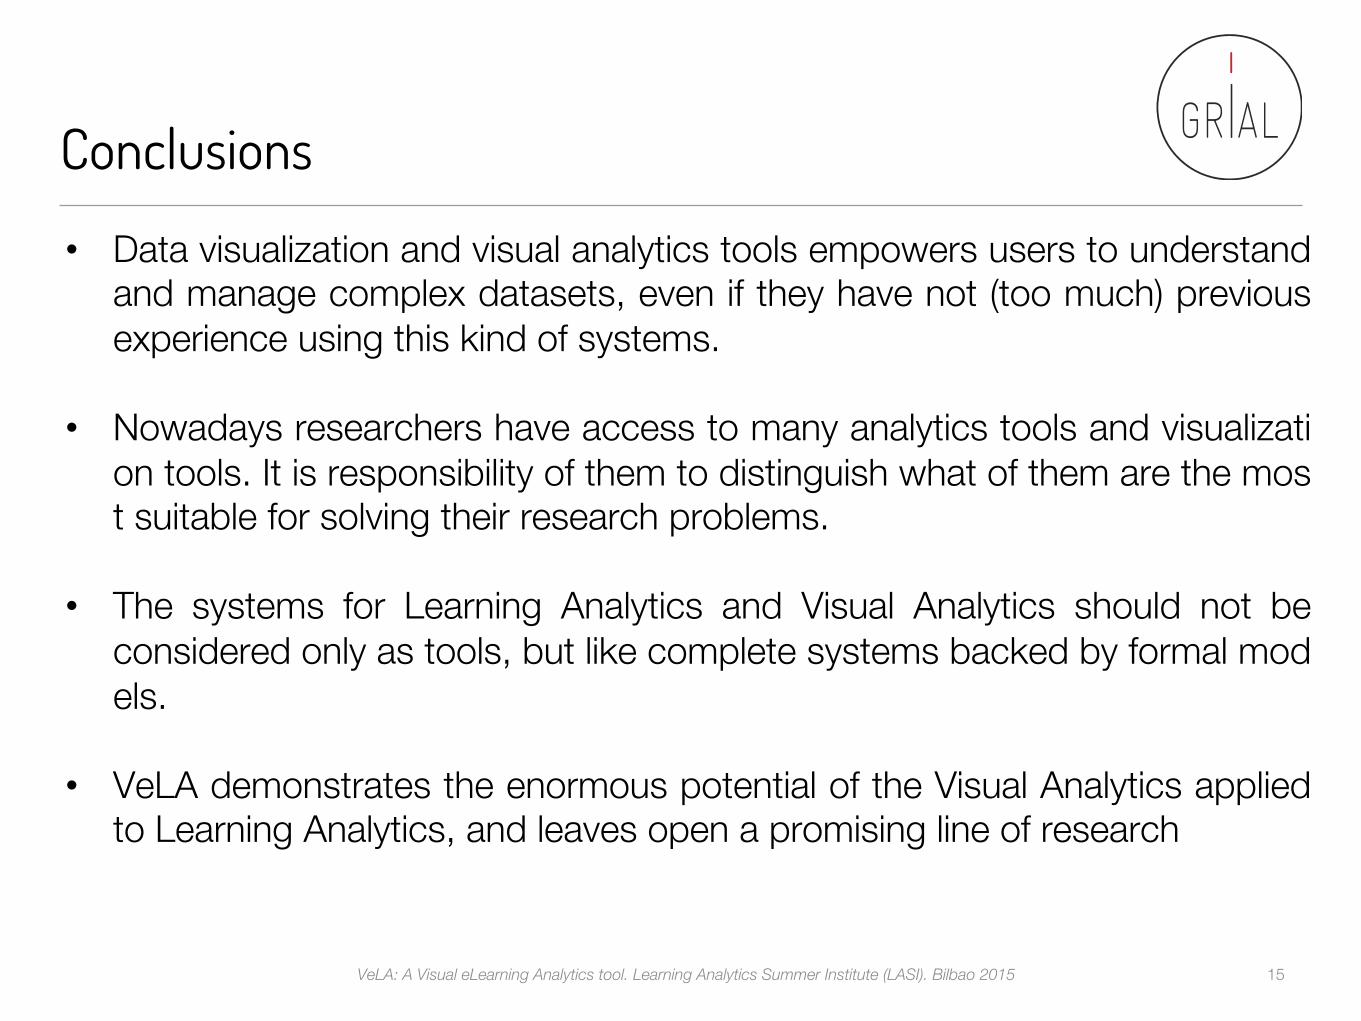
• Data visualization and visual analytics tools empowers users to understandand manage complex datasets, even if they have not (too much) previous experience using this kind of systems.
• Nowadays researchers have access to many analytics tools and visualization tools. It is responsibility of them to distinguish what of them are the most suitable for solving their research problems.
• The systems for Learning Analytics and Visual Analytics should not be considered only as tools, but like complete systems backed by formal models.
• VeLA demonstrates the enormous potential of the Visual Analytics applied to Learning Analytics, and leaves open a promising line of research
References
Books by vladstudio http://www.deviantart.com/
References
Inteligencia Institucional para la Mejora de los Procesos de Enseñanza-Aprendizaje 17
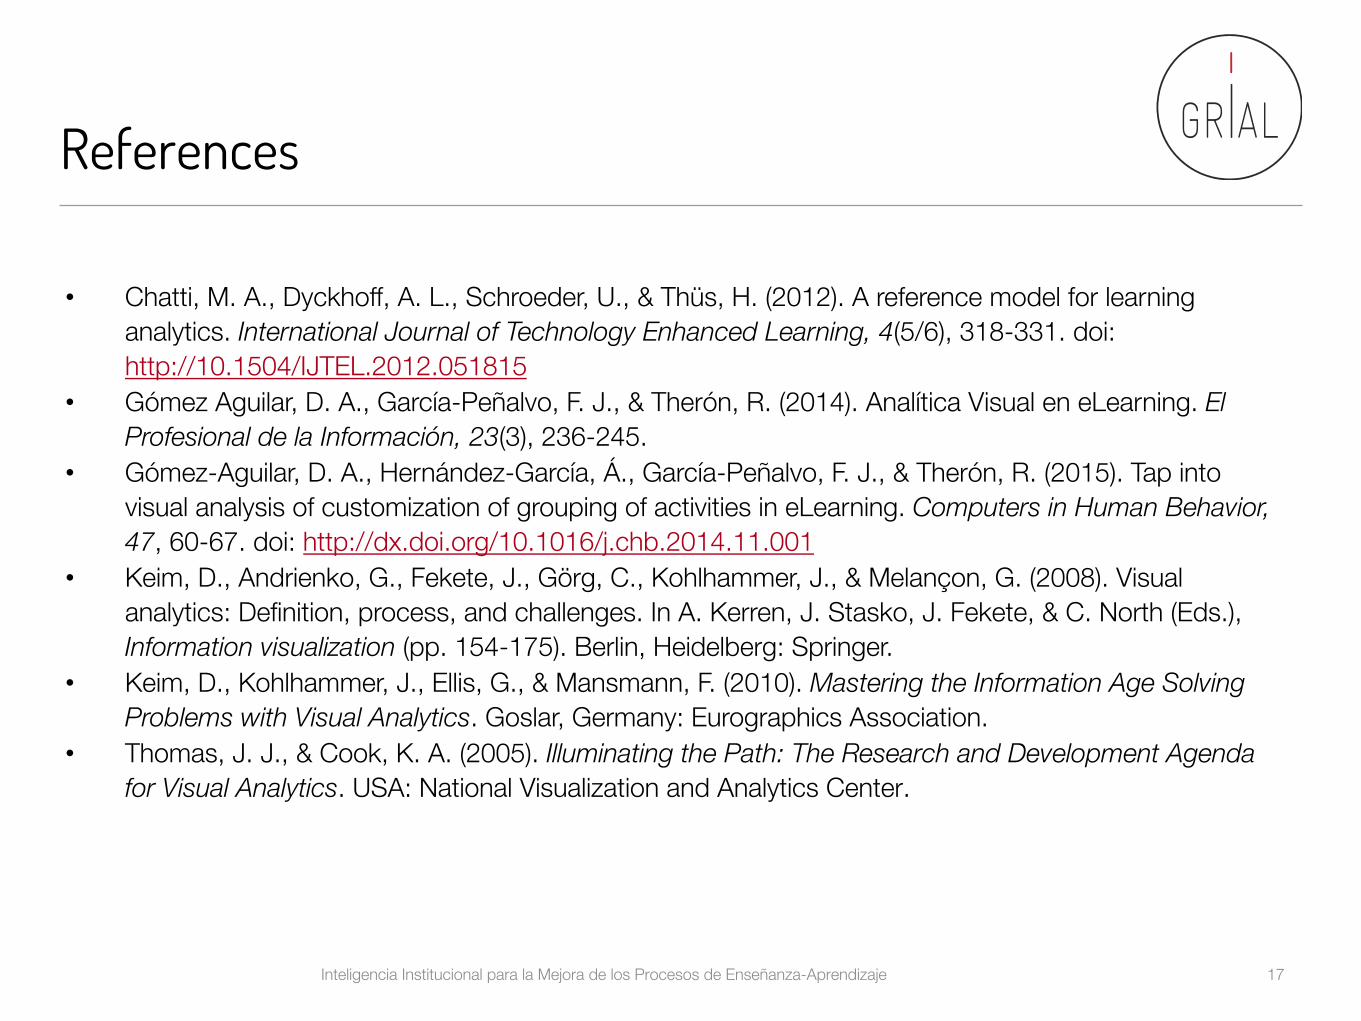
• Chatti, M. A., Dyckhoff, A. L., Schroeder, U., & Thüs, H. (2012). A reference model for learning analytics. International Journal of Technology Enhanced Learning, 4(5/6), 318-331. doi: http://10.1504/IJTEL.2012.051815
• Gómez Aguilar, D. A., García-Peñalvo, F. J., & Therón, R. (2014). Analítica Visual en eLearning. El Profesional de la Información, 23(3), 236-245.
• Gómez-Aguilar, D. A., Hernández-García, Á., García-Peñalvo, F. J., & Therón, R. (2015). Tap into visual analysis of customization of grouping of activities in eLearning. Computers in Human Behavior, 47, 60-67. doi: http://dx.doi.org/10.1016/j.chb.2014.11.001
• Keim, D., Andrienko, G., Fekete, J., Görg, C., Kohlhammer, J., & Melançon, G. (2008). Visual analytics: Definition, process, and challenges. In A. Kerren, J. Stasko, J. Fekete, & C. North (Eds.), Information visualization (pp. 154-175). Berlin, Heidelberg: Springer.
• Keim, D., Kohlhammer, J., Ellis, G., & Mansmann, F. (2010). Mastering the Information Age Solving Problems with Visual Analytics. Goslar, Germany: Eurographics Association.
• Thomas, J. J., & Cook, K. A. (2005). Illuminating the Path: The Research and Development Agenda for Visual Analytics. USA: National Visualization and Analytics Center.
VeLA: A Visual eLearning Analytics tool Juan Cruz-Benito Francisco J. García-Peñalvo GRIAL Research Group Departament of Computers and Automatics University of Salamanca [email protected] / @_juancb [email protected] / @frangp
LASI 2015 Bilbao: Learning Analytics Summer Institute Bilbao, Spain, June 22nd and 23rd