Embed Size (px)
Citation preview
Interactive News Editing and Production Thursday, Jan. 22
• Reorient ourselves • Shorter news experiences• HTML III• FTP• Google Fusion Tables II• Homework/Lab
Today’s agenda
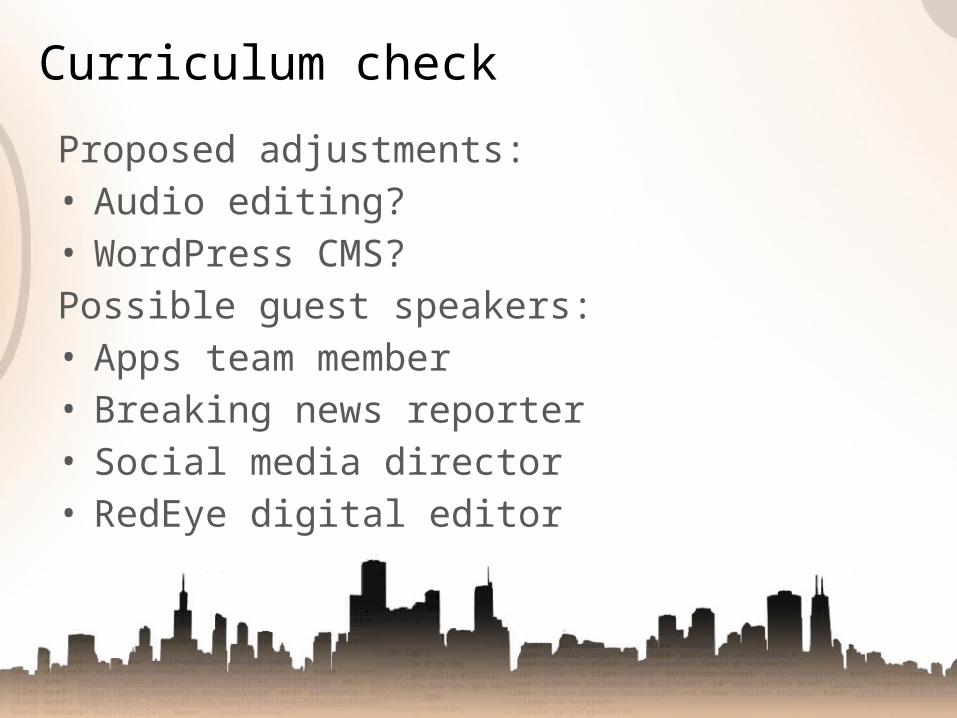
Proposed adjustments: • Audio editing?• WordPress CMS?Possible guest speakers:• Apps team member• Breaking news reporter• Social media director• RedEye digital editor
Curriculum check
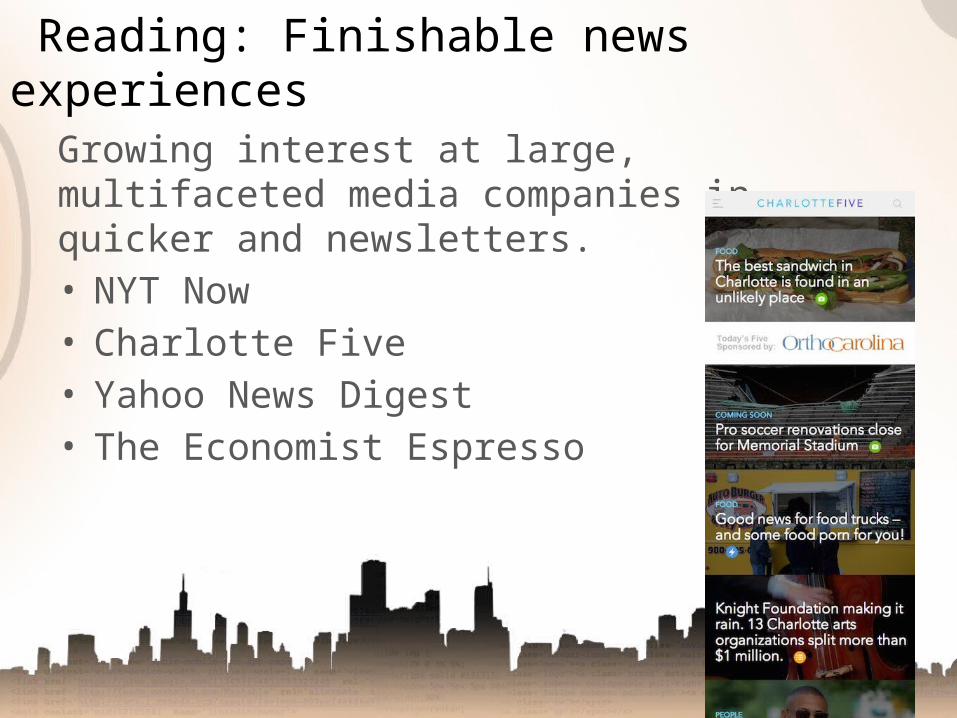
Growing interest at large, multifaceted media companies in quicker and newsletters.• NYT Now• Charlotte Five• Yahoo News Digest• The Economist Espresso
Reading: Finishable news experiences
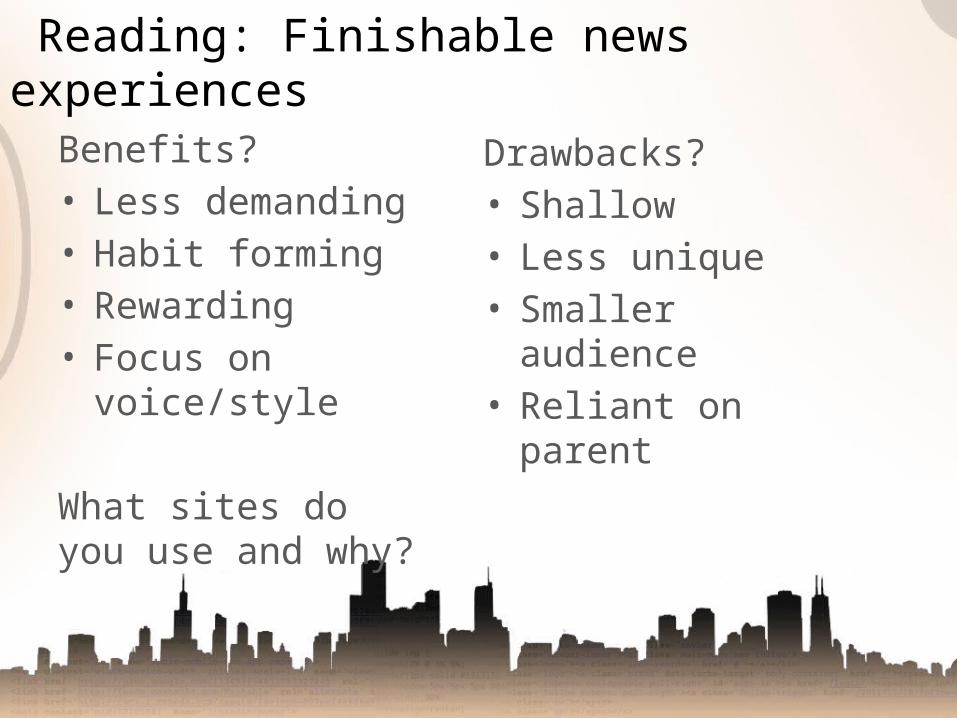
Benefits? • Less demanding• Habit forming• Rewarding• Focus on
voice/style
What sites do you use and why?
Reading: Finishable news experiences
Drawbacks?• Shallow• Less unique• Smaller audience• Reliant on parent
HTML III
Last Thursday, we explored the central elements of web pages:• Links (for internal and external
navigation)• Images, HTML5 style• Pathing• Non-semantic tags
Recap
• HTML5’s semantic elements• Simple page construction• A little CSS to lubricate the process
HTML III agenda
HTML5 ushered in a new way to define the structure of a layout. Rather using <div> tags with a class and/or id property, HTML5 gave us containers named semantically for the type of content they should contain.Is it a big change? No. But it helps with organization, SEO, feeds and development.
What’s a semantic element?
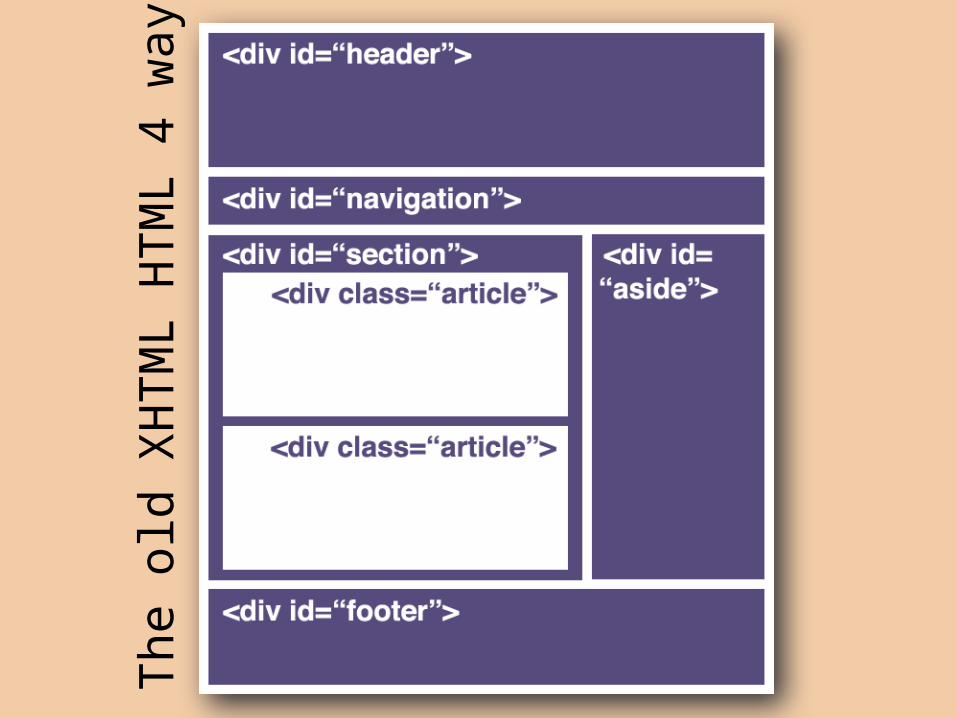
The o
ld X
HTM
L H
TM
L 4
way
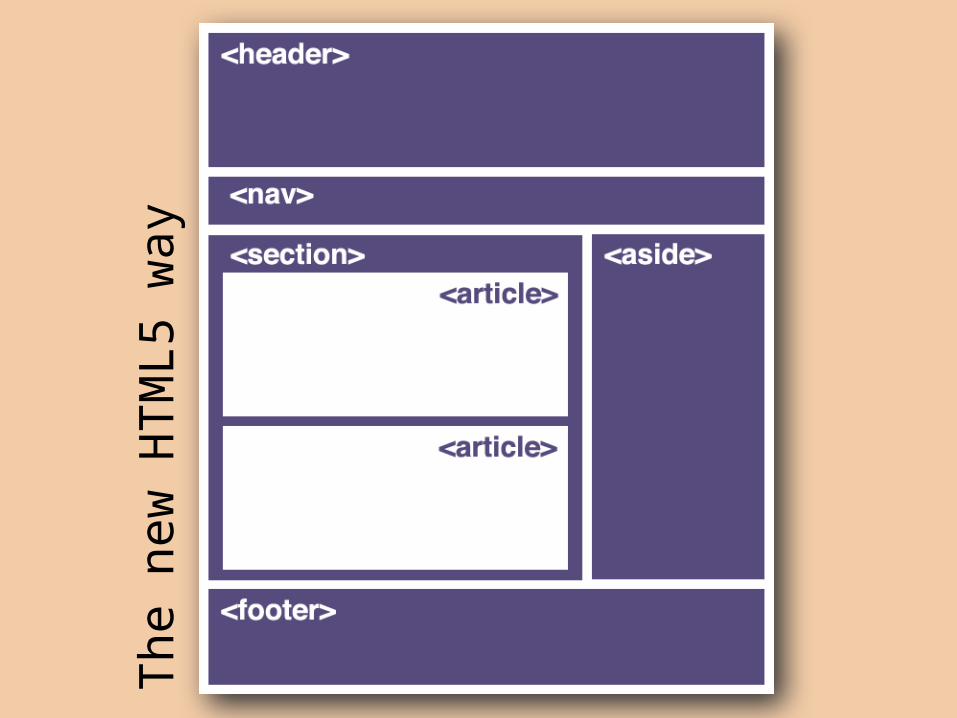
The n
ew
HTM
L5 w
ay
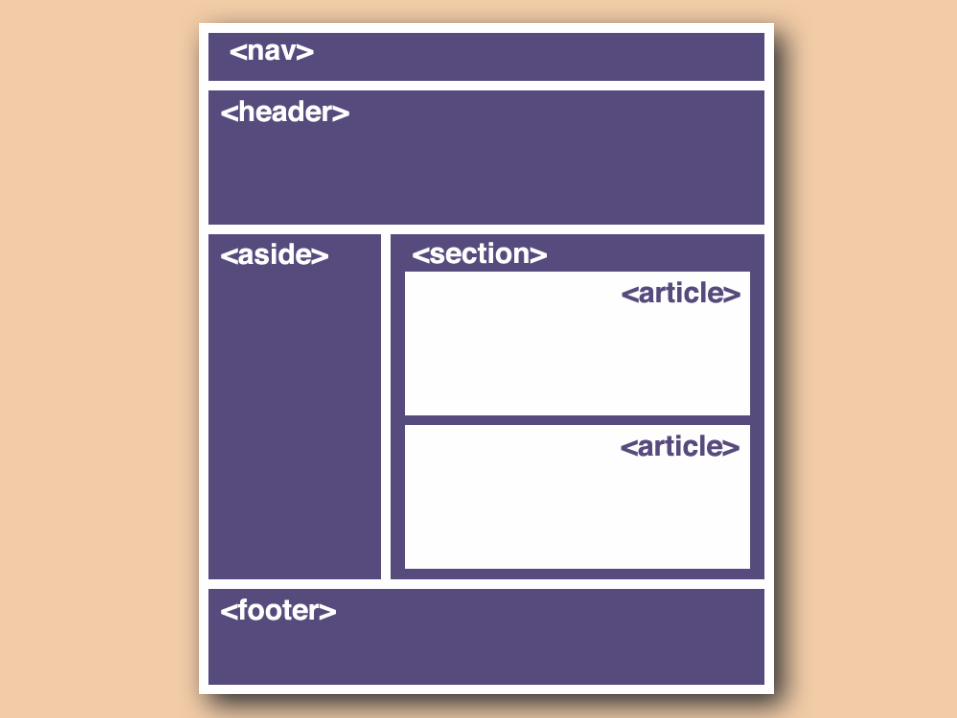
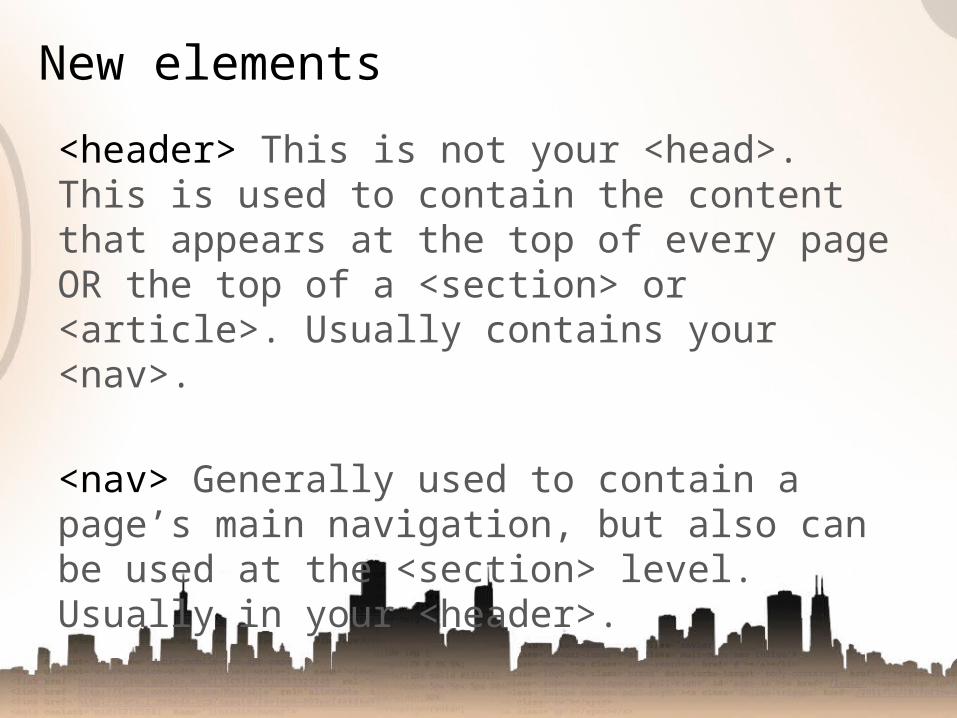
<header> This is not your <head>. This is used to contain the content that appears at the top of every page OR the top of a <section> or <article>. Usually contains your <nav>.
<nav> Generally used to contain a page’s main navigation, but also can be used at the <section> level. Usually in your <header>.
New elements
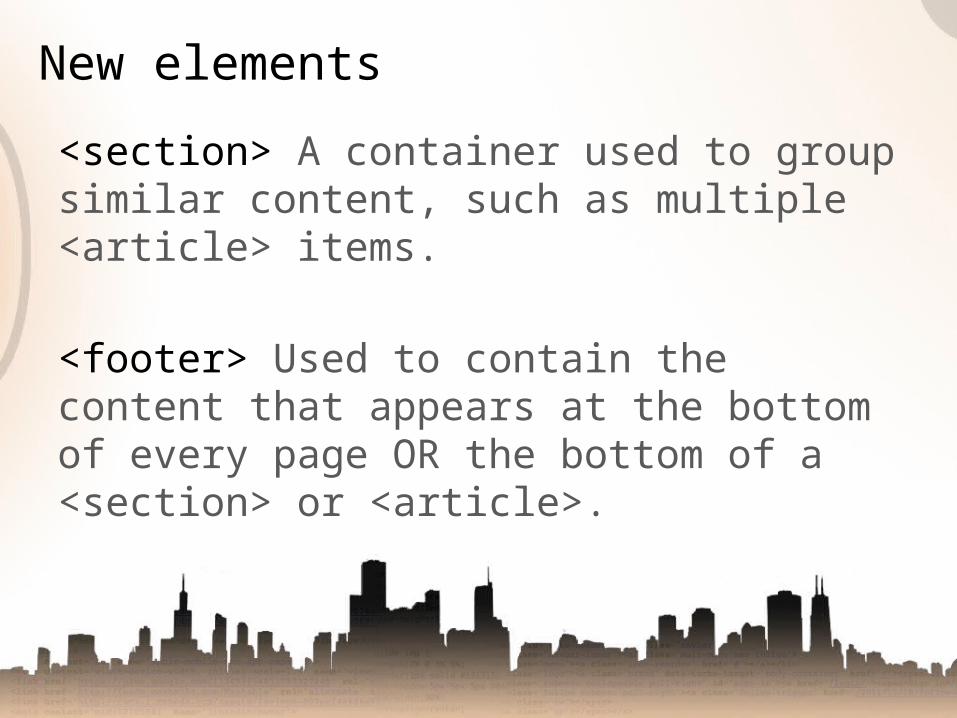
<section> A container used to group similar content, such as multiple <article> items.
<footer> Used to contain the content that appears at the bottom of every page OR the bottom of a <section> or <article>.
New elements
<article> A standalone content item. Can be nested, like story commenting. Doesn’t have to be words.
<aside> Inside an <article>, it should be used to information related to that piece. On the page-level, it should be used for information related to the whole page or site, like search, recent posts etc.
New elements
<hgroup> Contains two or more related <h1> to <h6> headlines.
<figure> Contains an image or graphic (or even a video.
<figcaption> Information related to the parent <figure>.
New elements
But even though you now have <header>, <nav>, <section>, <article>, <aside>, <footer>, <hgroup>, <figure>, <figcaption> and <hgroup>, you’ll still use a lot of <div> tags and the CSS selectors id and class.
New elements
In order to proceed, we need a basic understanding of the following CSS concepts:• General CSS format• Using an id or class to style a <div> or
HTML5 tag• Block vs. inline elements• Positioning with float
A wee bit o’ CSS
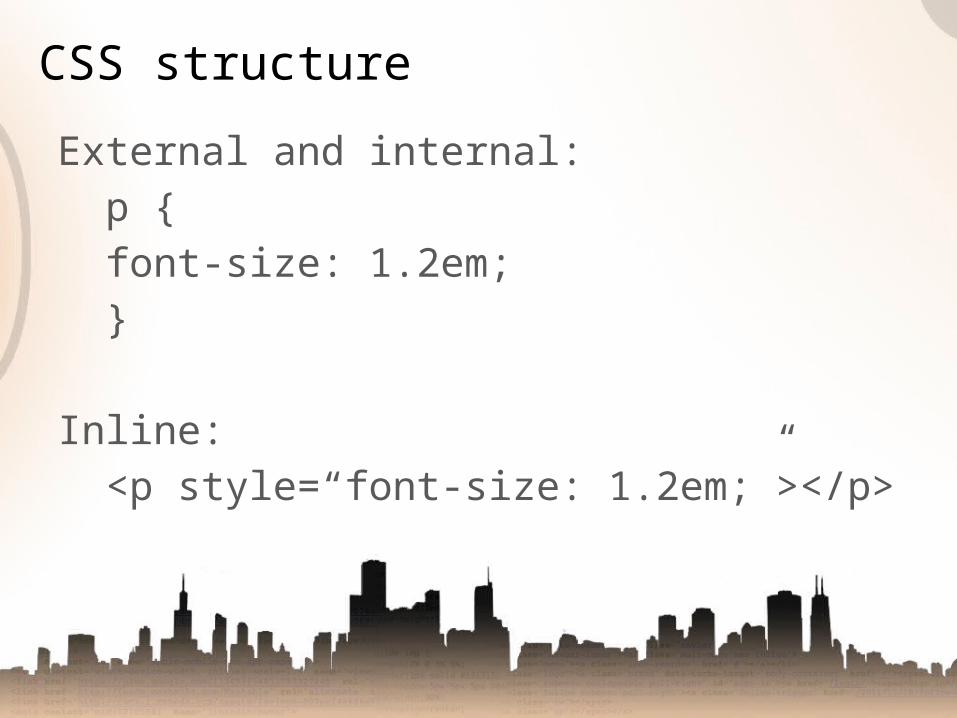
External and internal:p {font-size: 1.2em;}
Inline:<p style=“font-size: 1.2em;”></p>
CSS structure
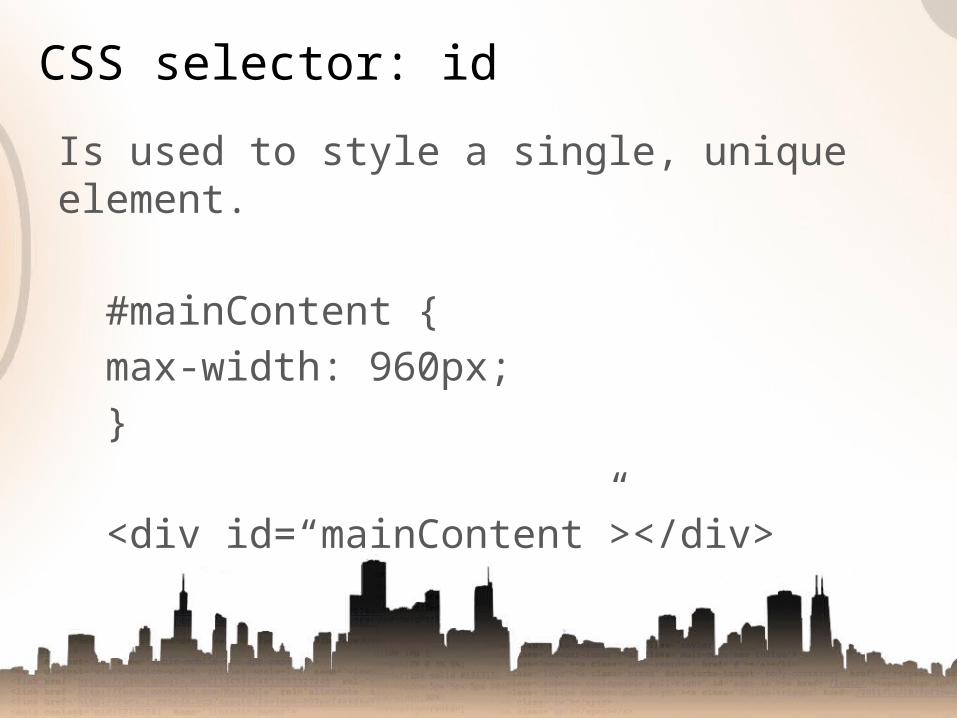
Is used to style a single, unique element.
#mainContent {max-width: 960px;}
<div id=“mainContent”></div>
CSS selector: id
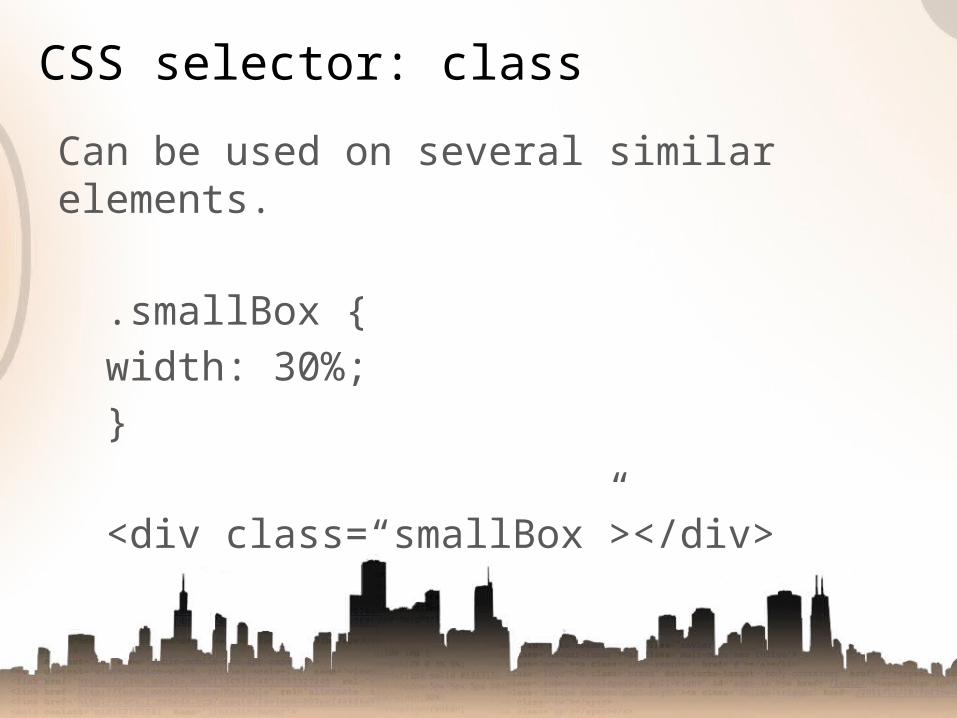
Can be used on several similar elements.
.smallBox {width: 30%;}
<div class=“smallBox”></div>
CSS selector: class
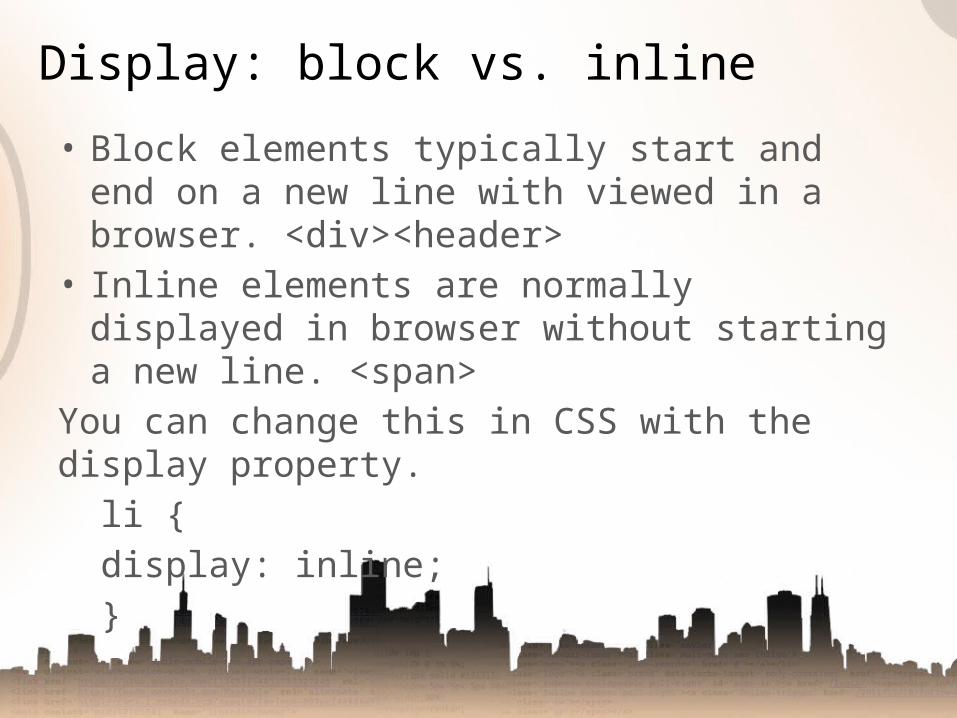
• Block elements typically start and end on a new line with viewed in a browser. <div><header>
• Inline elements are normally displayed in browser without starting a new line. <span>
You can change this in CSS with the display property.
li {display: inline;}
Display: block vs. inline
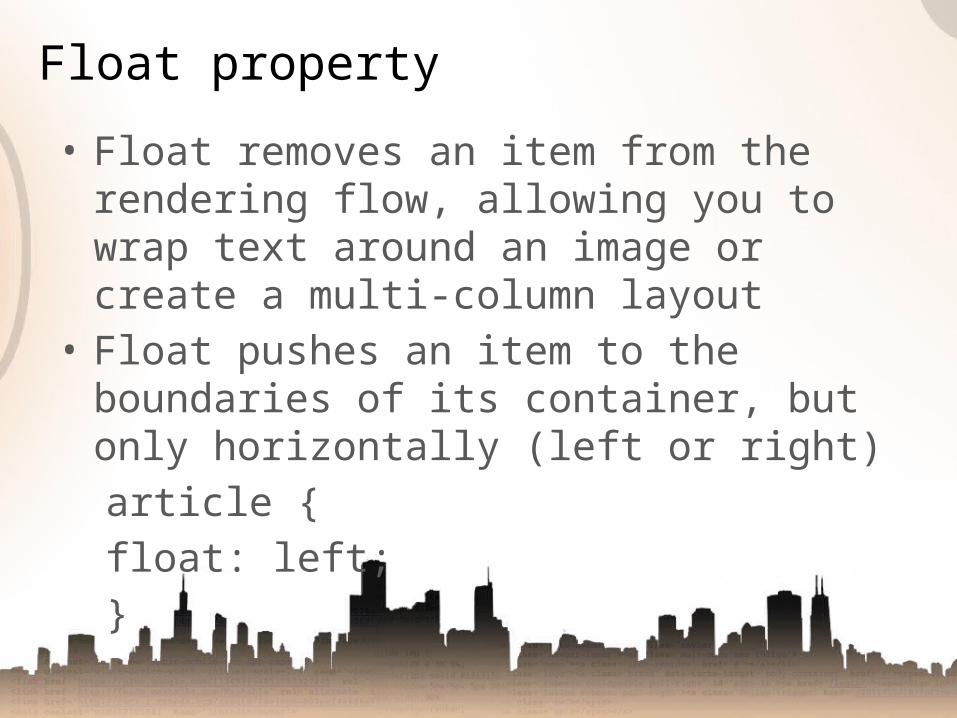
• Float removes an item from the rendering flow, allowing you to wrap text around an image or create a multi-column layout
• Float pushes an item to the boundaries of its container, but only horizontally (left or right)
article {float: left;}
Float property
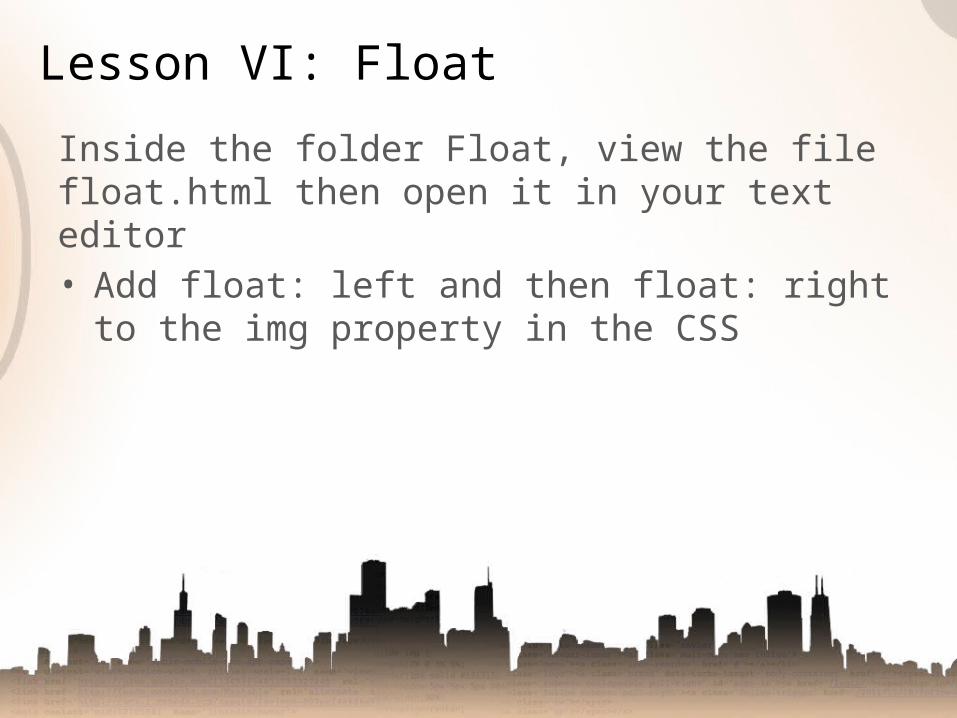
Inside the folder Float, view the file float.html then open it in your text editor• Add float: left and then float: right to the
img property in the CSS
Lesson VI: Float
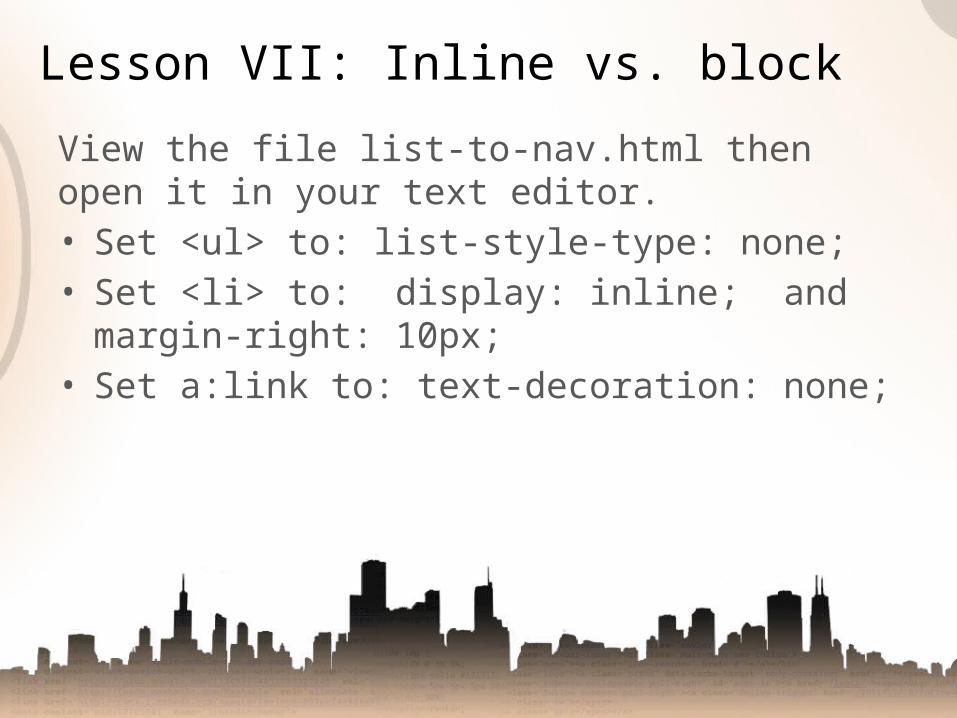
View the file list-to-nav.html then open it in your text editor.• Set <ul> to: list-style-type: none;• Set <li> to: display: inline; and margin-
right: 10px;• Set a:link to: text-decoration: none;
Lesson VII: Inline vs. block
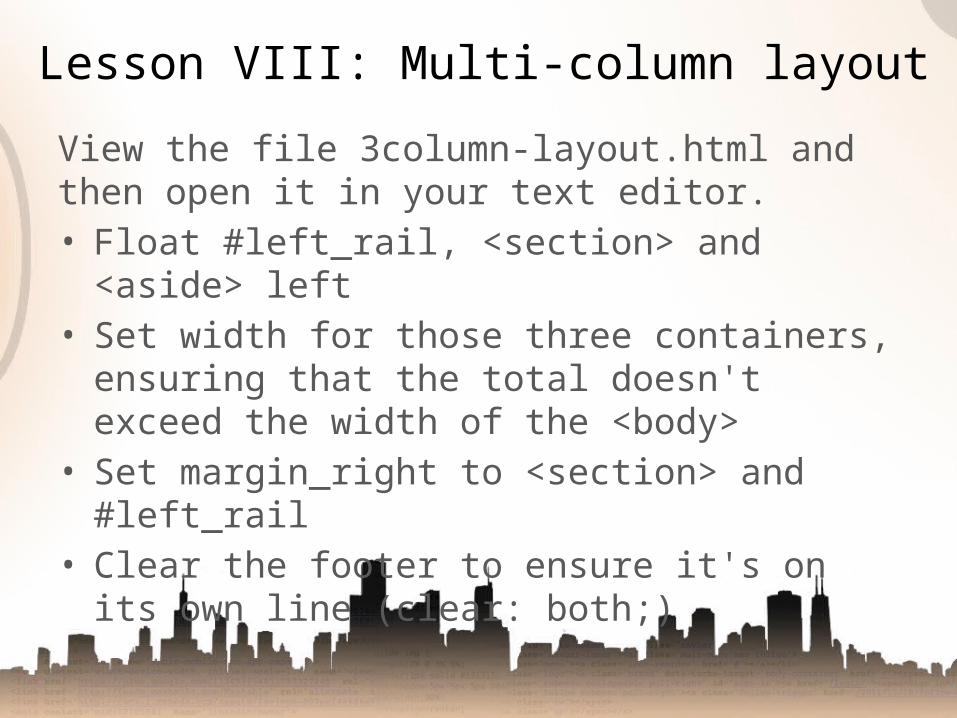
View the file 3column-layout.html and then open it in your text editor.• Float #left_rail, <section> and <aside> left• Set width for those three containers,
ensuring that the total doesn't exceed the width of the <body>
• Set margin_right to <section> and #left_rail• Clear the footer to ensure it's on its own line
(clear: both;)
Lesson VIII: Multi-column layout
Inside the ghost train folder, view the file ghosttrain.html and then open it in your text editor.• Follow the commented out instructions at
the top of the document (too many to list here!)
Lesson IX: HTML 5 page structure
Inside the cornell park folder, view the file cornellpark.html and then open it in your text editor.• Follow the commented out instructions at
the top of the document (way, way too many to list here!)
• FTP the file and email me the live link …
Lesson X: Building a page

File Transfer Protocol
For your HTML homework this week, you’ll be moving your classwork online. Specifically, a subdomain:
http://medill.kurtgessler.com/
This is easy: Remember, web pages are just documents and paths just folders. You just need an File Transfer Protocol client to move those files.
FTP client
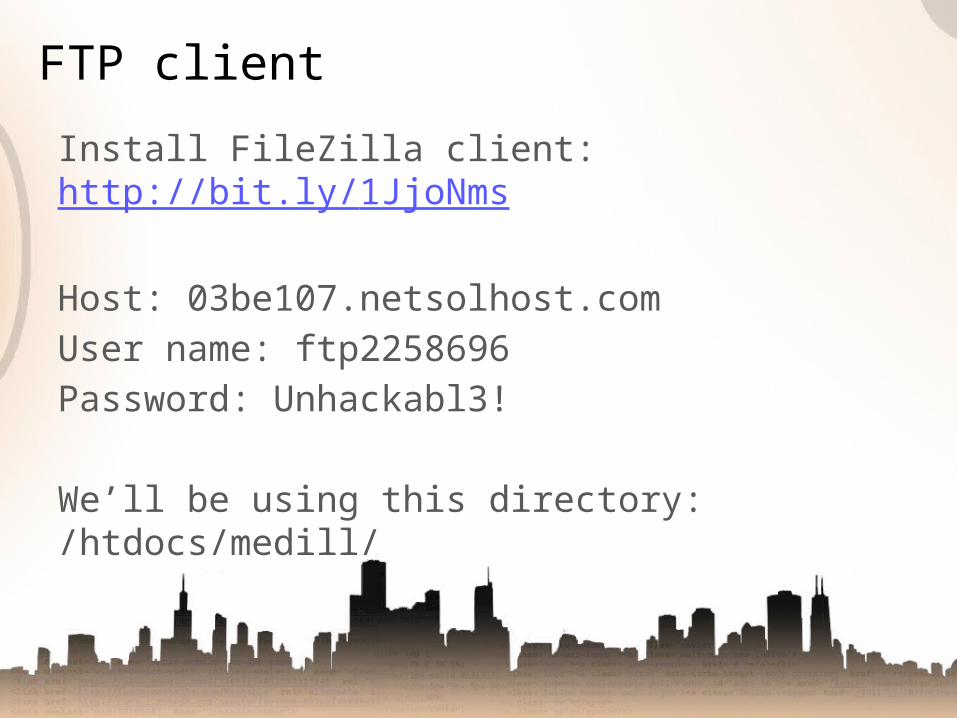
Install FileZilla client: http://bit.ly/1JjoNms
Host: 03be107.netsolhost.comUser name: ftp2258696Password: Unhackabl3!
We’ll be using this directory: /htdocs/medill/
FTP client
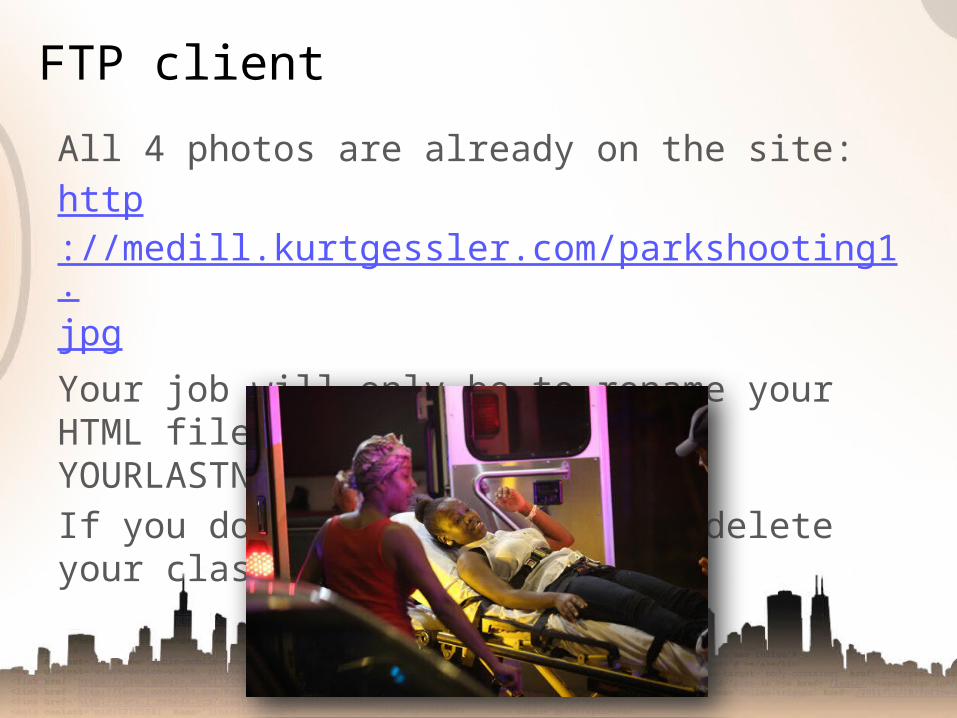
All 4 photos are already on the site:http://medill.kurtgessler.com/parkshooting1.jpgYour job will only be to rename your HTML file and FTP it. YOURLASTNAME.cornellpark.htmlIf you don’t rename, you will delete your classmate’s files …
FTP client
Google Fusion Tables II
We used Google Fusion Tables to illustrate and render a series of geopoints.
This week, we’ll introduce shapes, merge and layers.
This is where it gets more fun.
Last week
In addition to address and geopoints, Google Fusion Tables recognizes and renders KML data.So if you have the geometry and the data, you can do anything.
But you might have to do some converting of GIS or .shp files:http://www.mapsdata.co.uk/online-file-converter/
Keyhole Markup Language
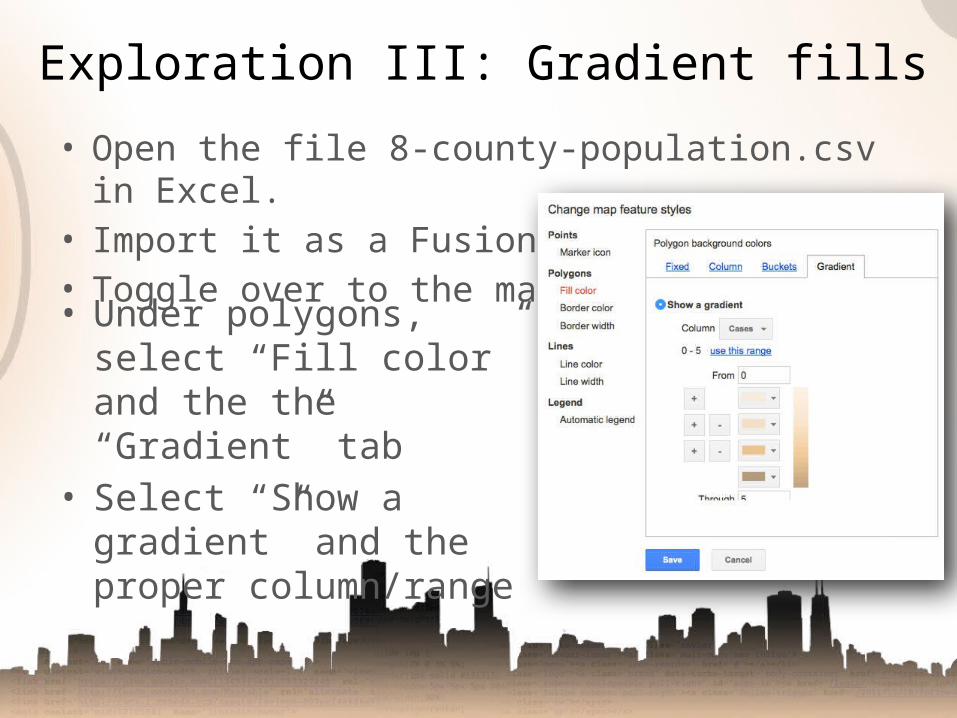
• Open the file 8-county-population.csv in Excel.
• Import it as a Fusion Table• Toggle over to the map tab
Exploration III: Gradient fills
• Under polygons, select “Fill color” and the the “Gradient” tab
• Select “Show a gradient” and the proper column/range
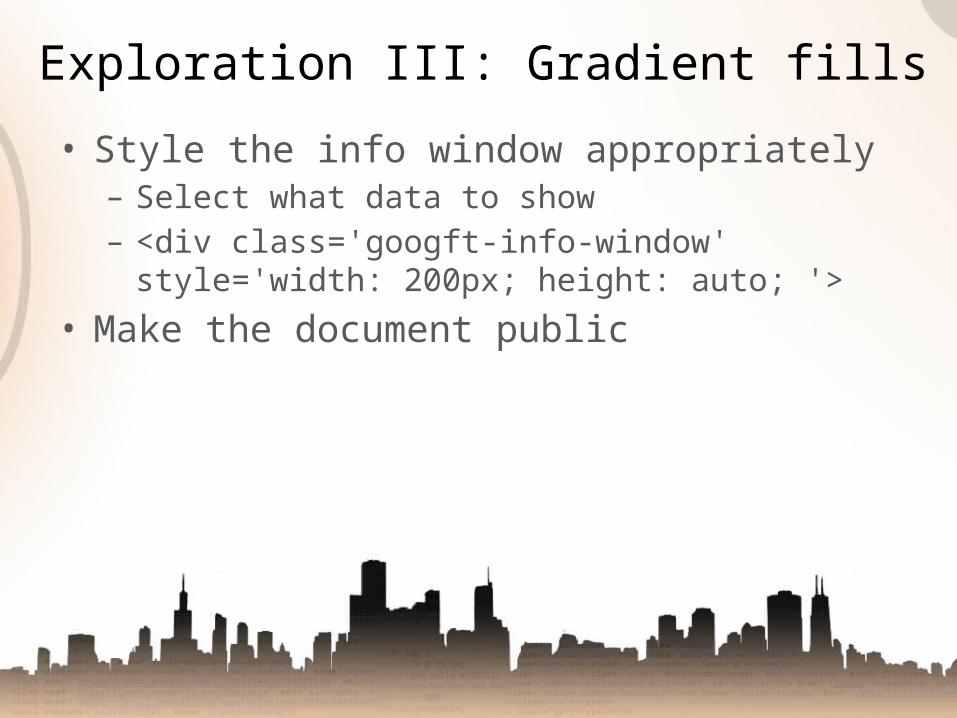
• Style the info window appropriately– Select what data to show– <div class='googft-info-window' style='width:
200px; height: auto; '>
• Make the document public
Exploration III: Gradient fills
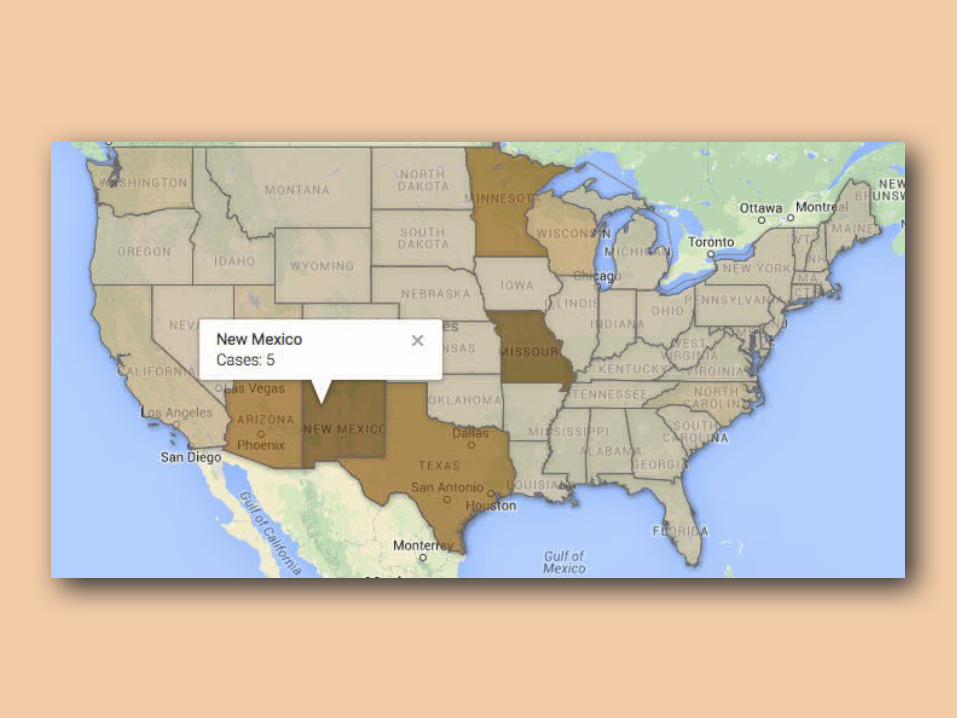
• Open the file listeria-outbreak-cases-2014.csv in Excel
• Import that file and us-50-states-FINAL.csv as GFTs
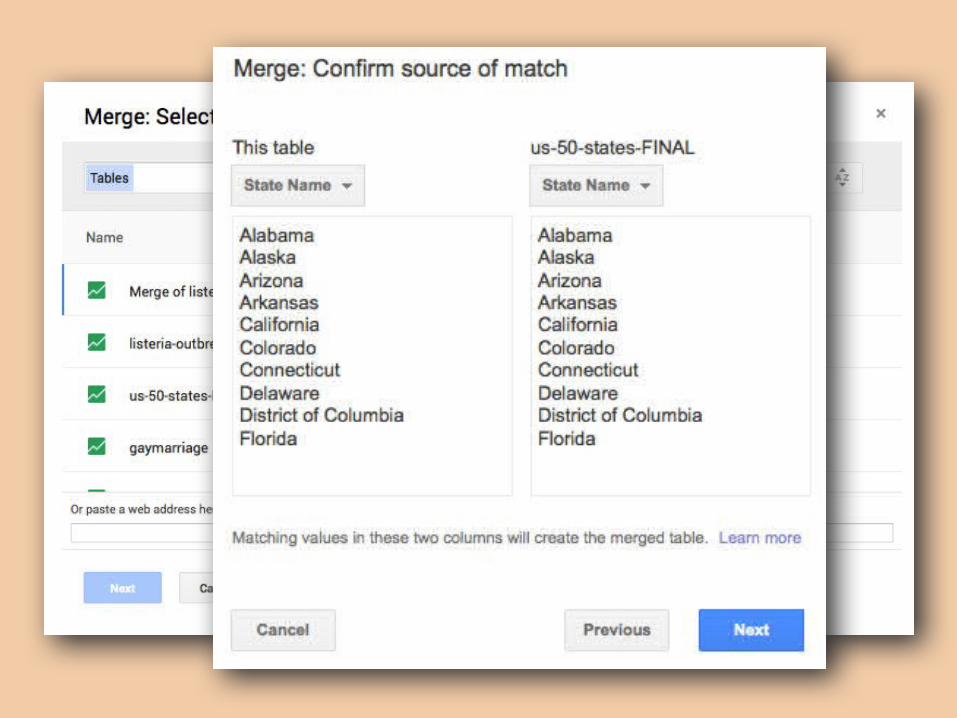
• From either file, select File/Merge with the other
• The program will then search for a similar column to correlate the data and then ask you to verify the merge
Exploration IV: Merge
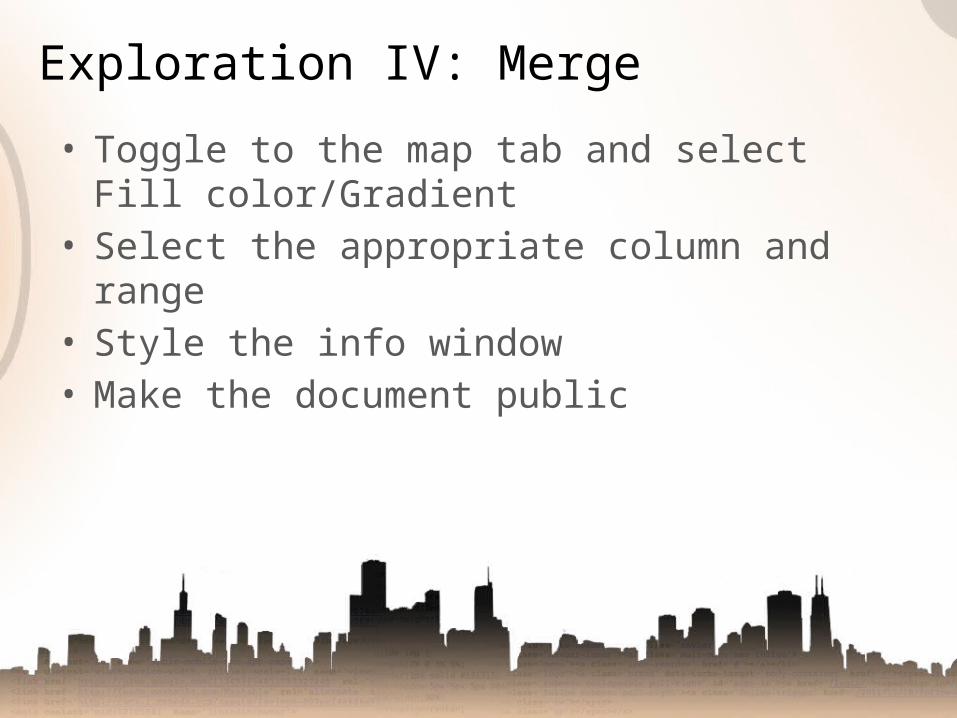
• Toggle to the map tab and select Fill color/Gradient
• Select the appropriate column and range• Style the info window• Make the document public
Exploration IV: Merge
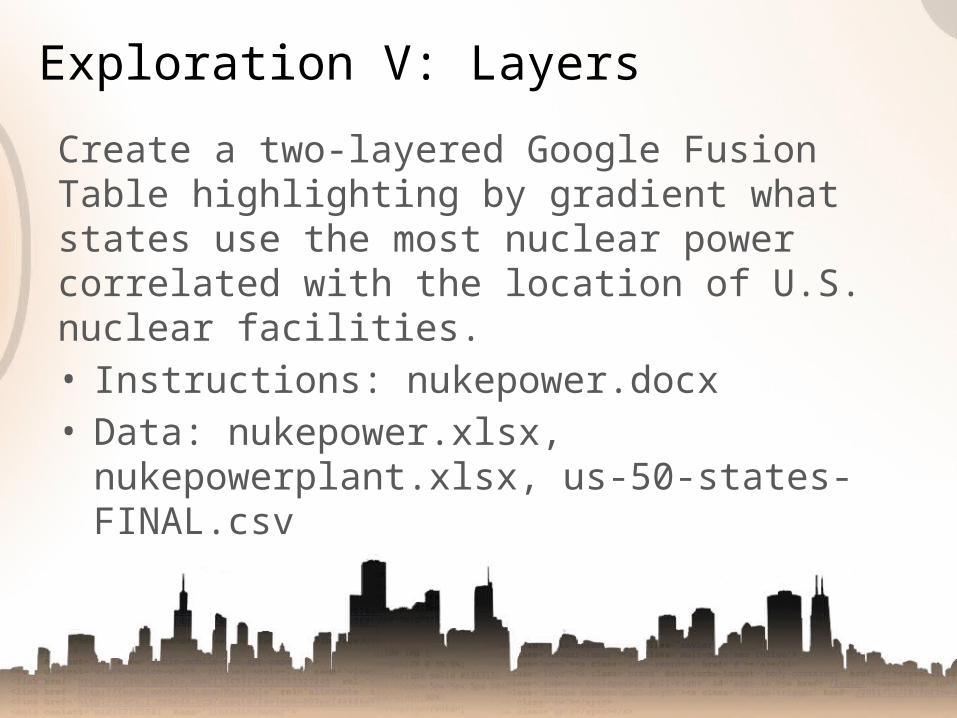
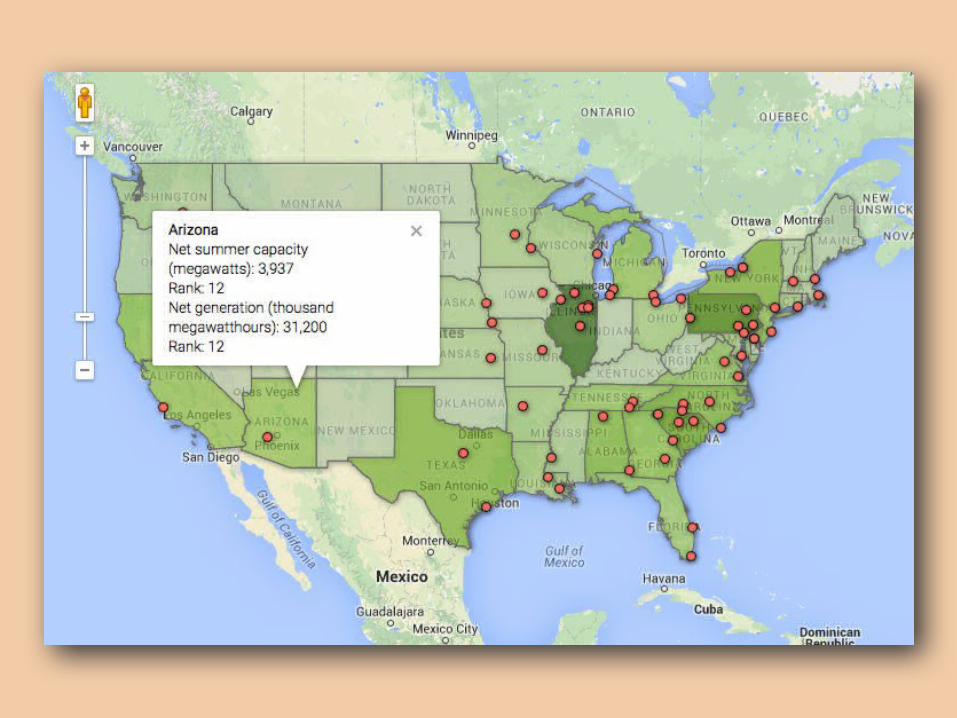
Create a two-layered Google Fusion Table highlighting by gradient what states use the most nuclear power correlated with the location of U.S. nuclear facilities.• Instructions: nukepower.docx• Data: nukepower.xlsx,
nukepowerplant.xlsx, us-50-states-FINAL.csv
Exploration V: Layers
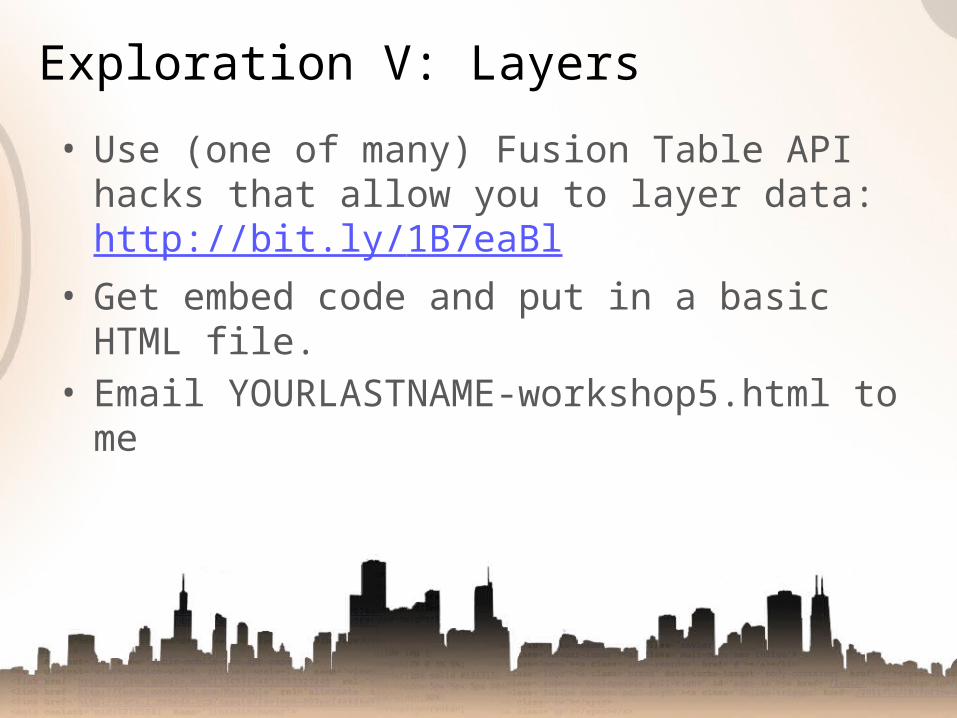
• Use (one of many) Fusion Table API hacks that allow you to layer data: http://bit.ly/1B7eaBl
• Get embed code and put in a basic HTML file.
• Email YOURLASTNAME-workshop5.html to me
Exploration V: Layers
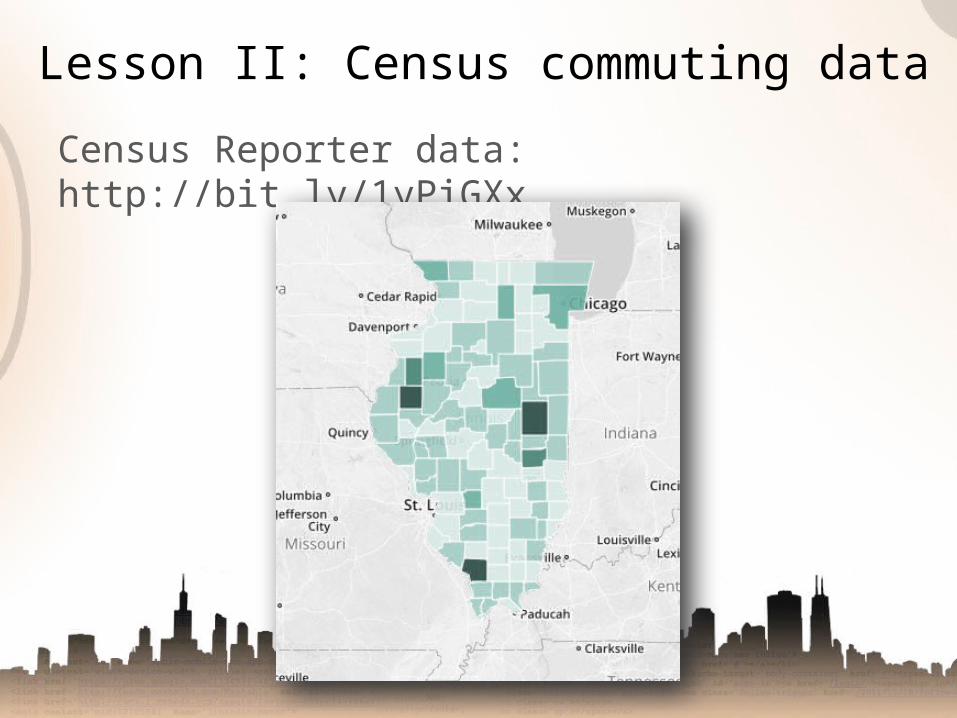
Census Reporter data: http://bit.ly/1yPiGXx
Lesson II: Census commuting data
Assignment: Create a two-layered Google Fusion Table highlighting by gradient where people in Illinois, by county, reported walking to work. We will then correlate this with a third data set as possible explanation. • Instructions: census-transit.docx• Data: illinois-colleges.xlsx, illinois-
commute.xlsx, clean-illinois-county.csv• Raw: walktowork.zip
Lesson II: Census commuting data
• BatchGeo• MapBox Tilemill• Tableau• geoJSON• QGIS• ArcGIS (ESRI)
Other mapping tools
• Leaflet (js library)• Highmaps (js
library)• D3 (js library)• Raphael (js library)• Kartograph.py
(python library)
Deadline: Tuesday, 11:59 p.m.• HTML III lesson 10 (FTP)• Google Fusion Tables lesson II (email)• Duckett: Chapter 8• Find a terrible headline on ChicagoTribune.com
from this week. Suggest a better one. I’ll use the best. (Email)
• Fun read: Personalization: http://bit.ly/1yuPfaZ• Fun read: Podcast renaissance: http://nym.ag/
1t0Ndz2• Fun read: Prepping for Kardashian: http://bit.ly/
1yLo0rJ
Homework
• Short break from HTML/CSS• Breaking news writing• Chart tools• Maybe timelines
Next up