Embed Size (px)
Citation preview
Measurements Statistics
An overview
Lesson Objectives
Review Quantitative descriptive research/ Survey Level of measurements
Descriptive Statistics
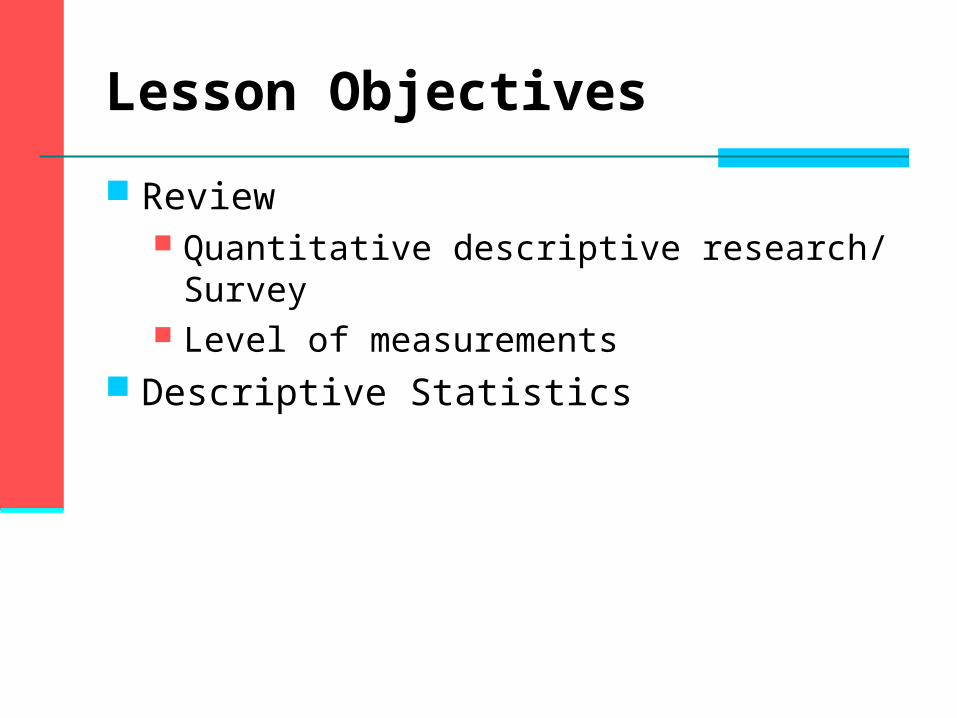
Define objectives Define resources available Identify study population Identify variables to study Develop instrument (questionnaire) Create sampling frame Select sample Pilot data collection Collect data Analyse data Communicate results Use results
Looking at descriptive survey
Levels of measurements
Quantitative and Qualitativevariables Quantitative variables are measured on an
ordinal, interval, ratio scale and nominal scale. If five-year old subjects were asked to name
their favorite color, then the variable would be qualitative. If the time it took them to respond were measured, then the variable would be quantitative
Ordinal
Measurements with ordinal scales are ordered in the sense that higher numbers represent higher values.
The intervals between the numbers are not necessarily equal. For example, on a five-point rating scale measuring attitudes toward gun control, the difference between a rating of 2 and a rating of 3 may not represent the same difference as the difference between a rating of 4 and a rating of 5.
There is no "true" zero point for ordinal scales since the zero point is chosen arbitrarily. The lowest point on the rating scale is usually chosen to be 1. It could just as well have been 0 or -5.
Interval scale
On interval measurement scales, one unit on the scale represents the same magnitude on the trait or characteristic being measured across the whole range of the scale. For example, if anxiety were measured on an
interval scale, then a difference between a score of 10 and a score of 11 would represent the same difference in anxiety as would a difference between a score of 50 and a score of 51.
Interval scale
Interval scales do not have a "true" zero point, however, and therefore it is not possible to make statements about how many times higher one score is than another. For the anxiety scale, it would not be valid to say that a person with a score of 30 was twice as anxious as a person with a score of 15. A good example of an interval scale is the
Fahrenheit scale for temperature. Equal differences on this scale represent equal differences in temperature, but a temperature of 30 degrees is not twice as warm as one of 15 degrees
Ratio scale
Ratio scales are like interval scales except they have true zero points. A good example is the Kelvin scale of temperature. This scale has an absolute zero. Thus, a temperature of 300 Kelvin is twice as high as a temperature of 150 Kelvin
Nominal scale
Nominal measurement consists of assigning items to groups or categories.
No quantitative information is conveyed and no ordering of the items is implied.
Nominal scales are therefore qualitative rather than quantitative. Religious preference, race, and sex are all
examples of nominal scales. Frequency distributions are usually used to analyze
data measured on a nominal scale. The main statistic computed is the mode. Variables measured on a nominal scale are often referred to as categorical or qualitative variables.
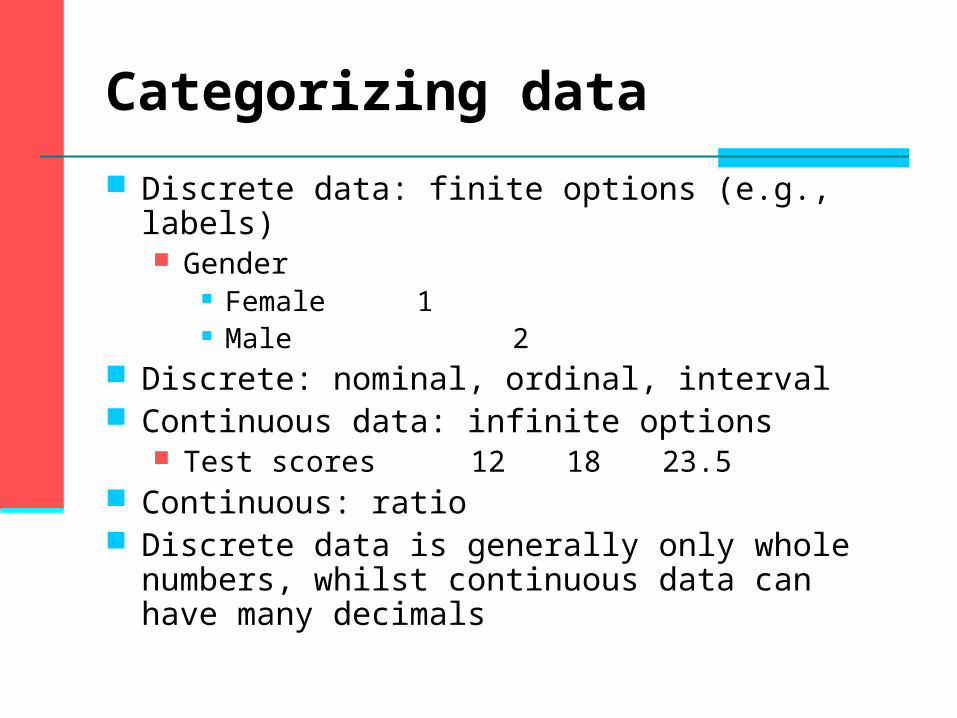
Categorizing data
Discrete data: finite options (e.g., labels) Gender
Female 1 Male 2
Discrete: nominal, ordinal, interval Continuous data: infinite options
Test scores 12 18 23.5 Continuous: ratio Discrete data is generally only whole numbers, whilst
continuous data can have many decimals
Descriptive vs. Inferential Statistics
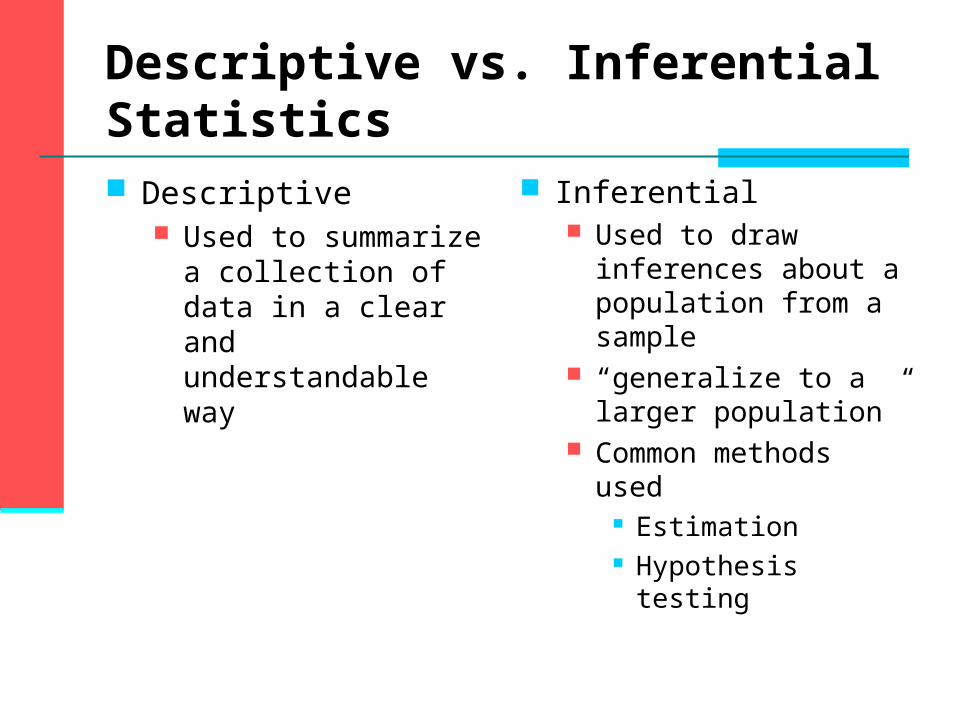
Descriptive vs. Inferential Statistics Descriptive
Used to summarize a collection of data in a clear and understandable way
Inferential Used to draw
inferences about a population from a sample
“generalize to a larger population”
Common methods used
Estimation Hypothesis testing
Descriptive Statistics
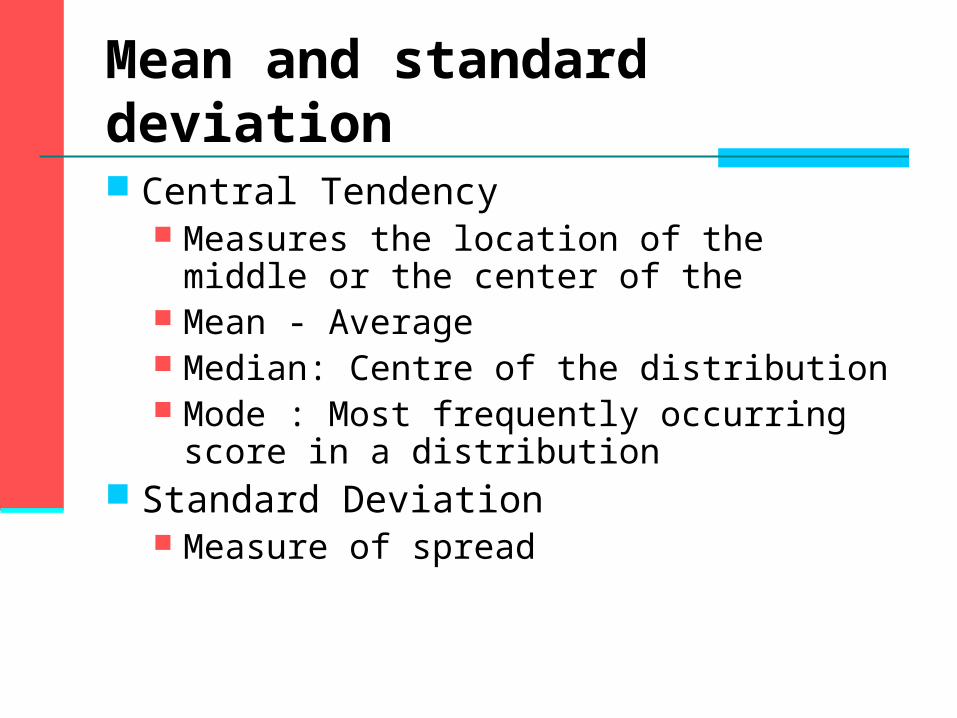
Mean and standard deviation Central Tendency
Measures the location of the middle or the center of the
Mean - Average Median: Centre of the distribution Mode : Most frequently occurring score in a
distribution Standard Deviation
Measure of spread
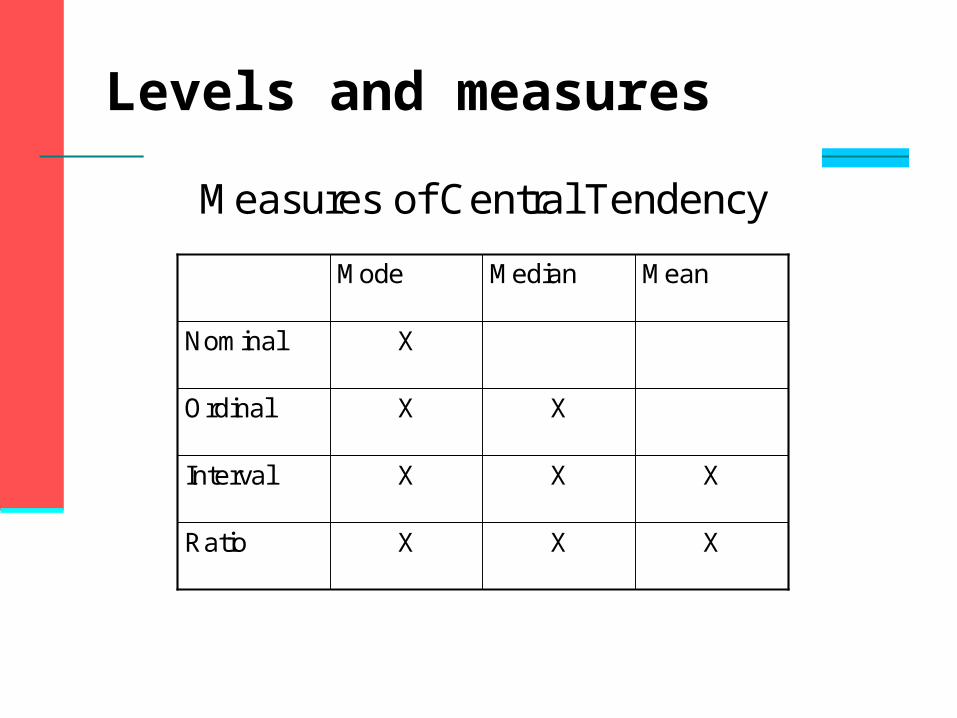
Levels and measures
Measures of Central Tendency
XXXRatio
XXXInterval
XXOrdinal
XNominal
MeanMedianMode
LEVELS OF MEASUREMENT
Link
Describing nominal data
Nominal data consist of labels e. g 1 = no, 2 = yes
Describe frequencies Most frequent Least frequent Percentages
Bar graphs
Frequencies
No. of individuals obtaining each score on a variable Frequency tables Graphically ( bar chart, pie chart) Also %
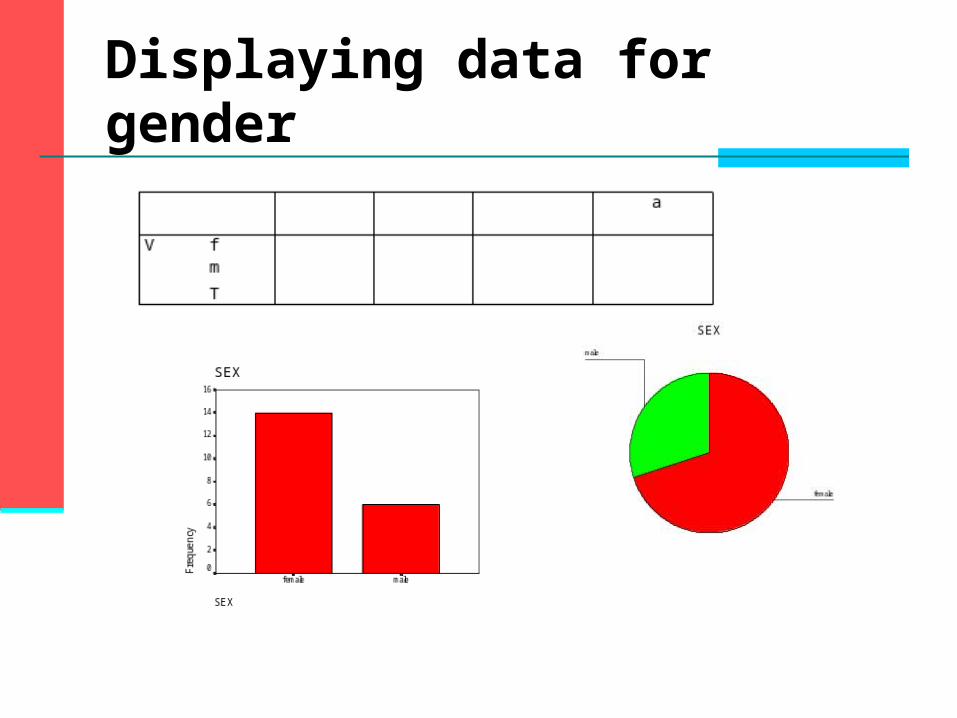
Displaying data for gender
Mode
Most common score Suitable for all types of data including
nominal Example:
Test scores: 16, 18, 19, 18, 22, 20, 28, 18
Describing ordinal data
Data shows order e.g ranks Descriptives
frequencies, mode Median Min, max
Display Bar graph Stem and leaf
Example: Stem and Leaf Plot
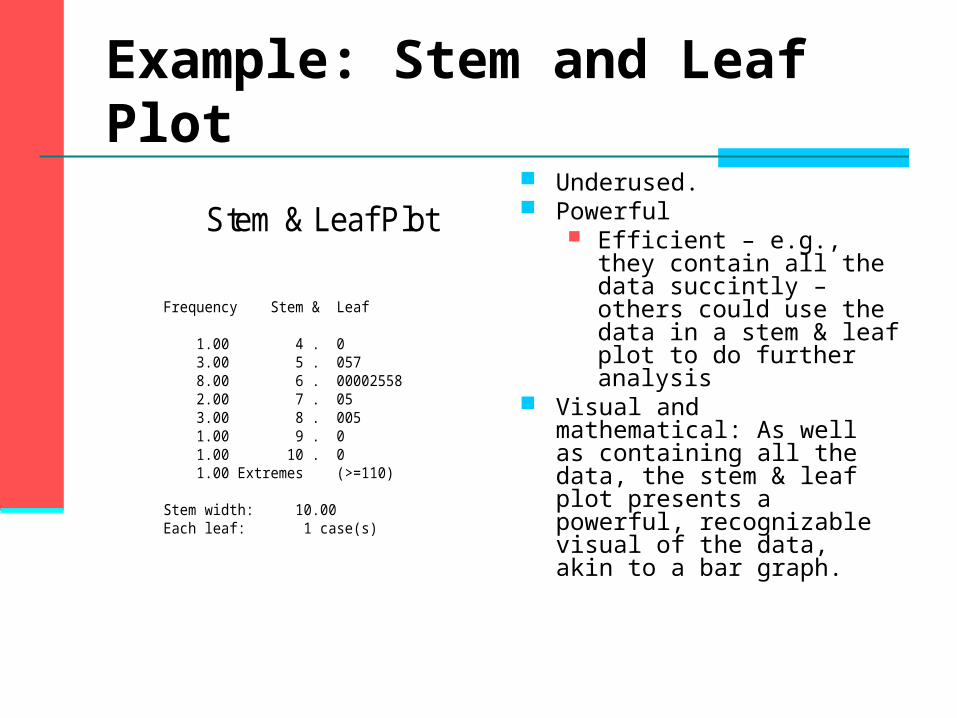
Stem & Leaf Plot
Frequency Stem & Leaf
1.00 4 . 03.00 5 . 0578.00 6 . 000025582.00 7 . 053.00 8 . 0051.00 9 . 01.00 10 . 01.00 Extremes (>=110)
Stem width: 10.00Each leaf: 1 case(s)
Underused. Powerful
Efficient – e.g., they contain all the data succintly – others could use the data in a stem & leaf plot to do further analysis
Visual and mathematical: As well as containing all the data, the stem & leaf plot presents a powerful, recognizable visual of the data, akin to a bar graph.
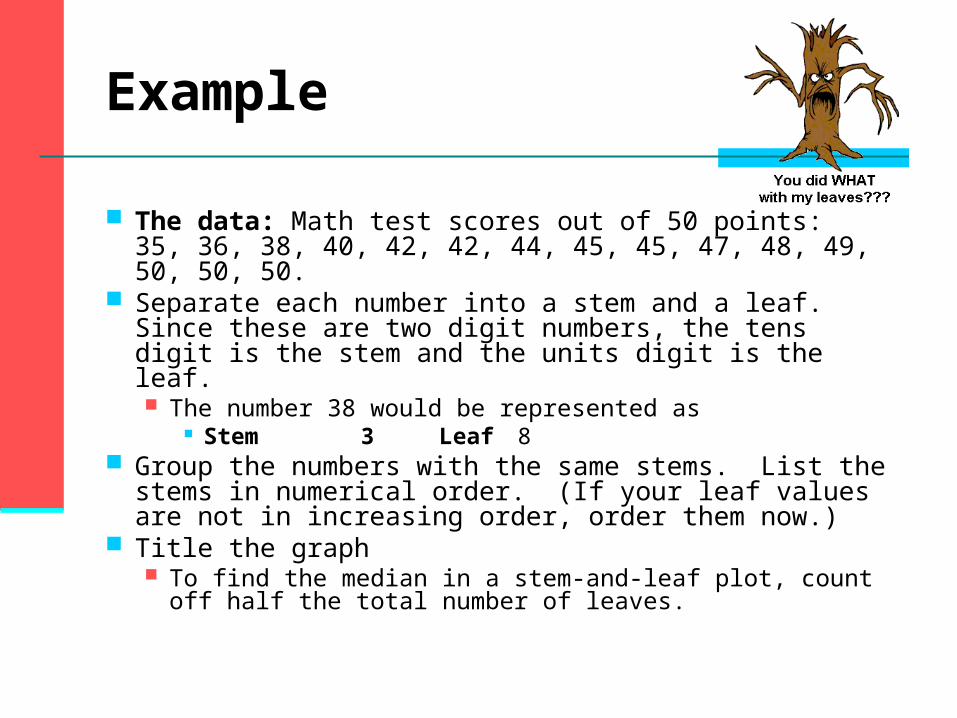
Example
The data: Math test scores out of 50 points: 35, 36, 38, 40, 42, 42, 44, 45, 45, 47, 48, 49, 50, 50, 50.
Separate each number into a stem and a leaf. Since these are two digit numbers, the tens digit is the stem and the units digit is the leaf. The number 38 would be represented as
Stem 3 Leaf 8 Group the numbers with the same stems. List the
stems in numerical order. (If your leaf values are not in increasing order, order them now.)
Title the graph To find the median in a stem-and-leaf plot, count off
half the total number of leaves.
Describing interval data
Interval data are discrete but also treated as ratio/continuous
Descriptives Mode Median Min, max Mean if treated as continuous
Distribution
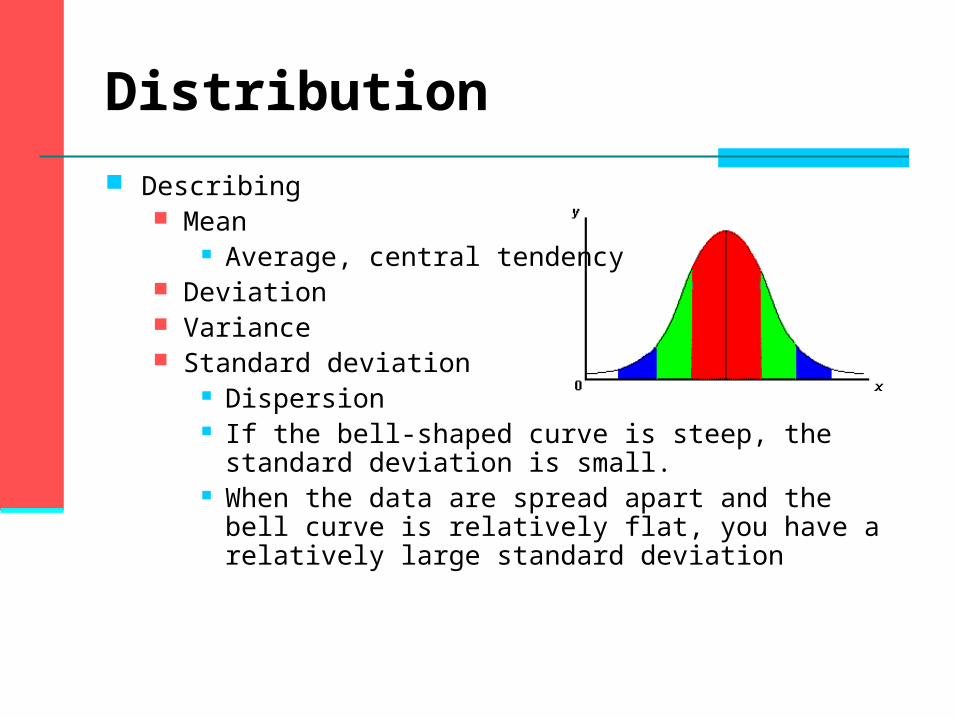
Describing Mean
Average, central tendency Deviation Variance Standard deviation
Dispersion If the bell-shaped curve is steep, the standard deviation
is small. When the data are spread apart and the bell curve is
relatively flat, you have a relatively large standard deviation
Distribution
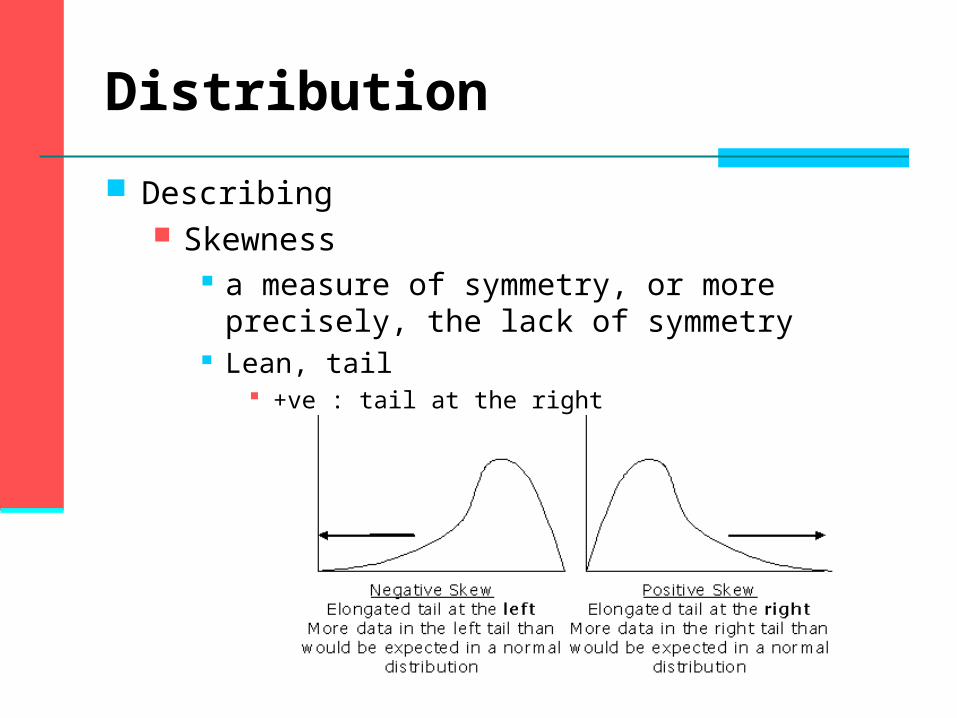
Describing Skewness
a measure of symmetry, or more precisely, the lack of symmetry
Lean, tail +ve : tail at the right
Distribution
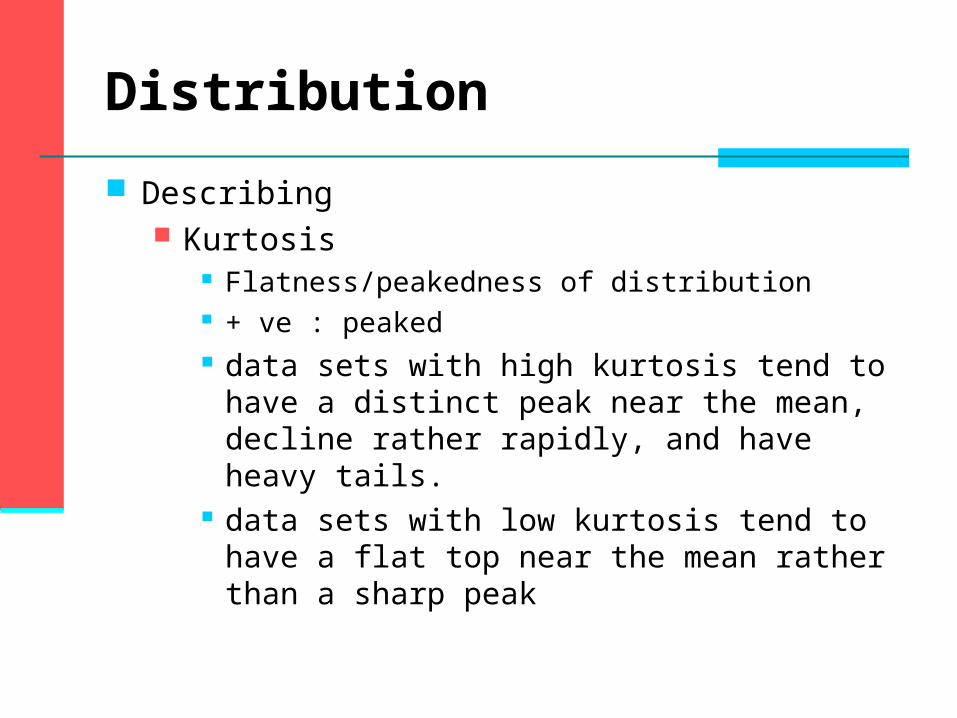
Describing Kurtosis
Flatness/peakedness of distribution + ve : peaked data sets with high kurtosis tend to have a distinct
peak near the mean, decline rather rapidly, and have heavy tails.
data sets with low kurtosis tend to have a flat top near the mean rather than a sharp peak
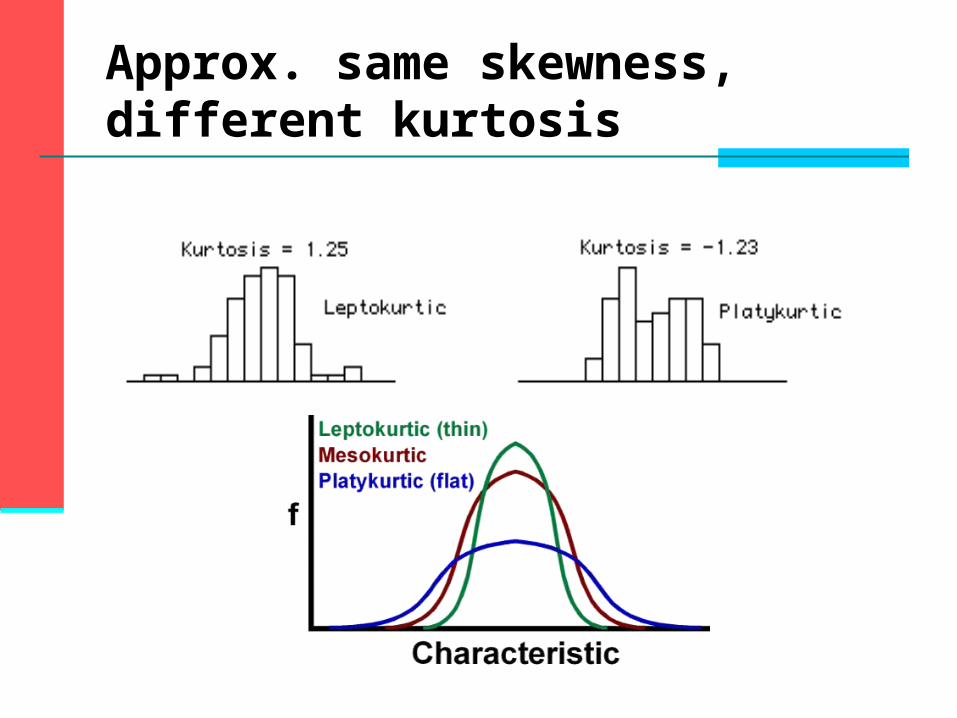
Approx. same skewness, different kurtosis
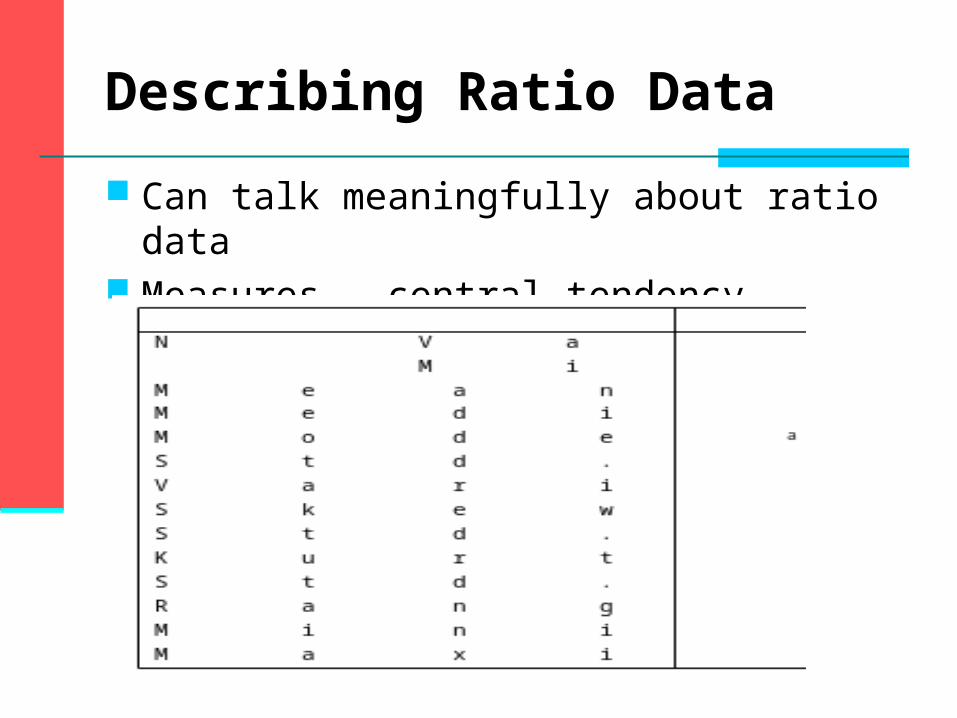
Describing Ratio Data
Can talk meaningfully about ratio data Measures - central tendency, dispersion
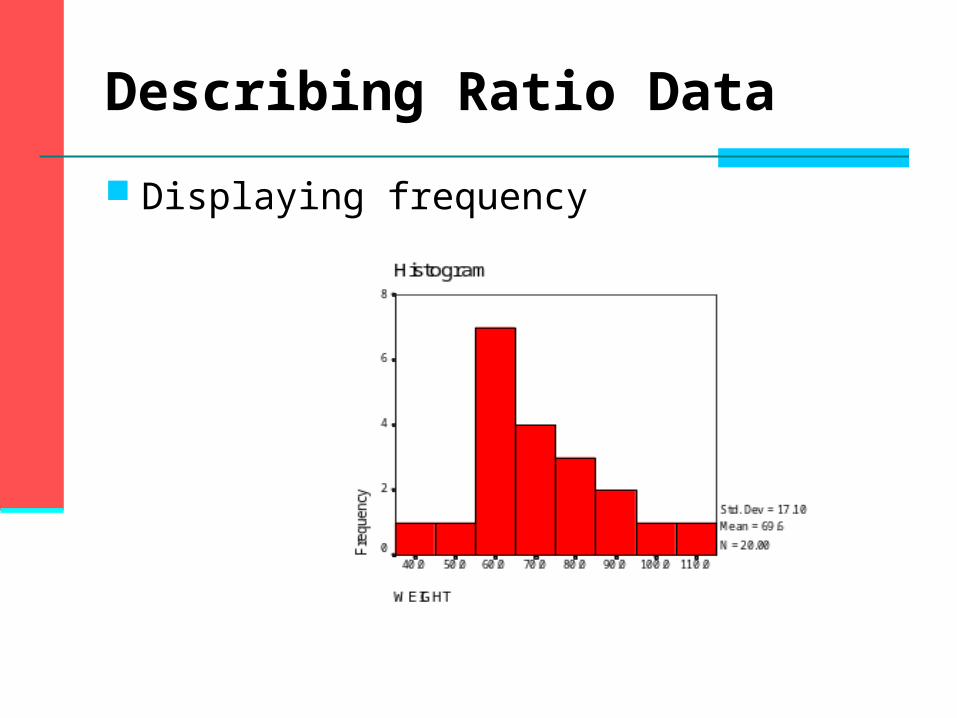
Describing Ratio Data
Displaying frequency
LET’S LOOK AT DATASleepiness
Determining Reliability
Reliability Reliability is defined as the ability of a measuring
instrument to measure the concept in a consistent manner
To determine Split half analysis- answers on the first half of the
questionnaire are compared to the second half of the questionnaire
If there is a high correlation – internally consistent / reliable
Determining Reliability Coefficient Cronbach’s Alpha
Examines average inter item correlation of the items in the questionnaire
If all items measuring the exact same thing, = 1
= 0.7 or more – reliable Use SPSS
Inferential Statistics
Next