Embed Size (px)
Citation preview

Interactive News Editing and
ProductionThursday, March 5

• Web metrics and analytics
• Document publishing
• CSS/HTML5 bug hunt
Today’s agenda

Web metrics and analytics

Sorry I have to do this to you ...

#thedress
26 million visits in a single day for Buzzfeed.
It’s an unparalleled success born in a culture of
technology built that embraces using metrics to
identify trends and capture audience.
N.Y. Business Journal: http://bit.ly/1aM9PeA
Medium: http://bit.ly/17T1vrI

Content (does it make you smarter, teach you something, emotional connection)
Author
Availability/virality
Technology
Audience demand for that information
Brand loyalty/trust
Placement
Image
Headline clickability
Peer influence
What creates a pageview?
“Each of these components might be used to
make better editorial choices — such as
increasing promotion of an important story,
choosing what to report on next, or evaluating
whether a story really changed anything. But it
can be hard to disentangle the factors. The
number of times a story is viewed is a complex,
mixed signal.”
More: http://bit.ly/1M7Hs6h
What opportunity does a pageview create?

We’ll discuss an overview of today’s digital
measurement landscape, the terminology and
tools used, and how they can help to grow
audience.
Metrics 101

Metrics is quantitative data about user activity.
Analytics is analyzing that data for actionable
interpretation.
“Metrics is to accounting as analytics is to
finance”
Metrics = information
Analytics = strategic analysis
Metrics 101

• Google Analytics
• Adobe Analytics (aka Omniture SiteCatalyst)
• Chartbeat
• Social (Simply Measured, Twitter Analytics,
Facebook Insights – the ones you know)
Tools

What's the difference?
• Google Analytics is free.
• Omniture is more powerful, often moreso
than necessary.
• Chartbeat measures real time behavior. Why
is that better?
Tools
Both good and bad ways, for both short-term
and long-term goals, according to the Reynolds
Journalism Institute’s Analyzing Analytics
report: http://bit.ly/1DXzU48
How are metrics used in a newsroom?
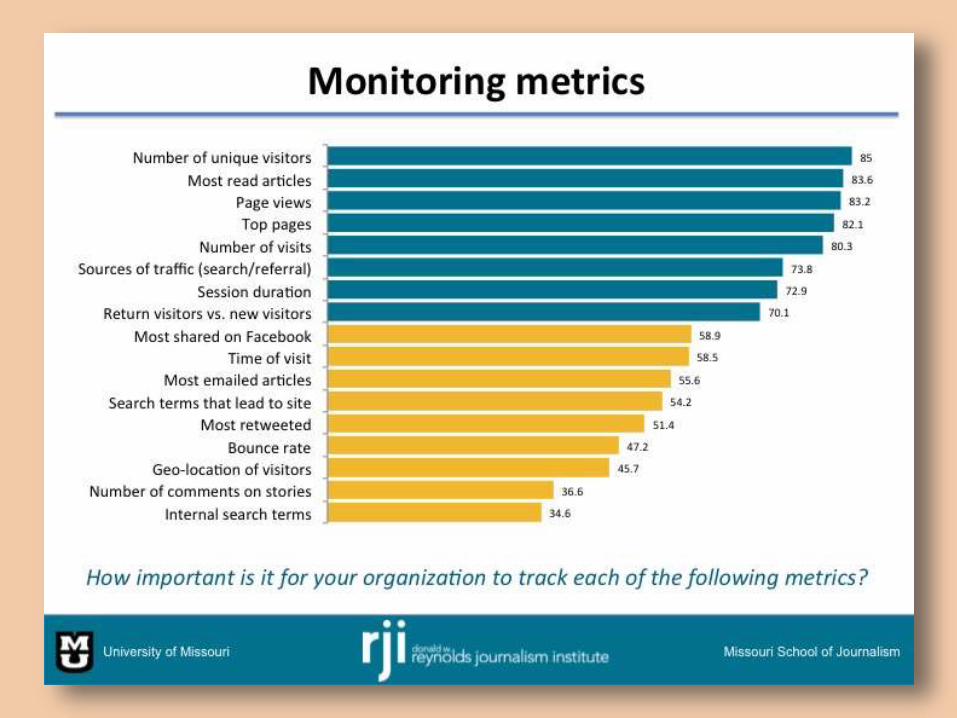


What are commonly watched metrics and what
do they mean:
• Pageviews: A pageview or page impression is
a request to load a single HTML file of an
Internet site.
• Visitors: The number of users on your
platform for a selected hour, day, week,
month, quarter, or year. Can also segment
new or returning.
The metrics glossary

• Unique Visitors: A UV refers to a visitor who
visits a site for the first time within a specified
time period (daily, monthly).
• Visits (Sessions in GA): A sequence of page
views in a sitting. The visits metric is
commonly used in reports that display the
number of user sessions within the selected
time period.
• Pageviews Per Visit: # of PVs during a
discrete visit.
The metrics glossary

• Average page depth: This metric is valuable
in determining how far within a visit your
audience reaches a given page.
• Time spent/average time spent: Metrics that
report on the amount of time visitors spend
on a page, site, or per visit.
• Designated Market Area (DMA): Attempts to
ID users from a Nielsen area.
The metrics glossary

• Traffic sources: Percentage of visits referred
by social media, organic search, or “direct”
(URL or bookmarked).
• Device type: Percentage of visits on desktop,
phones or tablets.
• Top sections
• Top content type: Segment content by type,
such as articles or photogalleries.
The metrics glossary
• Natural search keywords: What terms did
people search to get them to your content.
Google no longer shares this.
The metrics glossary

• Bounce rate: Percentage of users who go to
a page but do not interact with it.
Metrics and analytics 102

• Time of day/day of week, hourly by device: A
segmented report that aims to understand
when users are accessing your content and
via what device.
Metrics and analytics 102


• Total time reading (TTR): A measure of time
people spend on story pages that is used by
both Upworthy and Medium to estimate of
whether users are getting value out of their
content.
Metrics and analytics 102

• Engaged Time: Chartbeat’s measure of the
time your visitors actively spend with your
content. According to its research, “there’s a
strong correlation between visitors’
engagement and their propensity to return to
a website; visitors who read an article for
three minutes return twice as often as those
who read for one minute.”
• So, engaged time = loyal reader
Metrics and analytics 102


• Dark social: Many analytics programs identify
this traffic as coming “direct” or from typed-in
links or bookmarks. Coined by Alexis
Madrigal.
• According to new data on many media sites,
69% of social referrals came from dark social
while only 20% came from Facebook. But
dark social is mostly Facebook.
• Gigaom: http://bit.ly/1M97mbu
Metrics and analytics 102


• Total engagement: My blend of metrics,
combining PVs beyond the story, off-site
traffic sources, on-site page flow and
engaged time.
• Suggests the top content is deep (has a high
PPV and and keeps you engaged for longer
durations), is sticky (keeps you on site) and is
driven by social, search or other sites.
Metrics and analytics 102

Sorry, I can’t give you the keys.
• My dashboard
• A top page summary
• Election center in Google Analytics
Tours of Adobe and Google
• Chartbeat is real-time analytics software that
checks in every few seconds with your site’s
users to see where they are, what they’re
doing and how they got there. And because it
checks in every few seconds, it can
determine how long users are spending on
that content – engaged time.
• Chartbeat is two primary components:
Editorial Dashboard and the Heads Up
Display.
Tour of Chartbeat


Chartbeat HUD: Installed as an overlay on your
browser.
What does it do? Measures in real time how
users are interacting with the content on a
single page and ranks it against all content on
that page (numerically) and against historic
data for that position and specific times
(colors).
Tour of Chartbeat

What doesn’t it do? It doesn’t tell you the top
story on your site. It doesn’t take into
consideration other ways people could find
content on a site (search, social). Nor would it
track links that leave your core domain. It also
doesn’t contrast types of content – video,
premium, etc.
What’s it good for? Determining story play.
Determining a piece of content’s life cycle.
Testing and refining headlines or images.
Tour of Chartbeat

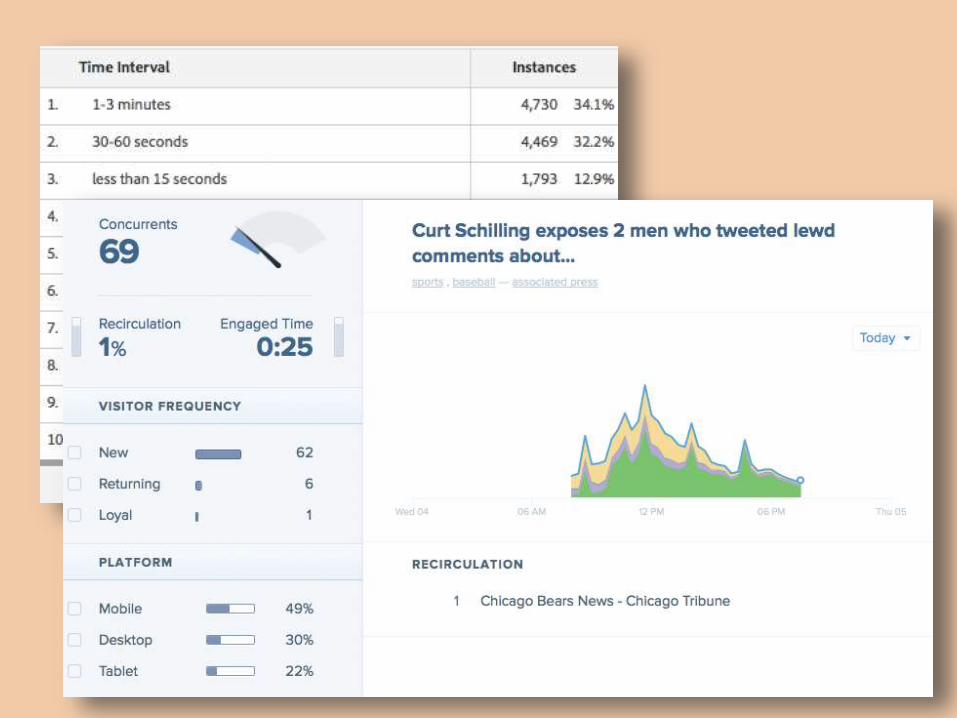
Myth 1: We read what we’ve clicked on
A stunning 55% spent fewer than 15 seconds
actively on a page. The stats get a little better if
you filter purely for article pages, but even then
1 in every 3 visitors spend less than 15
seconds reading articles they land on.
Metrics myths

Myth 2: We read what we share
Chartbeat research show that among articles it
tracked with social activity, there were only one
tweet and eight Facebook likes for every 100
visitors.
Metrics myths


Myth 3: Unique visitors are truly unique
If you visit a site on your phone, on your tablet,
on your work PC and on your Mac at home, GA
and AA data will show you as four unique
visitors.
Metrics myths

Myth 4: Engaged time is universal across
metrics programs
There’s a huge different in methodology
between a realtime metrics app like Chartbeat
and Omniture.
Let’s look at the Curt Schilling story …
Metrics myths

Buzzfeed’s Jonah Peretti: “I feel like what you
see in the industry now is people jumping
around and trying to find the God metric for
content. It’s all about shares or it’s all about
time spent or it’s all about pages or it’s all about
uniques. The problem is you can only optimize
one thing and you have to pick, otherwise all
you’re doing is making a bunch of compromises
if you try to optimize for multiple things.”
Why no metric is perfect

Peretti: “So you pick the one that matters and
maybe you have minimum thresholds for a few
others. The problem with that is that the natural
inclination, if one metric is seen as the
important, true metric … is to game it. And then
when you game it, you essentially are creating
a fake version of that metric.”
Why no metric is perfect

Peretti: “So pageviews are a metric of how
many stories people want to read—and then
you split the story in two. You essentially are
doubling your pages for that story, or not quite,
probably, because not everyone will click. But
you create pyrite pageviews.”
More on Medium: http://bit.ly/1BK4Gyf
Why no metric is perfect

• All the links above and …
• Medium: A mile wide, an inch deep:
http://bit.ly/1GmjfdJ
• Upworthy’s shift to TTR: http://u.pw/18Ssi8T
• Tony Haile on engagement minutes:
http://ti.me/1giECic
• Gawker says the traffic game is over:
http://bit.ly/1Gmjx4h
Good reading

• Google Analytics Academy:
http://bit.ly/1B9ohWI
On the class site are:
• My guide to Chartbeat
• Chartbeat guide to Traffic Sources and
Audience Behvaior
• Adobe Analytics reference guide
Good resources

• Team up with one other person.
• Download the file reports.zip from the class
sure and follow the instruction metrics-
workshop.docx. Answer those questions by
using the 20 Adobe Analytics reports in that
folder.
• How-to read reports reminder
Workshop I: Metrics scavenger hunt

Document publishing

• DocumentCloud is both a repository of
primary source documents to internal sharing
and a tool for publishing those documents.
• Scribd is just a tool for publishing not sharing.
• In our quest for transparency and
authenticity, we not only encourage but also
insist that these materials get published along
with the story.
DocumentCloud 101

• Is there a demand? Yes, a huge one. The
Ferguson report did better than the story it
was on.
• We’ve seen this behavior on major stories
like Bridgegate, Sandy Hook, court cases, etc
…
DocumentCloud 101

• Single responsive document: Ferguson report
• Single annotated document: FRA derailment
• Single annotated document: NIOSH
firefighter deaths report
• Document collection: Jesse Jackson Jr. case
file
Examples

• Supports many file types
• Embed a single document, single note or
series of documents
• Can edit a document, add/subtract/reorder
pages
• Annotate and redact documents
DocumentCloud features

• Download the file documents.zip. Upload the
file rick-perry-indictment.pdf into your
account.
• Follow the instructions in the file
documentcloud-workshop.docx.
Workshop II: Rick Perry

• Upload the file doj-report-into-ferguson-
police-department.pdf into your account.
• Process the document and make it live,
annotating at least 5 passages of your
choice.
• When you publish it, follow the responsive
instructions in the DocumentCloud primer on
the class site (documentcloud-primer.pdf).
Homework I: Ferguson police report
• To make DocumentCloud responsive. Set
embed to full page. Hide sidebar. Then, in the
embed code, add “responsive: true,” here …
sidebar: false, responsive: true, container:
“#DV-viewer-1376717-cia-report”.
• Only the NYT and Chicago Tribune are beta
testing this feature, so you’re all pretty cool.
Homework I: Ferguson police report

• There are at least 10 errors in the HTML and
CSS files of the final Drew Peterson
homepage.
• Download the file drew-peterson.zip and
follow the instructions in the file bughunt-
instructions.docx.
• This is an extra credit assignment.
Homework II: HTML5/CSS bug hunt

• Deadline: Tuesday, 11:59 p.m.
• Process and publish Ferguson police report
• Optional CSS/HTML5 bug hunt
Homework recap

• Tableau
• Photoshop
• Media trends
Last up