Embed Size (px)
Citation preview
lable at ScienceDirect
Renewable Energy 76 (2015) 53e65
Contents lists avai
Renewable Energy
journal homepage: www.elsevier .com/locate/renene
A hybrid maximum power point tracking for partially shadedphotovoltaic systems in the tropics
Lian Lian Jiang a, *, D.R. Nayanasiri b, Douglas L. Maskell a, D.M. Vilathgamuwa c
a School of Computer Engineering, Nanyang Technological University, 50 Nanyang Avenue, Singapore 639798, Singaporeb School of Electrical & Electronic Engineering, Nanyang Technological University, 50 Nanyang Avenue, Singapore 639798, Singaporec Science and Engineering Faculty, Queensland University of Technology, 2 George St, GPO Box 2434, Brisbane, QLD 4001, Australia
a r t i c l e i n f o
Article history:Received 22 August 2014Accepted 3 November 2014Available online
Keywords:Photovoltaic systemPartial shading conditions (PSCs)Maximum power point trackingArtificial neural networkPerturb and observe
* Corresponding author. Centre for High Perfor(CHiPES), School of Computer Engineering, N4-02a-3Technological University, Singapore 639798, Singafax: þ65 6792 0774.
E-mail addresses: [email protected] (L.L. Jia(D.R. Nayanasiri), [email protected] ([email protected] (D.M. Vilathgamuwa).
http://dx.doi.org/10.1016/j.renene.2014.11.0050960-1481/© 2014 Elsevier Ltd. All rights reserved.
a b s t r a c t
Partial shading and rapidly changing irradiance conditions significantly impact on the performance ofphotovoltaic (PV) systems. These impacts are particularly severe in tropical regions where the climaticconditions result in very large and rapid changes in irradiance. In this paper, a hybrid maximum powerpoint (MPP) tracking (MPPT) technique for PV systems operating under partially shaded conditionswitapid irradiance change is proposed. It combines a conventional MPPT and an artificial neural network(ANN)-based MPPT. A low cost method is proposed to predict the global MPP region when expensiveirradiance sensors are not available or are not justifiable for cost reasons. It samples the operating pointon the stairs of IeV curve and uses a combination of the measured current value at each stair to predictthe global MPP region. The conventional MPPT is then used to search within the classified region to getthe global MPP. The effectiveness of the proposed MPPT is demonstrated using both simulations and anexperimental setup. Experimental comparisons with four existing MPPTs are performed. The resultsshow that the proposed MPPT produces more energy than the other techniques and can effectively trackthe global MPP with a fast tracking speed under various shading patterns.
© 2014 Elsevier Ltd. All rights reserved.
1. Introduction
Solar photovoltaic (PV) systems are of particular interest due totheir lowmaintenance, the abundance of the energy source, almostzero post-production pollution and the continually improving ef-ficiency due to advancements in semiconductor and power elec-tronic devices. The output power of PV systems varies with theintensity of the solar irradiance and the environmental tempera-ture. Due to the nonlinear currentevoltage (IeV) characteristic ofthe solar cell, there is a uniquemaximum power point (MPP) on thepowerevoltage (PeV) curve. In order to extract the maximum po-wer, anMPP tracking (MPPT) device is usually inserted between thePV array(s) and the system load.
As more and more PV systems are installed worldwide, often inlocationswith a less than optimal solar irradiance profile (such as in
mance Embedded Systems2, Nanyang Avenue, Nanyangpore. Tel.: þ65 83589341;
ng), [email protected]), donmahinda.
the tropics), it is becoming more important that appropriate tech-niques for maximizing the energy capture be employed. Tropicalclimates are characterized by a large number of rapid irradiancechanges [1] due to the prevailing environmental conditions. Forexample, in Singapore, which is just 1.5� north of the equator, thereis little variation in temperature year round (usually the diurnalvariation is between 22 �C and 35 �C), with a high relative humidity(the mean annual relative humidity is 84.2%). Unlike tropical re-gions further from the equator which have well defined wet anddry seasons, Singapore has no distinct wet or dry season, withsignificant rainfall throughout the year. Thus, there is significantmoving cloud cover which results in rapid temporal and spatialirradiance change [1]. These irradiance changes contribute to par-tial module/array shading and rapid ramp rates, both of which canimpact on the energy capture. Therefore, the ability to rapidly trackthe global MPP under partial shading conditions (PSCs) so that thepower output from the PV array can be maximized is important forPV systems in tropical regions. This must be coupledwith a lowcostand a simple implementation.
In recent years, a large number of MPPTmethods to increase thepower harvest have been reported in the literature [2e7]. Thesemethods can be classified mainly into three general categories:conventional optimization algorithms [2,3,8e17], artificial
L.L. Jiang et al. / Renewable Energy 76 (2015) 53e6554
intelligence based MPPT algorithms [3,4,18e27], and othermethods [28e32], and can be found in both centralized [1e4,26],distributed [28], and combined [6,7] MPPT configurations.
Among the existing conventional centralized MPPT methods,the perturb and observe (P&O) (or hill climbing) [2,10] and in-cremental conductance (IncCond) [8,9] methods are widely usedin commercial products. They feature a simple implementationand low system cost. However, they are efficient only when theirradiance distribution is uniform and without rapid change.When the irradiance on PV modules become non-uniform (orpartially shaded), they are unable to track the multiple MPPs andoften become stuck at a local MPP resulting in a significant powerloss of up to 70% [33]. Ripple correlation control (RCC) andextremum seeking control (ESC), which utilize the inherent rippleto find the optimum, are considered very fast, of the order of theswitching frequency of a power electronic converter [34,35].However, like the standard P&O and IncCond algorithms, they areefficient only with PV systems with a unique MPP. In order to solvethis problem, a number of global MPPTs are studied. In Refs.[11,14], the load line basedMPPTs are proposed. The main idea is tomove the operating point to the vicinity of the global maximumfirst and then apply a conventional MPPT method, such as P&O orIncCond, to search for the global MPP within the local area. Thesemethods exhibit a much better tracking ability than the standardP&O and IncCon algorithms for the case with multiple powerpeaks. However, this technique is unable to ensure that the in-tersections for both methods are located in the vicinity of theglobal MPP for all shading patterns. In addition, the additionalcircuits for measuring the short circuit current and open circuitvoltage online add complexity to the system. Sweeping methods,such as the current [36], voltage [12] and power sweep [16]methods, are based on perturbing the working point succes-sively by increasing the current, voltage or power (based on thetype of sweep) of the PV array. This type of MPPT can find theglobal MPP with good accuracy, but the MPP tracking speed islimited due to their iterative scan procedure. In Refs. [13], an MPPTalgorithm based on the Fibonacci sequence was presented but itcannot guarantee converge to the global MPP for all circumstances.An optimization algorithm based on dividing rectangles, calledDIRECT, was applied to MPPT in Ref. [15]. It has the advantage ofavoiding the gradient calculation. However, the algorithm is un-able to converge to the global MPP for all shading patterns and isheavily dependent on the control parameters set by the user. Avoltage window search technique [37] was recently proposed, butits ability to track the MPP largely depends on the choice of theinitial operating point.
Compared to conventional MPPT, various computational algo-rithm based MPPT methods, such as, fuzzy control [18], neuralnetwork [19,38], particle swarm optimization (PSO) [21,39], anddifferential evolution (DE) [23,24], etc., have been shown to providegood performance particularly in tracking the global MPP. However,they each have their own limitations. For instance, most requireexperience in setting the parameters for the MPPT algorithm andtake a relatively long time to reach the global MPP. The computa-tional algorithm based MPPTs are usually based on stochasticsearch theory and use an iterative process to control the operatingvoltage of the PV array according to the update scheme of the in-dividual algorithm. Thus, these methods generally suffer from aslow tracking speed or premature convergence.
Many other methods such as the voltage compensation method[30], interconnection method [31] and multilevel dc-link inverter[32], etc. have also been proposed to solve the partial shadingproblem. However, they either have a complex control process or aslow tracking speed. Many other related MPPT methods can befound from literature reviews in Refs. [2e5].
Distributed MPPT [7,28] is another promising technique toextract the maximum power from the PV system under partiallyshaded conditions. Compared to centralized MPPT, PV systemsequipped with distributed MPPT provide a significant increase inenergy harvest during PSC. This increase can be up to 39% for a largeplant with parallel high voltage thin-film module strings, and up to58% for smaller systems using a lower voltage with 8 series thin-film modules per string [29]. In addition, a power increase ofmore than 30% has been reported for mono-crystalline Si PVmodules [28]. However, the advantages of distributed MPPT aredependent on the particular installation and the cost of the addi-tional electronics, and are only marginally cost effective for small tomedium sized PV systems and are not cost effective for large PVsystems.
The artificial neural network (ANN) is an efficient tool forsimulating the complex nonlinear relationship between the inputand output of a system and can be applied to the MPPT problem[19]. The ANNMPPT does not require knowledge of the inner detailof the PV system and has a fast response due to its ability to providea prediction within one step. There are several different ways ofapplying ANN into MPPT, as summarized in Ref. [40]. The ANN isused either to predict the optimal operating point for uniformirradiance conditions or is combined with other intelligentmethods, such as fuzzy logic, to predict the optimal voltage orcurrent values of the MPP directly from the irradiance and tem-perature inputs. However, there are a number of disadvantages inutilizing an ANN based MPPT in this way. For example, irradiancesensors with good accuracy are relatively expensive. Additionally,the ANN requires a large number of data points for training pur-poses. Obtaining these training data sets requires additionalequipment and electrical components, which not only increases thesystem cost but is also time-consuming. As the system ages, thecharacteristics of the PV array may change and thus, the ANN mayrequire retraining.
In this paper, we propose an efficient and fast hybrid MPPT forPV systems operating under PSCs. It combines an ANN-basedtechnique with the conventional P&O algorithm to track the MPP.This method has the advantage of a simple control structure and isable to quickly track the global MPP under various shading pat-terns. It does not need expensive irradiance sensors and insteaduses the same voltage and current sensors as the conventional P&Oalgorithm. Additionally, because the ANN is just used to categorizethe operating point within a region of operation, the trainingdataset can be easily obtained with sufficient accuracy by simu-lating the PV array using existing modelling methods. This work isan extension of that presented in Ref. [27] where we verified theeffectiveness of the proposed method for tracking the global MPPunder partial shading using dedicated irradiance sensors. In thispaper, we propose a low cost method to predict the global MPPregion when expensive irradiance sensors are not available or arenot justifiable for cost reasons. Instead, the modified techniquesamples the operating point on the stairs of IeV curve (which occurwith partial shading) and uses a combination of the measuredcurrent value at each stair to predict the global MPP region. Afterthat, the P&O algorithm, or any other efficient optimization algo-rithm for unimodal functions, such as ESC or IncCond, is applied tothe local area so that the system achieves the global MPP. Addi-tionally, we examine more complicated shading patterns, demon-strate the transient performance by comparing with several widelystudied MPPT techniques and present a more detailed discussion.
2. Solar array model
In this work, the two-diode model [41] is used to characterizethe PV array. Suppose that the PV array contains Nss PV modules in
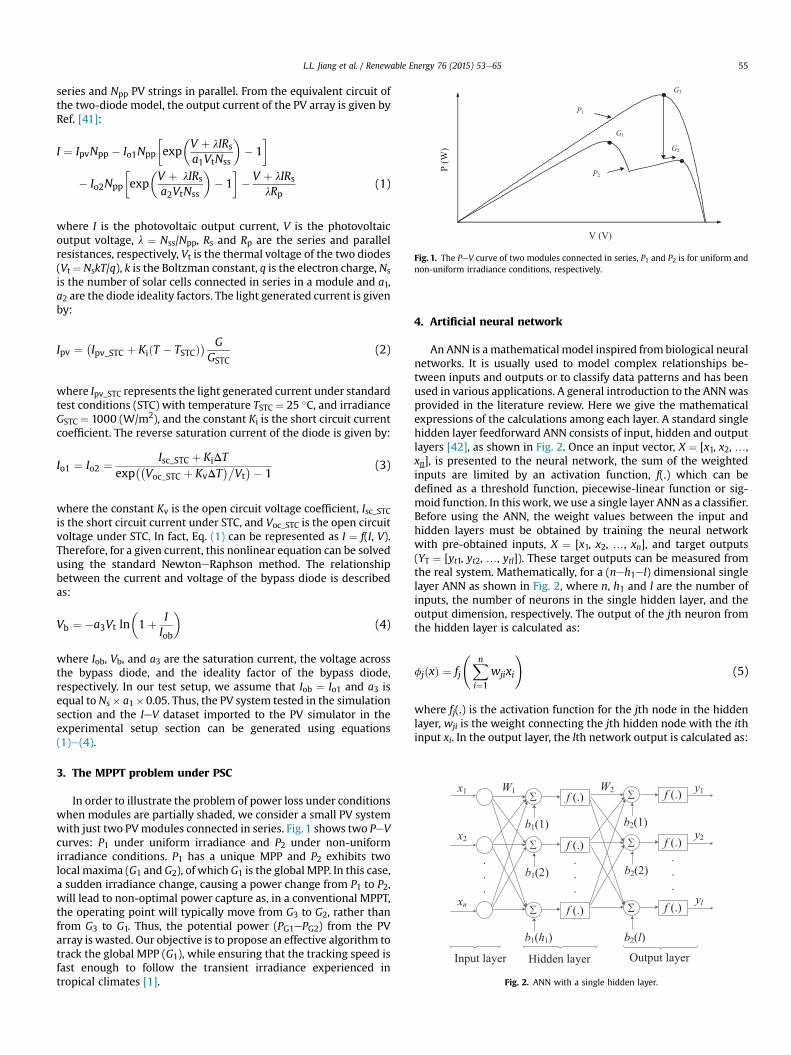
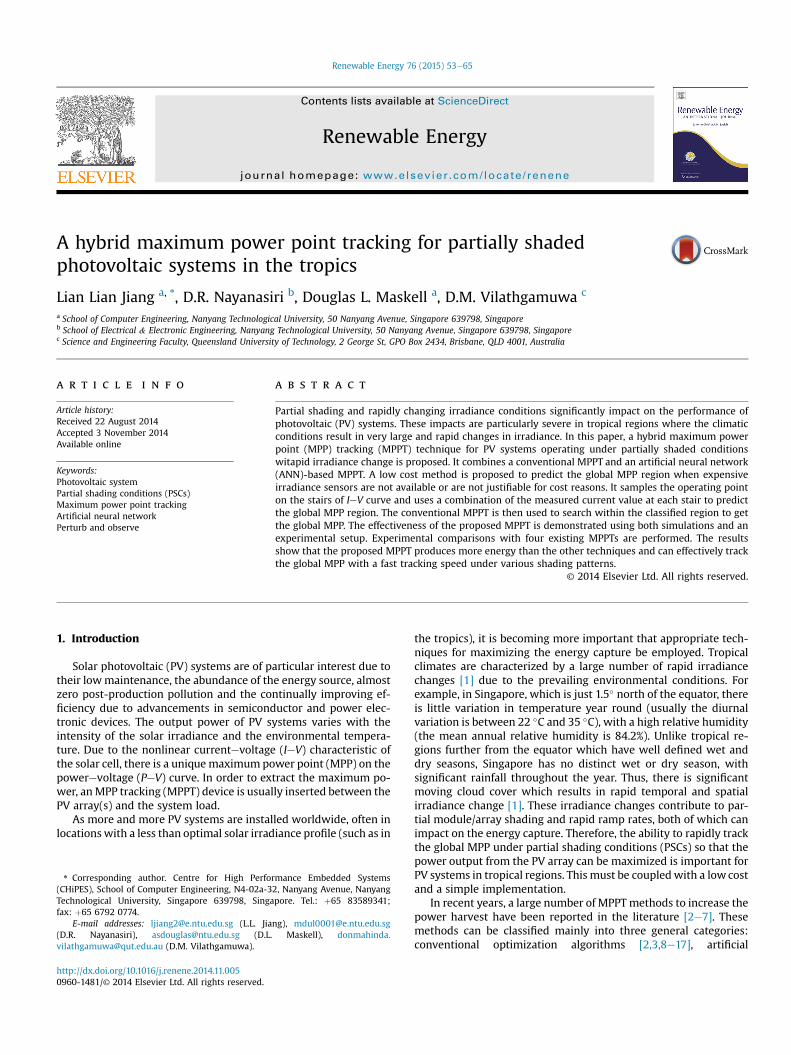
Fig. 1. The PeV curve of two modules connected in series, P1 and P2 is for uniform andnon-uniform irradiance conditions, respectively.
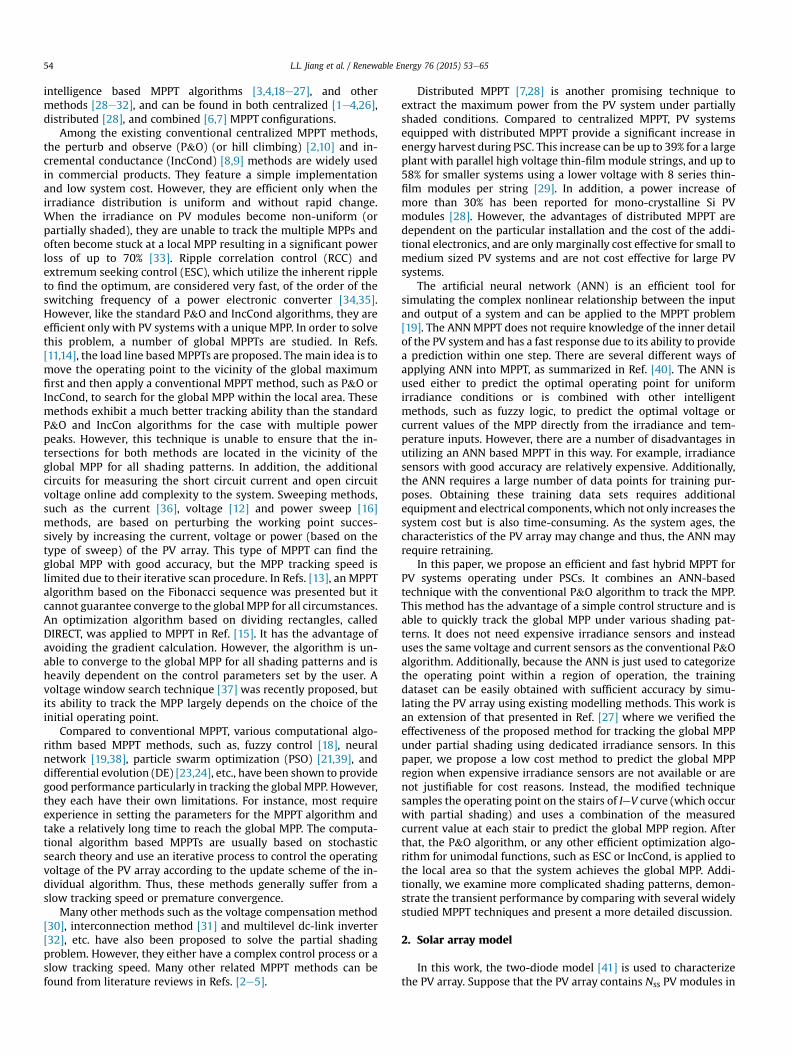
Fig. 2. ANN with a single hidden layer.
L.L. Jiang et al. / Renewable Energy 76 (2015) 53e65 55
series and Npp PV strings in parallel. From the equivalent circuit ofthe two-diode model, the output current of the PV array is given byRef. [41]:
I ¼ IpvNpp � Io1Npp
�exp
�V þ lIRsa1VtNss
�� 1�
� Io2Npp
�exp
�V þ lIRsa2VtNss
�� 1�� V þ lIRs
lRp(1)
where I is the photovoltaic output current, V is the photovoltaicoutput voltage, l ¼ Nss/Npp, Rs and Rp are the series and parallelresistances, respectively, Vt is the thermal voltage of the two diodes(Vt ¼ NskT/q), k is the Boltzman constant, q is the electron charge, Nsis the number of solar cells connected in series in a module and a1,a2 are the diode ideality factors. The light generated current is givenby:
Ipv ¼ �Ipv_STC þ KiðT � TSTCÞ� GGSTC
(2)
where Ipv_STC represents the light generated current under standardtest conditions (STC) with temperature TSTC ¼ 25 �C, and irradianceGSTC ¼ 1000 (W/m2), and the constant Ki is the short circuit currentcoefficient. The reverse saturation current of the diode is given by:
Io1 ¼ Io2 ¼ Isc_STC þ KiDTexp
��Voc_STC þ KvDT
��Vt�� 1
(3)
where the constant Kv is the open circuit voltage coefficient, Isc_STCis the short circuit current under STC, and Voc_STC is the open circuitvoltage under STC. In fact, Eq. (1) can be represented as I ¼ f(I, V).Therefore, for a given current, this nonlinear equation can be solvedusing the standard NewtoneRaphson method. The relationshipbetween the current and voltage of the bypass diode is describedas:
Vb ¼ �a3Vt ln�1þ I
Iob
�(4)
where Iob, Vb, and a3 are the saturation current, the voltage acrossthe bypass diode, and the ideality factor of the bypass diode,respectively. In our test setup, we assume that Iob ¼ Io1 and a3 isequal to Ns� a1�0.05. Thus, the PV system tested in the simulationsection and the IeV dataset imported to the PV simulator in theexperimental setup section can be generated using equations(1)e(4).
3. The MPPT problem under PSC
In order to illustrate the problem of power loss under conditionswhen modules are partially shaded, we consider a small PV systemwith just two PVmodules connected in series. Fig. 1 shows two PeVcurves: P1 under uniform irradiance and P2 under non-uniformirradiance conditions. P1 has a unique MPP and P2 exhibits twolocal maxima (G1 and G2), of which G1 is the global MPP. In this case,a sudden irradiance change, causing a power change from P1 to P2,will lead to non-optimal power capture as, in a conventional MPPT,the operating point will typically move from G3 to G2, rather thanfrom G3 to G1. Thus, the potential power (PG1ePG2) from the PVarray is wasted. Our objective is to propose an effective algorithm totrack the global MPP (G1), while ensuring that the tracking speed isfast enough to follow the transient irradiance experienced intropical climates [1].
4. Artificial neural network
An ANN is amathematical model inspired from biological neuralnetworks. It is usually used to model complex relationships be-tween inputs and outputs or to classify data patterns and has beenused in various applications. A general introduction to the ANNwasprovided in the literature review. Here we give the mathematicalexpressions of the calculations among each layer. A standard singlehidden layer feedforward ANN consists of input, hidden and outputlayers [42], as shown in Fig. 2. Once an input vector, X ¼ [x1, x2, …,xn], is presented to the neural network, the sum of the weightedinputs are limited by an activation function, f(.) which can bedefined as a threshold function, piecewise-linear function or sig-moid function. In this work, we use a single layer ANN as a classifier.Before using the ANN, the weight values between the input andhidden layers must be obtained by training the neural networkwith pre-obtained inputs, X ¼ [x1, x2, …, xn], and target outputs(YT ¼ [yt1, yt2, …, ytl]). These target outputs can be measured fromthe real system. Mathematically, for a (neh1el) dimensional singlelayer ANN as shown in Fig. 2, where n, h1 and l are the number ofinputs, the number of neurons in the single hidden layer, and theoutput dimension, respectively. The output of the jth neuron fromthe hidden layer is calculated as:
fjðxÞ ¼ fj
Xni¼1
wjixi
!(5)
where fj(.) is the activation function for the jth node in the hiddenlayer, wji is the weight connecting the jth hidden node with the ithinput xi. In the output layer, the lth network output is calculated as:
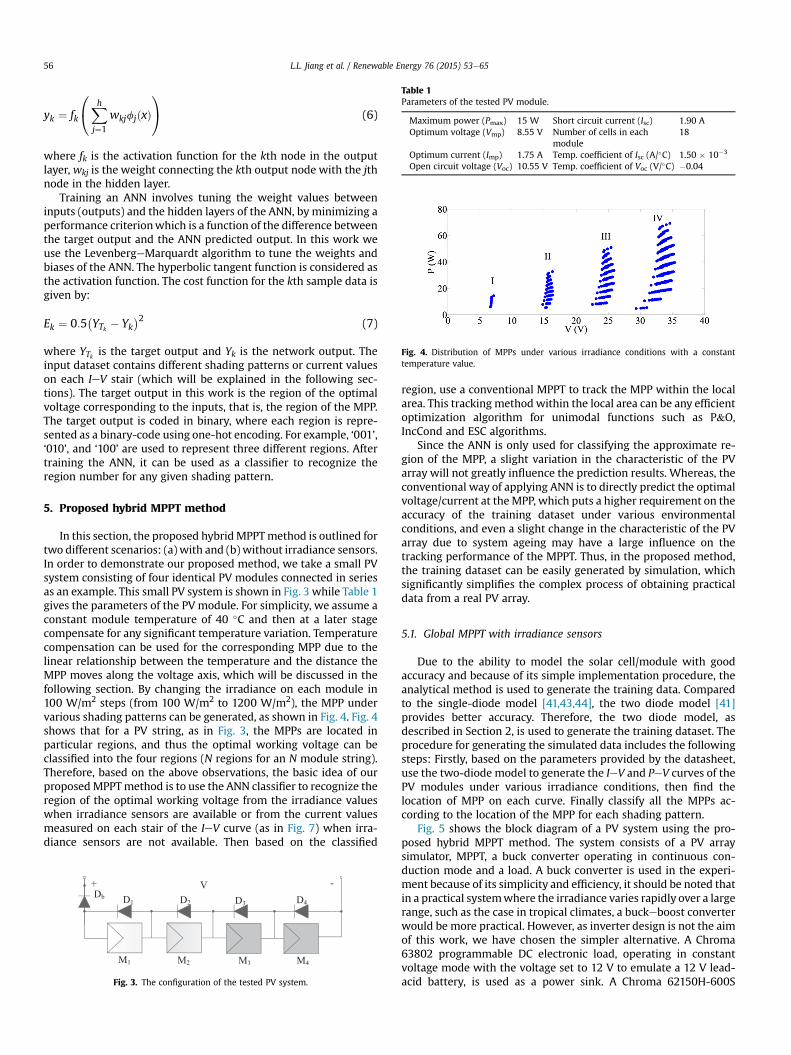
Table 1Parameters of the tested PV module.
Maximum power (Pmax) 15 W Short circuit current (Isc) 1.90 AOptimum voltage (Vmp) 8.55 V Number of cells in each
module18
Optimum current (Imp) 1.75 A Temp. coefficient of Isc (A/�C) 1.50 � 10�3
Open circuit voltage (Voc) 10.55 V Temp. coefficient of Voc (V/�C) �0.04
Fig. 4. Distribution of MPPs under various irradiance conditions with a constanttemperature value.
L.L. Jiang et al. / Renewable Energy 76 (2015) 53e6556
yk ¼ fk
0@Xh
j¼1
wkjfjðxÞ1A (6)
where fk is the activation function for the kth node in the outputlayer, wkj is the weight connecting the kth output node with the jthnode in the hidden layer.
Training an ANN involves tuning the weight values betweeninputs (outputs) and the hidden layers of the ANN, by minimizing aperformance criterionwhich is a function of the difference betweenthe target output and the ANN predicted output. In this work weuse the LevenbergeMarquardt algorithm to tune the weights andbiases of the ANN. The hyperbolic tangent function is considered asthe activation function. The cost function for the kth sample data isgiven by:
Ek ¼ 0:5�YTk � Yk
�2 (7)
where YTk is the target output and Yk is the network output. Theinput dataset contains different shading patterns or current valueson each IeV stair (which will be explained in the following sec-tions). The target output in this work is the region of the optimalvoltage corresponding to the inputs, that is, the region of the MPP.The target output is coded in binary, where each region is repre-sented as a binary-code using one-hot encoding. For example, ‘001’,‘010’, and ‘100’ are used to represent three different regions. Aftertraining the ANN, it can be used as a classifier to recognize theregion number for any given shading pattern.
5. Proposed hybrid MPPT method
In this section, the proposed hybridMPPTmethod is outlined fortwo different scenarios: (a) with and (b) without irradiance sensors.In order to demonstrate our proposed method, we take a small PVsystem consisting of four identical PV modules connected in seriesas an example. This small PV system is shown in Fig. 3 while Table 1gives the parameters of the PV module. For simplicity, we assume aconstant module temperature of 40 �C and then at a later stagecompensate for any significant temperature variation. Temperaturecompensation can be used for the corresponding MPP due to thelinear relationship between the temperature and the distance theMPP moves along the voltage axis, which will be discussed in thefollowing section. By changing the irradiance on each module in100 W/m2 steps (from 100 W/m2 to 1200 W/m2), the MPP undervarious shading patterns can be generated, as shown in Fig. 4. Fig. 4shows that for a PV string, as in Fig. 3, the MPPs are located inparticular regions, and thus the optimal working voltage can beclassified into the four regions (N regions for an N module string).Therefore, based on the above observations, the basic idea of ourproposedMPPTmethod is to use the ANN classifier to recognize theregion of the optimal working voltage from the irradiance valueswhen irradiance sensors are available or from the current valuesmeasured on each stair of the IeV curve (as in Fig. 7) when irra-diance sensors are not available. Then based on the classified
Fig. 3. The configuration of the tested PV system.
region, use a conventional MPPT to track the MPP within the localarea. This tracking method within the local area can be any efficientoptimization algorithm for unimodal functions such as P&O,IncCond and ESC algorithms.
Since the ANN is only used for classifying the approximate re-gion of the MPP, a slight variation in the characteristic of the PVarray will not greatly influence the prediction results. Whereas, theconventional way of applying ANN is to directly predict the optimalvoltage/current at theMPP, which puts a higher requirement on theaccuracy of the training dataset under various environmentalconditions, and even a slight change in the characteristic of the PVarray due to system ageing may have a large influence on thetracking performance of the MPPT. Thus, in the proposed method,the training dataset can be easily generated by simulation, whichsignificantly simplifies the complex process of obtaining practicaldata from a real PV array.
5.1. Global MPPT with irradiance sensors
Due to the ability to model the solar cell/module with goodaccuracy and because of its simple implementation procedure, theanalytical method is used to generate the training data. Comparedto the single-diode model [41,43,44], the two diode model [41]provides better accuracy. Therefore, the two diode model, asdescribed in Section 2, is used to generate the training dataset. Theprocedure for generating the simulated data includes the followingsteps: Firstly, based on the parameters provided by the datasheet,use the two-diode model to generate the IeV and PeV curves of thePV modules under various irradiance conditions, then find thelocation of MPP on each curve. Finally classify all the MPPs ac-cording to the location of the MPP for each shading pattern.
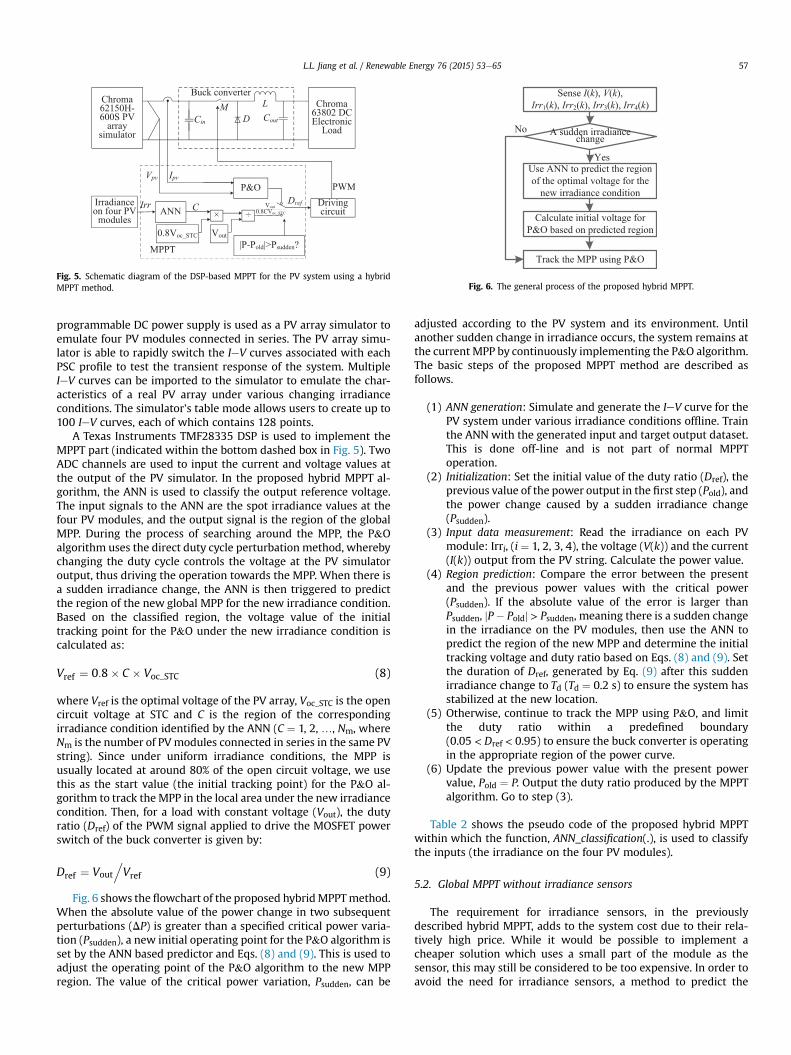
Fig. 5 shows the block diagram of a PV system using the pro-posed hybrid MPPT method. The system consists of a PV arraysimulator, MPPT, a buck converter operating in continuous con-duction mode and a load. A buck converter is used in the experi-ment because of its simplicity and efficiency, it should be noted thatin a practical systemwhere the irradiance varies rapidly over a largerange, such as the case in tropical climates, a buckeboost converterwould be more practical. However, as inverter design is not the aimof this work, we have chosen the simpler alternative. A Chroma63802 programmable DC electronic load, operating in constantvoltage mode with the voltage set to 12 V to emulate a 12 V lead-acid battery, is used as a power sink. A Chroma 62150H-600S
Sense I(k), V(k),Irr1(k), Irr2(k), Irr3(k), Irr4(k)
Calculate initial voltage forP&O based on predicted region
Track the MPP using P&O
Yes
No A sudden irradiancechange
Use ANN to predict the regionof the optimal voltage for the
new irradiance condition
Fig. 6. The general process of the proposed hybrid MPPT.Fig. 5. Schematic diagram of the DSP-based MPPT for the PV system using a hybridMPPT method.
L.L. Jiang et al. / Renewable Energy 76 (2015) 53e65 57
programmable DC power supply is used as a PV array simulator toemulate four PV modules connected in series. The PV array simu-lator is able to rapidly switch the IeV curves associated with eachPSC profile to test the transient response of the system. MultipleIeV curves can be imported to the simulator to emulate the char-acteristics of a real PV array under various changing irradianceconditions. The simulator's table mode allows users to create up to100 IeV curves, each of which contains 128 points.
A Texas Instruments TMF28335 DSP is used to implement theMPPT part (indicated within the bottom dashed box in Fig. 5). TwoADC channels are used to input the current and voltage values atthe output of the PV simulator. In the proposed hybrid MPPT al-gorithm, the ANN is used to classify the output reference voltage.The input signals to the ANN are the spot irradiance values at thefour PV modules, and the output signal is the region of the globalMPP. During the process of searching around the MPP, the P&Oalgorithm uses the direct duty cycle perturbation method, wherebychanging the duty cycle controls the voltage at the PV simulatoroutput, thus driving the operation towards the MPP. When there isa sudden irradiance change, the ANN is then triggered to predictthe region of the new global MPP for the new irradiance condition.Based on the classified region, the voltage value of the initialtracking point for the P&O under the new irradiance condition iscalculated as:
Vref ¼ 0:8� C � Voc_STC (8)
where Vref is the optimal voltage of the PV array, Voc_STC is the opencircuit voltage at STC and C is the region of the correspondingirradiance condition identified by the ANN (C ¼ 1, 2, …, Nm, whereNm is the number of PVmodules connected in series in the same PVstring). Since under uniform irradiance conditions, the MPP isusually located at around 80% of the open circuit voltage, we usethis as the start value (the initial tracking point) for the P&O al-gorithm to track the MPP in the local area under the new irradiancecondition. Then, for a load with constant voltage (Vout), the dutyratio (Dref) of the PWM signal applied to drive the MOSFET powerswitch of the buck converter is given by:
Dref ¼ Vout
.Vref (9)
Fig. 6 shows the flowchart of the proposed hybridMPPTmethod.When the absolute value of the power change in two subsequentperturbations (DP) is greater than a specified critical power varia-tion (Psudden), a new initial operating point for the P&O algorithm isset by the ANN based predictor and Eqs. (8) and (9). This is used toadjust the operating point of the P&O algorithm to the new MPPregion. The value of the critical power variation, Psudden, can be
adjusted according to the PV system and its environment. Untilanother sudden change in irradiance occurs, the system remains atthe current MPP by continuously implementing the P&O algorithm.The basic steps of the proposed MPPT method are described asfollows.
(1) ANN generation: Simulate and generate the IeV curve for thePV system under various irradiance conditions offline. Trainthe ANN with the generated input and target output dataset.This is done off-line and is not part of normal MPPToperation.
(2) Initialization: Set the initial value of the duty ratio (Dref), theprevious value of the power output in the first step (Pold), andthe power change caused by a sudden irradiance change(Psudden).
(3) Input data measurement: Read the irradiance on each PVmodule: Irri, (i ¼ 1, 2, 3, 4), the voltage (V(k)) and the current(I(k)) output from the PV string. Calculate the power value.
(4) Region prediction: Compare the error between the presentand the previous power values with the critical power(Psudden). If the absolute value of the error is larger thanPsudden, jP� Poldj > Psudden, meaning there is a sudden changein the irradiance on the PV modules, then use the ANN topredict the region of the new MPP and determine the initialtracking voltage and duty ratio based on Eqs. (8) and (9). Setthe duration of Dref, generated by Eq. (9) after this suddenirradiance change to Td (Td ¼ 0.2 s) to ensure the system hasstabilized at the new location.
(5) Otherwise, continue to track the MPP using P&O, and limitthe duty ratio within a predefined boundary(0.05 < Dref < 0.95) to ensure the buck converter is operatingin the appropriate region of the power curve.
(6) Update the previous power value with the present powervalue, Pold ¼ P. Output the duty ratio produced by the MPPTalgorithm. Go to step (3).
Table 2 shows the pseudo code of the proposed hybrid MPPTwithin which the function, ANN_classification(.), is used to classifythe inputs (the irradiance on the four PV modules).
5.2. Global MPPT without irradiance sensors
The requirement for irradiance sensors, in the previouslydescribed hybrid MPPT, adds to the system cost due to their rela-tively high price. While it would be possible to implement acheaper solution which uses a small part of the module as thesensor, this may still be considered to be too expensive. In order toavoid the need for irradiance sensors, a method to predict the
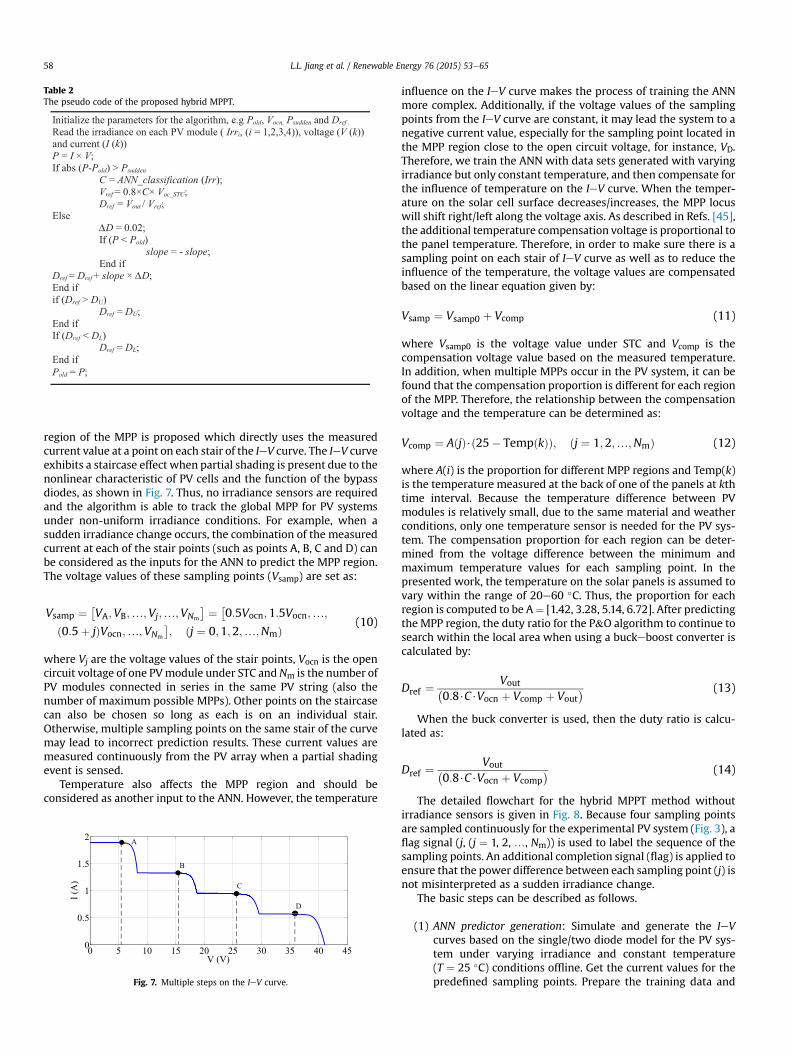
Table 2The pseudo code of the proposed hybrid MPPT.
L.L. Jiang et al. / Renewable Energy 76 (2015) 53e6558
region of the MPP is proposed which directly uses the measuredcurrent value at a point on each stair of the IeV curve. The IeV curveexhibits a staircase effect when partial shading is present due to thenonlinear characteristic of PV cells and the function of the bypassdiodes, as shown in Fig. 7. Thus, no irradiance sensors are requiredand the algorithm is able to track the global MPP for PV systemsunder non-uniform irradiance conditions. For example, when asudden irradiance change occurs, the combination of the measuredcurrent at each of the stair points (such as points A, B, C and D) canbe considered as the inputs for the ANN to predict the MPP region.The voltage values of these sampling points (Vsamp) are set as:
Vsamp ¼ VA;VB;…;Vj;…;VNm
¼ 0:5Vocn;1:5Vocn;…;
ð0:5þ jÞVocn;…;VNm
; ðj ¼ 0;1;2;…;NmÞ (10)
where Vj are the voltage values of the stair points, Vocn is the opencircuit voltage of one PVmodule under STC andNm is the number ofPV modules connected in series in the same PV string (also thenumber of maximum possible MPPs). Other points on the staircasecan also be chosen so long as each is on an individual stair.Otherwise, multiple sampling points on the same stair of the curvemay lead to incorrect prediction results. These current values aremeasured continuously from the PV array when a partial shadingevent is sensed.
Temperature also affects the MPP region and should beconsidered as another input to the ANN. However, the temperature
0 5 10 15 20 25 30 35 40 450
0.5
1
1.5
2
V (V)
I (A
)
A
B
C
D
Fig. 7. Multiple steps on the IeV curve.
influence on the IeV curve makes the process of training the ANNmore complex. Additionally, if the voltage values of the samplingpoints from the IeV curve are constant, it may lead the system to anegative current value, especially for the sampling point located inthe MPP region close to the open circuit voltage, for instance, VD.Therefore, we train the ANN with data sets generated with varyingirradiance but only constant temperature, and then compensate forthe influence of temperature on the IeV curve. When the temper-ature on the solar cell surface decreases/increases, the MPP locuswill shift right/left along the voltage axis. As described in Refs. [45],the additional temperature compensation voltage is proportional tothe panel temperature. Therefore, in order to make sure there is asampling point on each stair of IeV curve as well as to reduce theinfluence of the temperature, the voltage values are compensatedbased on the linear equation given by:
Vsamp ¼ Vsamp0 þ Vcomp (11)
where Vsamp0 is the voltage value under STC and Vcomp is thecompensation voltage value based on the measured temperature.In addition, when multiple MPPs occur in the PV system, it can befound that the compensation proportion is different for each regionof the MPP. Therefore, the relationship between the compensationvoltage and the temperature can be determined as:
Vcomp ¼ AðjÞ$ð25� TempðkÞÞ; ðj ¼ 1;2;…;NmÞ (12)
where A(i) is the proportion for different MPP regions and Temp(k)is the temperature measured at the back of one of the panels at kthtime interval. Because the temperature difference between PVmodules is relatively small, due to the same material and weatherconditions, only one temperature sensor is needed for the PV sys-tem. The compensation proportion for each region can be deter-mined from the voltage difference between the minimum andmaximum temperature values for each sampling point. In thepresented work, the temperature on the solar panels is assumed tovary within the range of 20e60 �C. Thus, the proportion for eachregion is computed to be A¼ [1.42, 3.28, 5.14, 6.72]. After predictingthe MPP region, the duty ratio for the P&O algorithm to continue tosearch within the local area when using a buckeboost converter iscalculated by:
Dref ¼Vout�
0:8$C$Vocn þ Vcomp þ Vout� (13)
When the buck converter is used, then the duty ratio is calcu-lated as:
Dref ¼Vout�
0:8$C$Vocn þ Vcomp� (14)
The detailed flowchart for the hybrid MPPT method withoutirradiance sensors is given in Fig. 8. Because four sampling pointsare sampled continuously for the experimental PV system (Fig. 3), aflag signal (j, (j ¼ 1, 2, …, Nm)) is used to label the sequence of thesampling points. An additional completion signal (flag) is applied toensure that the power difference between each sampling point (j) isnot misinterpreted as a sudden irradiance change.
The basic steps can be described as follows.
(1) ANN predictor generation: Simulate and generate the IeVcurves based on the single/two diode model for the PV sys-tem under varying irradiance and constant temperature(T ¼ 25 �C) conditions offline. Get the current values for thepredefined sampling points. Prepare the training data and
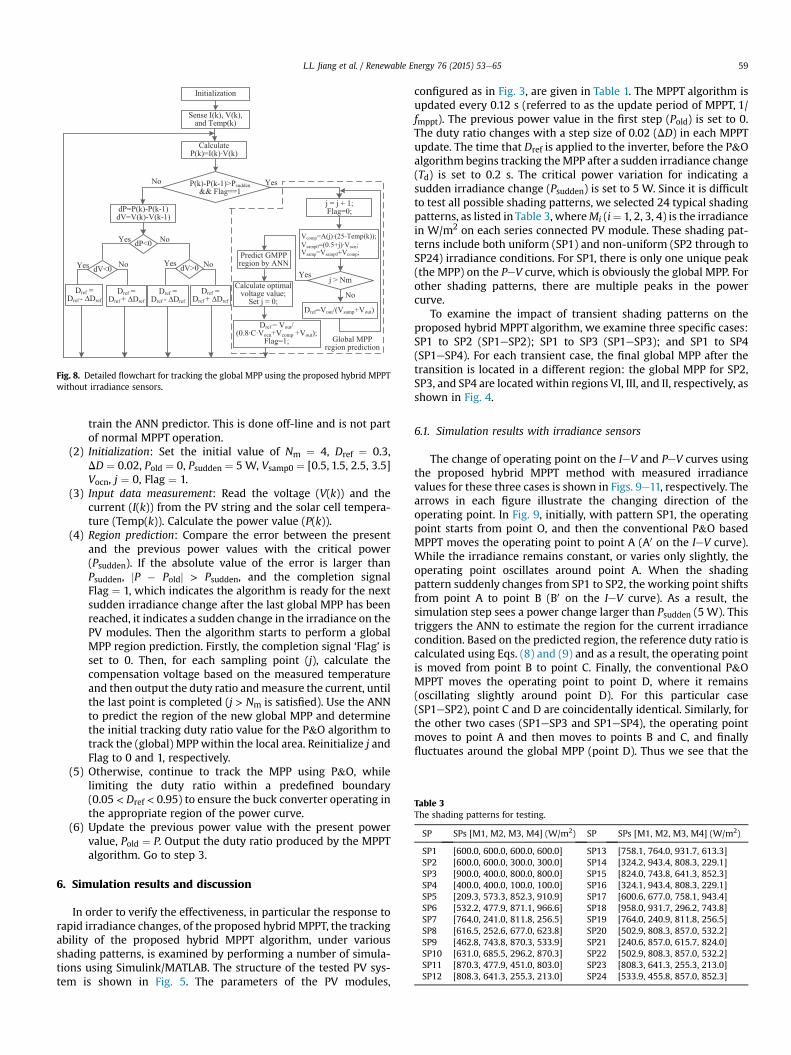
Table 3The shading patterns for testing.
SP SPs [M1, M2, M3, M4] (W/m2) SP SPs [M1, M2, M3, M4] (W/m2)
SP1 [600.0, 600.0, 600.0, 600.0] SP13 [758.1, 764.0, 931.7, 613.3]SP2 [600.0, 600.0, 300.0, 300.0] SP14 [324.2, 943.4, 808.3, 229.1]SP3 [900.0, 400.0, 800.0, 800.0] SP15 [824.0, 743.8, 641.3, 852.3]SP4 [400.0, 400.0, 100.0, 100.0] SP16 [324.1, 943.4, 808.3, 229.1]SP5 [209.3, 573.3, 852.3, 910.9] SP17 [600.6, 677.0, 758.1, 943.4]SP6 [532.2, 477.9, 871.1, 966.6] SP18 [958.0, 931.7, 296.2, 743.8]SP7 [764.0, 241.0, 811.8, 256.5] SP19 [764.0, 240.9, 811.8, 256.5]SP8 [616.5, 252.6, 677.0, 623.8] SP20 [502.9, 808.3, 857.0, 532.2]SP9 [462.8, 743.8, 870.3, 533.9] SP21 [240.6, 857.0, 615.7, 824.0]SP10 [631.0, 685.5, 296.2, 870.3] SP22 [502.9, 808.3, 857.0, 532.2]SP11 [870.3, 477.9, 451.0, 803.0] SP23 [808.3, 641.3, 255.3, 213.0]SP12 [808.3, 641.3, 255.3, 213.0] SP24 [533.9, 455.8, 857.0, 852.3]
Fig. 8. Detailed flowchart for tracking the global MPP using the proposed hybrid MPPTwithout irradiance sensors.
L.L. Jiang et al. / Renewable Energy 76 (2015) 53e65 59
train the ANN predictor. This is done off-line and is not partof normal MPPT operation.
(2) Initialization: Set the initial value of Nm ¼ 4, Dref ¼ 0.3,DD ¼ 0.02, Pold ¼ 0, Psudden ¼ 5 W, Vsamp0 ¼ [0.5, 1.5, 2.5, 3.5]Vocn, j ¼ 0, Flag ¼ 1.
(3) Input data measurement: Read the voltage (V(k)) and thecurrent (I(k)) from the PV string and the solar cell tempera-ture (Temp(k)). Calculate the power value (P(k)).
(4) Region prediction: Compare the error between the presentand the previous power values with the critical power(Psudden). If the absolute value of the error is larger thanPsudden, jP � Poldj > Psudden, and the completion signalFlag ¼ 1, which indicates the algorithm is ready for the nextsudden irradiance change after the last global MPP has beenreached, it indicates a sudden change in the irradiance on thePV modules. Then the algorithm starts to perform a globalMPP region prediction. Firstly, the completion signal ‘Flag’ isset to 0. Then, for each sampling point (j), calculate thecompensation voltage based on the measured temperatureand then output the duty ratio andmeasure the current, untilthe last point is completed (j > Nm is satisfied). Use the ANNto predict the region of the new global MPP and determinethe initial tracking duty ratio value for the P&O algorithm totrack the (global) MPP within the local area. Reinitialize j andFlag to 0 and 1, respectively.
(5) Otherwise, continue to track the MPP using P&O, whilelimiting the duty ratio within a predefined boundary(0.05 < Dref < 0.95) to ensure the buck converter operating inthe appropriate region of the power curve.
(6) Update the previous power value with the present powervalue, Pold ¼ P. Output the duty ratio produced by the MPPTalgorithm. Go to step 3.
6. Simulation results and discussion
In order to verify the effectiveness, in particular the response torapid irradiance changes, of the proposed hybridMPPT, the trackingability of the proposed hybrid MPPT algorithm, under variousshading patterns, is examined by performing a number of simula-tions using Simulink/MATLAB. The structure of the tested PV sys-tem is shown in Fig. 5. The parameters of the PV modules,
configured as in Fig. 3, are given in Table 1. The MPPT algorithm isupdated every 0.12 s (referred to as the update period of MPPT, 1/fmppt). The previous power value in the first step (Pold) is set to 0.The duty ratio changes with a step size of 0.02 (DD) in each MPPTupdate. The time that Dref is applied to the inverter, before the P&Oalgorithm begins tracking theMPP after a sudden irradiance change(Td) is set to 0.2 s. The critical power variation for indicating asudden irradiance change (Psudden) is set to 5 W. Since it is difficultto test all possible shading patterns, we selected 24 typical shadingpatterns, as listed in Table 3, whereMi (i¼ 1, 2, 3, 4) is the irradiancein W/m2 on each series connected PV module. These shading pat-terns include both uniform (SP1) and non-uniform (SP2 through toSP24) irradiance conditions. For SP1, there is only one unique peak(the MPP) on the PeV curve, which is obviously the global MPP. Forother shading patterns, there are multiple peaks in the powercurve.
To examine the impact of transient shading patterns on theproposed hybrid MPPT algorithm, we examine three specific cases:SP1 to SP2 (SP1eSP2); SP1 to SP3 (SP1eSP3); and SP1 to SP4(SP1eSP4). For each transient case, the final global MPP after thetransition is located in a different region: the global MPP for SP2,SP3, and SP4 are located within regions VI, III, and II, respectively, asshown in Fig. 4.
6.1. Simulation results with irradiance sensors
The change of operating point on the IeV and PeV curves usingthe proposed hybrid MPPT method with measured irradiancevalues for these three cases is shown in Figs. 9e11, respectively. Thearrows in each figure illustrate the changing direction of theoperating point. In Fig. 9, initially, with pattern SP1, the operatingpoint starts from point O, and then the conventional P&O basedMPPT moves the operating point to point A (A0 on the IeV curve).While the irradiance remains constant, or varies only slightly, theoperating point oscillates around point A. When the shadingpattern suddenly changes from SP1 to SP2, the working point shiftsfrom point A to point B (B0 on the IeV curve). As a result, thesimulation step sees a power change larger than Psudden (5 W). Thistriggers the ANN to estimate the region for the current irradiancecondition. Based on the predicted region, the reference duty ratio iscalculated using Eqs. (8) and (9) and as a result, the operating pointis moved from point B to point C. Finally, the conventional P&OMPPT moves the operating point to point D, where it remains(oscillating slightly around point D). For this particular case(SP1eSP2), point C and D are coincidentally identical. Similarly, forthe other two cases (SP1eSP3 and SP1eSP4), the operating pointmoves to point A and then moves to points B and C, and finallyfluctuates around the global MPP (point D). Thus we see that the
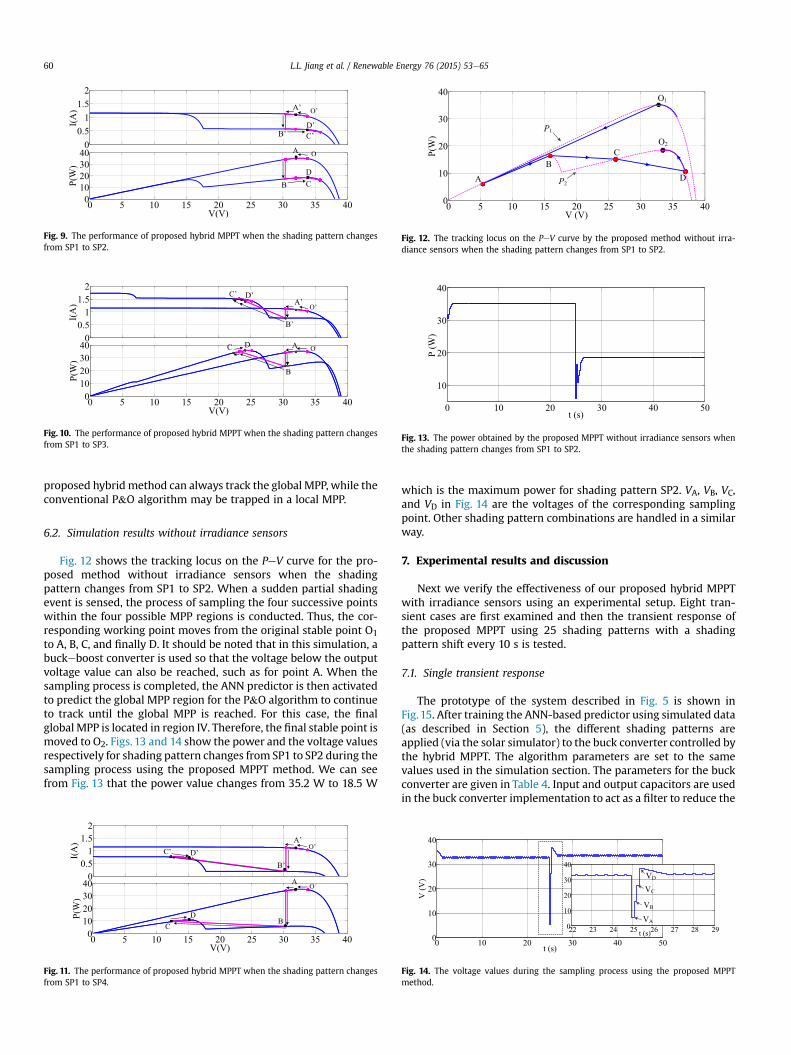
Fig. 9. The performance of proposed hybrid MPPT when the shading pattern changesfrom SP1 to SP2.
Fig. 10. The performance of proposed hybrid MPPT when the shading pattern changesfrom SP1 to SP3.
0 5 10 15 20 25 30 35 400
10
20
30
40
V (V)
P(W
)
A
BC
D
O1
O2
P1
P2
Fig. 12. The tracking locus on the PeV curve by the proposed method without irra-diance sensors when the shading pattern changes from SP1 to SP2.
0 10 20 30 40 50
10
20
30
40
t (s)P
(W)
Fig. 13. The power obtained by the proposed MPPT without irradiance sensors whenthe shading pattern changes from SP1 to SP2.
L.L. Jiang et al. / Renewable Energy 76 (2015) 53e6560
proposed hybridmethod can always track the global MPP, while theconventional P&O algorithm may be trapped in a local MPP.
6.2. Simulation results without irradiance sensors
Fig. 12 shows the tracking locus on the PeV curve for the pro-posed method without irradiance sensors when the shadingpattern changes from SP1 to SP2. When a sudden partial shadingevent is sensed, the process of sampling the four successive pointswithin the four possible MPP regions is conducted. Thus, the cor-responding working point moves from the original stable point O1to A, B, C, and finally D. It should be noted that in this simulation, abuckeboost converter is used so that the voltage below the outputvoltage value can also be reached, such as for point A. When thesampling process is completed, the ANN predictor is then activatedto predict the global MPP region for the P&O algorithm to continueto track until the global MPP is reached. For this case, the finalglobal MPP is located in region IV. Therefore, the final stable point ismoved to O2. Figs. 13 and 14 show the power and the voltage valuesrespectively for shading pattern changes from SP1 to SP2 during thesampling process using the proposed MPPT method. We can seefrom Fig. 13 that the power value changes from 35.2 W to 18.5 W
00.5
11.5
2
I(A
)
0 5 10 15 20 25 30 35 40010203040
V(V)
P(W
)
D
A’
A
B’D’
B
O
O’C’
C
Fig. 11. The performance of proposed hybrid MPPT when the shading pattern changesfrom SP1 to SP4.
which is the maximum power for shading pattern SP2. VA, VB, VC,and VD in Fig. 14 are the voltages of the corresponding samplingpoint. Other shading pattern combinations are handled in a similarway.
7. Experimental results and discussion
Next we verify the effectiveness of our proposed hybrid MPPTwith irradiance sensors using an experimental setup. Eight tran-sient cases are first examined and then the transient response ofthe proposed MPPT using 25 shading patterns with a shadingpattern shift every 10 s is tested.
7.1. Single transient response
The prototype of the system described in Fig. 5 is shown inFig.15. After training the ANN-based predictor using simulated data(as described in Section 5), the different shading patterns areapplied (via the solar simulator) to the buck converter controlled bythe hybrid MPPT. The algorithm parameters are set to the samevalues used in the simulation section. The parameters for the buckconverter are given in Table 4. Input and output capacitors are usedin the buck converter implementation to act as a filter to reduce the
0 10 20 30 40 500
10
20
30
40
t (s)
V (V
)
22 23 24 25 26 27 28 290
10
20
30
40
t (s)
VA
VB
VC
VD
Fig. 14. The voltage values during the sampling process using the proposed MPPTmethod.
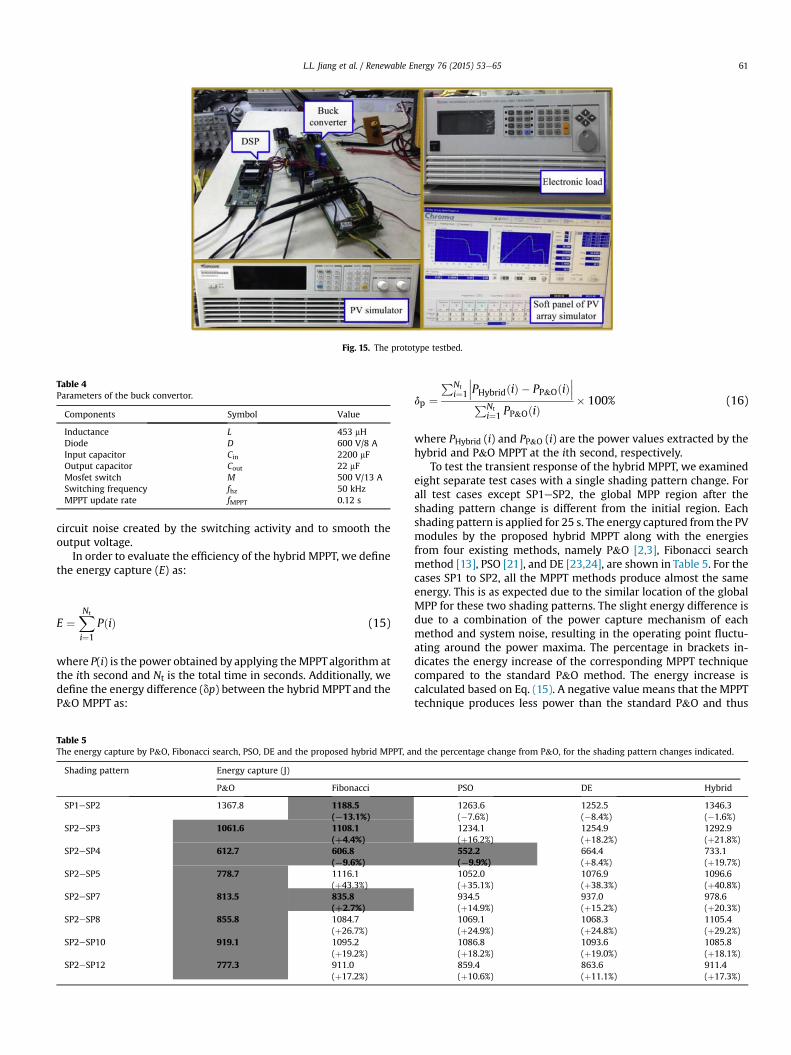
Fig. 15. The prototype testbed.
Table 4Parameters of the buck convertor.
Components Symbol Value
Inductance L 453 mHDiode D 600 V/8 AInput capacitor Cin 2200 mFOutput capacitor Cout 22 mFMosfet switch M 500 V/13 ASwitching frequency fhz 50 kHzMPPT update rate fMPPT 0.12 s
L.L. Jiang et al. / Renewable Energy 76 (2015) 53e65 61
circuit noise created by the switching activity and to smooth theoutput voltage.
In order to evaluate the efficiency of the hybrid MPPT, we definethe energy capture (E) as:
E ¼XNt
i¼1
PðiÞ (15)
where P(i) is the power obtained by applying theMPPTalgorithm atthe ith second and Nt is the total time in seconds. Additionally, wedefine the energy difference (dp) between the hybrid MPPT and theP&O MPPT as:
Table 5The energy capture by P&O, Fibonacci search, PSO, DE and the proposed hybrid MPPT, a
Shading pattern Energy capture (J)
P&O Fibonacci
SP1eSP2 1367.8 1188.5(¡13.1%)
SP2eSP3 1061.6 1108.1(þ4.4%)
SP2eSP4 612.7 606.8(¡9.6%)
SP2eSP5 778.7 1116.1(þ43.3%)
SP2eSP7 813.5 835.8(þ2.7%)
SP2eSP8 855.8 1084.7(þ26.7%)
SP2eSP10 919.1 1095.2(þ19.2%)
SP2eSP12 777.3 911.0(þ17.2%)
dp ¼Nti¼1��PHybridðiÞ � PP&OðiÞ��PNt
� 100% (16)
P � �i¼1 PP&OðiÞ
where PHybrid (i) and PP&O (i) are the power values extracted by thehybrid and P&O MPPT at the ith second, respectively.
To test the transient response of the hybrid MPPT, we examinedeight separate test cases with a single shading pattern change. Forall test cases except SP1eSP2, the global MPP region after theshading pattern change is different from the initial region. Eachshading pattern is applied for 25 s. The energy captured from the PVmodules by the proposed hybrid MPPT along with the energiesfrom four existing methods, namely P&O [2,3], Fibonacci searchmethod [13], PSO [21], and DE [23,24], are shown in Table 5. For thecases SP1 to SP2, all the MPPT methods produce almost the sameenergy. This is as expected due to the similar location of the globalMPP for these two shading patterns. The slight energy difference isdue to a combination of the power capture mechanism of eachmethod and system noise, resulting in the operating point fluctu-ating around the power maxima. The percentage in brackets in-dicates the energy increase of the corresponding MPPT techniquecompared to the standard P&O method. The energy increase iscalculated based on Eq. (15). A negative value means that the MPPTtechnique produces less power than the standard P&O and thus
nd the percentage change from P&O, for the shading pattern changes indicated.
PSO DE Hybrid
1263.6(�7.6%)
1252.5(�8.4%)
1346.3(�1.6%)
1234.1(þ16.2%)
1254.9(þ18.2%)
1292.9(þ21.8%)
552.2(¡9.9%)
664.4(þ8.4%)
733.1(þ19.7%)
1052.0(þ35.1%)
1076.9(þ38.3%)
1096.6(þ40.8%)
934.5(þ14.9%)
937.0(þ15.2%)
978.6(þ20.3%)
1069.1(þ24.9%)
1068.3(þ24.8%)
1105.4(þ29.2%)
1086.8(þ18.2%)
1093.6(þ19.0%)
1085.8(þ18.1%)
859.4(þ10.6%)
863.6(þ11.1%)
911.4(þ17.3%)
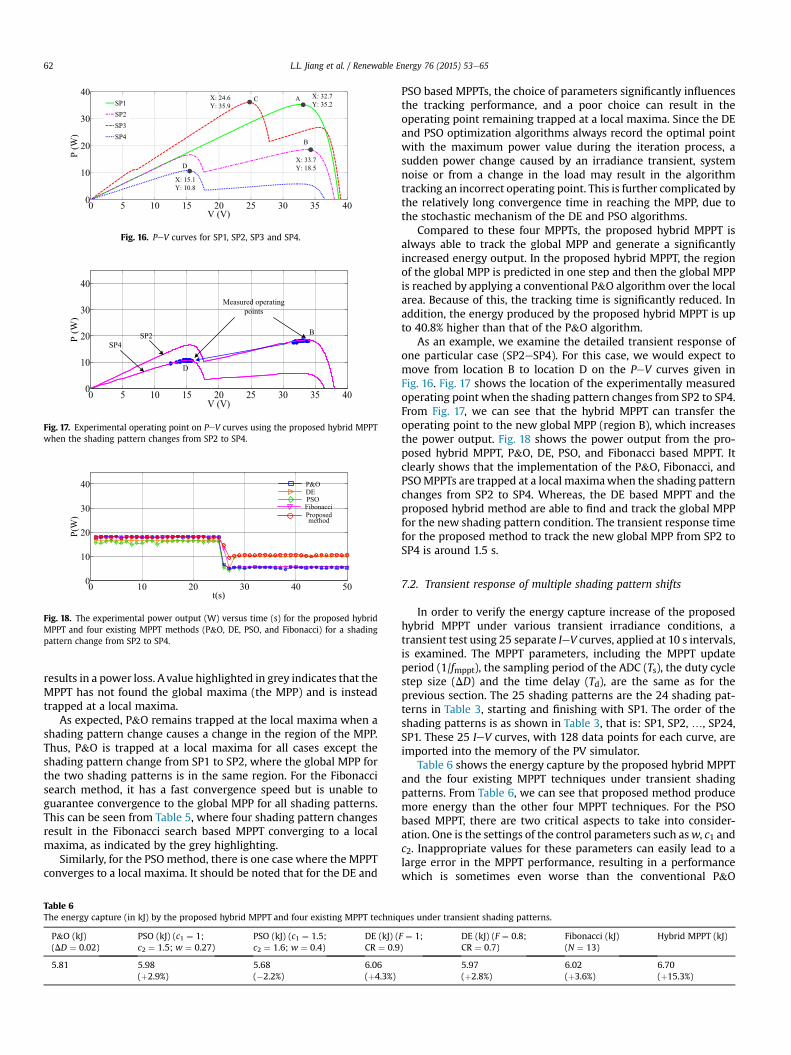
0 5 10 15 20 25 30 35 400
10
20
30
40
V (V)
P (W
)
SP1SP2SP3SP4
C
D
A
B
X: 32.7Y: 35.2
X: 33.7Y: 18.5
X: 24.6Y: 35.9
X: 15.1Y: 10.8
Fig. 16. PeV curves for SP1, SP2, SP3 and SP4.
0 5 10 15 20 25 30 35 400
10
20
30
40
V (V)
P (W
)
Measured operatingpoints
SP2SP4
B
D
Fig. 17. Experimental operating point on PeV curves using the proposed hybrid MPPTwhen the shading pattern changes from SP2 to SP4.
0 10 20 30 40 500
10
20
30
40
t(s)
P(W
) Proposedmethod
Fibonacci
DEPSO
P&O
Fig. 18. The experimental power output (W) versus time (s) for the proposed hybridMPPT and four existing MPPT methods (P&O, DE, PSO, and Fibonacci) for a shadingpattern change from SP2 to SP4.
L.L. Jiang et al. / Renewable Energy 76 (2015) 53e6562
results in a power loss. A value highlighted in grey indicates that theMPPT has not found the global maxima (the MPP) and is insteadtrapped at a local maxima.
As expected, P&O remains trapped at the local maxima when ashading pattern change causes a change in the region of the MPP.Thus, P&O is trapped at a local maxima for all cases except theshading pattern change from SP1 to SP2, where the global MPP forthe two shading patterns is in the same region. For the Fibonaccisearch method, it has a fast convergence speed but is unable toguarantee convergence to the global MPP for all shading patterns.This can be seen from Table 5, where four shading pattern changesresult in the Fibonacci search based MPPT converging to a localmaxima, as indicated by the grey highlighting.
Similarly, for the PSOmethod, there is one case where the MPPTconverges to a local maxima. It should be noted that for the DE and
Table 6The energy capture (in kJ) by the proposed hybrid MPPT and four existing MPPT techniq
P&O (kJ)(DD ¼ 0.02)
PSO (kJ) (c1 ¼ 1;c2 ¼ 1.5; w ¼ 0.27)
PSO (kJ) (c1 ¼ 1.5;c2 ¼ 1.6; w ¼ 0.4)
DE (kJ) (CR ¼ 0.9
5.81 5.98(þ2.9%)
5.68(�2.2%)
6.06(þ4.3%)
PSO based MPPTs, the choice of parameters significantly influencesthe tracking performance, and a poor choice can result in theoperating point remaining trapped at a local maxima. Since the DEand PSO optimization algorithms always record the optimal pointwith the maximum power value during the iteration process, asudden power change caused by an irradiance transient, systemnoise or from a change in the load may result in the algorithmtracking an incorrect operating point. This is further complicated bythe relatively long convergence time in reaching the MPP, due tothe stochastic mechanism of the DE and PSO algorithms.
Compared to these four MPPTs, the proposed hybrid MPPT isalways able to track the global MPP and generate a significantlyincreased energy output. In the proposed hybrid MPPT, the regionof the global MPP is predicted in one step and then the global MPPis reached by applying a conventional P&O algorithm over the localarea. Because of this, the tracking time is significantly reduced. Inaddition, the energy produced by the proposed hybrid MPPT is upto 40.8% higher than that of the P&O algorithm.
As an example, we examine the detailed transient response ofone particular case (SP2eSP4). For this case, we would expect tomove from location B to location D on the PeV curves given inFig. 16. Fig. 17 shows the location of the experimentally measuredoperating point when the shading pattern changes from SP2 to SP4.From Fig. 17, we can see that the hybrid MPPT can transfer theoperating point to the new global MPP (region B), which increasesthe power output. Fig. 18 shows the power output from the pro-posed hybrid MPPT, P&O, DE, PSO, and Fibonacci based MPPT. Itclearly shows that the implementation of the P&O, Fibonacci, andPSOMPPTs are trapped at a local maximawhen the shading patternchanges from SP2 to SP4. Whereas, the DE based MPPT and theproposed hybrid method are able to find and track the global MPPfor the new shading pattern condition. The transient response timefor the proposed method to track the new global MPP from SP2 toSP4 is around 1.5 s.
7.2. Transient response of multiple shading pattern shifts
In order to verify the energy capture increase of the proposedhybrid MPPT under various transient irradiance conditions, atransient test using 25 separate IeV curves, applied at 10 s intervals,is examined. The MPPT parameters, including the MPPT updateperiod (1/fmppt), the sampling period of the ADC (Ts), the duty cyclestep size (DD) and the time delay (Td), are the same as for theprevious section. The 25 shading patterns are the 24 shading pat-terns in Table 3, starting and finishing with SP1. The order of theshading patterns is as shown in Table 3, that is: SP1, SP2, …, SP24,SP1. These 25 IeV curves, with 128 data points for each curve, areimported into the memory of the PV simulator.
Table 6 shows the energy capture by the proposed hybrid MPPTand the four existing MPPT techniques under transient shadingpatterns. From Table 6, we can see that proposed method producemore energy than the other four MPPT techniques. For the PSObased MPPT, there are two critical aspects to take into consider-ation. One is the settings of the control parameters such asw, c1 andc2. Inappropriate values for these parameters can easily lead to alarge error in the MPPT performance, resulting in a performancewhich is sometimes even worse than the conventional P&O
ues under transient shading patterns.
F ¼ 1;)
DE (kJ) (F ¼ 0.8;CR ¼ 0.7)
Fibonacci (kJ)(N ¼ 13)
Hybrid MPPT (kJ)
5.97(þ2.8%)
6.02(þ3.6%)
6.70(þ15.3%)
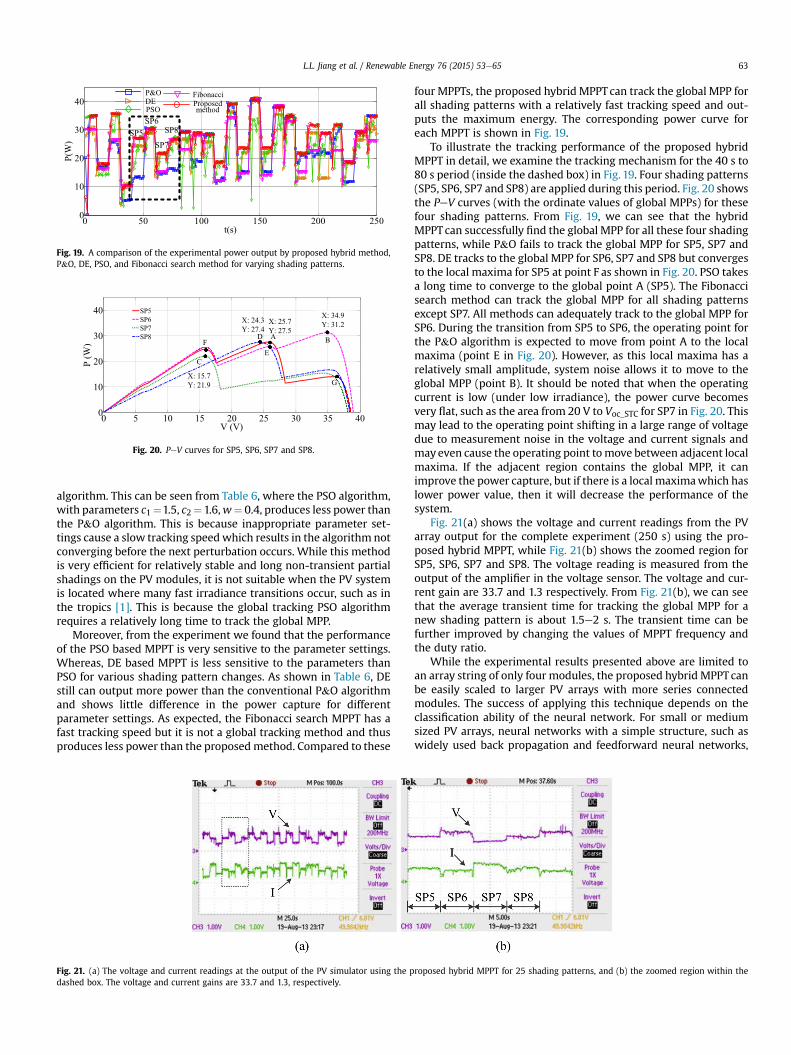
0 50 100 150 200 2500
10
20
30
40
t(s)
P(W
)
Proposedmethod
FibonacciDEPSO
P&O
SP6SP5
SP7
SP8
Fig. 19. A comparison of the experimental power output by proposed hybrid method,P&O, DE, PSO, and Fibonacci search method for varying shading patterns.
0 5 10 15 20 25 30 35 400
10
20
30
40
V (V)
P (W
)
SP5SP6SP7SP8
X: 15.7Y: 21.9
X: 24.3Y: 27.4
X: 25.7Y: 27.5
X: 34.9Y: 31.2
BAD
EC
F
G
Fig. 20. PeV curves for SP5, SP6, SP7 and SP8.
L.L. Jiang et al. / Renewable Energy 76 (2015) 53e65 63
algorithm. This can be seen from Table 6, where the PSO algorithm,with parameters c1¼1.5, c2¼1.6,w¼ 0.4, produces less power thanthe P&O algorithm. This is because inappropriate parameter set-tings cause a slow tracking speedwhich results in the algorithm notconverging before the next perturbation occurs. While this methodis very efficient for relatively stable and long non-transient partialshadings on the PV modules, it is not suitable when the PV systemis located where many fast irradiance transitions occur, such as inthe tropics [1]. This is because the global tracking PSO algorithmrequires a relatively long time to track the global MPP.
Moreover, from the experiment we found that the performanceof the PSO based MPPT is very sensitive to the parameter settings.Whereas, DE based MPPT is less sensitive to the parameters thanPSO for various shading pattern changes. As shown in Table 6, DEstill can output more power than the conventional P&O algorithmand shows little difference in the power capture for differentparameter settings. As expected, the Fibonacci search MPPT has afast tracking speed but it is not a global tracking method and thusproduces less power than the proposedmethod. Compared to these
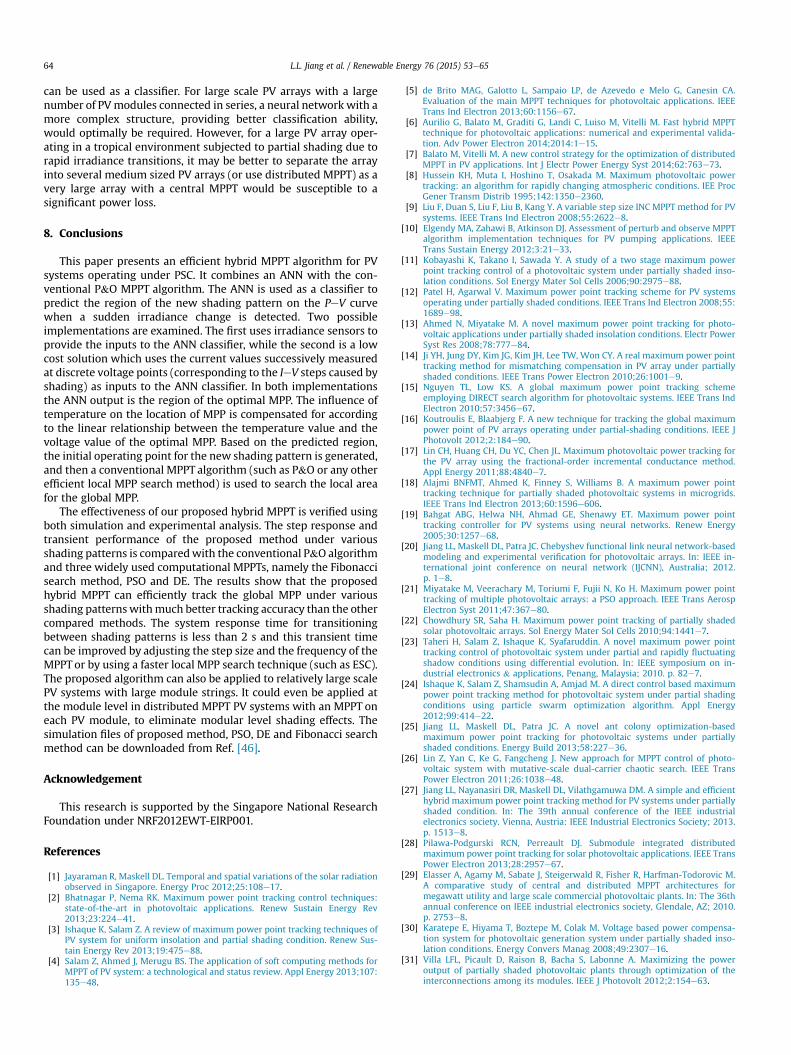
Fig. 21. (a) The voltage and current readings at the output of the PV simulator using the pdashed box. The voltage and current gains are 33.7 and 1.3, respectively.
four MPPTs, the proposed hybrid MPPT can track the global MPP forall shading patterns with a relatively fast tracking speed and out-puts the maximum energy. The corresponding power curve foreach MPPT is shown in Fig. 19.
To illustrate the tracking performance of the proposed hybridMPPT in detail, we examine the tracking mechanism for the 40 s to80 s period (inside the dashed box) in Fig. 19. Four shading patterns(SP5, SP6, SP7 and SP8) are applied during this period. Fig. 20 showsthe PeV curves (with the ordinate values of global MPPs) for thesefour shading patterns. From Fig. 19, we can see that the hybridMPPTcan successfully find the global MPP for all these four shadingpatterns, while P&O fails to track the global MPP for SP5, SP7 andSP8. DE tracks to the global MPP for SP6, SP7 and SP8 but convergesto the local maxima for SP5 at point F as shown in Fig. 20. PSO takesa long time to converge to the global point A (SP5). The Fibonaccisearch method can track the global MPP for all shading patternsexcept SP7. All methods can adequately track to the global MPP forSP6. During the transition from SP5 to SP6, the operating point forthe P&O algorithm is expected to move from point A to the localmaxima (point E in Fig. 20). However, as this local maxima has arelatively small amplitude, system noise allows it to move to theglobal MPP (point B). It should be noted that when the operatingcurrent is low (under low irradiance), the power curve becomesvery flat, such as the area from 20 V to Voc_STC for SP7 in Fig. 20. Thismay lead to the operating point shifting in a large range of voltagedue to measurement noise in the voltage and current signals andmay even cause the operating point tomove between adjacent localmaxima. If the adjacent region contains the global MPP, it canimprove the power capture, but if there is a local maximawhich haslower power value, then it will decrease the performance of thesystem.
Fig. 21(a) shows the voltage and current readings from the PVarray output for the complete experiment (250 s) using the pro-posed hybrid MPPT, while Fig. 21(b) shows the zoomed region forSP5, SP6, SP7 and SP8. The voltage reading is measured from theoutput of the amplifier in the voltage sensor. The voltage and cur-rent gain are 33.7 and 1.3 respectively. From Fig. 21(b), we can seethat the average transient time for tracking the global MPP for anew shading pattern is about 1.5e2 s. The transient time can befurther improved by changing the values of MPPT frequency andthe duty ratio.
While the experimental results presented above are limited toan array string of only four modules, the proposed hybrid MPPT canbe easily scaled to larger PV arrays with more series connectedmodules. The success of applying this technique depends on theclassification ability of the neural network. For small or mediumsized PV arrays, neural networks with a simple structure, such aswidely used back propagation and feedforward neural networks,
roposed hybrid MPPT for 25 shading patterns, and (b) the zoomed region within the
L.L. Jiang et al. / Renewable Energy 76 (2015) 53e6564
can be used as a classifier. For large scale PV arrays with a largenumber of PVmodules connected in series, a neural network with amore complex structure, providing better classification ability,would optimally be required. However, for a large PV array oper-ating in a tropical environment subjected to partial shading due torapid irradiance transitions, it may be better to separate the arrayinto several medium sized PV arrays (or use distributed MPPT) as avery large array with a central MPPT would be susceptible to asignificant power loss.
8. Conclusions
This paper presents an efficient hybrid MPPT algorithm for PVsystems operating under PSC. It combines an ANN with the con-ventional P&O MPPT algorithm. The ANN is used as a classifier topredict the region of the new shading pattern on the PeV curvewhen a sudden irradiance change is detected. Two possibleimplementations are examined. The first uses irradiance sensors toprovide the inputs to the ANN classifier, while the second is a lowcost solution which uses the current values successively measuredat discrete voltage points (corresponding to the IeV steps caused byshading) as inputs to the ANN classifier. In both implementationsthe ANN output is the region of the optimal MPP. The influence oftemperature on the location of MPP is compensated for accordingto the linear relationship between the temperature value and thevoltage value of the optimal MPP. Based on the predicted region,the initial operating point for the new shading pattern is generated,and then a conventional MPPT algorithm (such as P&O or any otherefficient local MPP search method) is used to search the local areafor the global MPP.
The effectiveness of our proposed hybrid MPPT is verified usingboth simulation and experimental analysis. The step response andtransient performance of the proposed method under variousshading patterns is comparedwith the conventional P&O algorithmand three widely used computational MPPTs, namely the Fibonaccisearch method, PSO and DE. The results show that the proposedhybrid MPPT can efficiently track the global MPP under variousshading patterns withmuch better tracking accuracy than the othercompared methods. The system response time for transitioningbetween shading patterns is less than 2 s and this transient timecan be improved by adjusting the step size and the frequency of theMPPT or by using a faster local MPP search technique (such as ESC).The proposed algorithm can also be applied to relatively large scalePV systems with large module strings. It could even be applied atthe module level in distributed MPPT PV systems with an MPPT oneach PV module, to eliminate modular level shading effects. Thesimulation files of proposed method, PSO, DE and Fibonacci searchmethod can be downloaded from Ref. [46].
Acknowledgement
This research is supported by the Singapore National ResearchFoundation under NRF2012EWT-EIRP001.
References
[1] Jayaraman R, Maskell DL. Temporal and spatial variations of the solar radiationobserved in Singapore. Energy Proc 2012;25:108e17.
[2] Bhatnagar P, Nema RK. Maximum power point tracking control techniques:state-of-the-art in photovoltaic applications. Renew Sustain Energy Rev2013;23:224e41.
[3] Ishaque K, Salam Z. A review of maximum power point tracking techniques ofPV system for uniform insolation and partial shading condition. Renew Sus-tain Energy Rev 2013;19:475e88.
[4] Salam Z, Ahmed J, Merugu BS. The application of soft computing methods forMPPT of PV system: a technological and status review. Appl Energy 2013;107:135e48.
[5] de Brito MAG, Galotto L, Sampaio LP, de Azevedo e Melo G, Canesin CA.Evaluation of the main MPPT techniques for photovoltaic applications. IEEETrans Ind Electron 2013;60:1156e67.
[6] Aurilio G, Balato M, Graditi G, Landi C, Luiso M, Vitelli M. Fast hybrid MPPTtechnique for photovoltaic applications: numerical and experimental valida-tion. Adv Power Electron 2014;2014:1e15.
[7] Balato M, Vitelli M. A new control strategy for the optimization of distributedMPPT in PV applications. Int J Electr Power Energy Syst 2014;62:763e73.
[8] Hussein KH, Muta I, Hoshino T, Osakada M. Maximum photovoltaic powertracking: an algorithm for rapidly changing atmospheric conditions. IEE ProcGener Transm Distrib 1995;142:1350e2360.
[9] Liu F, Duan S, Liu F, Liu B, Kang Y. A variable step size INC MPPT method for PVsystems. IEEE Trans Ind Electron 2008;55:2622e8.
[10] Elgendy MA, Zahawi B, Atkinson DJ. Assessment of perturb and observe MPPTalgorithm implementation techniques for PV pumping applications. IEEETrans Sustain Energy 2012;3:21e33.
[11] Kobayashi K, Takano I, Sawada Y. A study of a two stage maximum powerpoint tracking control of a photovoltaic system under partially shaded inso-lation conditions. Sol Energy Mater Sol Cells 2006;90:2975e88.
[12] Patel H, Agarwal V. Maximum power point tracking scheme for PV systemsoperating under partially shaded conditions. IEEE Trans Ind Electron 2008;55:1689e98.
[13] Ahmed N, Miyatake M. A novel maximum power point tracking for photo-voltaic applications under partially shaded insolation conditions. Electr PowerSyst Res 2008;78:777e84.
[14] Ji YH, Jung DY, Kim JG, Kim JH, Lee TW, Won CY. A real maximum power pointtracking method for mismatching compensation in PV array under partiallyshaded conditions. IEEE Trans Power Electron 2010;26:1001e9.
[15] Nguyen TL, Low KS. A global maximum power point tracking schemeemploying DIRECT search algorithm for photovoltaic systems. IEEE Trans IndElectron 2010;57:3456e67.
[16] Koutroulis E, Blaabjerg F. A new technique for tracking the global maximumpower point of PV arrays operating under partial-shading conditions. IEEE JPhotovolt 2012;2:184e90.
[17] Lin CH, Huang CH, Du YC, Chen JL. Maximum photovoltaic power tracking forthe PV array using the fractional-order incremental conductance method.Appl Energy 2011;88:4840e7.
[18] Alajmi BNFMT, Ahmed K, Finney S, Williams B. A maximum power pointtracking technique for partially shaded photovoltaic systems in microgrids.IEEE Trans Ind Electron 2013;60:1596e606.
[19] Bahgat ABG, Helwa NH, Ahmad GE, Shenawy ET. Maximum power pointtracking controller for PV systems using neural networks. Renew Energy2005;30:1257e68.
[20] Jiang LL, Maskell DL, Patra JC. Chebyshev functional link neural network-basedmodeling and experimental verification for photovoltaic arrays. In: IEEE in-ternational joint conference on neural network (IJCNN), Australia; 2012.p. 1e8.
[21] Miyatake M, Veerachary M, Toriumi F, Fujii N, Ko H. Maximum power pointtracking of multiple photovoltaic arrays: a PSO approach. IEEE Trans AerospElectron Syst 2011;47:367e80.
[22] Chowdhury SR, Saha H. Maximum power point tracking of partially shadedsolar photovoltaic arrays. Sol Energy Mater Sol Cells 2010;94:1441e7.
[23] Taheri H, Salam Z, Ishaque K, Syafaruddin. A novel maximum power pointtracking control of photovoltaic system under partial and rapidly fluctuatingshadow conditions using differential evolution. In: IEEE symposium on in-dustrial electronics & applications, Penang, Malaysia; 2010. p. 82e7.
[24] Ishaque K, Salam Z, Shamsudin A, Amjad M. A direct control based maximumpower point tracking method for photovoltaic system under partial shadingconditions using particle swarm optimization algorithm. Appl Energy2012;99:414e22.
[25] Jiang LL, Maskell DL, Patra JC. A novel ant colony optimization-basedmaximum power point tracking for photovoltaic systems under partiallyshaded conditions. Energy Build 2013;58:227e36.
[26] Lin Z, Yan C, Ke G, Fangcheng J. New approach for MPPT control of photo-voltaic system with mutative-scale dual-carrier chaotic search. IEEE TransPower Electron 2011;26:1038e48.
[27] Jiang LL, Nayanasiri DR, Maskell DL, Vilathgamuwa DM. A simple and efficienthybrid maximum power point tracking method for PV systems under partiallyshaded condition. In: The 39th annual conference of the IEEE industrialelectronics society. Vienna, Austria: IEEE Industrial Electronics Society; 2013.p. 1513e8.
[28] Pilawa-Podgurski RCN, Perreault DJ. Submodule integrated distributedmaximum power point tracking for solar photovoltaic applications. IEEE TransPower Electron 2013;28:2957e67.
[29] Elasser A, Agamy M, Sabate J, Steigerwald R, Fisher R, Harfman-Todorovic M.A comparative study of central and distributed MPPT architectures formegawatt utility and large scale commercial photovoltaic plants. In: The 36thannual conference on IEEE industrial electronics society, Glendale, AZ; 2010.p. 2753e8.
[30] Karatepe E, Hiyama T, Boztepe M, Colak M. Voltage based power compensa-tion system for photovoltaic generation system under partially shaded inso-lation conditions. Energy Convers Manag 2008;49:2307e16.
[31] Villa LFL, Picault D, Raison B, Bacha S, Labonne A. Maximizing the poweroutput of partially shaded photovoltaic plants through optimization of theinterconnections among its modules. IEEE J Photovolt 2012;2:154e63.

L.L. Jiang et al. / Renewable Energy 76 (2015) 53e65 65
[32] Abdalla I, Corda J, Zhang L. Multilevel DC-link inverter and control algorithmto overcome the PV partial shading. IEEE Trans Power Electron 2013;28:14e8.
[33] Petrone G, Spagnuolo G, Teodorescu R, Veerachary M, Vitelli M. Reliabilityissues in photovoltaic power processing systems. IEEE Trans Ind Electron2008;55:2569e80.
[34] Bazzi AM, Krein PT. Ripple correlation control: an extremum seeking controlperspective for real-time optimization. IEEE Trans Power Electron 2014;29:988e95.
[35] Lei P, Li Y, Seem JE. Sequential ESC-based global MPPT control for photovoltaicarray with variable shading. IEEE Trans Sustain Energy 2011;2:348e58.
[36] Bodur M, Ermis M. Maximum power point tracking for low power photo-voltaic solar panels. In: The 7th Mediterranean electrotechnical conference,Antalya, Turkey; 1994. p. 758e61.
[37] Boztepe M, Guinjoan F, Velasco-Quesada G, Silvestre S, Chouder A,Karatepe E. Global MPPT scheme for photovoltaic string inverters based onrestricted voltage window search algorithm. IEEE Trans Ind Electron2014;61:3302e12.
[38] Punitha K, Devaraj D, Sakthivel S. Artificial neural network based modifiedincremental conductance algorithm for maximum power point tracking inphotovoltaic system under partial shading conditions. Energy 2013;62:330e40.
[39] Lian KL, Jhang JH, Tian IS. A maximum power point tracking method based onperturb-and-observe combined with particle swarm optimization. IEEE JPhotovolt 2014;4:626e33.
[40] Mellit A, Kalogirou SA. MPPT-based artificial intelligence techniques forphotovoltaic systems and its implementation into field programmable gatearray chips: review of current status and future perspectives. Energy 2014;70:1e21.
[41] Ishaque K, Salam Z, Syafaruddin. A comprehensive MATLAB Simulink PVsystem simulator with partial shading capability based on two-diode model.Sol Energy 2011;85:2217e27.
[42] Bishop CM. Neural networks for pattern recognition. Oxford University Press;1995.
[43] Villalva MG, Gazoli JR, Filho ER. Comprehensive approach to modeling andsimulation of photovoltaic arrays. IEEE Trans Power Electron 2009;24:1198e208.
[44] Jiang LL, Maskell DL, Patra JC. Parameter estimation of solar cells and modulesusing an improved adaptive differential evolution algorithm. Appl Energy2013;112:185e93.
[45] Liu Y-H, Huang J-W. A fast and low cost analog maximum power pointtracking method for low power photovoltaic systems. Sol Energy 2011;85:2771e80.
[46] https://sites.google.com/site/lianlianjiangntu/.