Embed Size (px)
Citation preview
BRITISH STANDARD BS 923-1:1990IEC 60-1:1989Incorporating Amendment No. 1
Guide on
High-voltage testing techniques —
Part 1: General —
(Implementation of CENELEC HD 588.1 S1)
BS 923-1:1990
This British Standard, having been prepared under the direction of the Power Electrical Engineering Standards Policy Committee, was published under the authority of the Board of BSI and comes into effect on 30 November 1990
© BSI 03-1999
First published November 1980Second edition November 1990
The following BSI references relate to the work on this standard:Committee reference PEL/62Draft for comment 87/20861 DC
ISBN 0 580 18895 7
Committees responsible for this British Standard
The preparation of this British Standard was entrusted by the Power Electrical Engineering Standards Policy Committee (PEL/-) to Technical Committee PEL/62, upon which the following bodies were represented:
ASTA Certification ServicesBritish Cable Makers ConfederationBritish Industrial Ceramic Manufacturers AssociationDepartment of Trade and Industry (Namas Executive)Electrical and Electronic Insulation Association (BEAMA Ltd.)Electricity Supply Industry in England and WalesInstitute of Science TechnologyTransmission and Distribution Association (BEAMA Ltd.)University of Manchester
Amendments issued since publication
Amd. No. Date Comments
6880 February 1992
Indicated by a sideline in the margin
BS 923-1:1990
© BSI 03-1999 i
Contents
PageCommittees responsible Inside front coverNational foreword iiSection 1. General1 Scope 12 Object 1Section 2. General Definitions3 Impulses 23.1 Lightning and switching impulses 24 Characteristics related to disruptive discharge and test
voltages 24.1 Disruptive discharge 24.2 Characteristics of the test voltage 24.3 Disruptive discharge voltage of a test object 34.4 Statistical characteristics of disruptive discharge voltages 34.5 Withstand voltage of a test object 34.6 Assured disruptive discharge voltage of a test object 35 Classification of insulation in test objects 35.1 External insulation 35.2 Internal insulation 45.3 Self-restoring insulation 45.4 Non-self-restoring insulation 4Section 3. General Requirements Relating to Test Procedures and Test Objects6 General requirements for test procedures 57 General arrangement of the test object 58 Dry tests 59 Wet tests 59.1 Standard wet test procedure 59.2 Traditional procedures for wet tests with
alternating voltages 710 Artificial pollution tests 710.1 Preparation of test object 710.2 Test procedures 710.3 Degree of pollution 811 Atmospheric conditions 911.1 Standard reference atmosphere 911.2 Atmospheric correction factors 911.3 Wet tests, test under artificial pollution and
combined tests 1011.4 Conflicting requirements for testing internal and
external insulation 1011.5 Measurement of humidity 10Section 4. Tests with Direct Voltage12 Definitions for direct voltage tests 1112.1 Value of the test voltage 1112.2 Ripple 1113 Test voltage 1113.1 Requirements for the test voltage 1113.2 Generation of the test voltage 11
BS 923-1:1990
ii © BSI 03-1999
Page13.3 Measurement of the test voltage 1113.4 Measurement of the test current 1214 Test procedures 1214.1 Withstand voltage tests 1214.2 Disruptive discharge voltage tests 1314.3 Assured disruptive discharge voltage tests 13Section 5. Tests with Alternating Voltage15 Definitions for alternating voltage tests 1415.1 Definitions for alternating voltage tests 1415.2 Peak value 1415.3 R.M.S. value 1416 Test Voltage 1416.1 Requirements for the test voltage 1416.2 Generation of the test voltage 1416.3 Measurement of the test voltage 1517 Test procedures 1617.1 Withstand voltage tests 1617.2 Disruptive discharge voltage tests 1617.3 Assured disruptive discharge voltage tests 16Section 6. Tests with Lightning Impulse Voltage18 Definitions for lightning impulse tests 1718.1 Definitions of general applicability 1718.2 Definitions applicable only to chopped impulses 1718.3 Voltage/time curves 1819 Test Voltage 1819.1 Standard lightning impulse 1819.2 Tolerances 1819.3 Standard chopped lightning impulse 1919.4 Special lightning impulses 1919.5 Generation of the test voltage 1919.6 Measurement of the test voltage and determination of
impulse shape 1919.7 Measurement of current during tests with impulse voltages 2020 Test Procedures 2020.1 Withstand voltage tests 2020.2 Procedures for assured discharge voltage tests 21Section 7. Tests with Switching Impulses21 Definitions for switching impulse tests 2221.1 Switching impulse 2221.2 Value of the test voltage 2221.3 Time to peak Tp 2221.4 Time to half-value T2 2221.5 Time above 90 % Td 2221.6 Time to zero T0 2221.7 Time to chopping Tc 2221.8 Linearly rising impulse 2222 Test voltage 2222.1 Standard switching impulse 22
BS 923-1:1990
© BSI 03-1999 iii
Page22.2 Tolerances 2322.3 Special switching impulses 2322.4 Generation of the test voltage 2322.5 Measurement of test voltage and determination of
impulse shape 2323 Test procedures 23Section 8. Tests with Impulse Current24 Definitions for impulse current tests 2424.1 Impulse current 2424.2 Value of the test current 2424.3 Front time T1 2424.4 Virtual origin O1 2424.5 Time to half-value T2 2424.6 Duration of peak of a rectangular impulse current Td 2424.7 Total duration of a rectangular impulse current Tt 2425 Test current 2425.1 Standard impulse currents 2425.2 Tolerances 2525.3 Measurement of the test current 2525.4 Measurement of voltage during tests with impulse current 25Section 9. Combined and Composite Tests26 Combined voltage tests 2626.1 Value of the test voltage U 2626.2 Time delay %t 2626.3 Actual voltage shapes 2626.4 Arrangement of the test object 2626.5 Atmospheric correction factors 2627 Composite tests 26Appendix A Statistical Treatment of Test ResultsA.1 Classification of tests 27A.1.1 Class 1: Multiple-level tests 27A.1.2 Class 2: Up-and-down tests 27A.1.3 Class 3: Successive Discharge Tests 27A.2 Statistical Behaviour of Disruptive Discharge 27A.2.1 Confidence limits and statistical error 28A.3 Analysis of Test Results 28A.3.1 Treatment of Results from Class 1 Tests 28A.3.2 Treatment of Results from Class 2 Tests 28A.3.3 Treatment of Results from Class 3 Tests 29A.4 Application of likelihood methods 29A.4.1 The likelihood function 30A.4.2 Estimation of U50 and z 30Appendix B Pollution Test ProceduresB.1 Production of salt fog 30B.1.1 Preparation of salt solution 30B.1.2 Details of spraying system 30B.2 Pre-deposition of pollution, coating and wetting procedure 31B.2.1 Preparation of coating material 31
BS 923-1:1990
iv © BSI 03-1999
PageB.2.2 Main characteristics of the inert materials 31B.2.3 Solid coating and wetting procedure 31B.3 Measurement of the degree of pollution 31B.3.1 Surface conductivity of the insulating surface 31B.3.2 Equivalent amount of sodium chloride per square
centimetre of the insulating surface (S.D.D. mg/cm2) 32Appendix C Calibration of a Non-Approved Measurement Device with a Rod/Rod GapC.1 General arrangement of a rod/rod gap 32C.2 Reference Values 32C.3 Calibration Procedure 33Figure 1 — Minimum clearance D of extraneous live or grounded objects to the energized electrode of a test object, during an a.c. or positive switching impulse test at the maximum voltage U applied during test 33Figure 2 a) — Nozzle type I 34Figure 2 b) — Nozzle type II 34Figure 2 c) — Nozzle type III (details of orifice only) 35Figure 2 d) — Nozzle type IV (American practice) 36Figure 3 — k as a function of the ratio of absolute humidity h to the relative air density $ 37Figure 4 — Values of exponents m for air density correction and w for humidity correction as a function of parameter g: see 11.2.3 38Figure 5 — Absolute humidity of air as a function of dry- and wet-bulb thermometer readings; see 11.5. Curves of relative humidity are also given 39Figure 6 — Full lightning impulse 40Figure 7 — Lightning impulse chopped on the front 40Figure 8 — Lightning impulse chopped on the tail 41Figure 9 — Linearly rising front chopped impulse 41Figure 10 — Examples of lightning impulses with oscillations or overshoot 42Figure 11 — Voltage/time curve for impulses of constant prospective shape 43Figure 12 — “Maximum permissible amplitude of oscillations on the wave-front” 43Figure 13 — Full switching impulse 44Figure 14 a) — Impulse current — Exponential 44Figure 14 b) — Impulse current — Rectangular 45Figure 15 a) — Example of test circuit for combined voltage tests 45Figure 15 b) — Example of voltage waves during combinedvoltage tests giving value of test voltage U 46Figure 16 — Resistivity of a solution of sodium chloride (NaCl) in water, as a function of salinity at solution temperature t of 10 °C, 20 °C, and 30 °C 47Figure 17 — Density of solution of sodium chloride (NaCl) in water, as a function of salinity at solution temperature t of 10 °C, 20 °C, and 30 °C 48Figure 18 — Saline fog jet; see Appendix A 49Figure 19 a) — Vertical arrangement of rod/rod gap 50
BS 923-1:1990
© BSI 03-1999 v
PageFigure 19 b) — Horizontal arrangement of rod/rod gap 50Figure 20 — Definition of time delay %t 51Table 1 — Precipitation conditions for standard procedure 6Table 2 — Precipitation conditions for traditional procedures with alternating voltages 7Table A1 29Publications referred to Inside back cover
BS 923-1:1990
vi © BSI 03-1999
National foreword
This British Standard has been prepared under the direction of the Power Electrical Engineering Standards Policy Committee. It is a revision of BS 923-1:1980 which is withdrawn. It is identical with IEC 60-1:1989 “High voltage test techniques” — Part 1 “General definitions and test requirement” published by the International Electrotechnical Commission (IEC).This Part of BS 923 also implements Harmonization Document HD 588.1 S1 which was published by the European Committee for Electrotechnical Standardization (CENELEC).The following dates were fixed by CENELEC:
The Technical Committee has reviewed the provisions of IEC 52 “Recommendations for voltage measurement by means of sphere gaps (one sphere earthed)”, to which reference is made in the text, and has decided that they are acceptable for use in conjuction with this standard. A related British Standard to IEC 52 is BS 358:1960 “Method for the measurement of voltages with sphere gaps”.Textual errors. When adopting the text of the international standard, the textual errors listed below were discovered. They have been marked in the text and have been reported to the International Electrotechnical Commission in a proposal to amend the text of the international standard.
a) In 18.1.2, the reference to Figure 7 — Figure 9 should read “Figure 7 — Figure 8”.b) In 18.1.4, the reference to Figure 6 — Figure 9 should read “Figure 6 — Figure 8”.
— latest date of announcement of the HD at national level (doa) 1992-01-01
— latest date of publication of a harmonized national standard (dop) 1992-07-01
— latest date of withdrawal of conflicting national standards (dow) 1992-07-01
Cross-references
International standard Corresponding British Standard
IEC 60 BS 923 Guide on high-voltage testing techniquesIEC 60-2:1973 Part 2:1980 Test procedures
(Identical)IEC 60-3:1976 Part 3:1980 Measuring devices
(Identical)IEC 60-4:1977 Part 4:1980 Application guide for measuring devices
(Identical)IEC 270:1981 BS 4828:1985 Guide for partial discharge measurements
(Identical)
BS 923-1:1990
© BSI 03-1999 vii
c) In 18.1.5, the reference to Figure 6 — Figure 9 should read “Figure 6 — Figure 8”.d) In the caption for Figure 1, “text object” should read “test object”.e) In Figure 2 c), the entry “I et II” in the table should read “I and II”.f) In Figure 13, the value of 0.55 on the U axis should read 0.50. The label T1 should read Td.
A British Standard does not purport to include all the necessary provisions of a contract. Users of British Standards are responsible for their correct application.
Compliance with a British Standard does not of itself confer immunity from legal obligations.
Summary of pagesThis document comprises a front cover, an inside front cover, pages i to viii, pages 1 to 52, an inside back cover and a back cover.This standard has been updated (see copyright date) and may have had amendments incorporated. This will be indicated in the amendment table on the inside front cover.

viii blank
BS 923-1:1990
© BSI 03-1999 1
Section 1. General
1 ScopeThis standard is applicable to:
— dielectric tests with direct voltage;— dielectric tests with alternating voltage;— dielectric tests with impulse voltage;— tests with impulse current;— tests with combinations of the above.
This standard is applicable only to tests on equipment having its highest voltage for equipment Um above 1 kV.This standard is not intended to be used for electromagnetic compatibility tests on electric or electronic equipment.
2 ObjectThe object of this standard is:
— to define terms of both general and specific applicability;— to present general requirements regarding test objects and test procedures;— to describe methods for generation and measurement of test voltages and currents;— to describe test procedures;— to describe methods for the evaluation of test results and to indicate criteria for acceptance or refusal.
Definitions and requirements concerning approved measuring devices and checking methods are given in IEC Publication 60-3: High Voltage Test Techniques — Measuring Devices.Alternative test procedures may be required to obtain reproducible and significant results. The choice of a suitable test procedure should be made by the relevant Technical Committee.
BS 923-1:1990
2 © BSI 03-1999
Section 2. General Definitions
3 ImpulsesAn impulse is an intentionally applied aperiodic transient voltage or current which usually rises rapidly to a peak value and then falls more slowly to zero.For special purposes, impulses having approximately linearly rising fronts or transients of oscillating or approximately rectangular form are used.The term “impulse” is to be distinguished from the term “surge” which refers to transients occurring in electrical equipment or networks in service.
3.1 Lightning and switching impulses
A distinction is made between lightning and switching impulses on the basis of duration of the front. Impulses with front duration up to 20 4s are defined as lightning impulses and those with longer fronts are defined as switching impulses.Generally, switching impulses are also characterized by total durations considerably longer than those of lightning impulses.
4 Characteristics related to disruptive discharge and test voltages4.1 Disruptive discharge
In this standard, the term “disruptive discharge” (sometimes referred to as “electrical breakdown”) relates to phenomena associated with the failure of insulation under electrical stress, in which the discharge completely bridges the insulation under test, reducing the voltage between the electrodes practically to zero. It applies to electrical breakdown in solid, liquid and gaseous dielectrics and combinations of these.Non-sustained disruptive discharge in which the test object is momentarily bridged by a spark or arc may occur. During these events the voltage across the test object is momentarily reduced to zero or to a very small value. Depending on the characteristics of the test circuit and the test object, a recovery of dielectric strength may occur and may even permit the test voltage to reach a higher value. Such an event should be interpreted as a disruptive discharge unless otherwise specified by the relevant Technical Committee.Non-disruptive discharges such as those between intermediate electrodes or conductors may also occur without reduction of the test voltage to zero. Such an event should not be interpreted as a disruptive discharge unless so specified by the relevant Technical Committee.Some non-disruptive discharges are termed “partial discharges” and are dealt with in IEC Publication 270: Partial Discharge Measurements.The term “sparkover” is used when a disruptive discharge occurs in a gaseous or liquid medium.The term “flashover” is used when a disruptive discharge occurs over the surface of a dielectric in a gaseous or liquid medium.The term “puncture” is used when a disruptive discharge occurs through a solid dielectric.A disruptive discharge in a solid dielectric produces permanent loss of dielectric strength; in a liquid or gaseous dielectric the loss may be only temporary.
4.2 Characteristics of the test voltage
The characteristics of a test voltage are those characteristics specified in this standard for designating the different types of voltage excursion that define the test voltage.
4.2.1 Prospective characteristics of a test voltage
The prospective characteristics of a test voltage causing disruptive discharge are the characteristics which would have been obtained if no disruptive discharge had occurred. When a prospective characteristic is used, this shall always be stated.
4.2.2 Actual characteristics of a test voltage
The actual characteristics of a test voltage are those which occur during the test at the terminals of the test object.
4.2.3 Value of the test voltage
The value of the test voltage is defined in the relevant Clauses of the present standard.
BS 923-1:1990
© BSI 03-1999 3
4.3 Disruptive discharge voltage of a test object
The disruptive discharge voltage of a test object is the value of the test voltage causing disruptive discharge, as specified, for the various tests, in the relevant Clauses of the present standard.
4.4 Statistical characteristics of disruptive discharge voltages
Disruptive discharge voltages are subject to random variations and, usually, a number of observations must be made in order to obtain a statistically significant value of the voltage. The test procedures, described in the present standard, are generally based on statistical considerations. Information on the statistical evaluation of test results is given in Appendix A.
4.4.1 Disruptive discharge probability p of a test object
The disruptive discharge probability p of a test object is the probability that one application of a certain prospective voltage value of a given shape will cause disruptive discharge in the test object. The parameter p may be expressed as a percentage or a fraction.
4.4.2 Withstand probability q of a test object
The withstand probability q of a test object is the probability that one application of a certain prospective voltage value of a given shape does not cause a disruptive discharge on the test object. If the disruptive discharge probability is p, the withstand probability q is (1 – p).
4.4.3 50 % disruptive discharge voltage U50 of a test object
The 50 % disruptive discharge voltage is the prospective voltage value which has a 50 % probability of producing a disruptive discharge on the test object.
4.4.4 p % disruptive discharge voltage Up of a test object
The p % disruptive discharge voltage of a test object is the prospective voltage value which has p % probability of producing a disruptive discharge on the test object.
4.4.5 Conventional deviation z of the disruptive discharge voltage of a test object
The conventional deviation z of the disruptive discharge voltage of a test object is the difference between its 50 % and 16 % disruptive discharge voltages. It is often expressed in per unit or percentage value, referred to the 50 % disruptive discharge voltage.NOTE If the disruptive–discharge probability function (see Appendix A) is close to a Gaussian function, z is correspondingly close to its standard deviation.
4.5 Withstand voltage of a test object
The withstand voltage of a test object is a specified prospective voltage value which characterizes the insulation of the object with regard to a withstand test.Unless otherwise specified, withstand voltages are referred to standard reference atmospheric conditions (see Clause 11.1).
4.6 Assured disruptive discharge voltage of a test object
The assured disruptive discharge voltage of a test object is a specified prospective voltage value which characterizes its performance with regard to a disruptive discharge test.
5 Classification of insulation in test objectsInsulation systems of apparatus and high voltage structures must basically be classified into self-restoring and non-self-restoring insulation and may consist of external and/or internal insulation.
5.1 External insulation
External insulation is the air insulation and the exposed surfaces of solid insulation of the equipment, which are subject both to dielectric stresses and to the effects of atmospheric and other external conditions such as pollution, humidity and vermin.
BS 923-1:1990
4 © BSI 03-1999
5.2 Internal insulation
Internal insulation comprises the internal solid, liquid or gaseous elements of the insulation of equipment, which are protected from the effects of atmospheric and other external conditions such as pollution, humidity and vermin.
5.3 Self-restoring insulation
Self-restoring insulation is the insulation which completely recovers its insulating properties after a disruptive discharge caused by the application of a test voltage.
5.4 Non-self-restoring insulation
Non-self-restoring insulation is insulation which loses its insulating properties, or does not recover them completely, after a disruptive discharge caused by the application of a test voltage.NOTE In high voltage apparatus, parts of both self-restoring and non-self-restoring insulation are always operating in combination and some parts may be degraded by repeated or continued voltage applications. The behaviour of the insulation in this respect shall be taken into account by the relevant Technical Committee when specifying the test procedures to be applied.
BS 923-1:1990
© BSI 03-1999 5
Section 3. General Requirements Relating to Test Procedures and Test Objects6 General requirements for test proceduresThe test procedures applicable to particular types of test objects, for example, the polarity to be used, the preferred order if both polarities are to be used, the number of applications and the interval between applications shall be specified by the relevant Technical Committee, having regard to such factors as:
— the required accuracy of test results;— the random nature of the observed phenomenon and any polarity dependence of the measured characteristics;— the possibility of progressive deterioration with repeated voltage applications.
7 General arrangement of the test objectAt the time of a test, the test object shall be complete in all essential details, and it should have been processed in the normal manner for similar equipment.The disruptive discharge characteristics of an object may be affected by its general arrangement (for example, by its clearance from other live or grounded structures, its height above ground level and the arrangement of its high voltage lead). The general arrangement should be specified by the relevant Technical Committee.A clearance to extraneous structures not less than 1,5 times the length of the shortest possible discharge path on the test object usually makes such proximity effects negligible. In wet or pollution tests, or wherever the voltage distribution along the test object and the electric field around its energized electrode are sufficiently independent of external influences, smaller clearances may be acceptable, provided that discharges do not occur to extraneous structures.In the case of a.c. or positive switching impulse tests above 750 kV (peak) the influence of an extraneous structure may be considered as negligible if its distance from the energized electrode is also not less than the height of this electrode above the ground plane. A practical lower limit to this clearance is given in Figure 1, as a function of the highest test voltage.A withstand test may be acceptable when successfully performed with shorter distances to earthed objects.
8 Dry testsThe test object shall be dry and clean. If not otherwise specified by the relevant Technical Committee, the test should be made at ambient temperature and the procedure for voltage application shall be as specified in the relevant Clauses of this standard.
9 Wet testsThe preferred wet test procedure, described in 9.1, is intended to simulate the effect of natural rain on external insulation and is a revision of earlier test methods. It is recommended for tests with all types of test voltages and on all types of apparatus, but either of the alternative test methods given below are permitted if specified by the relevant Technical Committee.Two earlier test methods, not intended to simulate natural rain, are described in 9.2. They have been in use for many years for tests with alternating voltages on apparatus having Um up to 420 kV and many test data obtained by these methods exist.For a.c. apparatus of large dimensions, such as those having Um higher than 800 kV, no appropriate wet test procedure is available at present.The relevant Technical Committee shall specify the arrangement of the test object during the test procedure.
9.1 Standard wet test procedure
The test object shall be sprayed with water of prescribed resistivity and temperature (see Table 1) falling on it as droplets (avoiding fog and mist) and directed so that the vertical and horizontal components of the spray intensity are approximately equal. These intensities are measured with a divided collecting vessel having openings of 100 cm2 to 750 cm2, one horizontal and one vertical, the vertical opening facing the spray.The position of the test object relative to the vertical and horizontal rain components shall be specified by the relevant Technical Committee.
BS 923-1:1990
6 © BSI 03-1999
In general, the reproducibility of wet test results is less than that for other high voltage discharge or withstand tests. To minimize the dispersion the following precautions shall be taken:
— The collecting vessel shall be placed close to the test object, but avoiding the collection of drops or splashes from it. During the measuring period, it should be moved slowly over a sufficient area to average but not completely mask the effect of non-uniformities of the spray from individual nozzles. This measuring zone shall have a width equal to that of the test object and a maximum height of 1 m;— For test objects between 1 m and 3 m in height, the individual measurements shall be made at the top, centre and bottom of the test object. Each measuring zone shall cover only one third of the height of the test object;— For test objects exceeding 3 m in height, the number of measuring zones shall be increased to cover the full height of the test object without overlapping;— The above procedures shall be suitably adapted for test objects having large horizontal dimensions;— The spread of results may be reduced if the test object is cleaned with a surface-active detergent which has to be removed before the beginning of wetting;— The spread of results may also be affected by local anomalous (high or low) precipitation rates. It is recommended to detect these by localized measurements and to improve the uniformity of the spray, if necessary.
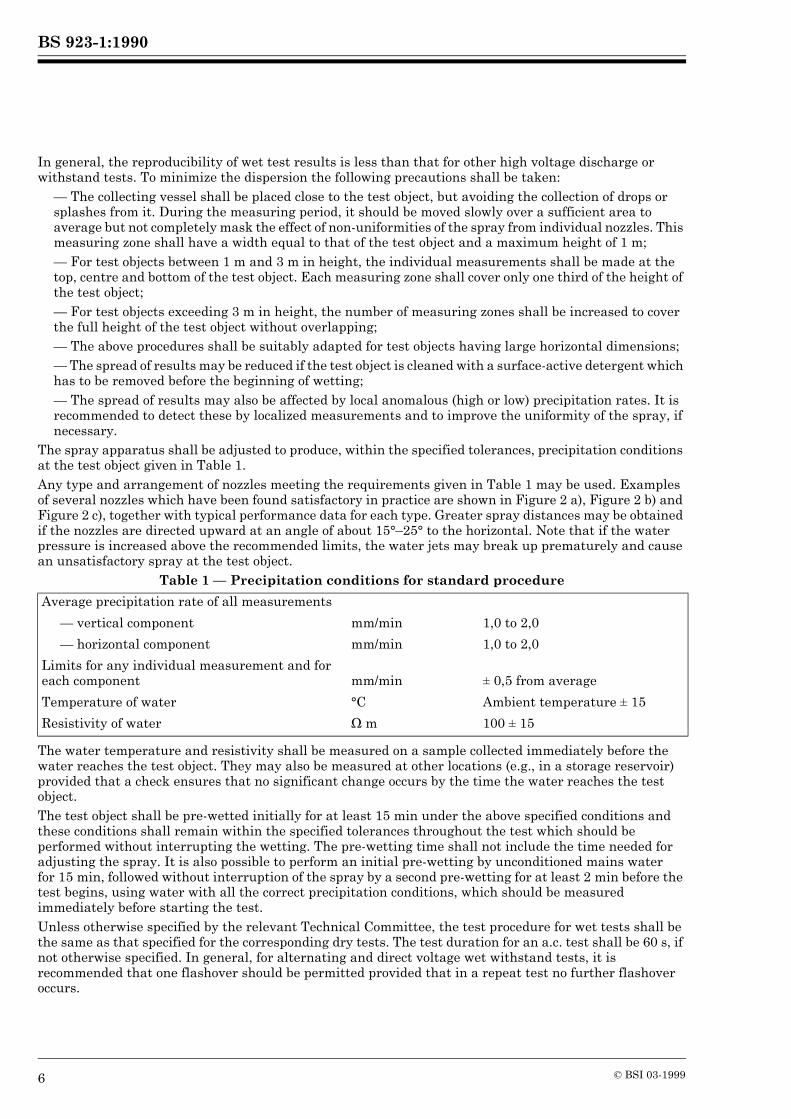
The spray apparatus shall be adjusted to produce, within the specified tolerances, precipitation conditions at the test object given in Table 1.Any type and arrangement of nozzles meeting the requirements given in Table 1 may be used. Examples of several nozzles which have been found satisfactory in practice are shown in Figure 2 a), Figure 2 b) and Figure 2 c), together with typical performance data for each type. Greater spray distances may be obtained if the nozzles are directed upward at an angle of about 15°–25° to the horizontal. Note that if the water pressure is increased above the recommended limits, the water jets may break up prematurely and cause an unsatisfactory spray at the test object.
Table 1 — Precipitation conditions for standard procedure
The water temperature and resistivity shall be measured on a sample collected immediately before the water reaches the test object. They may also be measured at other locations (e.g., in a storage reservoir) provided that a check ensures that no significant change occurs by the time the water reaches the test object.The test object shall be pre-wetted initially for at least 15 min under the above specified conditions and these conditions shall remain within the specified tolerances throughout the test which should be performed without interrupting the wetting. The pre-wetting time shall not include the time needed for adjusting the spray. It is also possible to perform an initial pre-wetting by unconditioned mains water for 15 min, followed without interruption of the spray by a second pre-wetting for at least 2 min before the test begins, using water with all the correct precipitation conditions, which should be measured immediately before starting the test.Unless otherwise specified by the relevant Technical Committee, the test procedure for wet tests shall be the same as that specified for the corresponding dry tests. The test duration for an a.c. test shall be 60 s, if not otherwise specified. In general, for alternating and direct voltage wet withstand tests, it is recommended that one flashover should be permitted provided that in a repeat test no further flashover occurs.
Average precipitation rate of all measurements
— vertical component mm/min 1,0 to 2,0
— horizontal component mm/min 1,0 to 2,0
Limits for any individual measurement and for each component mm/min ± 0,5 from average
Temperature of water °C Ambient temperature ± 15
Resistivity of water 7 m 100 ± 15
BS 923-1:1990
© BSI 03-1999 7
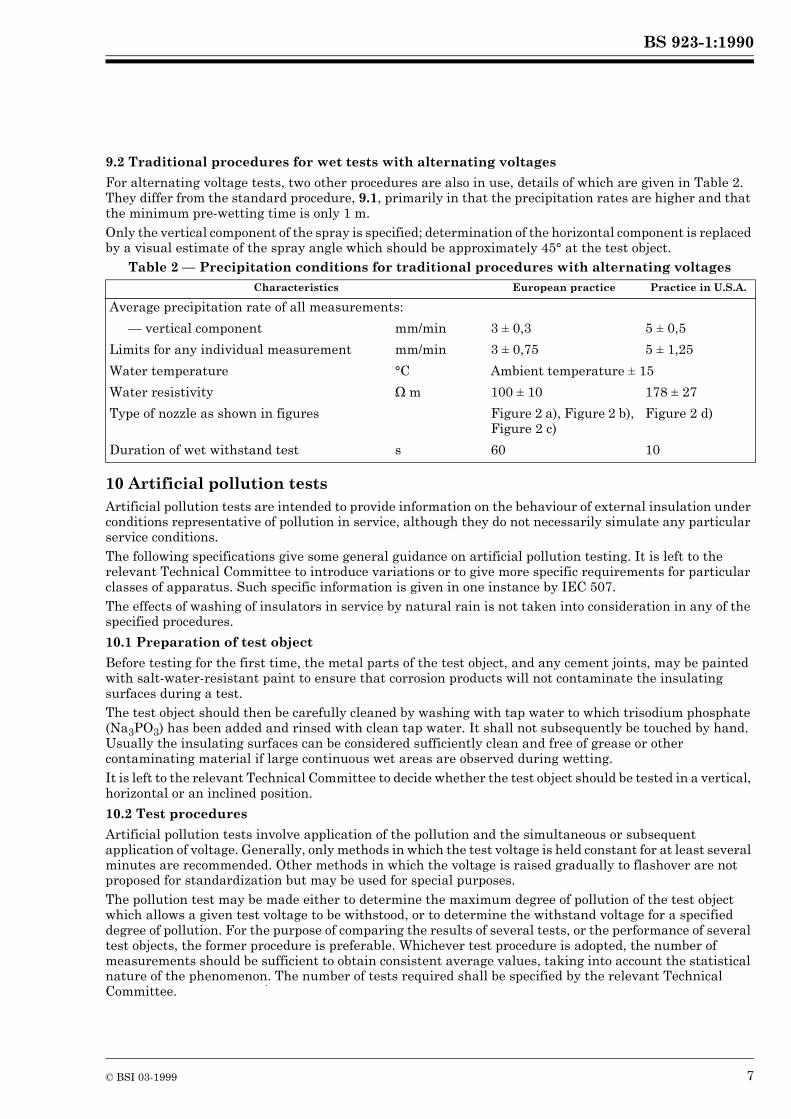
9.2 Traditional procedures for wet tests with alternating voltages
For alternating voltage tests, two other procedures are also in use, details of which are given in Table 2. They differ from the standard procedure, 9.1, primarily in that the precipitation rates are higher and that the minimum pre-wetting time is only 1 m.Only the vertical component of the spray is specified; determination of the horizontal component is replaced by a visual estimate of the spray angle which should be approximately 45° at the test object.
Table 2 — Precipitation conditions for traditional procedures with alternating voltages
10 Artificial pollution testsArtificial pollution tests are intended to provide information on the behaviour of external insulation under conditions representative of pollution in service, although they do not necessarily simulate any particular service conditions.The following specifications give some general guidance on artificial pollution testing. It is left to the relevant Technical Committee to introduce variations or to give more specific requirements for particular classes of apparatus. Such specific information is given in one instance by IEC 507.The effects of washing of insulators in service by natural rain is not taken into consideration in any of the specified procedures.
10.1 Preparation of test object
Before testing for the first time, the metal parts of the test object, and any cement joints, may be painted with salt-water-resistant paint to ensure that corrosion products will not contaminate the insulating surfaces during a test.The test object should then be carefully cleaned by washing with tap water to which trisodium phosphate (Na3PO3) has been added and rinsed with clean tap water. It shall not subsequently be touched by hand. Usually the insulating surfaces can be considered sufficiently clean and free of grease or other contaminating material if large continuous wet areas are observed during wetting.It is left to the relevant Technical Committee to decide whether the test object should be tested in a vertical, horizontal or an inclined position.
10.2 Test procedures
Artificial pollution tests involve application of the pollution and the simultaneous or subsequent application of voltage. Generally, only methods in which the test voltage is held constant for at least several minutes are recommended. Other methods in which the voltage is raised gradually to flashover are not proposed for standardization but may be used for special purposes.The pollution test may be made either to determine the maximum degree of pollution of the test object which allows a given test voltage to be withstood, or to determine the withstand voltage for a specified degree of pollution. For the purpose of comparing the results of several tests, or the performance of several test objects, the former procedure is preferable. Whichever test procedure is adopted, the number of measurements should be sufficient to obtain consistent average values, taking into account the statistical nature of the phenomenon. The number of tests required shall be specified by the relevant Technical Committee.
Characteristics European practice Practice in U.S.A.
Average precipitation rate of all measurements:
— vertical component mm/min 3 ± 0,3 5 ± 0,5
Limits for any individual measurement mm/min 3 ± 0,75 5 ± 1,25
Water temperature °C Ambient temperature ± 15
Water resistivity 7 m 100 ± 10 178 ± 27
Type of nozzle as shown in figures Figure 2 a), Figure 2 b), Figure 2 c)
Figure 2 d)
Duration of wet withstand test s 60 10
BS 923-1:1990
8 © BSI 03-1999
The pollution tests fall into two categories, the salt-fog method and the pre-deposited pollution method.a) The salt-fog method
The test object is placed in a special chamber which can be filled by a salt fog. The method for producing the fog is described in Appendix B1. The ambient temperature in the chamber at the start of the test shall not be less than 5 °C, nor greater than 30 °C and the test object and the salt water shall be in thermal equilibrium with the ambient temperature.The test object is thoroughly wetted with clean tap water. The salt-fog system, supplied by water of the prescribed salinity, is started when the test object is still wet and, simultaneously, the voltage is applied to the test object, raised rapidly to the specified value and kept constant during the specified time, usually 1 h, or until flashover occurs. This procedure is repeated several times. Before each procedure the test object is thoroughly washed with clean tap water to remove any trace of salt.For the salt-fog method, the minimum distance between any part of the test object and any earthed object other than the jets and the structure which supports the insulator shall be not less than 0,5 m per 100 kV of the test voltage and, in any case, not less than 2 m.If the test is intended to determine the maximum degree of salinity for a specified withstand voltage, the whole procedure must be repeated using various salinities.Pre-conditioning of the test object by a number of flashovers during the application of pollution is required before the real test begins. This pre-conditioning should be followed by a washing.
b) The pre-deposited pollution methodThe test object is coated with a reasonably uniform layer of a conductive suspension and shall be permitted to dry. The ambient temperature in the test chamber at the start of the test should not be less than 5 °C nor greater than 30 °C and the test object should be in thermal equilibrium with the ambient. The wetting shall be accomplished by means of a steam fog generator which provides a uniform fog distribution over the whole length and around the test object. The temperature of the fog in the vicinity of the test object shall not exceed 40 °C. To obtain the necessary wetting within a reasonable time, enough steam fog shall be introduced inside the test chamber. The steam generation rate shall be specified by the relevant Technical Committee.In one procedure the voltage is applied before the test object is wetted by the fog and continues until flashover or for about twice the time for the insulator to achieve its maximum conductivity. In another procedure, the test voltage is applied only when the conductivity has reached its maximum value, which should occur between 20 and 40 min from the start of fogging. The voltage shall be kept constant during the specified 15-min test time or until flashover occurs.Examples of suitable coating and wetting procedures and of the measurement of the surface resistivity are given in Appendix B.The procedure above may be repeated several times; before each test, the test object shall be washed, re-coated and allowed to dry.When the test is intended to determine the maximum degree of pollution for a specified withstand voltage, the coating, wetting and test procedures must be repeated using various suspension resistivities.The minimum distance between any part of the test object and any earthed object other than the structure which supports the test object shall be not less than 0,5 m per 100 kV of the test voltage.
10.3 Degree of pollution
The degree of pollution of a test object is specified by the salinity (g/L) of the salt fog, by the surface conductivity (4S) or by the amount of salt (NaCl) per square centimetre of the insulating surface (gm/cm2). This latter is normally referred to as the Salt Deposit Density (S.D.D.). Information about these methods is given in Appendix B.
BS 923-1:1990
© BSI 03-1999 9
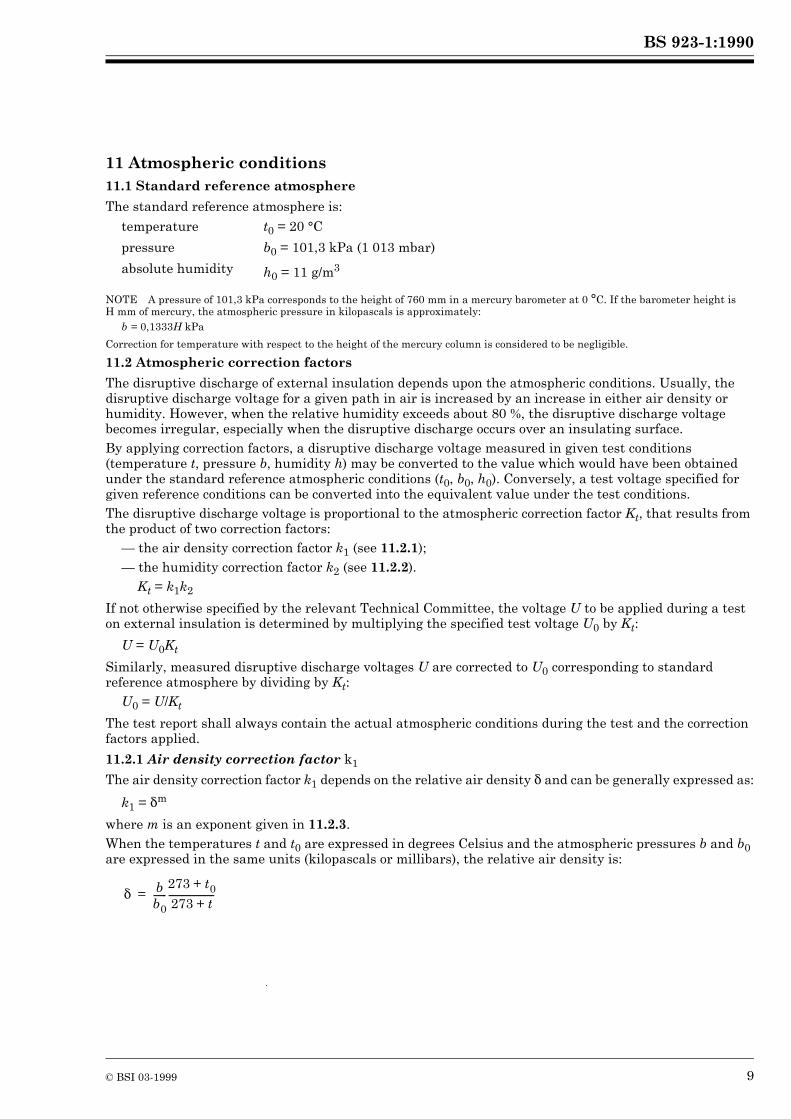
11 Atmospheric conditions11.1 Standard reference atmosphere
The standard reference atmosphere is:
NOTE A pressure of 101,3 kPa corresponds to the height of 760 mm in a mercury barometer at 0 °C. If the barometer height is H mm of mercury, the atmospheric pressure in kilopascals is approximately:
b = 0,1333H kPa
Correction for temperature with respect to the height of the mercury column is considered to be negligible.
11.2 Atmospheric correction factors
The disruptive discharge of external insulation depends upon the atmospheric conditions. Usually, the disruptive discharge voltage for a given path in air is increased by an increase in either air density or humidity. However, when the relative humidity exceeds about 80 %, the disruptive discharge voltage becomes irregular, especially when the disruptive discharge occurs over an insulating surface.By applying correction factors, a disruptive discharge voltage measured in given test conditions (temperature t, pressure b, humidity h) may be converted to the value which would have been obtained under the standard reference atmospheric conditions (t0, b0, h0). Conversely, a test voltage specified for given reference conditions can be converted into the equivalent value under the test conditions.The disruptive discharge voltage is proportional to the atmospheric correction factor Kt, that results from the product of two correction factors:
— the air density correction factor k1 (see 11.2.1);— the humidity correction factor k2 (see 11.2.2).
Kt = k1k2
If not otherwise specified by the relevant Technical Committee, the voltage U to be applied during a test on external insulation is determined by multiplying the specified test voltage U0 by Kt:
U = U0Kt
Similarly, measured disruptive discharge voltages U are corrected to U0 corresponding to standard reference atmosphere by dividing by Kt:
U0 = U/Kt
The test report shall always contain the actual atmospheric conditions during the test and the correction factors applied.
11.2.1 Air density correction factor k1
The air density correction factor k1 depends on the relative air density $ and can be generally expressed as:
k1 = $m
where m is an exponent given in 11.2.3.When the temperatures t and t0 are expressed in degrees Celsius and the atmospheric pressures b and b0 are expressed in the same units (kilopascals or millibars), the relative air density is:
temperature t0 = 20 °C
pressure b0 = 101,3 kPa (1 013 mbar)
absolute humidity h0 = 11 g/m3
$ bb0------
273 t0+
273 t+---------------------=
BS 923-1:1990
10 © BSI 03-1999
11.2.2 Humidity correction factor k2
The humidity correction factor may be expressed as:
k2 = kw
where w is an exponent given in 11.2.3 and k is a parameter that depends on the type of test voltage and that, for practical purposes, may be approximately obtained as a function of the ratio of absolute humidity, h, to the relative air density, $, using the curves of Figure 3. For values of h/$ in excess of 15 g/m3 humidity corrections are still under consideration, and the curves in Figure 3 may be regarded as upper limits.
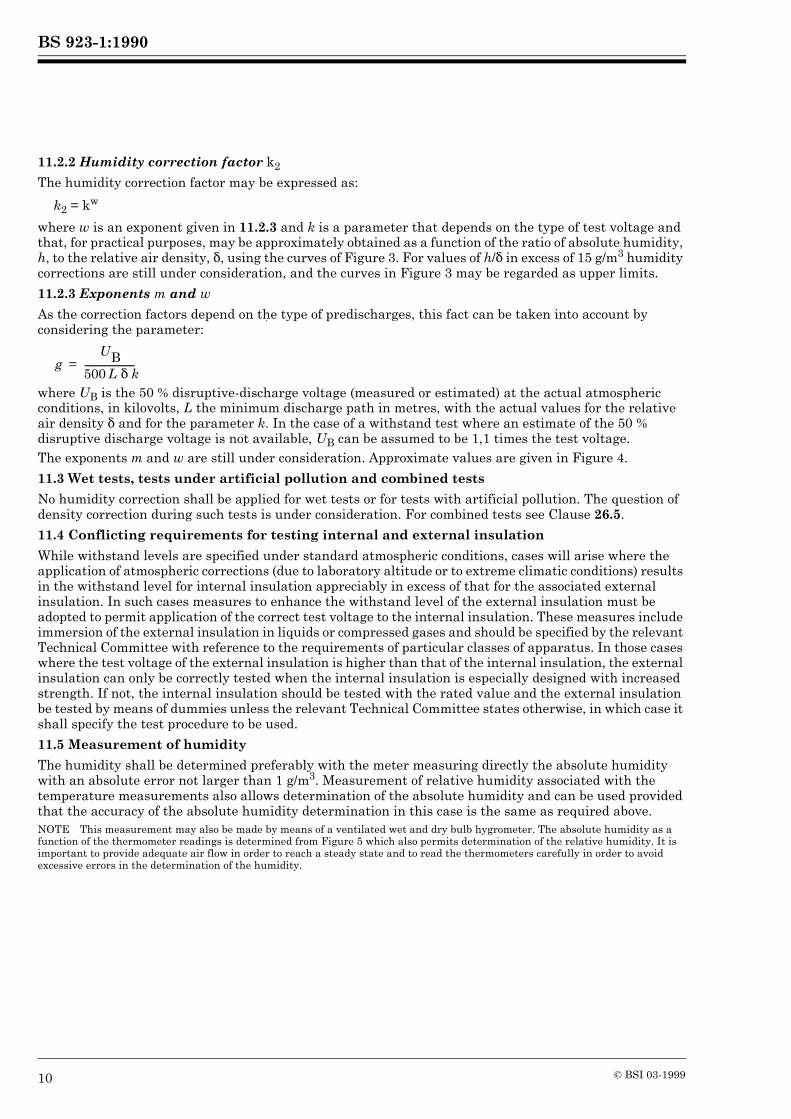
11.2.3 Exponents m and w
As the correction factors depend on the type of predischarges, this fact can be taken into account by considering the parameter:
where UB is the 50 % disruptive-discharge voltage (measured or estimated) at the actual atmospheric conditions, in kilovolts, L the minimum discharge path in metres, with the actual values for the relative air density $ and for the parameter k. In the case of a withstand test where an estimate of the 50 % disruptive discharge voltage is not available, UB can be assumed to be 1,1 times the test voltage.The exponents m and w are still under consideration. Approximate values are given in Figure 4.
11.3 Wet tests, tests under artificial pollution and combined tests
No humidity correction shall be applied for wet tests or for tests with artificial pollution. The question of density correction during such tests is under consideration. For combined tests see Clause 26.5.
11.4 Conflicting requirements for testing internal and external insulation
While withstand levels are specified under standard atmospheric conditions, cases will arise where the application of atmospheric corrections (due to laboratory altitude or to extreme climatic conditions) results in the withstand level for internal insulation appreciably in excess of that for the associated external insulation. In such cases measures to enhance the withstand level of the external insulation must be adopted to permit application of the correct test voltage to the internal insulation. These measures include immersion of the external insulation in liquids or compressed gases and should be specified by the relevant Technical Committee with reference to the requirements of particular classes of apparatus. In those cases where the test voltage of the external insulation is higher than that of the internal insulation, the external insulation can only be correctly tested when the internal insulation is especially designed with increased strength. If not, the internal insulation should be tested with the rated value and the external insulation be tested by means of dummies unless the relevant Technical Committee states otherwise, in which case it shall specify the test procedure to be used.
11.5 Measurement of humidity
The humidity shall be determined preferably with the meter measuring directly the absolute humidity with an absolute error not larger than 1 g/m3. Measurement of relative humidity associated with the temperature measurements also allows determination of the absolute humidity and can be used provided that the accuracy of the absolute humidity determination in this case is the same as required above.NOTE This measurement may also be made by means of a ventilated wet and dry bulb hygrometer. The absolute humidity as a function of the thermometer readings is determined from Figure 5 which also permits determination of the relative humidity. It is important to provide adequate air flow in order to reach a steady state and to read the thermometers carefully in order to avoid excessive errors in the determination of the humidity.
gUB
500 L $ k-----------------------=
BS 923-1:1990
© BSI 03-1999 11
Section 4. Tests with Direct Voltage
12 Definitions for direct voltage tests12.1 value of the test voltage
the value of the test voltage is defined as its arithmetic mean value
12.2 ripple
ripple is the periodic deviation from the arithmetic mean value of the voltage. The amplitude of the ripple is defined as half the difference between the maximum and minimum values. The ripple factor is the ratio of the ripple amplitude to the arithmetic mean value
13 Test voltage13.1 Requirements for the test voltage
13.1.1 Voltage shape
The test voltage, as applied to the test object, should be a direct voltage with not more than 3 % ripple factor, unless otherwise specified by the relevant Technical Committee. Note that the ripple factor may be affected by the presence of the test object and by the test conditions, especially in wet tests and in tests under artificial pollution.
13.1.2 Tolerances
For test durations not exceeding 60 s, the measured values of the test voltage shall be maintained within ± 1 % of the specified level throughout the test. For test durations exceeding 60 s, the measured value of the test voltage shall be maintained within ± 3 % of the specified level throughout the test.NOTE It is emphasized that the tolerance constitutes the permitted difference between the specified value and that actually measured. This difference should be distinguished from the measuring error which is the difference between the measured value and the true value.
13.2 Generation of the test voltage
The test voltage is generally obtained by means of rectifiers, though sometimes electrostatic generators are employed. The requirements to be met by the test voltage source depend considerably upon the type of apparatus which is to be tested and on the test conditions. These requirements are determined mainly by the value and nature of the test current to be supplied, the important constituents of which are indicated in 13.4.The source characteristics should be such as to permit charging of the capacitance of the test object in a reasonably short time. In the case of objects having high capacitance, charging times of several minutes must sometimes be accepted. The source, including its storage capacitance, should also be adequate to supply the leakage and absorption currents and any internal and external non-disruptive discharge currents without voltage drops exceeding 10 %. In tests on internal insulation, these currents are usually small, but when testing wet insulators, leakage currents of the order of some tens of milliamperes or pre-discharge pulses of the order of 10–2 C may occasionally be encountered.Source parameters for D.C. pollution tests are under investigation.
13.3 Measurement of the test voltage
13.3.1 Measurement with devices approved under IEC Publication 60-3: High Voltage Test Techniques — Measuring Devices
The measurement of the arithmetic mean value, the maximum value, the ripple factor and any transient drop in the test voltage should, in general, be made with devices which have passed the approval procedure referred to in IEC Publication 60-3. Attention is drawn to the requirements on response characteristics of devices used for measuring ripple, transients or voltage stability.
13.3.2 Calibration of a non-approved measuring device with an approved measuring device
The procedure usually consists of establishing a relationship between the display of some device related to the test voltage and a measurement of the same voltage performed in accordance with 13.3.1, with a sphere-gap, used in accordance with IEC Publication 52, or with a rod/rod gap, used in accordance with 13.3.3.
BS 923-1:1990
12 © BSI 03-1999
This relationship may be dependent on the presence of the test object, the sphere-gap or rod/rod gap, on the precipitation in wet tests, etc. Hence, it is important that these conditions are the same during the calibration and the actual test, except that, during the test, the sphere-gap or rod/rod gap shall be opened sufficiently to prevent sparkover. The relationship between the supply voltage and the output voltage may be insufficiently stable for measuring purposes.Attention is drawn to the precautions necessary when using a sphere-gap under direct voltages, due to the occurrence of flashovers at lower voltage values predominantly resulting from the presence of microscopic fibrous particles. A series of voltage applications shall be made and the highest voltage value is taken as the true measure.NOTE 1 The problem of fibrous particles can be overcome by providing an air flow of not less than 3 m/s through the gap.NOTE 2 In the presence of ripple, sphere-gaps do not measure the arithmetic mean value of the voltage.
The calibration is preferably made at or near 100 % of the test voltage, but for tests on objects with non-self-restoring insulation, extrapolation may be made from a value not lower than 50 % of this voltage. Extrapolation may be unsatisfactory if the current in the test circuit varies non-linearly with the applied voltage.
13.3.3 The rod/rod gap as an approved measuring device
A rod/rod gap with dimensions as given in Appendix C and used in accordance with this Appendix is an approved measuring device for measuring direct voltages.
13.4 Measurement of the test current
When measurements of current through the test object are made, a number of separate components may be recognized. These differ from each other by several orders of magnitude for the same test object and test voltage. They are:
— the capacitance current, due to the initial application of the test voltage and to any ripple or other fluctuations imposed on it;— the dielectric absorption current, due to slow charge displacements within the insulation and persisting for periods of a few seconds up to several hours. This process is partially reversible, currents of the opposite polarity being observed when the test object is discharged and short-circuited;— the continuous leakage current, which is the final steady direct current attained at constant applied voltage after the above components have decayed to zero;— partial discharge currents.
Measurement of the first three components necessitates the use of instruments covering a wide range of current magnitudes. It is important to ensure that the instrument, or the measurement of any one component of the current, is not adversely affected by the other components. Information concerning the condition of the insulation may sometimes be obtained by observing current variations with respect to time, during non-destructive tests.The relative magnitude and the importance of each component of current depend on the type and the condition of the test object, the purpose for which the test is being made and the duration of the test. Accordingly, the measurement procedures should be specified by the relevant Technical Committee, especially when it is required to distinguish a particular component.Measurements of partial discharge pulse currents are made with special instruments which are dealt with in IEC Publication 270 (1981): Partial Discharge Measurements.NOTE Attention should be paid to the possible value of current flowing in the case of a disruptive discharge, that could destroy a current meter if not adequately protected.
14 Test procedures14.1 Withstand voltage tests
The voltage shall be applied to the test object starting at a value sufficiently low to prevent any effect of overvoltage due to switching transients. It should be raised sufficiently slowly to permit reading of the instruments, but not so slowly as to cause unnecessary prolongation of stressing of the test object near to the test voltage U. These requirements are in general met if the rate of rise is about 2 % of U per second when the applied voltage is above 75 % of U. It shall be maintained for the specified time and then reduced by discharging the circuit capacitance, including that of the test object, through a suitable resistor.
BS 923-1:1990
© BSI 03-1999 13
The test duration shall be specified by the relevant Technical Committee taking into consideration that the time to reach the steady-state voltage distribution depends on the resistances and capacitances of the test object components. When not otherwise specified by the relevant Technical Committee, the duration of a withstand test shall be 60 s.The polarity of the voltage or the order in which voltages of each polarity are applied, and any required deviation from the above specifications, shall be specified by the relevant Technical Committee.The requirements of the test are satisfied if no disruptive discharge occurs on the test object.
14.2 Disruptive discharge voltage tests
The voltage shall be applied and raised continuously until a disruptive discharge occurs on the test object. The value of the voltage reached at the instant of the disruptive discharge shall be recorded.The relevant Technical Committee shall specify the voltage rate of rise, the number of voltage applications and the procedure for evaluating the test results (see Appendix A).
14.3 Assured disruptive discharge voltage tests
The voltage shall be applied and raised continuously until a disruptive discharge occurs on the test object. The value of the test voltage reached at the instant of the disruptive discharge shall be recorded.The requirements of the test are generally satisfied if this voltage does not exceed the assured disruptive discharge voltage on a specified number of voltage applications.The relevant Technical Committee shall specify the number of voltage applications and the voltage rate of rise.
BS 923-1:1990
14 © BSI 03-1999
Section 5. Tests with Alternating Voltage
15 Definitions for alternating voltage tests15.1 Definitions for alternating voltage tests
15.1.1 value of the test voltagethe value of the test voltage is defined as its peak value divided byNOTE The relevant Technical Committee may require a measurement of the r.m.s. value of the test voltage instead of the peak value for cases where the r.m.s. value may be of importance, for instance, when thermal effects are involved.
15.2 peak value
the peak value of an alternating voltage is the maximum value. Small high-frequency oscillations, arising for instance from non-disruptive discharges shall, however, be disregarded
15.3 R.M.S. value
the r.m.s. value of an alternating voltage is the square root of the mean value of the square of the voltage values during a complete cycle
16 Test Voltage16.1 Requirements for the test voltage
16.1.1 Voltage waveshape
The test voltage shall be an alternating voltage generally having a frequency in the range 45 to 65 Hz, normally referred to as power-frequency test voltage. Special tests may be required at frequencies considerably below or above this range, as specified by the relevant Technical Committee.The voltage waveshape shall approximate a sinusoid with both half-cycles closely alike. The results of a high voltage test are thought to be unaffected by small deviations from a sinusoid if the ratio of peak to r.m.s. values equals within ± 5 %.For some test circuits in common use greater deviations have to be accepted. Note that the test object, especially if it has non-linear impedance characteristics, may considerably affect the deviation from a sinusoid.NOTE It can generally be assumed that the above requirements on deviations from a sinusoid will be met if the r.m.s. value of the harmonics does not exceed 5 % of the r.m.s. value of the fundamental.
16.1.2 Tolerances
If not otherwise specified by the relevant Technical Committee the measured values of the test voltage shall be maintained within ± 1 % of the specified level throughout the test. For test durations exceeding 60 s the measured value of the test voltage shall be maintained within ± 3 % of the specified level throughout the test.NOTE It is emphasized that the tolerance constitutes the permitted difference between the specified value and that actually measured. This difference should be distinguished from the measuring error which is the difference between the measured value and the true value.
16.2 Generation of the test voltage
16.2.1 General requirements
The test voltage is generally supplied from a step-up transformer. Alternatively, it may be generated by means of a series-resonant circuit.The voltage in the test circuit shall be stable enough to be practically unaffected by varying leakage currents. Non-disruptive discharges in the test object shall not reduce the test voltage to such an extent and for such a time that the measured disruptive discharge voltage of the test object is significantly affected.In the case of non-disruptive discharges, unless otherwise specified by the relevant Technical Committee, a withstand test is considered satisfactory when it can be shown that the peak value of the test voltage does not differ by more than 5 % in successive periods and that the instantaneous voltage drop during a non-disruptive discharge does not exceed 20 % of the peak voltage. The characteristics of the test circuit which are necessary to meet the above requirements depend on the type of test (dry, wet, etc.), the test voltage level and the test object behaviour.
2
2
BS 923-1:1990
© BSI 03-1999 15
NOTE Attention is drawn to the possibility that such non-disruptive discharges may cause large overswings of voltage between the terminals of the test object. This phenomenon may cause failure of the test object or of the testing transformer. A cure can usually be effected by changing the natural frequency of the voltage source or by introducing some attenuation into the system.
16.2.2 Requirements for the transformer test circuit
In order to have the test voltage practically unaffected by varying leakage currents the short-circuit current, delivered by the transformer when the test object is short-circuited at the test voltage, should be large enough in comparison with the leakage currents at the supply frequency and in any case in respect of the following guiding criteria:
— for dry tests on small samples of solid insulation, insulating liquids or combinations of the two, a short-circuit current of the order of 0,1 A (r.m.s.) is suitable;— for tests on external self-restoring insulation (insulators, disconnecting switch, etc.) a short-circuit current not less than 0,1 A (r.m.s.) for dry tests and 0,5 A (r.m.s.) for wet tests is suitable; however, for wet tests on objects having large dimensions that may lead to high leakage currents, a short-circuit current up to 1 A could be necessary.
NOTE When the test circuit is supplied by a rotating generator, the transient short-circuit current (see IEC Publication 34-4) should be considered.
The total capacitance of the test object and of any additional capacitor should be sufficient to ensure that the measured discharge voltage is unaffected by non-disruptive partial discharges or pre-discharges in the test object. A capacitance in the range from 0,5 to 1,0 nF is generally sufficient.NOTE If any protective resistor external to the test transformer does not exceed 10 k7, the effective terminal capacitance of the transformer may be regarded as being in parallel with the test object.
For tests under artificial pollution, higher values of the short-circuit current, up to 15 A or more, are necessary (see IEC Publication 507); the testing plant should also comply with the two following conditions:
— resistance/reactance ratio (R/X) equal to or higher than 0,1;— capacitive current/short-circuit current ratio not exceeding the interval 0,001 to 0,1.
The voltage stability could be verified by the direct recording of the voltage applied to the test object, by means of a suitable high voltage measuring system.
16.2.3 The series-resonant circuit
The series-resonant circuit consists essentially of an inductor in series with a capacitive, test object or load and connected to a medium voltage power source. Alternatively it may consist of a capacitor in series with an inductive test object. By varying the circuit parameters or the supply frequency, the circuit can be tuned to resonance, when a voltage considerably greater than that of the source and of substantially sinusoidal shape will be applied to the test object.The stability of the resonance conditions and of the test voltage depends on the constancy of the supply frequency and of the test circuit characteristics.When a discharge occurs, the source gives a relatively low current which limits the damage to the dielectric of the test object.The series-resonant circuit is especially useful when testing objects such as cables, capacitors or gas-insulated systems in which the leakage currents on the external insulation are very small in comparison with the capacitive currents through the test object or the energy to form a disruptive discharge is very small. A series-resonant circuit is also useful for testing reactors.The circuit may be unsuitable for external insulation under wet or polluted conditions, unless the requirements of 16.2.1 are satisfied.
16.3 Measurement of the test voltage
16.3.1 Measurement with devices approved under IEC Publication 60-3
The measurement of the peak value, the r.m.s. value, the deviation from a sinusoid and the transient drops should in general be made with devices which have passed the approval procedures referred to in IEC Publication 60-3.Attention is drawn to the requirements on response characteristics of the devices used for measuring transient voltage drops.
BS 923-1:1990
16 © BSI 03-1999
16.3.2 Calibration of a non-approved measuring device with an approved measuring device
The procedure usually consists of establishing a relationship between the display of some device related to the test voltage and a measurement of the same voltage performed in accordance with 16.3.1 or with a sphere-gap used in accordance with IEC Publication 52.This relationship may be dependent on the presence of the test object and the sphere-gap, the precipitation in wet tests, etc. Hence, it is important that these conditions are the same during the calibration and the actual test, except that, during the test, the sphere-gap may be opened sufficiently to prevent sparkover.The relationship between the supply voltage and the output voltage may not be sufficiently stable for measuring purposes.The calibration is preferably made at or near 100 % of the test voltage, but for tests on objects with non-self-restoring insulation, extrapolation may be made from a value not lower than 50 % of this voltage. Extrapolation may be unsatisfactory if the current in the test circuit varies non-linearly with the applied voltage, or if any changes occur in the voltage shape or frequency between the calibration and the test voltage levels.
17 Test procedures17.1 Withstand voltage tests
The voltage shall be applied to the test object starting at a value sufficiently low to prevent any effect of overvoltages due to switching transients. It should be raised sufficiently slowly to permit reading of the measuring instrument but not so slowly as to cause unnecessary prolongation of the stressing of the test object near to the test voltage U. These requirements are in general met if the rate of rise is about 2 % of U per second, when the applied voltage is above 75 % of U. It shall be maintained for the specified time and then rapidly decreased, but not suddenly interrupted as this may generate switching transients which could cause damage or erratic test results.The test duration shall be specified by the relevant Technical Committee and shall be independent of the frequency in the range from 45 to 65 Hz. If not specified by the relevant Technical Committee the duration of a withstand test shall be 60 s.The requirements of the test are satisfied if no disruptive discharge occurs on the test object.
17.2 Disruptive discharge voltage tests
The voltage shall be applied and raised continuously until a disruptive discharge occurs on the test object. The value of the test voltage reached at the instant of the disruptive discharge shall be recorded.The relevant Technical Committee shall specify the rate of rise of the voltage, the number of voltage applications and the procedure for evaluating the test results (see Appendix A).
17.3 Assured disruptive discharge voltage tests
The voltage shall be applied and raised continuously until a disruptive discharge occurs on the test object. The value of the test voltage reached at the instant of the disruptive discharge shall be recorded.The requirements of the test are generally satisfied if this voltage is not higher than the assured disruptive discharge voltage on each one of a specified number of voltage applications.The relevant Technical Committee shall specify the number of voltage applications and the rate of rise of the voltage.
BS 923-1:1990
© BSI 03-1999 17
Section 6. Tests with Lightning Impulse Voltage
18 Definitions for lightning impulse tests18.1 Definitions of general applicability
These definitions apply to impulses without oscillations or overshoot or to the mean curve drawn through the oscillations and overshoot.18.1.1 full lightning impulsea full lightning impulse is a lightning impulse which is not interrupted by a disruptive discharge (see Figure 6). See Clause 3 for definition of impulse and 3.1 for distinction between lightning and switching impulses18.1.2 chopped lightning impulsea chopped lightning impulse is a lightning impulse during which a disruptive discharge causes a rapid collapse of the voltage, practically to zero value (see Figure 7–Figure 9)1). The collapse can occur on the front, at the peak or on the tailNOTE The chopping can be accomplished by an external chopping gap or may occur due to a discharge in the internal or external insulation of a test object.
18.1.3 value of the test voltagefor a lightning impulse without oscillations, the value of the test voltage is its peak valuethe determination of the peak value in the case of oscillations or overshoot on standard lightning impulses is considered in 19.2for other impulse shapes (see for example Figure 10 e–h) the relevant Technical Committee shall define the value of the test voltage taking into account the type of test and test object18.1.4 front time T1 the front time T1 of a lightning impulse is a virtual parameter defined as 1,67 times the interval T between the instants when the impulse is 30 % and 90 % of the peak value (points A and B, Figure 6–Figure 9)1)
18.1.5 virtual origin O1
the virtual origin O1 of a lightning impulse is the instant preceding that corresponding to point A (see Figure 6–Figure 9)1) by a time 0,3T1. For records having linear time scales, this is the intersection with the time axis of a straight line drawn through the reference points A and B on the front
18.1.6 time to half-value T2
the time to half-value T2 of a lightning impulse is a virtual parameter defined as the time interval between the virtual origin O1 and the instant when the voltage has decreased to half the peak value
18.2 Definitions applicable only to chopped impulses
A chopped lightning impulse is a lightning impulse during which a disruptive discharge causes a rapid collapse of the voltage, which then falls to zero or nearly to zero, with or without oscillations (see Figure 7–Figure 9).NOTE With some test objects or test arrangements, there may be a flattening of the peak or a rounding off of the voltage before the final voltage collapse. Similar effects may also be observed due to the imperfections of the measuring system. Exact determination of the parameters related to chopping (18.2.1 to 18.2.5) requires the presence of both a sharp discontinuity and a special measuring system. Other cases are left to the relevant Technical Committees for consideration.
18.2.1 instant of choppingthe instant of chopping is that at which the rapid collapse of voltage which characterizes the chopping first occurs
1) See national foreword for details of textual errors.
BS 923-1:1990
18 © BSI 03-1999
18.2.2 time to chopping Tc
the time to chopping Tc is a virtual parameter defined as the time interval between the virtual origin O1 and the instant of chopping18.2.3 characteristics related to the voltage collapse during choppingthe virtual characteristics of the voltage collapse during chopping are defined in terms of two points C and D at 70 % and 10 % of the voltage at the instant of chopping, see Figure 7. The duration of the voltage collapse is 1,67 times the time interval between points C and D. The steepness of the voltage collapse is the ratio of the voltage at the instant of chopping to the duration of voltage collapseNOTE The use of points C and D is for definition purposes only; it is not implied that the duration and steepness of chopping can be measured with any degree of accuracy using conventional measuring systems.
18.2.4 linearly rising front-chopped impulsesa voltage rising with approximately constant steepness, until it is chopped by a disruptive discharge, is described as a linearly rising front-chopped impulseto define such an impulse, the best fitting straight line is drawn through the part of the front between 30 % and 90 % of the peak amplitude; the intersections of this with the 30 % and 90 % amplitudes then being designated E and F, respectively (see Figure 9)the impulse is defined by:
— the peak voltage U,— the front time T1,— the virtual steepness S:
S = U/T1
this is the slope of the straight line drawn through the points E and F, usually expressed in kilovolts per microsecondthis chopped impulse is considered to be approximately linearly rising if the front, from 30 % amplitude up to the instant of chopping, is entirely enclosed between two lines parallel to the line EF, but displaced from it in time by ± 0,05 T1 (see Figure 9)NOTE The value and the tolerance on the virtual steepness S shall be specified by the relevant Technical Committee.
18.3 Voltage/time curves
18.3.1 Voltage/time curves for linearly rising impulses
The voltage/time curve for impulses with fronts rising linearly is the curve relating the peak voltage to the front time T1. The curve is obtained by applying impulses with linear fronts of different steepness.
18.3.2 Voltage/time curve for impulses of constant prospective shape
The voltage/time curve for impulses with constant prospective shape is the curve relating the discharge voltage of the test object to the time to chopping, which may occur on the front, at the peak or on the tail. The curve is obtained by applying impulse voltages of constant shape but with different prospective peak values (see Figure 11).
19 Test Voltage19.1 Standard lightning impulse
The standard lightning impulse is a full lightning impulse having a front time of 1,2 4s and a time to half-value of 50 4s. It is described as a 1,2/50 impulse.
19.2 Tolerances
If not otherwise specified by the relevant Technical Committee, the following differences are accepted between specified values for the standard impulse and those actually recorded:
Peak value ± 3 %Front time ± 30 %Time to half-value ± 20 %
BS 923-1:1990
© BSI 03-1999 19
NOTE 1 It is emphasized that the tolerances on the peak value, front time and time to half-value constitute the permitted differences between specified values and those actually recorded by measurements. These differences should be distinguished from measuring errors which are the difference between the values actually recorded and the true values. For information on measuring errors, see IEC Publication 60-3 and 60-4.
With some test circuits, oscillations or an overshoot may occur at the peak of the impulse, see Figure 10 a) to Figure 10 d); if the frequency of such oscillations is not less than 0,5 MHz or the duration of overshoot not more than 1 4s, a mean curve should be drawn as in Figure 10 a) and Figure 10 b) and, for the purpose of measurement, the maximum amplitude of this curve is chosen as the peak value defining the value of the test voltage.Overshoot or oscillations in the neighborhood of the peak, measured by a system according to IEC Publication 60-3, are tolerated provided their single peak amplitude is not larger than 5 % of the peak value. In commonly used impulse generator circuits, oscillations on that part of the wavefront during which the voltage does not exceed 90 % of the peak value have generally negligible influence on test results. If the relevant Technical Committee finds these are of importance, it is recommended that their amplitudes, measured by a suitable measuring device, as specified in IEC Publication 60-3, are under the straight line drawn through the points A9 B9 (see Figure 12). These points are taken on the verticals of, respectively, the points A and B determined according to 18.1.4, the distance AA9 being equal to 25 % and BB9 to 5 % of the peak value.The impulse should be essentially unidirectional, but see Note 2.NOTE 2 In specific cases, such as during tests on low impedance objects or on UHV test circuits having large dimensions, it may be impossible to adjust the shape of the impulse within the tolerances recommended, to keep the oscillations and/or the overshoot within the specified limits or to avoid a polarity reversal. Such cases should be dealt with by the relevant Technical Committee.
19.3 Standard chopped lightning impulse
A standard chopped lightning impulse is a standard impulse chopped by an external gap after 2 to 5 4s. Other times to chopping may be specified by the relevant Technical Committee. Because of practical difficulties in measurements, the duration of voltage collapse has not been standardized.
19.4 Special lightning impulses
In some cases oscillating lightning impulses may be applied. This offers the possibility of producing impulses with shorter front times or with peak values corresponding to a generator efficiency greater than 1.
19.5 Generation of the test voltage
The impulse is usually produced by an impulse generator consisting essentially of a number of capacitors which are charged in parallel from a direct voltage source and then discharged in series into a circuit which includes the test object.
19.6 Measurement of the test voltage and determination of impulse shape
19.6.1 Measurement with devices approved under IEC Publication 60-3
The measurement of the peak value, the time parameters and the overshoot or oscillations on the test voltage should in general be made with devices which have passed the approval procedure referred to in IEC Publication 60-3. The measurement shall be made with the test object in the circuit and, in general, the impulse shape shall be checked for each test object. Where a number of test objects of the same design and size are tested under identical conditions, the shape needs only to be verified once.NOTE Determination of the impulse shape by calculation from the test circuit parameters is not considered to be satisfactory.
19.6.2 Calibration of a non-approved measuring device with an approved measuring device
The procedure usually consists of establishing a relationship between the display of some device related to the test voltage (for instance the maximum charging voltage of the first stage of the impulse generator) and a measurement of the same voltage performed in accordance with 19.6.1 or with a sphere-gap, used in accordance with IEC Publication 52.The relationship may be dependent on the presence of the test object, of the sphere-gap, etc. Hence, it is important that these conditions are the same during the calibration and the actual test, except that during the test the sphere-gap may be opened sufficiently to prevent sparkover.For tests on objects with self-restoring insulation, the calibration should be made at or near 100 % of the test voltage. For tests on objects with non-self-restoring insulation, extrapolation may be unavoidable but such extrapolation shall be made from not less than 50 % of the test voltage. The extrapolation is only permissible if it can be shown that the test voltage is proportional to the related quantity.
BS 923-1:1990
20 © BSI 03-1999
19.7 Measurement of current during tests with impulse voltages
The relevant Technical Committee shall specify the characteristics of a current flowing in the test object that should be measured during tests with high impulse voltages. When this type of measurement is used for comparative purposes wave shape is of importance and the measurement of the absolute value of this current may be of lesser importance.
20 Test Procedures20.1 Withstand voltage tests
The recommended test procedure depends on the nature of the test object, as defined in Clause 5. The relevant Technical Committee shall specify which procedure shall be applied.In procedures A, B and C the voltage applied to the test object is only the specified withstand value, while in procedure D several voltage levels have to be applied.
20.1.1 Withstand voltage test: Procedure A
Three impulses of the specified shape and polarity at the rated withstand voltage level are applied to the test object. The requirements of the test are satisfied if no indication of failure is obtained, using methods of detection specified by the relevant Technical Committee.NOTE This procedure is recommended for tests on degradable or non-self-restoring insulation.
20.1.2 Withstand voltage test: Procedure B
Fifteen impulses of the specified shape and polarity at the withstand voltage level are applied to the test object. The requirements of the test are satisfied if not more than two disruptive discharges occur in the self-restoring part of the insulation and if no indication of failure in the non-self-restoring insulation is obtained by the detection methods specified by the relevant Technical Committee.
20.1.3 Withstand voltage test: Procedure C
Three impulses of the specified shape and polarity at the withstand voltage level are applied to the test object. If no disruptive discharge occurs the test object has passed the test. If more than one disruptive discharge occurs the test object has failed to pass the test. If one disruptive discharge occurs in the self-restoring part of the insulation, then nine additional impulses are applied and if no disruptive discharge occurs the test object has passed the test.If any detection of failure in a non-self-restoring part of insulation is observed with the detection methods specified by the relevant Technical Committee during any part of the test, the test object has failed to pass the test.NOTE This procedure corresponds to an American practice modified so as to be statistically equivalent to Procedure B.
20.1.4 Withstand voltage test: Procedure D
For self-restoring insulation the 10 % impulse disruptive discharge voltage U10 may be evaluated by using statistical test procedures described in Appendix A.These test methods permit either direct evaluation of U10 and U50 or indirect evaluation of U10.In the latter case U10 is derived from the U50 value using the relationship:
U10 = U50 (1 – 1, 3z)The relevant Technical Committee shall specify the value to be assumed for the conventional deviation z of the disruptive discharge voltage. For dry tests on air insulation, without any other insulation involved, the per-unit value z = 0,03 can be used.The test object is deemed to be satisfactory if U10 is not less than the specified impulse withstand voltage.The following test methods can be used to evaluate U50:
a) the multiple-level method (see Clause A.1.1) with n $ 4 voltage levels, and m $ 10 impulses per level;b) the up-and-down method (Clause A.1.2) with m = 1 impulse per group and n $ 20 useful applications.
To evaluate U10, the up-and-down withstand method, with m = 7 impulses per group and at least eight useful groups, can be used.In all the cases the voltage interval between levels %U should be approximately from 1,5 to 3 % of the estimated value of U50.
BS 923-1:1990
© BSI 03-1999 21
20.2 Procedures for assured discharge voltage tests
The procedures for an assured discharge voltage test are similar to those described in 20.1 with the appropriate changes between discharge and withstand conditions.The relevant Technical Committee may also specify other procedures for specific test objects.
BS 923-1:1990
22 © BSI 03-1999
Section 7. Tests with Switching Impulses
21 Definitions for switching impulse tests21.1 switching impulsea switching impulse (as distinct from a lightning impulse) is defined in 3.1. The characteristics of a switching impulse are expressed by the parameters defined in 21.2 to 21.7 (see Figure 13)additional parameters can be specified by the relevant Technical Committee when considering specific tests21.2 value of the test voltageif not otherwise specified by the relevant Technical Committee, the value of the test voltage is the prospective peak value
21.3 time to peak Tp
the time to peak Tp is the time interval between the actual origin and the instant when the voltage has reached its peak value
21.4 time to half-value T2
the time to half-value T2 for a switching impulse is the time interval between the actual origin and the instant when the voltage has first decreased to half the peak value
21.5 time above 90 % Td
the time above 90 % Td is the time interval during which the impulse voltage exceeds 90 % of its peak value
21.6 time to zero T0
the time to zero T0 is the time interval between the actual origin and the instant when the voltage has its first passage to zerospecification of the time above 90 % and time to zero instead of the time to half-value is found useful, for instance, when the form of the impulse is dictated by saturation phenomena in the test object or the test circuit, or where the severity of the test on important parts of internal insulation of the test object is considered to be highly dependent on these parameters. When specifying a switching impulse, only one set of parameters related to the waveshape is generally given. The particular time parameters defined should be clearly indicated by reference, for example, to a Tp/T2 or Tp/Td/T0 impulseNOTE — to 21.3 to 21.6 The front duration for switching impulses is sometimes alternatively defined in the same manner as the front for lightning impulses (18.1.4) or in a similar manner with other reference points and multiplying factors. For switching impulses with time parameters as given in 22.1, the time to peak is between 1,4 and 1,8 times the front time.
21.7 time to chopping Tc
the time to chopping Tc of a switching impulse is the time interval between the actual origin and the instant of chopping21.8 linearly rising impulsethe definition of a linearly rising impulse (applicable to both lightning and switching impulses) is given in 18.2.4
22 Test voltage22.1 Standard switching impulse
The standard switching impulse is an impulse having a time to peak Tp of 250 4s and a time to half-value T2 of 2 500 4s. It is described as a 250/2 500 impulse.
BS 923-1:1990
© BSI 03-1999 23
22.2 Tolerances
If not otherwise specified by the relevant Technical Committee, the following differences are accepted between specified values and those actually recorded, both for standard and special impulses (see Note 1 to 19.2):
In certain cases, for instance with low impedance test objects, it may be difficult to adjust the shape of the impulse to within the tolerances recommended. In such cases other tolerances or other impulse shapes may be specified by the relevant Technical Committee.NOTE The disruptive discharge voltage of long gaps in air may be influenced by both the time to peak and the time to half-value of a switching impulse. Therefore it is recommended for such test objects that the applied switching impulse be characterized by its actual time parameters. Larger tolerances in the prospective time to half-value may be allowed in the case of a disruptive discharge occurring before or at the peak.
22.3 Special switching impulses
For special purposes, when the use of the standard switching impulse is not considered sufficient or appropriate, special switching impulses of either aperiodic or oscillating form may be prescribed by the relevant Technical Committee.NOTE When a discharge is initiated by a leader in air from a positively-charged electrode, two impulses may generally be considered as equivalent, when they have the same peak value and the same time interval between the respective two points on the front at 70 % and 100 % of the peak value.
22.4 Generation of the test voltage
Switching impulses are usually generated by a conventional impulse generator (see 19.5). They can also be generated by the application of a voltage impulse to the low-voltage winding of a testing transformer (or of a transformer to be tested). Other methods of generating switching impulses can be used, for example, involving the rapid interruption of current in a transformer winding.The elements of a circuit for generating switching impulses should be chosen so as to avoid excessive distortion of the impulse shape due to non-disruptive discharge currents in the test object. Such currents can reach quite large values, especially during pollution tests on external insulation at high voltages. In test circuits having high internal impedance, they may cause severe distortion of the voltage or even prevent a disruptive discharge from occurring.
22.5 Measurement of test voltage and determination of impulse shape
The measurement of the test voltage and the determination of the impulse shape should be made as described in 19.6.1 and 19.6.2. Note that although IEC Publication 52, 1960, gives no information specifically related to the measurement of the peak value of switching impulses, measurements indicate that the sphere-gap can be regarded as an approved measuring device for switching impulse voltages.
23 Test proceduresThe test procedures are in general the same as for lightning impulse testing and similar statistical considerations apply (see Clause 20 and Appendix A). Unless otherwise specified by the relevant Technical Committee, the conventional deviation of the disruptive discharge voltage for dry and wet tests on air insulation, without any other insulation involved, can be assumed to be:
z = 0,06Correspondingly larger voltage intervals %U may be used when applying the multiple level or the up-and-down procedures.NOTE With switching impulses, disruptive discharges frequently occur at random times well before the peak. In presenting the results of discharge tests made in accordance with 20.1.4, the relationship between disruptive discharge probability and voltage is generally expressed in terms of the prospective peak value. However, another method is also in use in which the actual disruptive discharge voltage for every impulse is measured; the probability distribution of the measured voltage values is then determined by the method described for Class 3 tests in Appendix A.
Peak value ± 3 %Time to peak ± 20 %Time to half-value ± 60 %
BS 923-1:1990
24 © BSI 03-1999
Section 8. Tests with Impulse Current
24 Definitions for impulse current tests24.1 impulse currenttwo types of impulse currents are used. The first type has a shape which increases from zero to peak value in a short time, and thereafter decreases to zero either approximately exponentially or in the manner of a heavily-damped sine curve. This type is defined by the front time T1 and the time to half-value T2 (see 24.3 and 24.5)the second type has an approximately rectangular shape and is defined by the duration of the peak and the total duration (see 24.6 and 24.7)24.2 value of the test currentthe value of the test current is normally defined by the peak value. With some test circuits, overshoot or oscillations may be present on the current waveform. The relevant Technical Committee shall specify whether the value of the test current should be defined by the actual peak or by a smooth curve drawn through the oscillations
24.3 front time T1
the front time T1 of an impulse current is a virtual parameter defined as 1,25 times the interval T, between the instants when the impulse is 10 % and 90 % of the peak value [see Figure 14 a)]. If oscillations are present on the front, the 10 % and 90 % values shall be derived from a mean curve drawn through these oscillations in a manner analogous to that used for lightning impulses with oscillations on the front
24.4 virtual origin O1
the virtual origin O1 of an impulse current precedes by 0,1T1 that instant at which the current attains 10 % of its peak value. For records having linear time scales, this is the intersection with the time axis of a straight line drawn through the 10 % and 90 % reference points on the front
24.5 time to half-value T2
the time to half-value T2 of an impulse current is a virtual parameter defined as the time interval between the virtual origin O1 and the instant at which the current has decreased to half the peak value
24.6 duration of peak of a rectangular impulse current Td
the duration of the peak of a rectangular impulse current Td is a virtual parameter defined as the time during which the current is greater than 90 % of its peak value [see Figure 14 b)]
24.7 total duration of a rectangular impulse current Tt
the total duration of a rectangular impulse current Tt is a virtual parameter defined as the time during which the current is greater than 10 % of its peak value [see Figure 14 b)]. If oscillations are present on the front, a mean curve should be drawn in order to determine the time at which the 10 % value is reached
25 Test current25.1 Standard impulse currents
Four standard impulse currents corresponding to the first type of impulse, defined in 24.1, are used.
Rectangular impulse currents have duration of the peak Td of 500 4s, 1 000 4s or 2 000 4s or between 2 000 4s and 3 200 4s.
— 1/20 impulse: front time: 1 4s; time to half-value: 20 4s;— 4/10 impulse; front time: 4 4s; time to half-value: 10 4s;— 8/20 impulse; front time: 8 4s; time to half-value: 20 4s;— 30/80 impulse: front time: 30 4s; time to half-value: 80 4s;
BS 923-1:1990
© BSI 03-1999 25
25.2 Tolerances
If not otherwise specified by the relevant Technical Committee, the following differences are accepted between the specified values for standard impulse currents and those actually recorded:For 1/20, 4/10, 8/20 and 30/80 impulses:
A small overshoot or oscillations are tolerated provided that their single peak amplitude in the neighbourhood of the peak of the impulse is not more than 5 % of the peak value. Any polarity reversal after the current has fallen to zero shall not be more than 20 % of the peak value.For rectangular impulses:
An overshoot or oscillations are tolerated provided that their single peak amplitude is not more than 10 % of the peak value. The total duration of a rectangular impulse shall not be larger than 1,5 times the duration of the peak and the polarity reversal should be limited to 10 % of the peak value.
25.3 Measurement of the test current
The test current shall be measured by a device which has passed the approval procedure referred to in IEC Publication 60-3.
25.4 Measurement of voltage during tests with impulse current
Voltages developed across the test object during tests with high impulse currents should be measured by a device which has passed the approval procedure given in IEC Publication 60-3 for the measurement of impulse voltages.NOTE The impulse current may induce appreciable voltages in the voltage measuring circuit, causing significant errors. As a check, it is therefore recommended that the lead that normally joins the voltage divider to the live end of the test object should be disconnected from this point and connected instead to the earthed end of the test object, but maintaining approximately the same loop. Alternatively, the test object may be short-circuited or replaced by a solid metal conductor. The test circuit geometry should be modified until the voltage measured when the generator is discharged under any of these conditions is negligible in comparison with the voltage across the test object, at least during the part of the impulse which is of importance for evaluating the test results.
peak value ± 10 %front time T1 ± 10 %
time to half-value T2 ± 10 %
peak value + 20 %; – 0 %duration of the peak + 20 %; – 0 %
BS 923-1:1990
26 © BSI 03-1999
Section 9. Combined and Composite Tests
26 Combined voltage testsA combined voltage test is one in which two separate sources, generating voltages against earth, are connected to two terminals of the test object, [for example an open circuit breaker, see Figure 15 a)]. In such a test any two of lightning impulse, switching impulse, direct or power frequency alternating voltages may be combined.The test voltage is characterized by its amplitude, a time delay %t and by the waveshape, peak value and polarity of each component.When combined voltage tests are performed on switchgear they are intended to simulate conditions where one terminal of the open switch is energized at the specified power frequency voltage, and the other terminal is subjected to either a lightning or switching overvoltage. The test circuit shall simulate this situation on both internal and external insulation. In special cases the relevant Technical Committee may permit power-frequency voltages to be simulated by switching impulses of suitable shape.
26.1 Value of the test voltage U
The value of the test voltage U is the maximum potential difference between the energized terminals of the test object [see Figure 15 b)].
26.2 Time delay %t
The time delay %t of a combined voltage is the time interval between the instants when its components reach their peak values, measured from the instant of a negative peak (see Figure 20). It has a tolerance of ± 0,05Tpmax’ where Tp is the time to peak or the front time for an impulse and a quarter cycle for an alternating voltage, and Tpmax is the larger of the values of Tp for the two components.Two voltages of a combined impulse voltage test are said to be synchronous when their time delay %t is zero, within the prescribed tolerance.
26.3 Actual voltage shapes
Due to the coupling between the two generating systems, the shapes and amplitudes of the two components of a combined voltage test differ from those produced by the same sources used separately. They shall therefore be measured in combination, preferably by means of separate measuring systems against earth.Each measuring system shall be suitable for measuring the waveshape of both of the components in order to avoid errors in recording their mutual influence.The maximum permissible deviations from the prescribed voltage shape shall be specified by the relevant Technical Committee.NOTE It should be taken into account that in the case of a disruptive discharge occurring in a combined voltage test, both the voltage sources will act directly against each other if there are no additional protective elements (e.g., resistors or protective gaps) in the circuit. In any case the voltage distribution between the two voltage sources will change completely when there is a disruptive discharge.
26.4 Arrangement of the test object
The arrangement of the test object, particularly with respect to the earthed structures shall be specified by the relevant Technical Committee.
26.5 Atmospheric correction factors
In a combined voltage test, the atmospheric correction factors relative to the component of highest value have to be applied to the test voltage value.
27 Composite testsA composite voltage is the voltage resulting from two different voltage sources suitably connected, applied at one terminal of the test object against earth.The definition of its parameters is left to the relevant Technical Committee.NOTE Composite tests may also be performed by applying voltage and impulse-current sources to the test object.
BS 923-1:1990
© BSI 03-1999 27
Appendix A Statistical Treatment of Test ResultsA.1 Classification of testsDisruptive discharge test procedures can be divided into three classes for the purpose of statistical evaluation.A.1.1 Class 1: Multiple-level testsIn a Class 1 test, mi substantially equal voltage stresses (e.g., lighting impulses) are applied at each of n voltage levels Ui (i = 1, 2, ..., n). While this procedure is usually employed with impulse voltages, some tests with alternating and direct voltages also fall into this class.The test results are the n numbers mi of voltage applications and the corresponding numbers di of disruptive discharges at each voltage level Ui.A.1.2 Class 2: Up-and-down testsIn a Class 2 test, n groups of m substantially equal voltage stresses are applied at voltage levels Ui. The voltage level for each succeeding group of stresses is increased or decreased by a small amount %U according to the result of the previous group of stresses.Two testing procedures are commonly used. The withstand procedure, aimed at finding voltage levels corresponding to low disruptive discharge probabilities and the discharge procedure, which finds voltage levels corresponding to high disruptive discharge probabilities. In the withstand procedure, the voltage level is increased by an amount %U if no disruptive discharge occurs in a group of m voltage applications, otherwise the voltage level is decreased by the same amount. In the discharge procedure, the voltage level is increased by %U if one or more withstands occur, otherwise it is decreased by the same amount.Where m = 1, the two procedures become identical and correspond to the up-and-down 50 % disruptive discharge voltage test.Tests with other values of m are also used to determine voltages corresponding to other disruptive discharge probabilities. The results are the numbers ki of stress groups applied at the voltage levels Ui. The first level Ui taken into account is that at which at least two groups of stresses were applied. The total number of useful groups is n = C ki.A.1.3 Class 3: Successive Discharge TestsIn a Class 3 test, a procedure leading to a disruptive discharge on the test object is applied n times. The test voltage may be increased continuously until a disruptive discharge occurs or held constant at some level until a disruptive discharge is observed. The results are the n values of voltage Ui or time ti at which the disruptive discharge occurred.Such tests are made with direct, alternating or impulse voltages. Tests where disruptive discharges occur on the front of the impulse fall into this class.A.2 Statistical Behaviour of Disruptive DischargeWhen p, the probability of a disruptive discharge during a given test procedure, depends only on the test voltage, U, the behaviour of the test object can be characterized by a function p(U) determined by the processes of discharge development. In practice, this function, the disruptive discharge probability function, can be represented mathematically by expressions depending on at least two parameters U50 and z. U50 is the 50 % discharge voltage for which p(U) = 0,5 and z is the conventional deviation; z = U50 – U16 where U16 is the voltage for which p(U) = 0,16.NOTE 1 Examples of p(U) can be derived from the Gaussian (or Normal), the Weibull or the Gumbel probability distribution functions. Experience shows that for 0,15 < p < 0,85 most theoretical distributions can be considered equivalent. Special Weibull or Gumbel distributions are acceptable approximations to a Gaussian distribution having given U50 and z for p lying between 0,02 and 0,98. Beyond these limits little information is available.NOTE 2 Sometimes p is a function of two or more parameters, e.g., U and dU/dt. In such cases no simple function can be used to describe p. Details of such cases may be found in the technical literature.
The function p(U) and the parameters U50 and z can be found from tests with very large numbers of voltage applications, provided that the characteristics of the test object remain constant throughout the tests.In practice the number of voltage applications is usually limited and the estimates of U50 and z based on an assumed form of p(U) will be subject to statistical uncertainties.
BS 923-1:1990
28 © BSI 03-1999
A.2.1 Confidence limits and statistical errorIf a parameter y is estimated from n test results, upper and lower confidence limits yU and yL can be defined, with the probability C that the true value of y is within these limits. C is termed the confidence level and the half width er = (yU – yL)/2 of the confidence band is called the statistical error.Usually C is taken as 0,95 (or 0,90) and the corresponding limits are called the 95 % (or 90 %) confidence limits.The statistical error er depends on both n and the value of the conventional deviation z. The conventional deviation z should be estimated when possible from tests made under realistic conditions. In general, the larger the number of tests made, the better will be the estimate of z. It should, however, be remembered that during a protracted test series, ambient conditions may change to an extent which offsets the gain in accuracy from the increased number of tests.Since accurate estimation of z from a limited series of tests is not possible, values estimated from the pooled results of many tests are often given by the relevant Technical Committees.The statistical error er may be combined with estimates of other errors (e.g., measuring errors) to define the overall error limits for the determination of a particular parameter.A.3 Analysis of Test ResultsThis Clause is applicable to cases where the results of tests can be regarded as independent estimates, i.e., where the nth result is not influenced by what may have occurred in the (n – 1)th or (n – j)th tests.A.3.1 Treatment of Results from Class 1 TestsIn this case the discharge frequency fi = di/mi at a voltage level Ui is taken as an estimate of p(Ui) the discharge probability at the voltage level Ui. The n estimates of p(Ui) obtained in a Class 1 test can then be fitted to an assumed probability distribution function p(U) and the parameters U50 and z determined.This may be done by plotting fi versus Ui on special graph paper designed to give a straight line plot when the probability estimates conform to a particular probability distribution function p(U). A well-known example is Gaussian or Normal probability paper which yields a straight line plot for estimates conforming to the Gaussian distribution function:
NOTE Normal probability papers do not have ordinate scales embracing the values p = 0 or p = 1. Accordingly, tests at voltage levels causing all discharges di = mi or no discharges di = 0 cannot be plotted directly. A possible way of using these results is to combine them with values obtained for an adjacent voltage level and to plot them as the weighted mean voltage.
Alternatively analytical fitting techniques involving the least-squares method or likelihood methods (see A.4) may be used to find U50, z and the confidence limits of these estimates.In any case adequate methods (such as conventional regression coefficients or confidence limits) should be used to check if the assumed probability function fits the measured points with sufficient accuracy. Reference is made to the relevant technical literature.As a general guide the statistical error tends to vary inversely as the square root of the number of voltage applications at each level mi and inversely as the number of levels used n. Note also that if all values of fi differ from zero and unity, with 10 voltage applications (m = 10) at each of five levels (n = 5) the 95 % confidence limits would be:For U50:
and for z:
0,4z* # z # 2,0 z*
where and z* are the estimates of U50 and z* obtained by fitting the test results to an assumed discharge probability distribution function p(U). In addition the statistical error tends towards lower values for estimates of Up in the vicinity of p = 0,5 or 50 %.A.3.2 Treatment of results from Class 2 TestsA Class 2 test provides an estimate of Up, the voltage at which the disruptive discharge probability is p.
, the estimate of Up, is given by:
p U( ) 1 z 2;⁄( ) u U50–( )2 2z2⁄–[ ] duexp–∞U∫=
U*50 0,75 z*–
# U50 # U*50 0,75z *+
U50*
Up*
Up* kiUi( ) n⁄∑=
BS 923-1:1990
© BSI 03-1999 29
where ki is the number of groups of stresses applied at the voltage level Ui. For a more accurate formula see the technical literature.To avoid appreciable errors, the lowest voltage level taken into account should not differ from by more than 2%U.The withstand procedure described in A.1.2 provides an estimate of Up for a disruptive discharge probability p given by:
p = 1 – (0,5)1/m
while the discharge procedure gives Up for:p = (0,5)1/m
The values of p for which Up can be estimated in up and down tests are limited by the requirement that m be an integer. Examples are given in Table A1.
Table A1
Procedures for estimating z and its confidence limits are also available but are not recommended for general use.A.3.3 Treatment of Results from Class 3 TestsThe result of a Class 3 test is usually a series of n voltages Ui from which parameters U50 and z of a disruptive discharge probability function are to be determined. For a Gaussian (or Normal) distribution, estimates of the parameters U50 and z are given by:
For other distributions likelihood methods can be employed to estimate U50 and z (see A.4). The same expressions and methods apply in cases where times to the occurrence of a disruptive discharge ti are to be analyzed.The confidence limits for Gaussian distributions may be found using the Student’s t or Chi-squared distributions as described in the technical literature.As an example, in the case of a Gaussian distribution, the 95% confidence limits for the estimates of U50 and z obtained from a test with n = 20 are:
and0,76 z* # z # 1,46 z*
A.4 Application of likelihood methodsLikelihood methods may be used for the analysis of the results of all of the above classes of tests. These methods permit estimation of U50 and z and hence Up once a discharge probability distribution function p (U ; U50, z) is selected.Furthermore, it is possible to use all the results obtained and the confidence limits corresponding to any desired confidence level C can be found.
m = 70 34 14 7 4 3 2 1p = 0,01 0,02 0,05 0,10 0,15 0,20 0,30 0,50 (withstand procedure)p = 0,99 0,98 0,95 0,90 0,85 0,80 0,70 0,50 (discharge procedure)
Up*
U50* Ui n⁄∑=
z* Ui U*50–
2n 1–( )⁄∑
1 2⁄
=
U50* 0,47z*–( ) # U50 # U50
* 0,47z*+( )
BS 923-1:1990
30 © BSI 03-1999
A.4.1 The likelihood functionFor Class 1 and Class 2 tests the numbers of discharges, di, and the numbers of withstands wi found at each voltage level Ui are known. If the form of the discharge probability distribution function p (U ; U50, z) is known or assumed, the probability of a discharge at the level Ui is p (Ui ; U50, z) and the probability of a withstand is [1 – p(Ui ; U50, z)]. The likelihood function Li corresponding to di discharges and wi withstands occurring at a voltage level Ui is then:
As Ui, di and wi are known, Li is a function of U50 and z only.The likelihood of a complete set of results embracing n values of Ui then becomes:
L = L1L2 ... Li... LR = L (U50, z)For Class 3 tests each voltage level Ui which appears in the results, corresponds to a disruptive discharge. In general, a voltage level Ui will appear mi times where mi $ 1. The likelihood L then becomes:
wheref = dp/du
Methods for calculating L from extensive sets of results by considering groups of results lying in a number of voltage intervals can be found in the literature.A.4.2 Estimation of U50 and zThe best estimates of U50 and z are the values and z* which maximize L.These are frequently found by using a computer to make repeated calculations of L for assumed values of
and z*. With and z* fixed, Up corresponding to any desired value of discharge probability, p, can be found from the assumed discharge probability distribution function with U50 = and z = z*. Methods for determining the confidence limits of and z* are to be found in the literature. For the case of C = 0,9 the equation L(U50; z) = 0,1Lmax permits determination of these confidence limits.
Appendix B Pollution Test ProceduresB.1 Production of salt fogB.1.1 Preparation of salt solutionThe salt solution should be made to the required salinity from salt (NaCl of commercial purity) and ordinary tap water. The concentration should be within ± 5 % of one of the following values: 2,5 g, 3,5 g, 5 g, 7 g, 10 g, 14 g, 20 g, 28 g, 40 g, 56 g, 80 g, 112 g, 160 g or 224 g per litre of solution.The concentration may be determined by measuring the resistivity or the density of the salt solution. Figure 16 and Figure 17 give the values of the resistivity and the density, respectively, as functions of the salt concentration at 10 °C, 20 °C and 30 °C.B.1.2 Details of spraying systemThe fog is produced in a test chamber by means of a number of jets as shown in Figure 18 and described in detail below. Each jet has two nozzles, one acting as an air outlet and the other as an outlet for the salt solution. The compressed air thus flows across the solution nozzle and produces a fine mist of the solution.The air nozzles should be provided with filtered, oil-free air at 700 kPa above the atmospheric pressure, with a tolerance of ± 4 %. The solution nozzles should be supplied with the specified salt solution at a pressure adjusted so that the flow of the solution through each nozzle, is 0,5 L/min ± 10 % for the period of the test; the tolerance on the total flow to all spray jets is ± 5 % of the nominal value. Consequently, the solution pressure must also be kept constant throughout a test.The jets are mounted 0,6 m apart in two straight rows, parallel to the centre line of the test object (one on each side), each row being 3 m from it and in the same plane, with the jets in each row directed towards one another. Each row should be extended at least 0,6 m beyond the ends of the insulating section of the test object; the latter is mounted vertically, horizontally or inclined as prescribed by the relevant Technical Committee, but should be so placed that the lowest jet is at least 0,6 m above the floor.
Li p Ui ; U50 , z( )di 1 p Ui ; U50 z,( )–[ ]
wi=
L f Ui ; U50 z,( )mi f U2; U
50 z,( )m2...f Um ; U
50 z,( )mm=
U50*
U50* U50
*
U50*
U50*
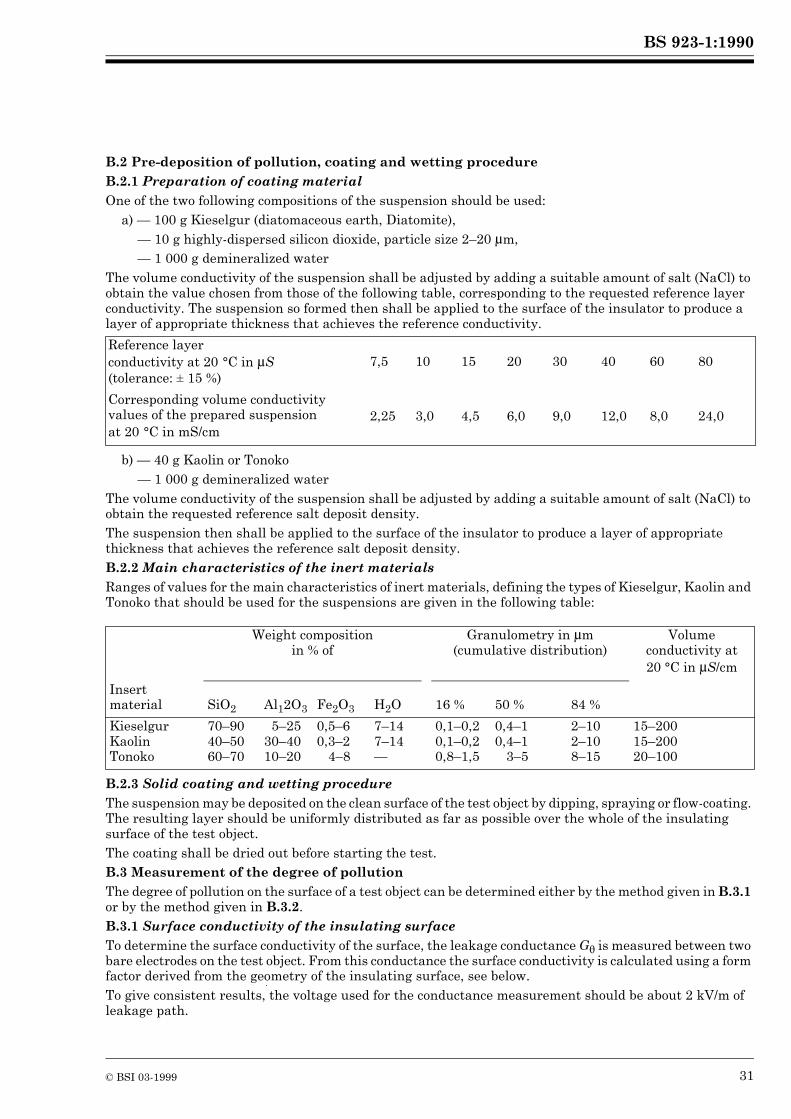
BS 923-1:1990
© BSI 03-1999 31
B.2 Pre-deposition of pollution, coating and wetting procedureB.2.1 Preparation of coating materialOne of the two following compositions of the suspension should be used:
a) — 100 g Kieselgur (diatomaceous earth, Diatomite),— 10 g highly-dispersed silicon dioxide, particle size 2–20 4m,— 1 000 g demineralized water
The volume conductivity of the suspension shall be adjusted by adding a suitable amount of salt (NaCl) to obtain the value chosen from those of the following table, corresponding to the requested reference layer conductivity. The suspension so formed then shall be applied to the surface of the insulator to produce a layer of appropriate thickness that achieves the reference conductivity.
b) — 40 g Kaolin or Tonoko— 1 000 g demineralized water
The volume conductivity of the suspension shall be adjusted by adding a suitable amount of salt (NaCl) to obtain the requested reference salt deposit density.The suspension then shall be applied to the surface of the insulator to produce a layer of appropriate thickness that achieves the reference salt deposit density.B.2.2 Main characteristics of the inert materialsRanges of values for the main characteristics of inert materials, defining the types of Kieselgur, Kaolin and Tonoko that should be used for the suspensions are given in the following table:
B.2.3 Solid coating and wetting procedureThe suspension may be deposited on the clean surface of the test object by dipping, spraying or flow-coating. The resulting layer should be uniformly distributed as far as possible over the whole of the insulating surface of the test object.The coating shall be dried out before starting the test.B.3 Measurement of the degree of pollutionThe degree of pollution on the surface of a test object can be determined either by the method given in B.3.1 or by the method given in B.3.2.B.3.1 Surface conductivity of the insulating surfaceTo determine the surface conductivity of the surface, the leakage conductance GF is measured between two bare electrodes on the test object. From this conductance the surface conductivity is calculated using a form factor derived from the geometry of the insulating surface, see below.To give consistent results, the voltage used for the conductance measurement should be about 2 kV/m of leakage path.
Reference layer conductivity at 20 °C in 4S (tolerance: ± 15 %)
7,5 10 15 20 30 40 60 80
Corresponding volume conductivity values of the prepared suspension at 20 °C in mS/cm
2,25 3,0 4,5 6,0 9,0 12,0 8,0 24,0
Weight composition in % of
Granulometry in 4m (cumulative distribution)
Volume conductivity at 20 °C in 4S/cm
Insert material SiO2 Al12O3 Fe2O3 H2O 16 % 50 % 84 %
KieselgurKaolinTonoko
70–9040–5060–70
5–2530–4010–20
0,5–60,3–2
4–8
7–147–14—
0,1–0,20,1–0,20,8–1,5
0,4–10,4–1
3–5
2–102–108–15
15–20015–20020–100
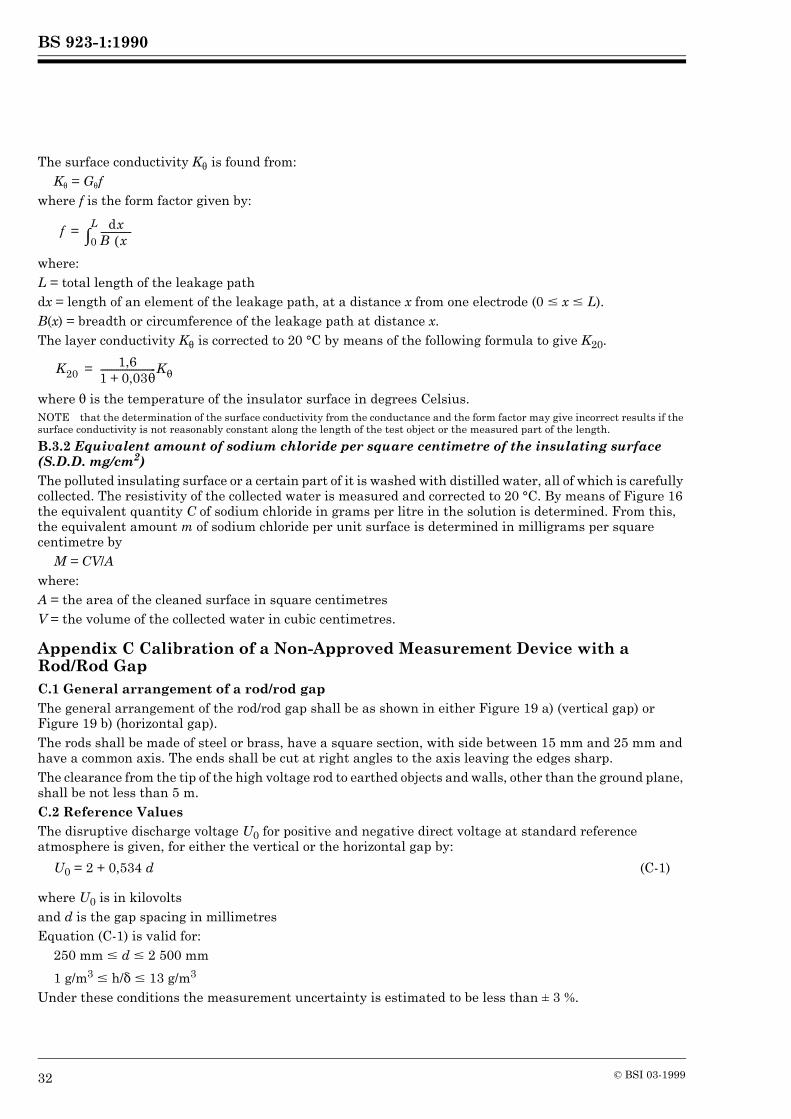
BS 923-1:1990
32 © BSI 03-1999
The surface conductivity Kθ is found from:Kθ = Gθf
where f is the form factor given by:
where:L = total length of the leakage pathdx = length of an element of the leakage path, at a distance x from one electrode (0 # x # L).B(x) = breadth or circumference of the leakage path at distance x.The layer conductivity Kθ is corrected to 20 °C by means of the following formula to give K20.
where F is the temperature of the insulator surface in degrees Celsius.NOTE that the determination of the surface conductivity from the conductance and the form factor may give incorrect results if the surface conductivity is not reasonably constant along the length of the test object or the measured part of the length.
B.3.2 Equivalent amount of sodium chloride per square centimetre of the insulating surface (S.D.D. mg/cm2)The polluted insulating surface or a certain part of it is washed with distilled water, all of which is carefully collected. The resistivity of the collected water is measured and corrected to 20 °C. By means of Figure 16 the equivalent quantity C of sodium chloride in grams per litre in the solution is determined. From this, the equivalent amount m of sodium chloride per unit surface is determined in milligrams per square centimetre by
M = CV/Awhere:A = the area of the cleaned surface in square centimetresV = the volume of the collected water in cubic centimetres.
Appendix C Calibration of a Non-Approved Measurement Device with a Rod/Rod GapC.1 General arrangement of a rod/rod gapThe general arrangement of the rod/rod gap shall be as shown in either Figure 19 a) (vertical gap) or Figure 19 b) (horizontal gap).The rods shall be made of steel or brass, have a square section, with side between 15 mm and 25 mm and have a common axis. The ends shall be cut at right angles to the axis leaving the edges sharp.The clearance from the tip of the high voltage rod to earthed objects and walls, other than the ground plane, shall be not less than 5 m.C.2 Reference ValuesThe disruptive discharge voltage U0 for positive and negative direct voltage at standard reference atmosphere is given, for either the vertical or the horizontal gap by:
where U0 is in kilovoltsand d is the gap spacing in millimetresEquation (C-1) is valid for:
250 mm # d # 2 500 mm
1 g/m3 # h/$ # 13 g/m3
Under these conditions the measurement uncertainty is estimated to be less than ± 3 %.
U0 = 2 + 0,534 d (C-1)
f dxB x( )--------------
0
L∫=
K201,6
1 0,03F+-------------------------KF=
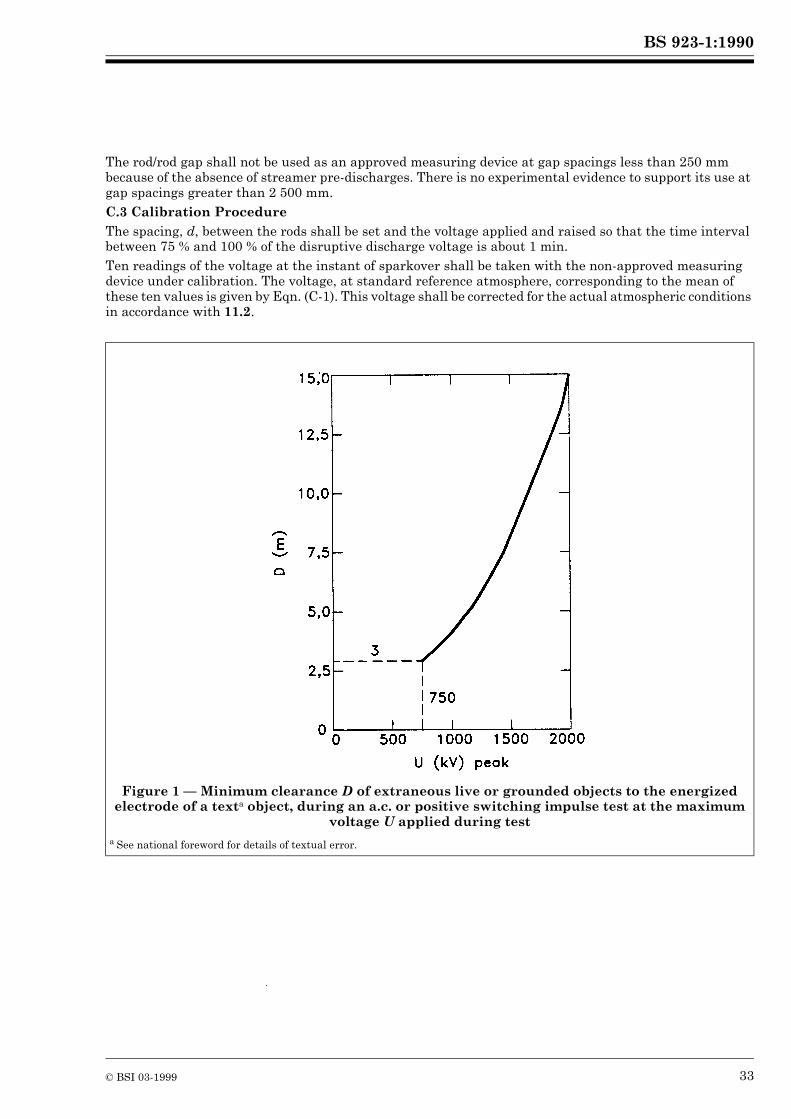
BS 923-1:1990
© BSI 03-1999 33
The rod/rod gap shall not be used as an approved measuring device at gap spacings less than 250 mm because of the absence of streamer pre-discharges. There is no experimental evidence to support its use at gap spacings greater than 2 500 mm.C.3 Calibration ProcedureThe spacing, d, between the rods shall be set and the voltage applied and raised so that the time interval between 75 % and 100 % of the disruptive discharge voltage is about 1 min.Ten readings of the voltage at the instant of sparkover shall be taken with the non-approved measuring device under calibration. The voltage, at standard reference atmosphere, corresponding to the mean of these ten values is given by Eqn. (C-1). This voltage shall be corrected for the actual atmospheric conditions in accordance with 11.2.
Figure 1 — Minimum clearance D of extraneous live or grounded objects to the energized electrode of a texta object, during an a.c. or positive switching impulse test at the maximum
voltage U applied during testa See national foreword for details of textual error.
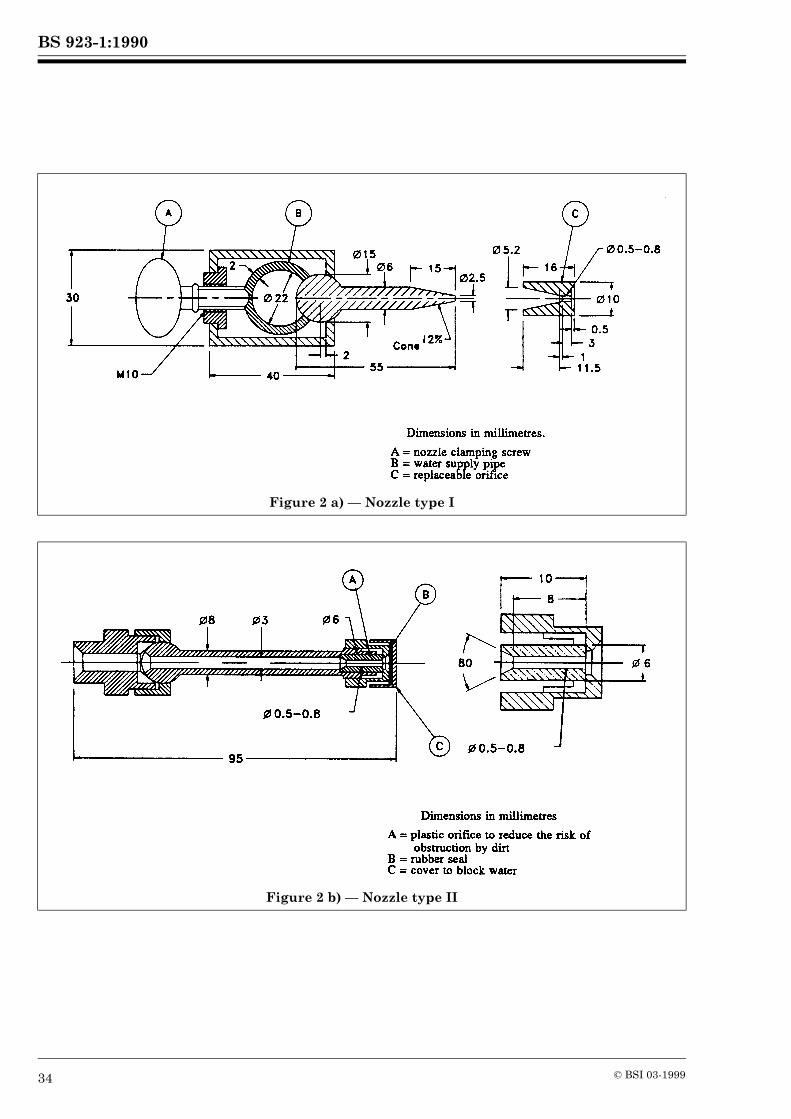
BS 923-1:1990
34 © BSI 03-1999
Figure 2 a) — Nozzle type I
Figure 2 b) — Nozzle type II
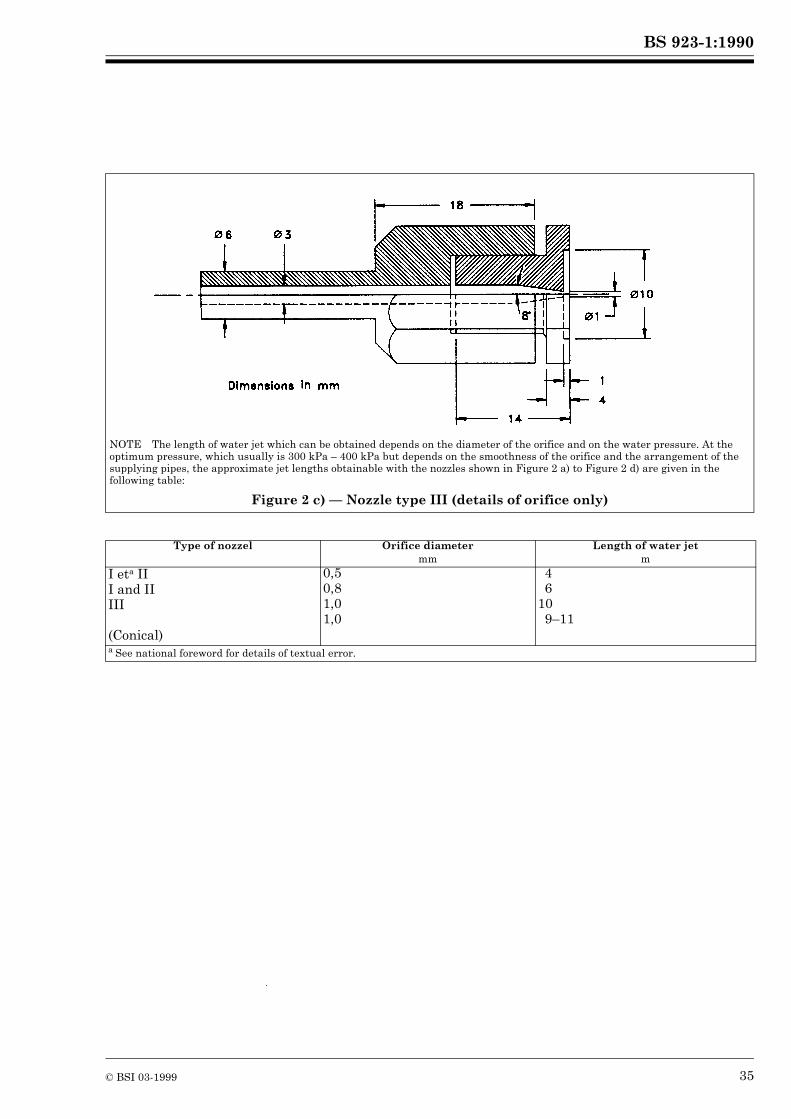
BS 923-1:1990
© BSI 03-1999 35
NOTE The length of water jet which can be obtained depends on the diameter of the orifice and on the water pressure. At the optimum pressure, which usually is 300 kPa – 400 kPa but depends on the smoothness of the orifice and the arrangement of the supplying pipes, the approximate jet lengths obtainable with the nozzles shown in Figure 2 a) to Figure 2 d) are given in the following table:
Figure 2 c) — Nozzle type III (details of orifice only)
Type of nozzel Orifice diameter Length of water jet mm m
I eta III and IIIII
(Conical)
0,50,81,01,0
46
109–11
a See national foreword for details of textual error.
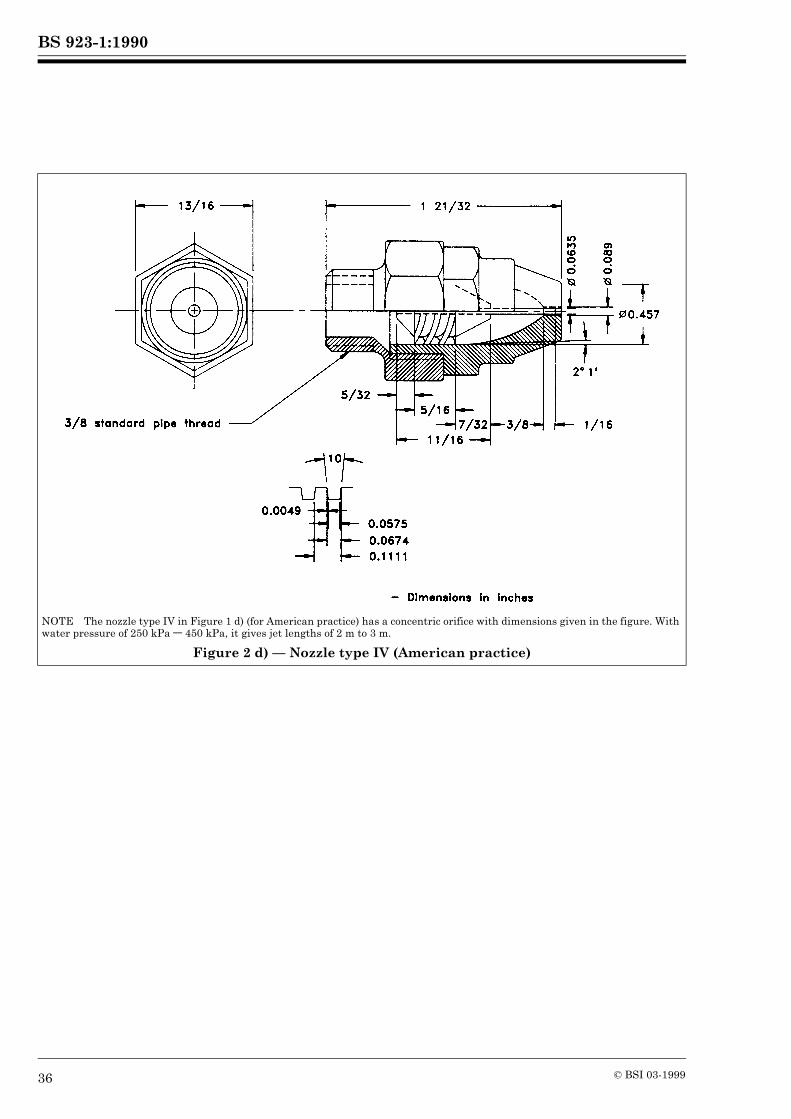
BS 923-1:1990
36 © BSI 03-1999
NOTE The nozzle type IV in Figure 1 d) (for American practice) has a concentric orifice with dimensions given in the figure. With water pressure of 250 kPa – 450 kPa, it gives jet lengths of 2 m to 3 m.
Figure 2 d) — Nozzle type IV (American practice)
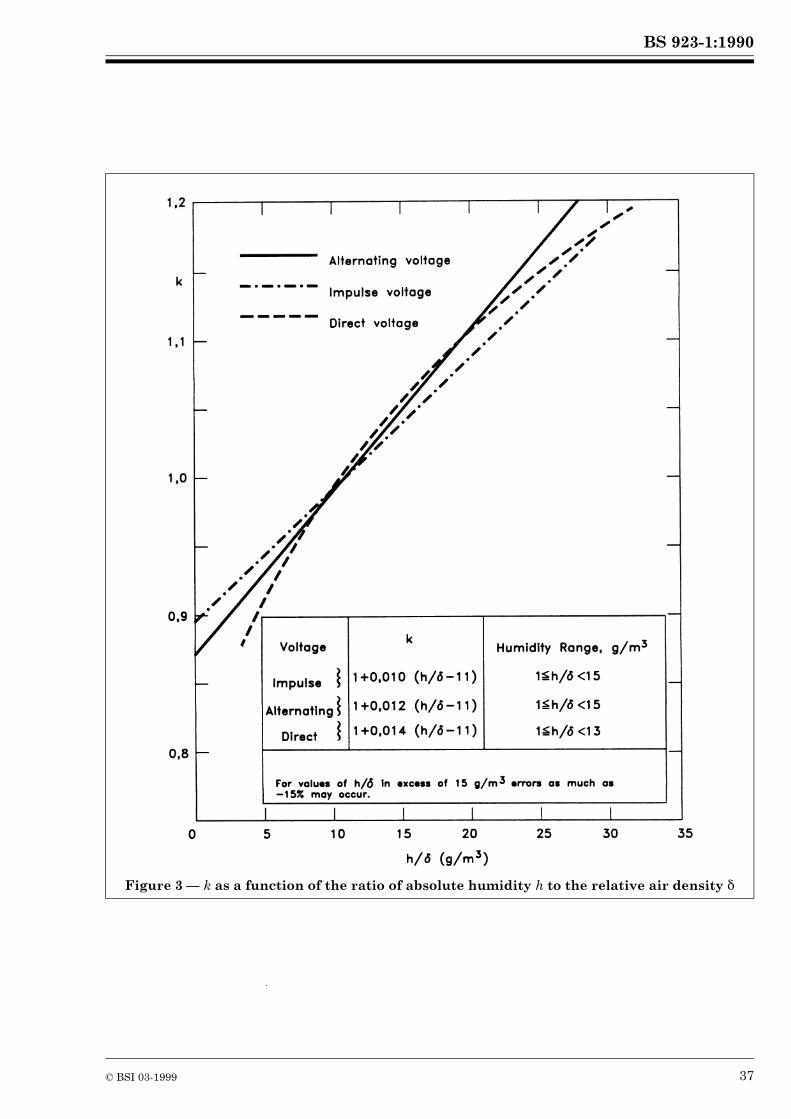
BS 923-1:1990
© BSI 03-1999 37
Figure 3 — k as a function of the ratio of absolute humidity h to the relative air density $
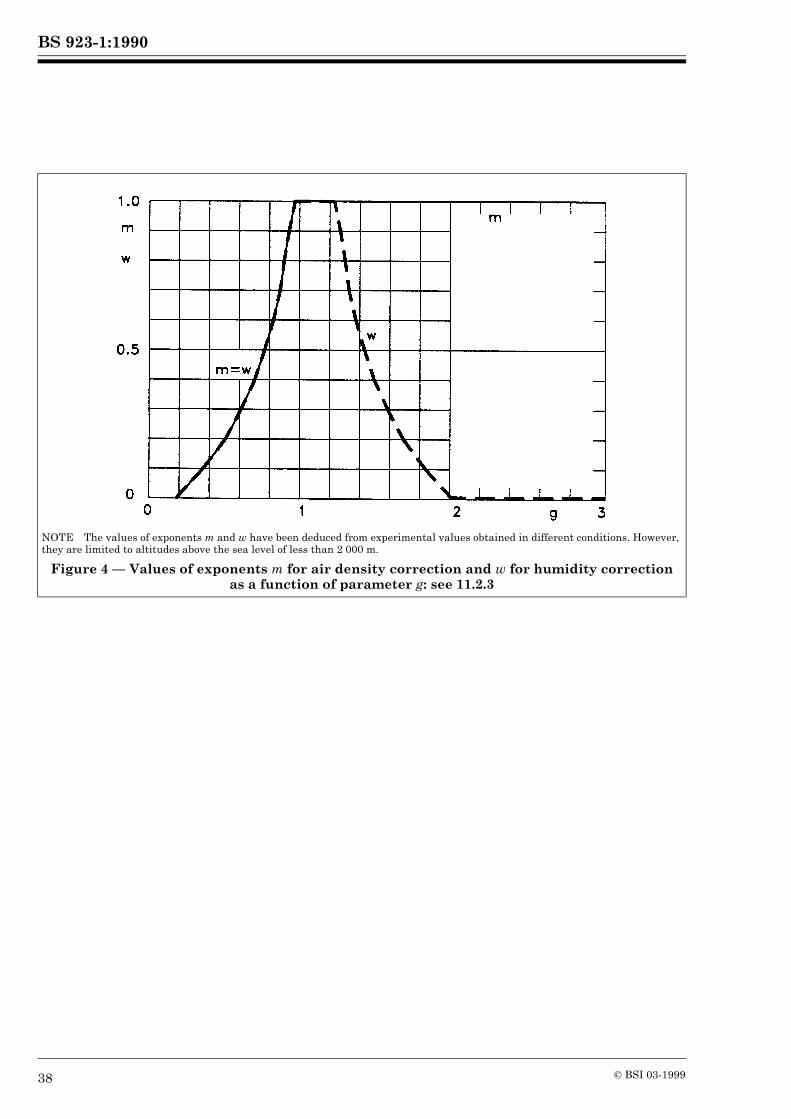
BS 923-1:1990
38 © BSI 03-1999
NOTE The values of exponents m and w have been deduced from experimental values obtained in different conditions. However, they are limited to altitudes above the sea level of less than 2 000 m.
Figure 4 — Values of exponents m for air density correction and w for humidity correction as a function of parameter g: see 11.2.3
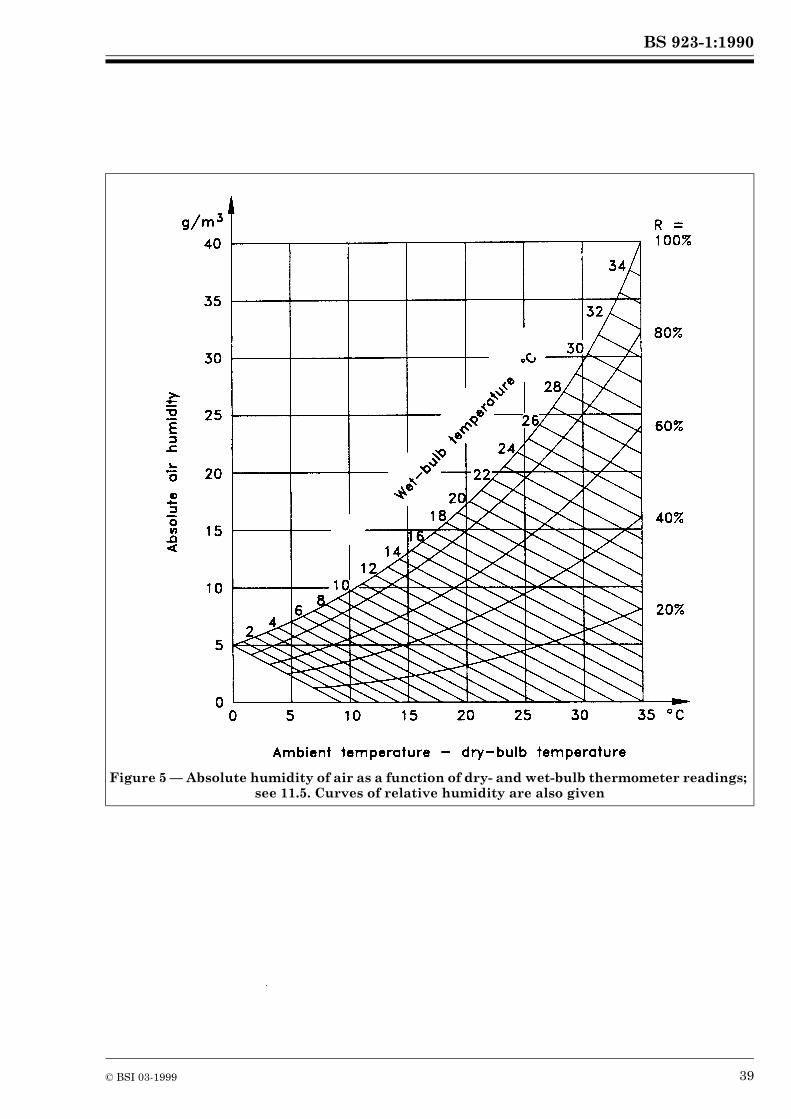
BS 923-1:1990
© BSI 03-1999 39
Figure 5 — Absolute humidity of air as a function of dry- and wet-bulb thermometer readings; see 11.5. Curves of relative humidity are also given
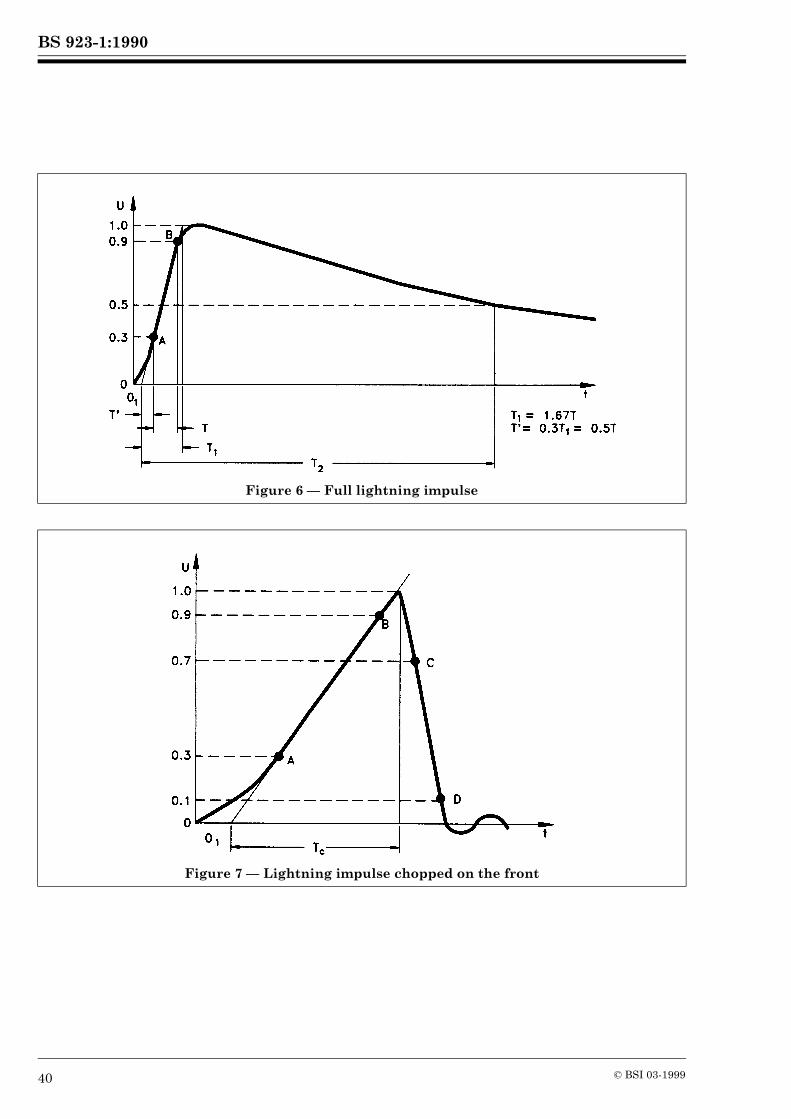
BS 923-1:1990
40 © BSI 03-1999
Figure 6 — Full lightning impulse
Figure 7 — Lightning impulse chopped on the front
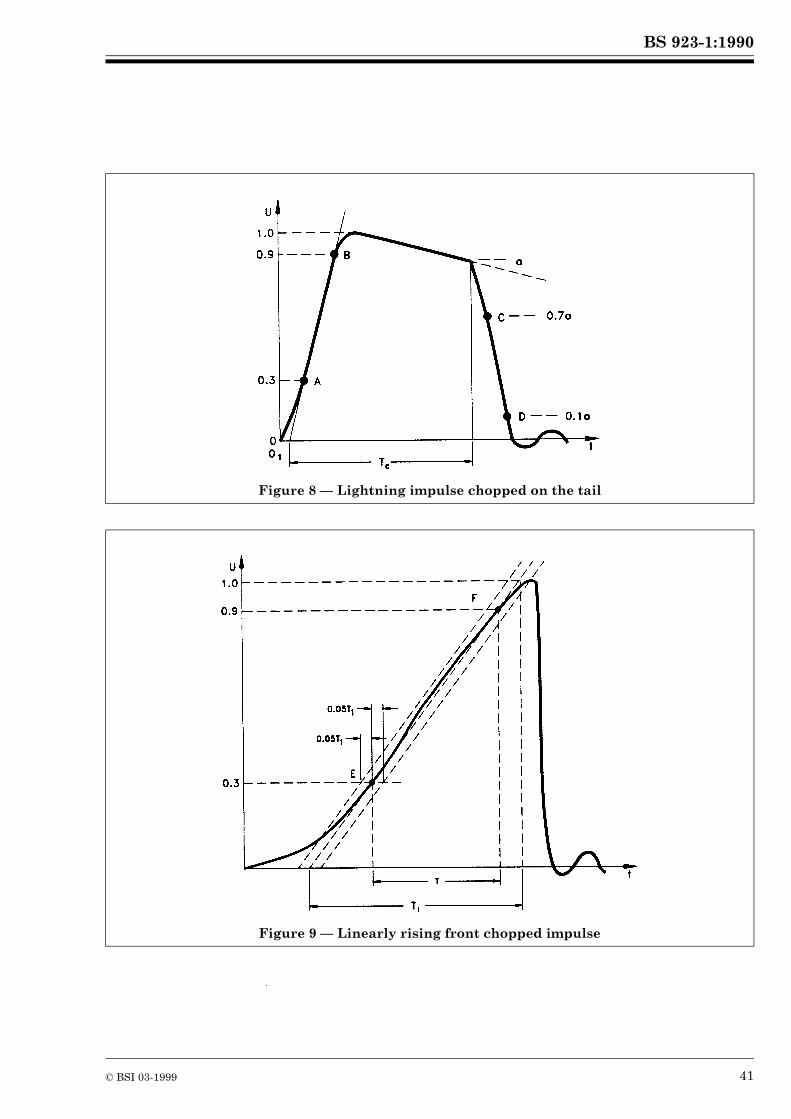
BS 923-1:1990
© BSI 03-1999 41
Figure 8 — Lightning impulse chopped on the tail
Figure 9 — Linearly rising front chopped impulse
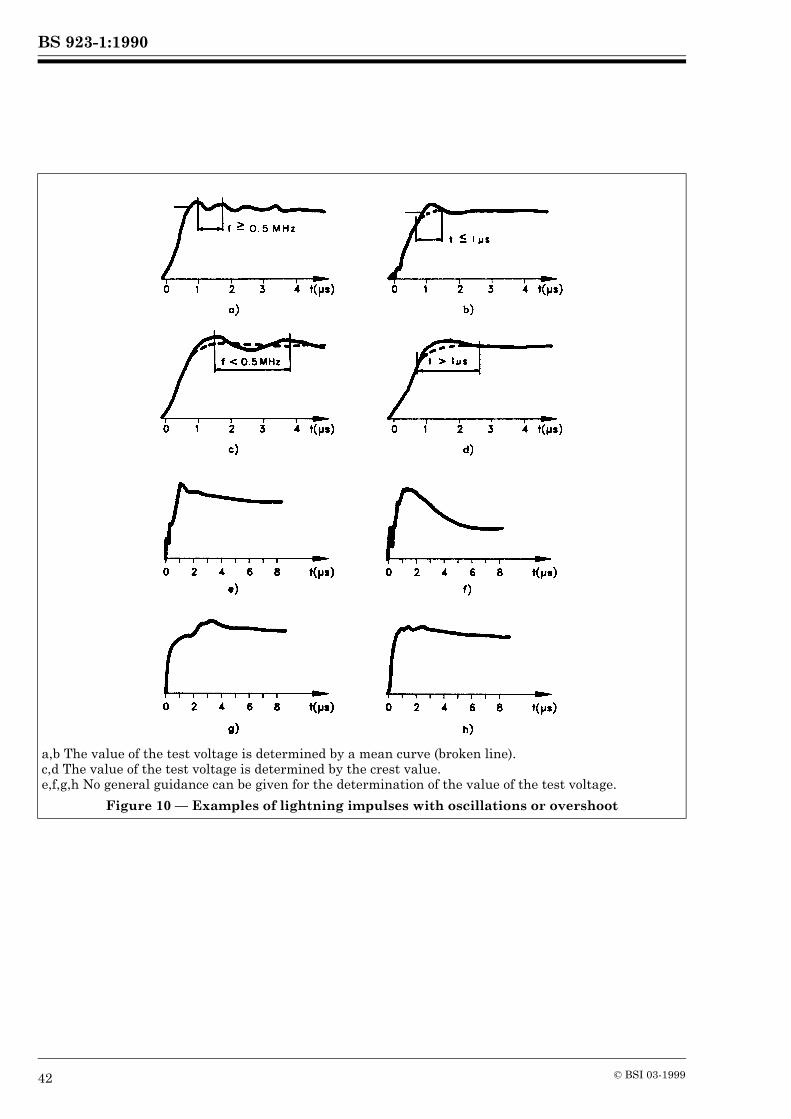
BS 923-1:1990
42 © BSI 03-1999
a,b The value of the test voltage is determined by a mean curve (broken line).c,d The value of the test voltage is determined by the crest value.e,f,g,h No general guidance can be given for the determination of the value of the test voltage.
Figure 10 — Examples of lightning impulses with oscillations or overshoot
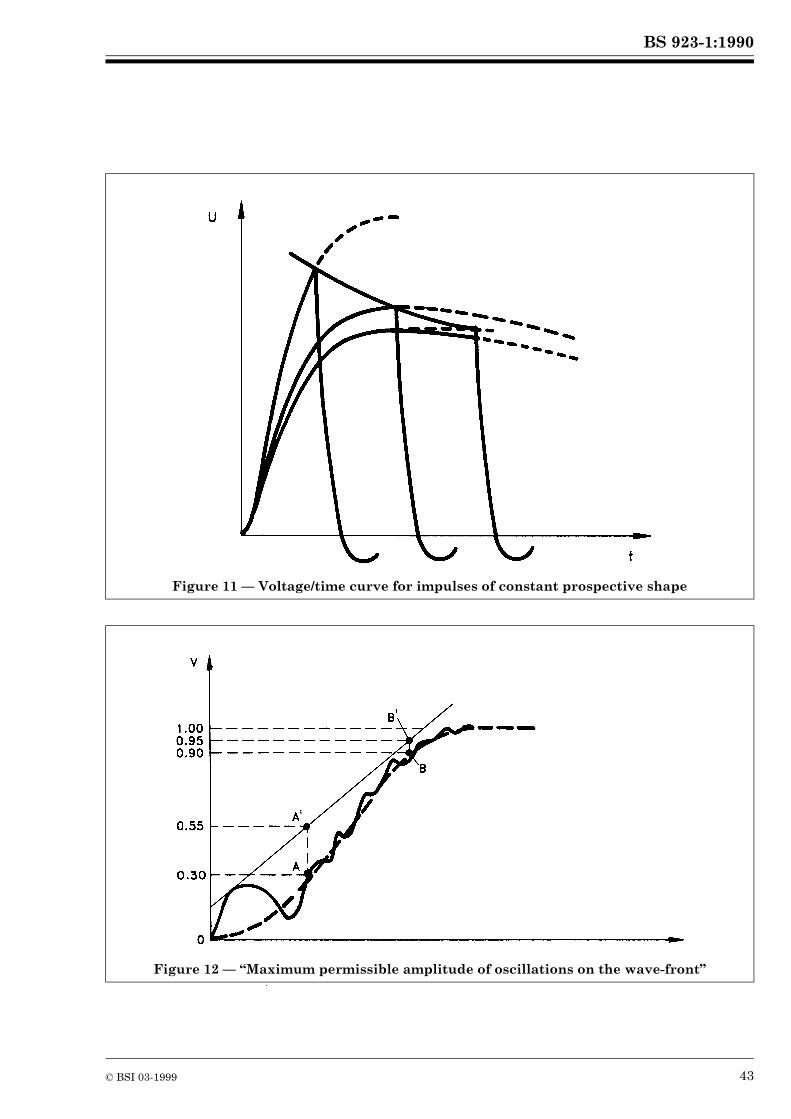
BS 923-1:1990
© BSI 03-1999 43
Figure 11 — Voltage/time curve for impulses of constant prospective shape
Figure 12 — “Maximum permissible amplitude of oscillations on the wave-front”
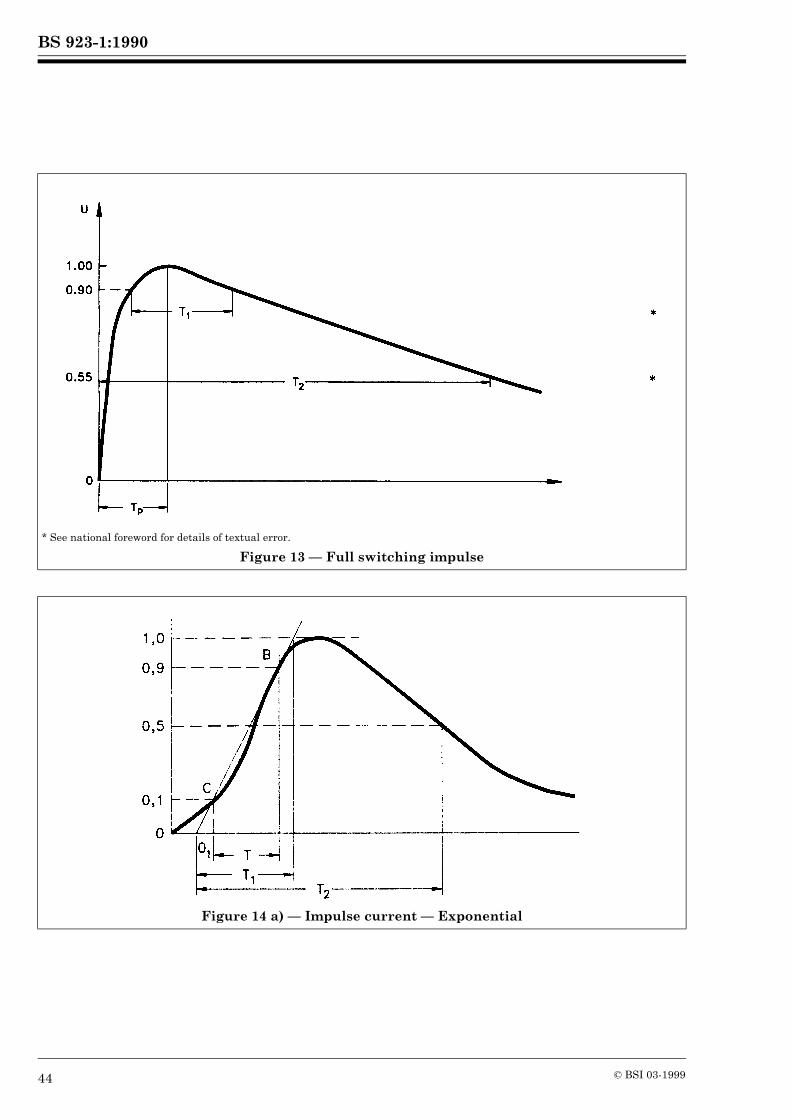
BS 923-1:1990
44 © BSI 03-1999
* See national foreword for details of textual error.
Figure 13 — Full switching impulse
Figure 14 a) — Impulse current — Exponential
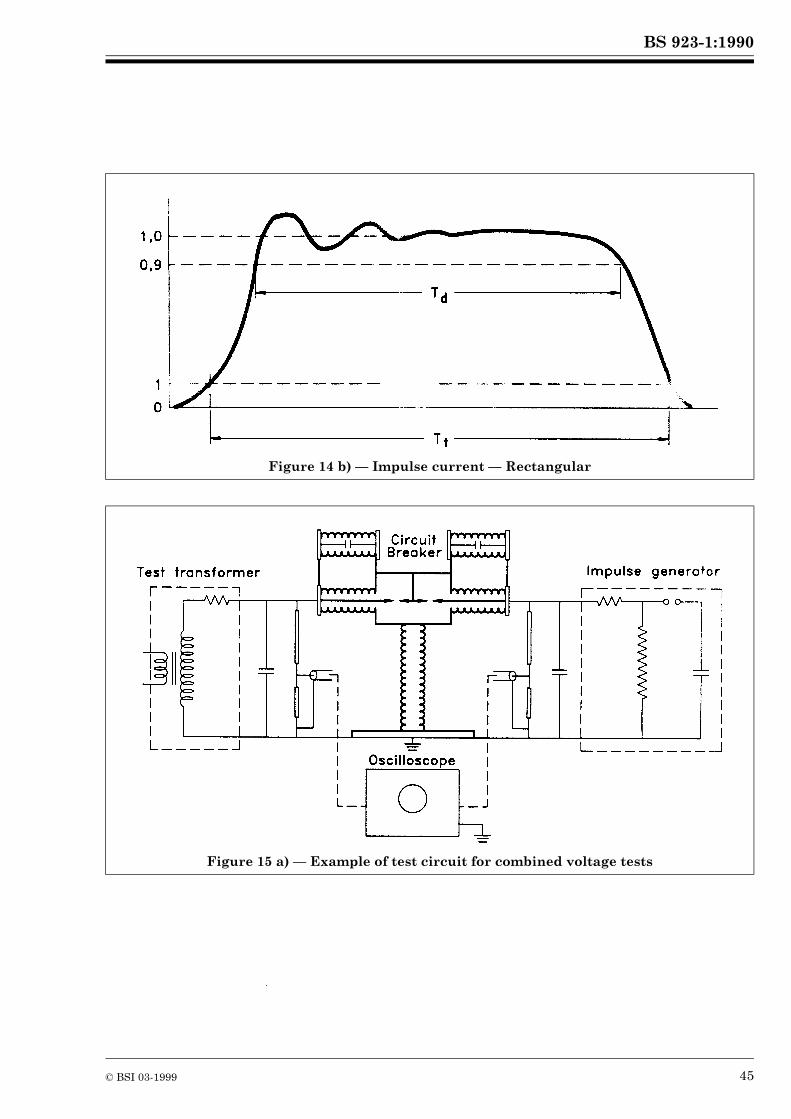
BS 923-1:1990
© BSI 03-1999 45
Figure 14 b) — Impulse current — Rectangular
Figure 15 a) — Example of test circuit for combined voltage tests
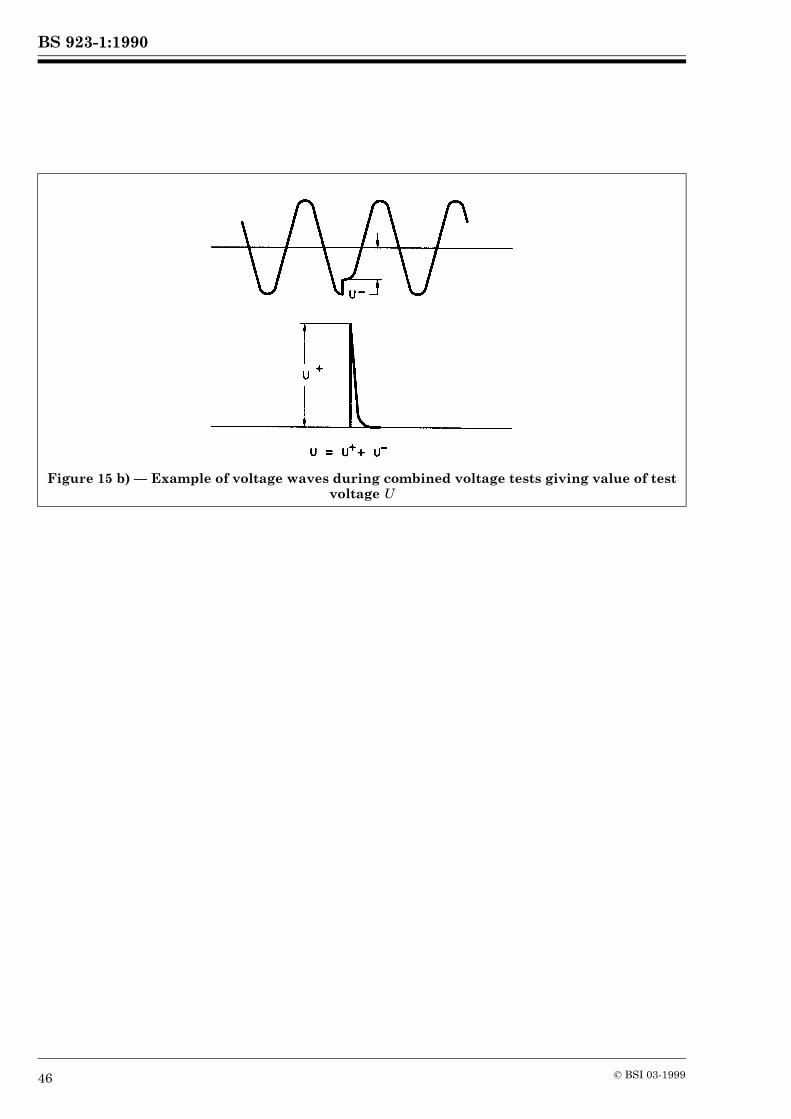
BS 923-1:1990
46 © BSI 03-1999
Figure 15 b) — Example of voltage waves during combined voltage tests giving value of test voltage U
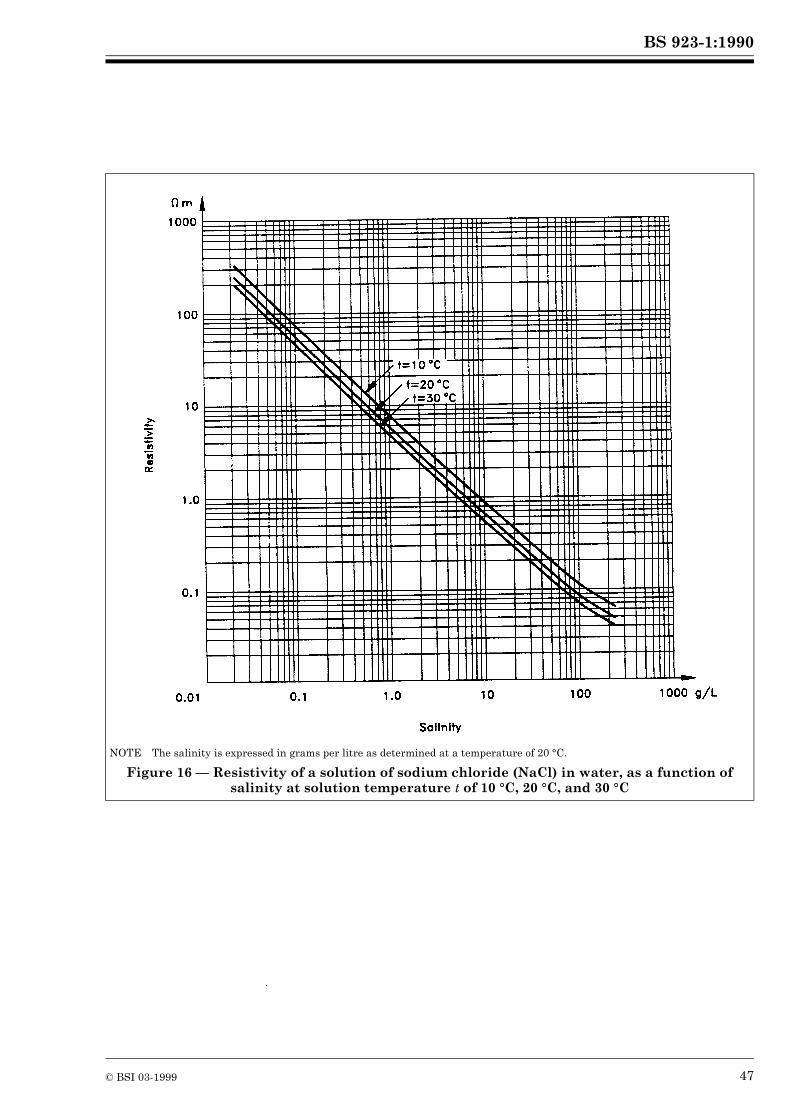
BS 923-1:1990
© BSI 03-1999 47
NOTE The salinity is expressed in grams per litre as determined at a temperature of 20 °C.
Figure 16 — Resistivity of a solution of sodium chloride (NaCl) in water, as a function of salinity at solution temperature t of 10 °C, 20 °C, and 30 °C
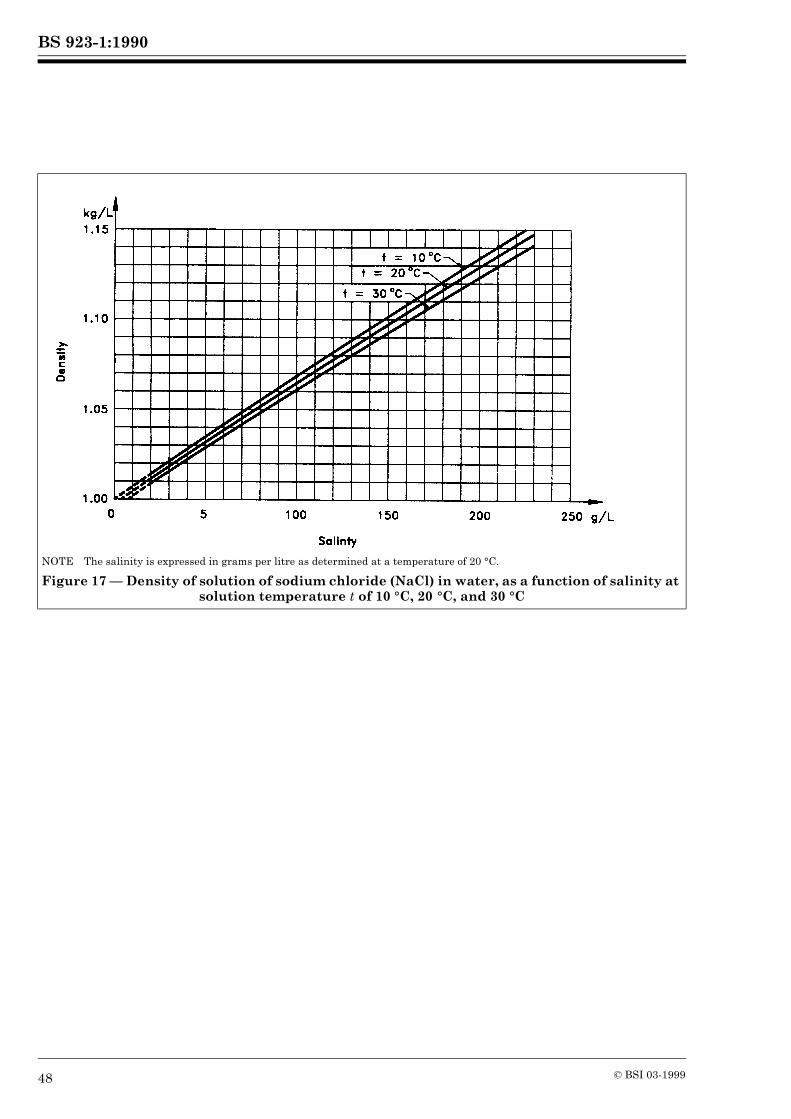
BS 923-1:1990
48 © BSI 03-1999
NOTE The salinity is expressed in grams per litre as determined at a temperature of 20 °C.
Figure 17 — Density of solution of sodium chloride (NaCl) in water, as a function of salinity at solution temperature t of 10 °C, 20 °C, and 30 °C
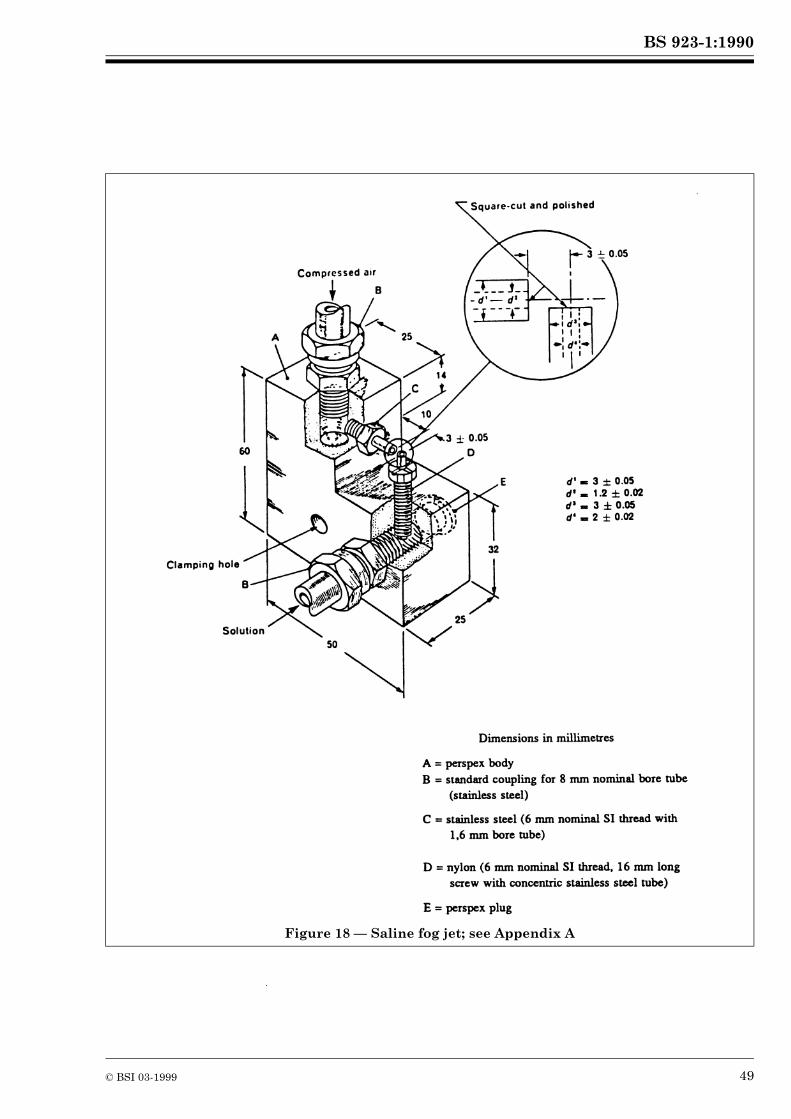
BS 923-1:1990
© BSI 03-1999 49
Figure 18 — Saline fog jet; see Appendix A
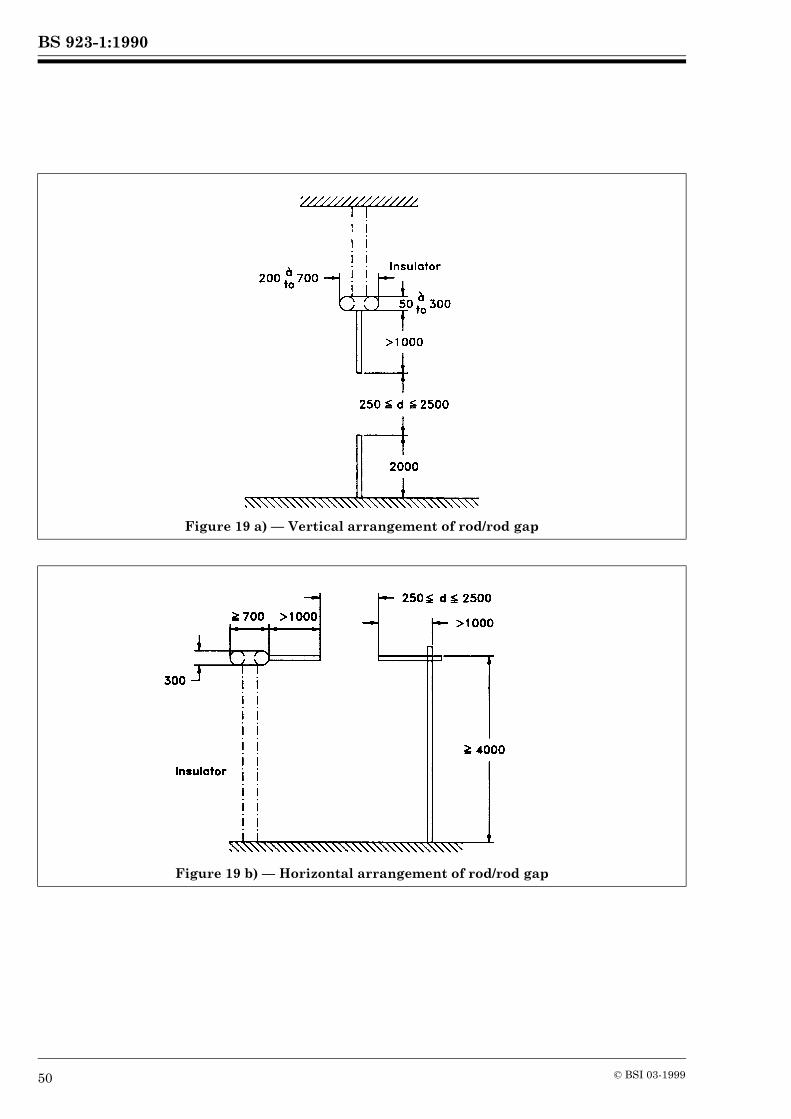
BS 923-1:1990
50 © BSI 03-1999
Figure 19 a) — Vertical arrangement of rod/rod gap
Figure 19 b) — Horizontal arrangement of rod/rod gap
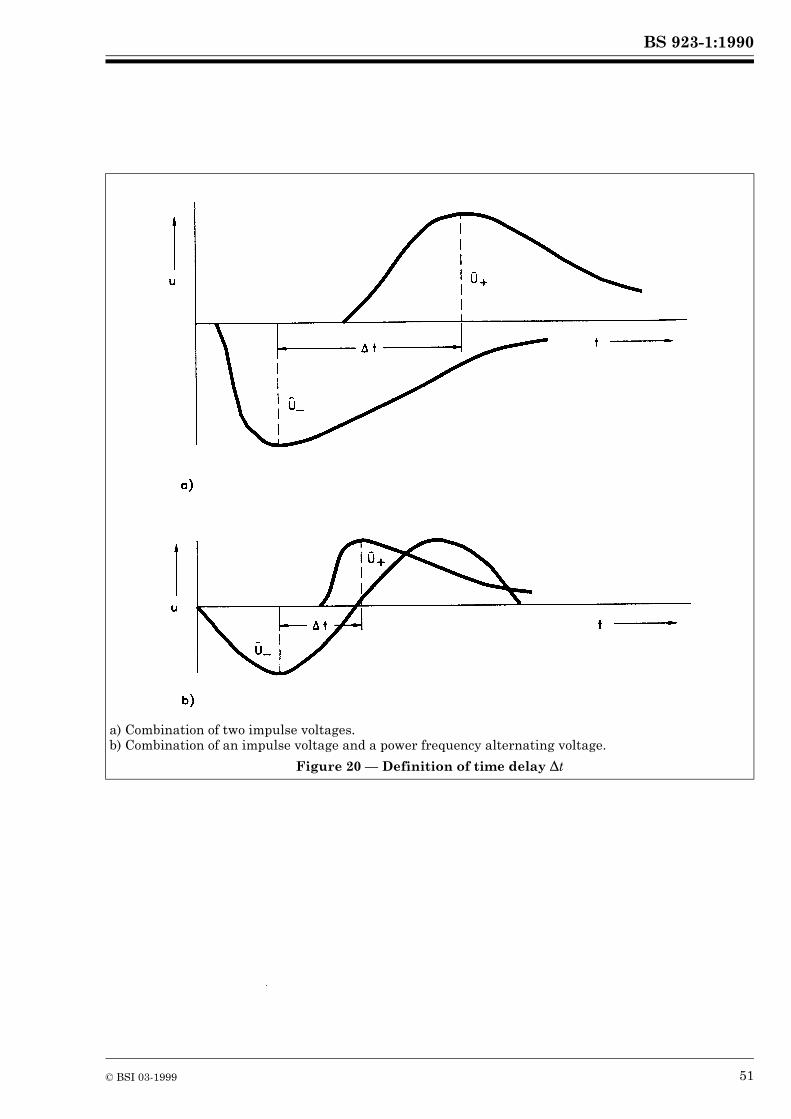
BS 923-1:1990
© BSI 03-1999 51
a) Combination of two impulse voltages.b) Combination of an impulse voltage and a power frequency alternating voltage.
Figure 20 — Definition of time delay %t

52 blank
BS 923-1:1990
© BSI 03-1999
Publication(s) referred to
See national foreword.
BS 923-1:1990IEC 60-1:1989
BSI389 Chiswick High RoadLondonW4 4AL
BSI — British Standards InstitutionBSI is the independent national body responsible for preparing British Standards. It presents the UK view on standards in Europe and at the international level. It is incorporated by Royal Charter.
Revisions
British Standards are updated by amendment or revision. Users of British Standards should make sure that they possess the latest amendments or editions.
It is the constant aim of BSI to improve the quality of our products and services. We would be grateful if anyone finding an inaccuracy or ambiguity while using this British Standard would inform the Secretary of the technical committee responsible, the identity of which can be found on the inside front cover. Tel: 020 8996 9000. Fax: 020 8996 7400.
BSI offers members an individual updating service called PLUS which ensures that subscribers automatically receive the latest editions of standards.
Buying standards
Orders for all BSI, international and foreign standards publications should be addressed to Customer Services. Tel: 020 8996 9001. Fax: 020 8996 7001.
In response to orders for international standards, it is BSI policy to supply the BSI implementation of those that have been published as British Standards, unless otherwise requested.
Information on standards
BSI provides a wide range of information on national, European and international standards through its Library and its Technical Help to Exporters Service. Various BSI electronic information services are also available which give details on all its products and services. Contact the Information Centre. Tel: 020 8996 7111. Fax: 020 8996 7048.
Subscribing members of BSI are kept up to date with standards developments and receive substantial discounts on the purchase price of standards. For details of these and other benefits contact Membership Administration. Tel: 020 8996 7002. Fax: 020 8996 7001.
Copyright
Copyright subsists in all BSI publications. BSI also holds the copyright, in the UK, of the publications of the internationalstandardization bodies. Except as permitted under the Copyright, Designs and Patents Act 1988 no extract may be reproduced, stored in a retrieval system or transmitted in any form or by any means – electronic, photocopying, recording or otherwise – without prior written permission from BSI.
This does not preclude the free use, in the course of implementing the standard, of necessary details such as symbols, and size, type or grade designations. If these details are to be used for any other purpose than implementation then the prior written permission of BSI must be obtained.
If permission is granted, the terms may include royalty payments or a licensing agreement. Details and advice can be obtained from the Copyright Manager. Tel: 020 8996 7070.