Embed Size (px)
Citation preview
LOGO
“ Add your company slogan ”Development of Web Geospatial Decision Support
System (DSS) for Irrigation Water Management
M. M. Maina
B.Eng.,M.Eng.,PgDE, PhD
09092205217, [email protected]
OUTLINE
Agricultural water management (AWM)
Agricultural water resources issues
Measurements/estimation of WBM components
Performance Indicators of AWM
Development of WEBGIS DSS for AWM
Uses and Advantage of AWM Web Application
SWAMP- soil water assessment and management for paddies
2/26/2015 2
Agricultural Water management
2/26/2015 3
Agricultural water management:
The planned development, distribution
and use of water resources to meet
predetermined agricultural objectives
Agricultural Water management
Why do we concern about Agricultural
water management?
One of the biggest concerns for our
water-based resources in the future is
the sustainability of the current and
even future water resource allocation.
Climate change
Population Increase
2/26/2015 4
Agricultural Water management
Agriculture is said to be the major
consumer of our fresh water resources.
Nearly 70% of the fresh water
resources goes to Agriculture (FAO,
2007).
2/26/2015 5
Agricultural Water management
Researches in Agricultural fields have
shown that most of the agricultural
water losses occur in the field.
Study of the Paddy field water balance
model reveals how much water is loss
during irrigation.
2/26/2015 6
Paddy Water Balance Model
2/26/2015 7
A water balance model for paddy is
developed primarily based on the principle of
conservation of mass: soil–water within the
root zone. The water balance for paddy is
different from that of field crops because
paddy requires standing water in the field
during most of its growth period.
Therefore, the water balance components
includes the standing water depth on the
field.
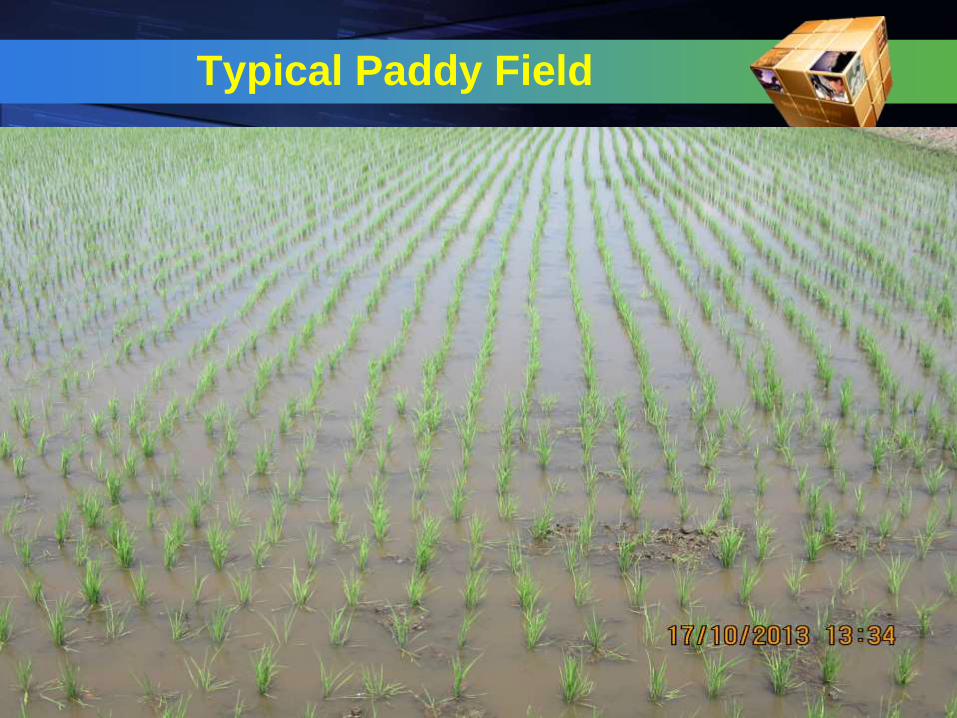
Typical Paddy Field
2/26/2015 8
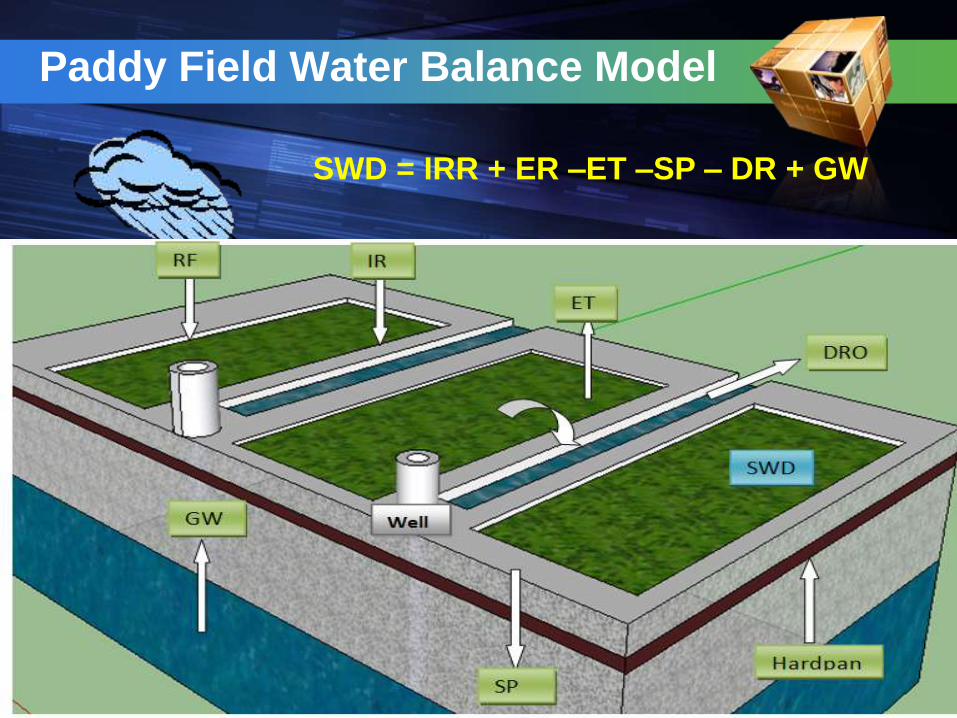
Paddy Field Water Balance Model
SWD = IRR + ER –ET –SP – DR + GW
Water Balance Model
2/26/2015 10
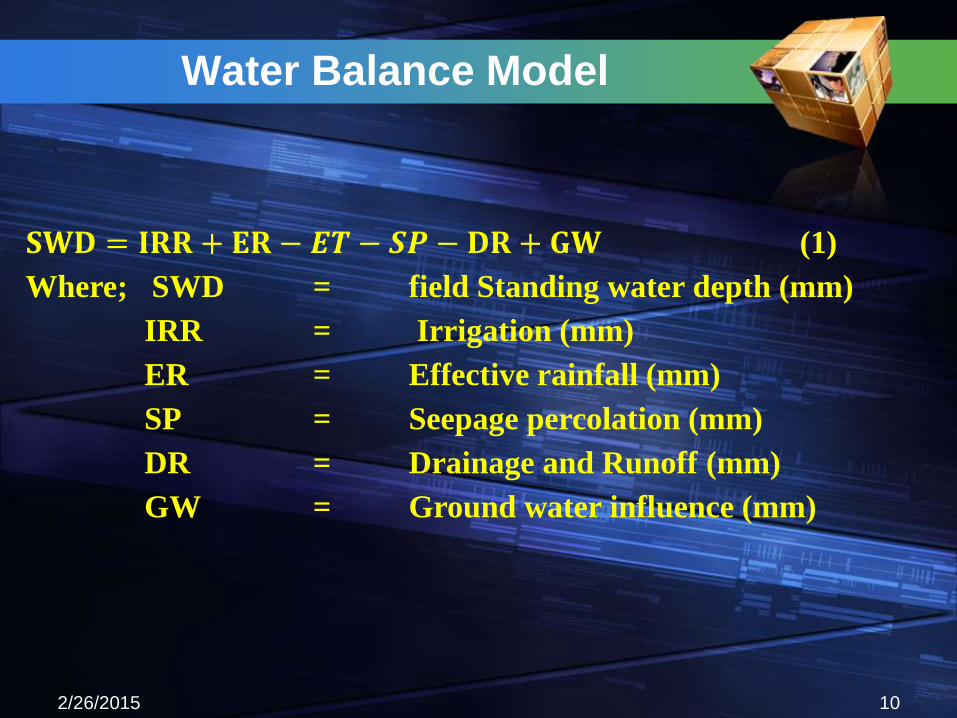
𝐒𝐖𝐃 = 𝐈𝐑𝐑 + 𝐄𝐑 − 𝑬𝑻 − 𝑺𝑷 − 𝐃𝐑 + 𝐆𝐖 (1)
Where; SWD = field Standing water depth (mm)
IRR = Irrigation (mm)
ER = Effective rainfall (mm)
SP = Seepage percolation (mm)
DR = Drainage and Runoff (mm)
GW = Ground water influence (mm)
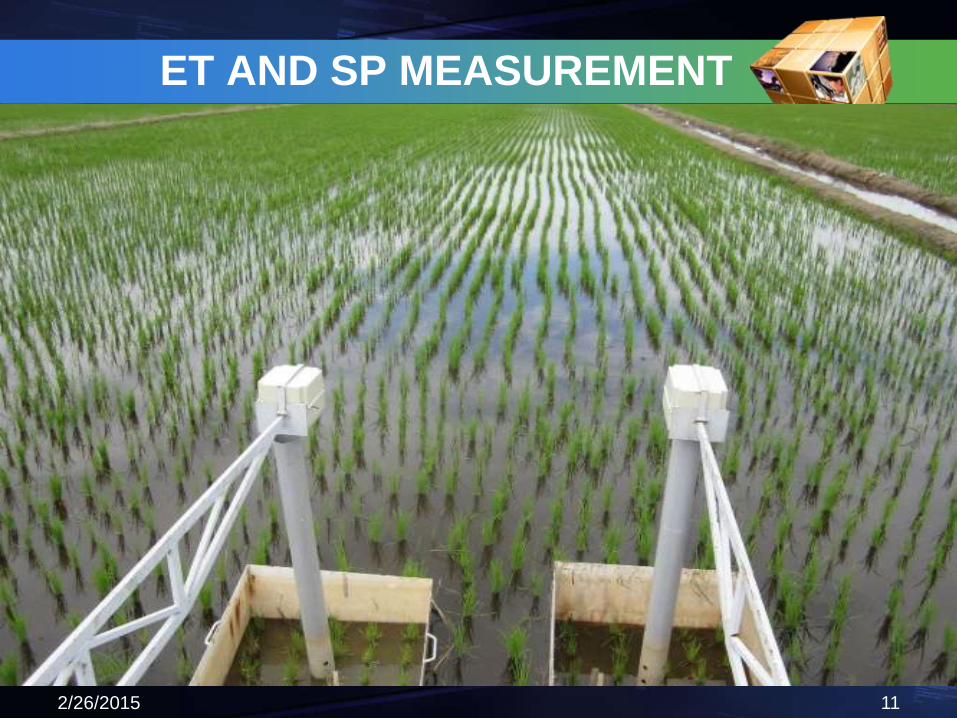
ET AND SP MEASUREMENT
2/26/2015 11
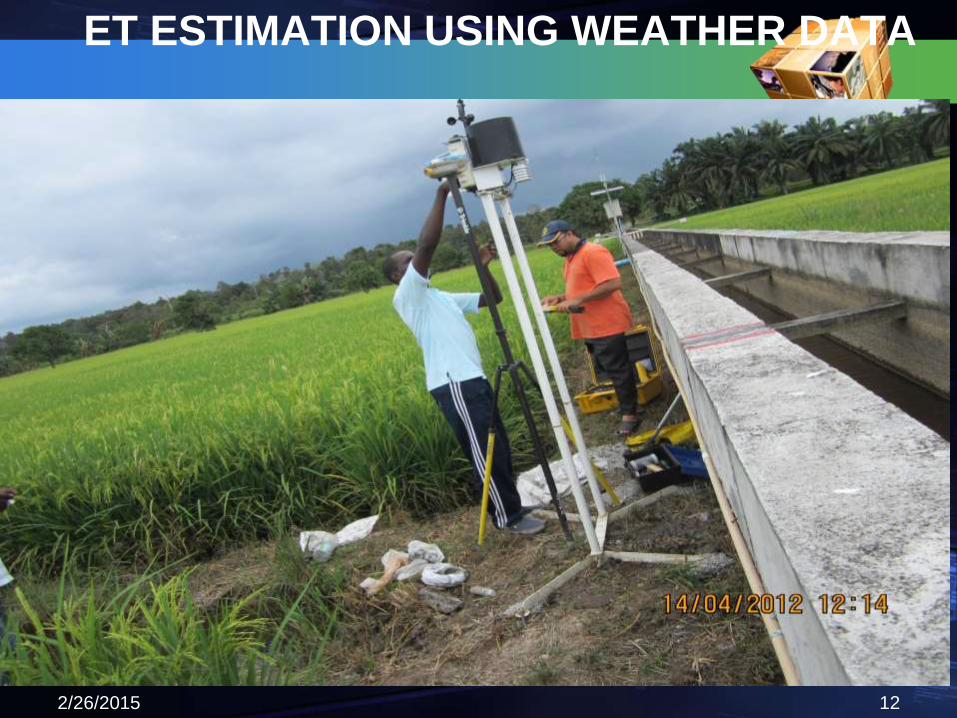
ET ESTIMATION USING WEATHER DATA
2/26/2015 12
PENMAN-MONTEITH
2/26/2015 13
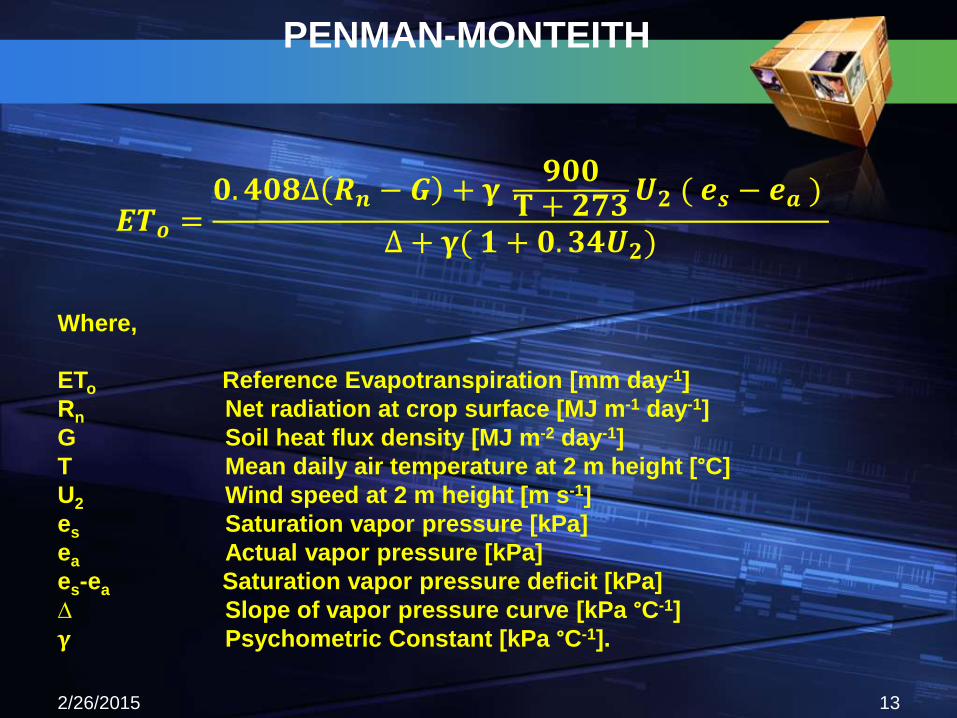
𝑬𝑻𝒐 =𝟎. 𝟒𝟎𝟖∆ 𝑹𝒏 − 𝑮 + 𝛄
𝟗𝟎𝟎𝐓 + 𝟐𝟕𝟑𝑼𝟐 ( 𝒆𝒔 − 𝒆𝒂 )
∆ + 𝛄( 𝟏 + 𝟎. 𝟑𝟒𝑼𝟐)
Where,
ETo Reference Evapotranspiration [mm day-1]
Rn Net radiation at crop surface [MJ m-1 day-1]
G Soil heat flux density [MJ m-2 day-1]
T Mean daily air temperature at 2 m height [°C]
U2 Wind speed at 2 m height [m s-1]
es Saturation vapor pressure [kPa]
ea Actual vapor pressure [kPa]
es-ea Saturation vapor pressure deficit [kPa]
∆ Slope of vapor pressure curve [kPa °C-1]
𝛄 Psychometric Constant [kPa °C-1].
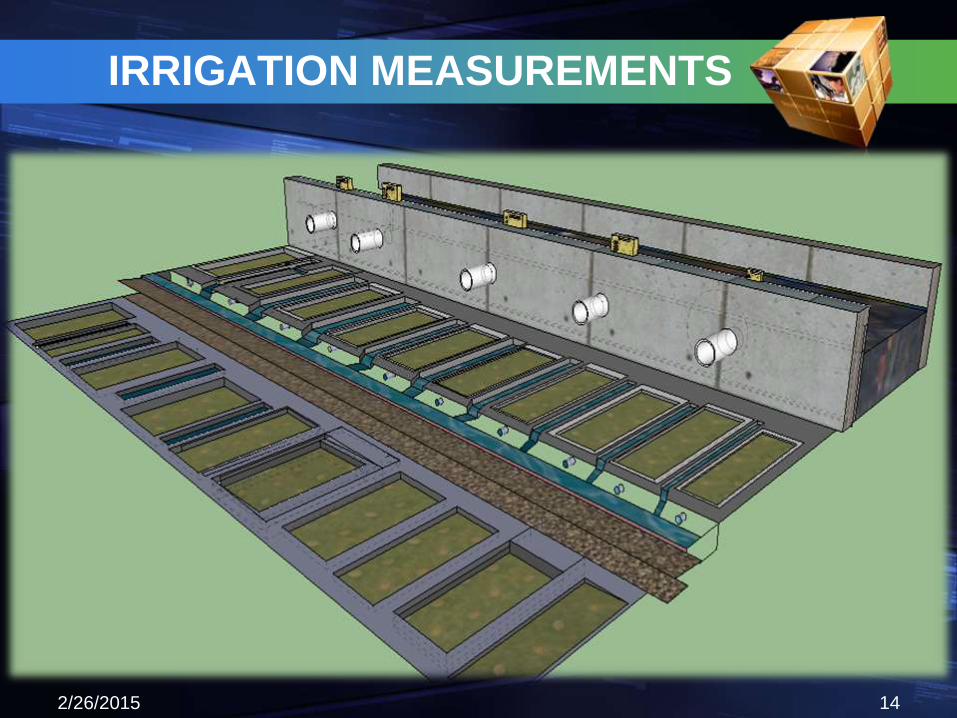
IRRIGATION MEASUREMENTS
2/26/2015 14
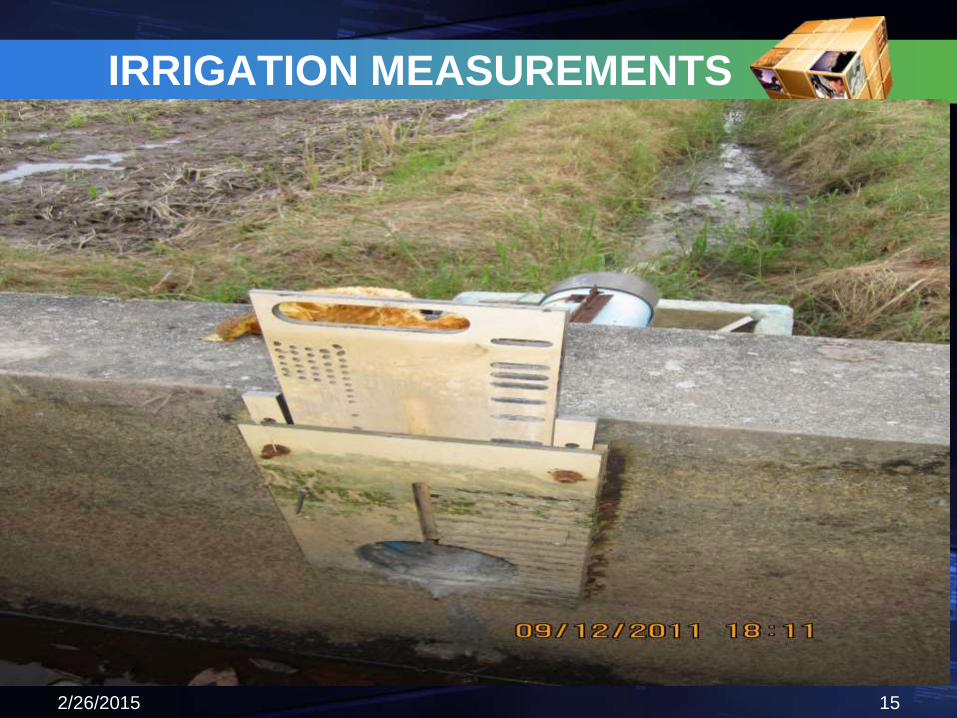
IRRIGATION MEASUREMENTS
2/26/2015 15
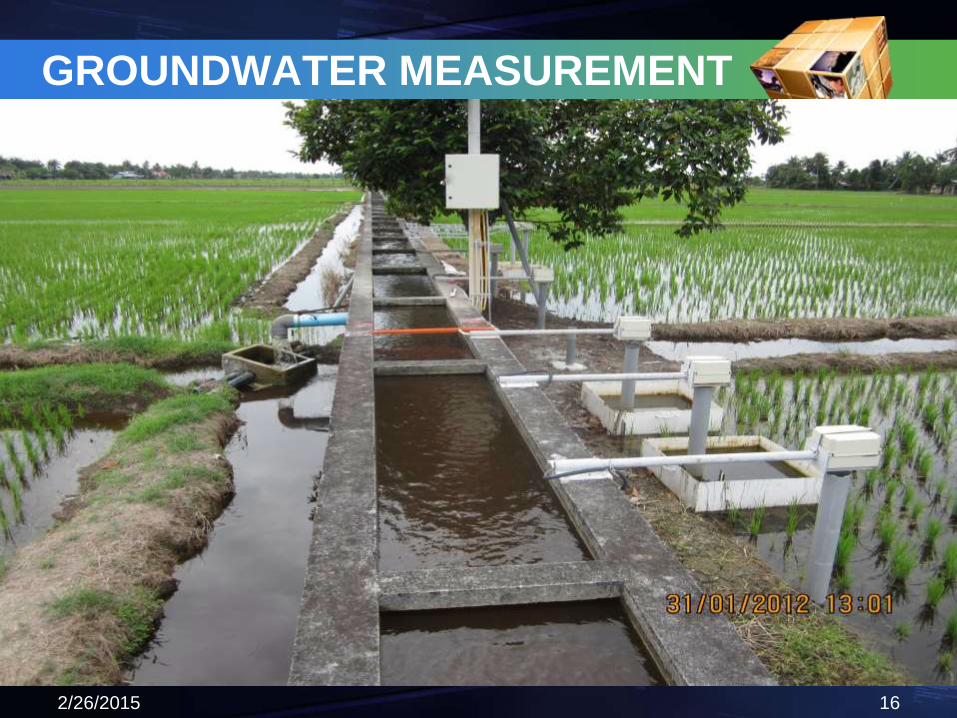
GROUNDWATER MEASUREMENT
2/26/2015 16
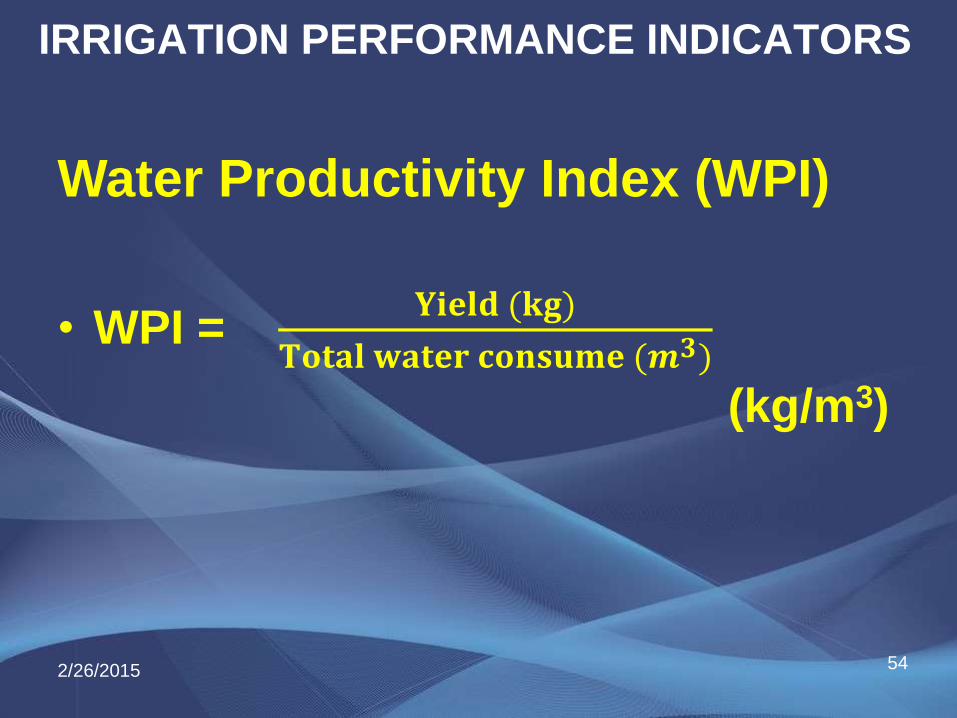
IRRIGATION PERFORMANCE INDICATORS
• WPI = 𝐘𝐢𝐞𝐥𝐝 (𝐤𝐠)
𝐓𝐨𝐭𝐚𝐥 𝐰𝐚𝐭𝐞𝐫 𝐜𝐨𝐧𝐬𝐮𝐦𝐞 (𝒎𝟑)
(kg/m3)
542/26/2015
Water Productivity Index (WPI)
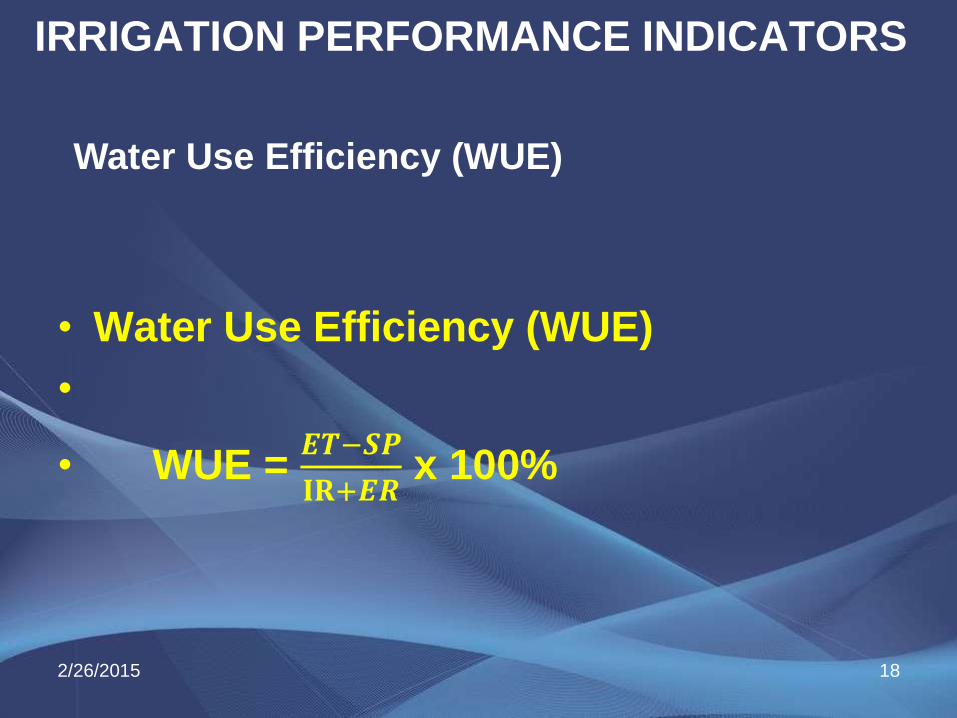
IRRIGATION PERFORMANCE INDICATORS
• Water Use Efficiency (WUE)
•
• WUE = 𝑬𝑻−𝑺𝑷
𝐈𝐑+𝑬𝑹x 100%
2/26/2015 18
Water Use Efficiency (WUE)
DEVELOPING WEBGIS DSS
2/26/2015 19
• Soil Water Assessment and Management
for paddies (SWAMP 2.0) is a WebGIS
decision Support system for irrigation
management. It is an online, interactive,
and real-time*.
• It was developed using ArcGIS for Server,
MS SQL Database and ArcGIS Viewer for
flex based on JavaScript API
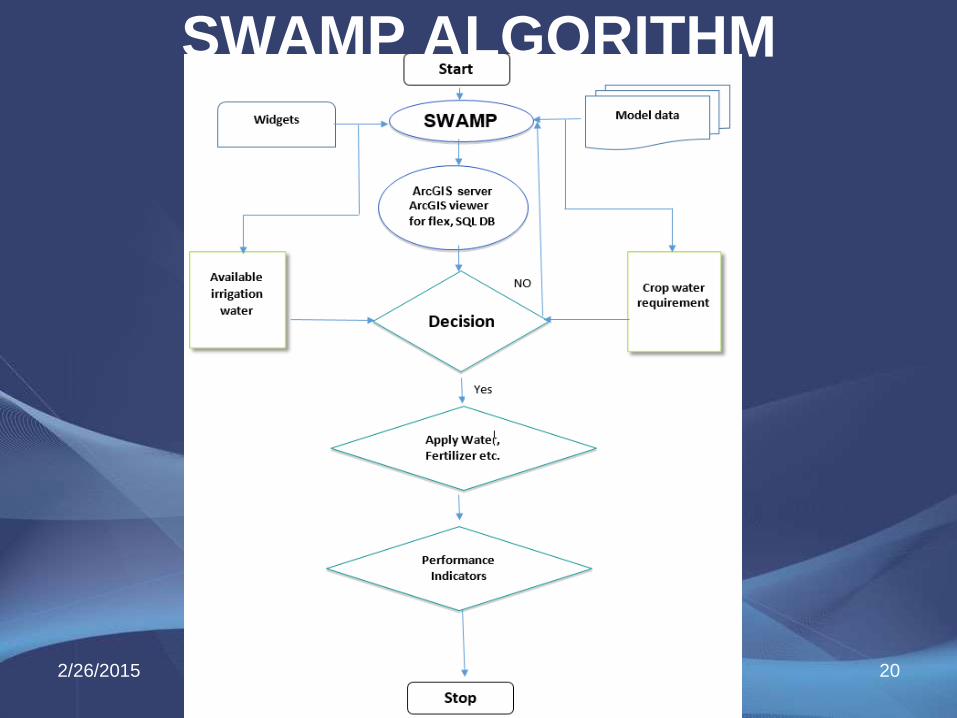
SWAMP ALGORITHM
2/26/2015 20
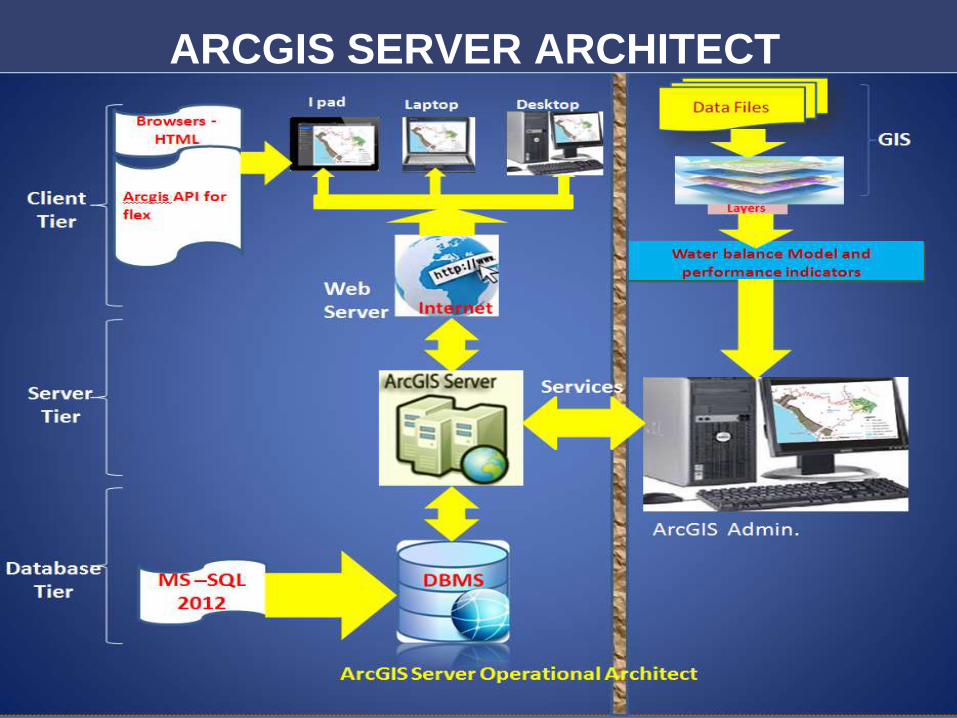
ARCGIS SERVER ARCHITECT
2/26/2015 21
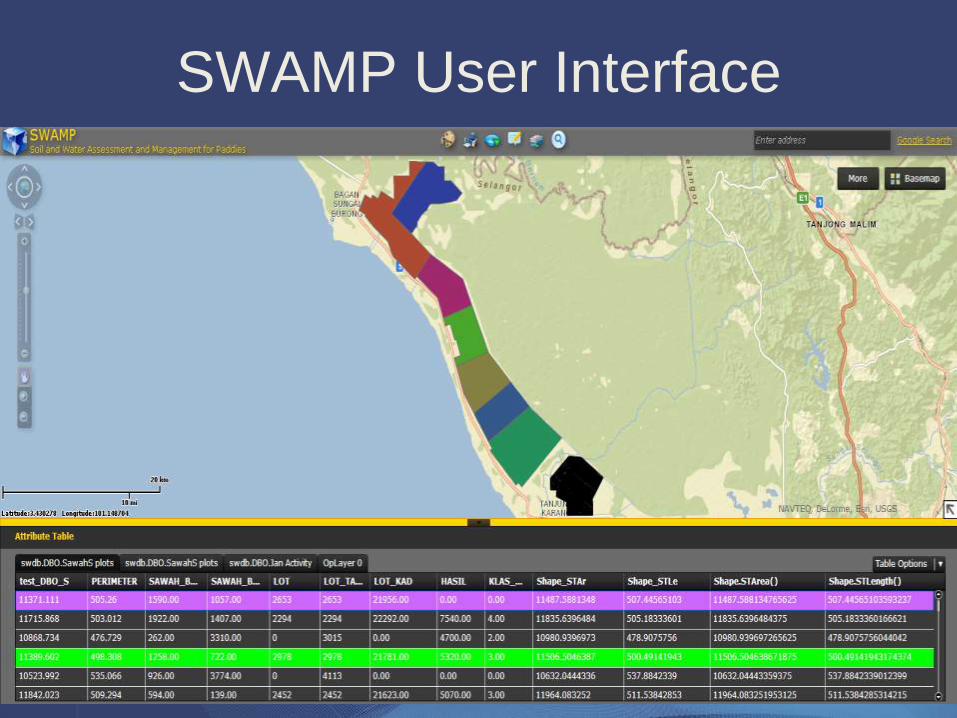
SWAMP User Interface
2/26/2015 22
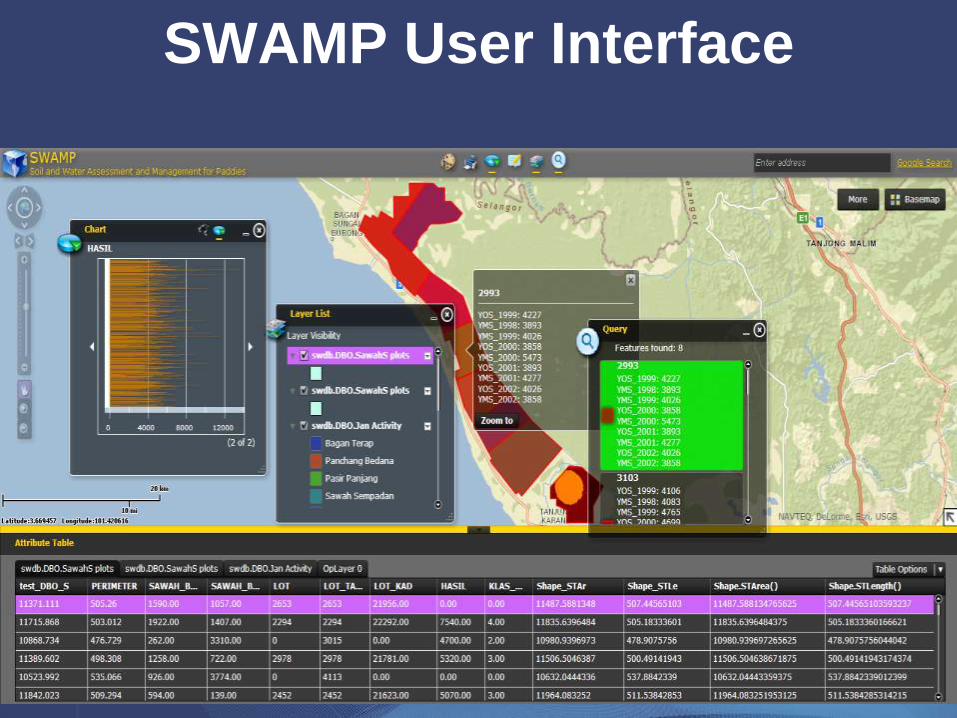
SWAMP User Interface
2/26/2015 23
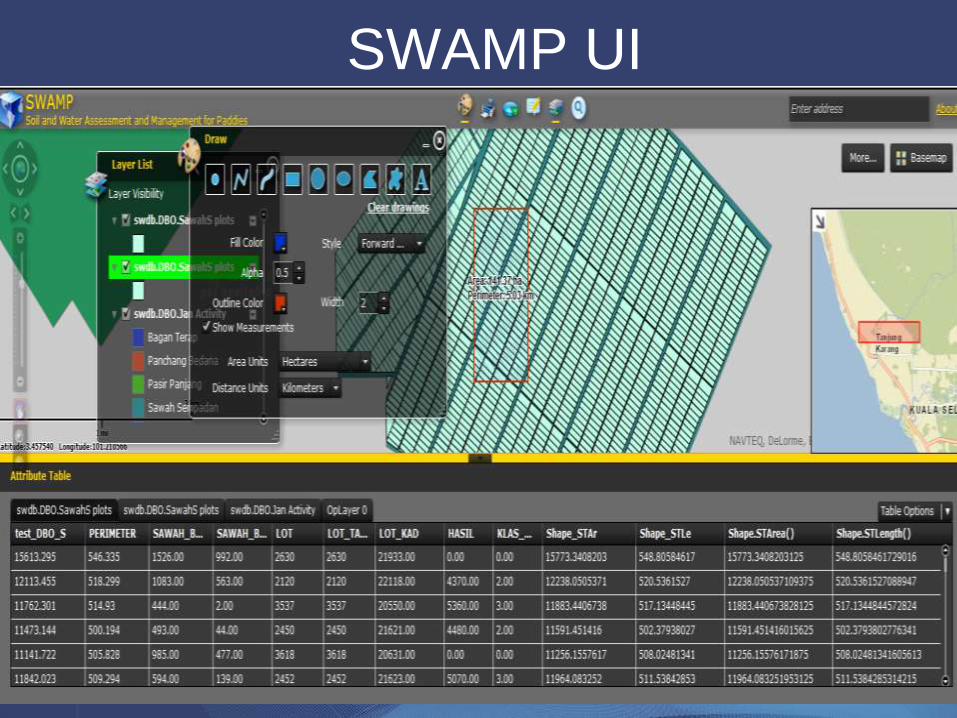
SWAMP UI
2/26/2015 24
Advantages and Uses of SWAMP
• SWAMP has many advantages amongst but not limited to:
• 1. Reach wider audience and stakeholders
• 2. All farm Information can be spread instantly
• 3. Cost effective
• 3. Reduce software installation, support and maintenance
• 4. Need not to be GIS professional to use it
• 5. Flexible for DBMS integration and presentation
• 6. Easy to use and maintain compatibility with the future development
• 7. Cut software costs
2/26/2015 25
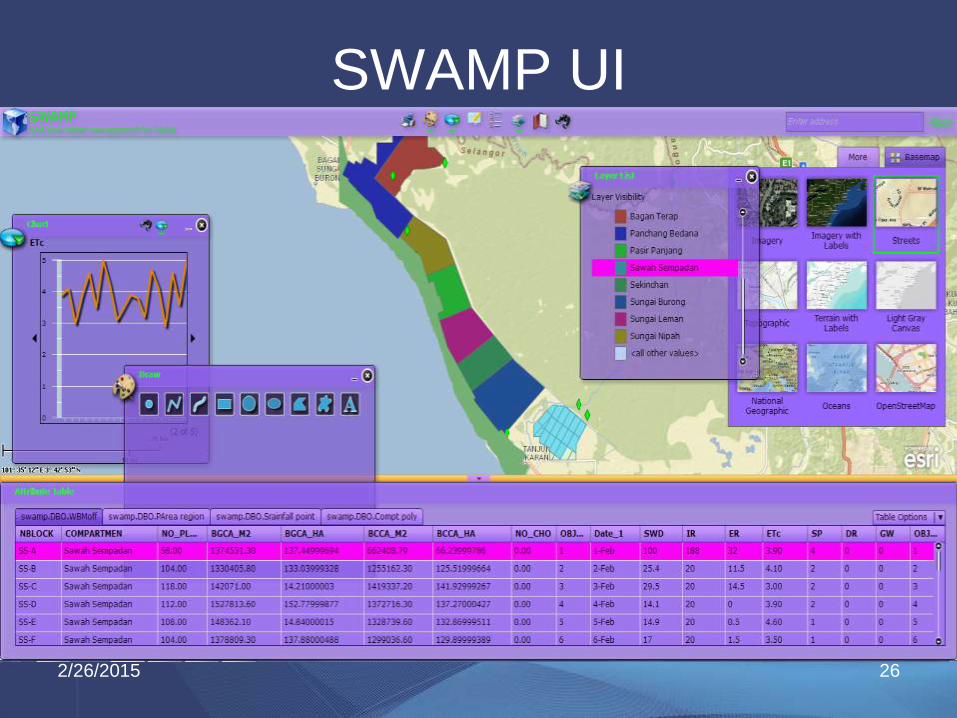
SWAMP UI
2/26/2015 26
Operations of SWAMP
• Once the web application loads, the Attribute
Table widget checks for any feature layer
feature(s) in the current extent and populates
the attribute table with its feature(s). Aside from
providing a tabular display of the layer's data,
the features can be selected, deselected, and
zoomed-to by interacting with the attribute table.
• If these feature layers are editable, the
corresponding feature attributes will also be
editable. In addition, the fields can be sorted by
clicking on its heading
2/26/2015 27
Operations of SWAMP Contd.
• Paddy water balance model can be displayed
and scheduling can be based on field demand
• Analysis and editing can be carried out online
• Area and length measurement can be done
easily and precisely
• Farm Activities can be monitored online
• Yields and yield components can be viewed in
the form of charts and tables.
2/26/2015 28
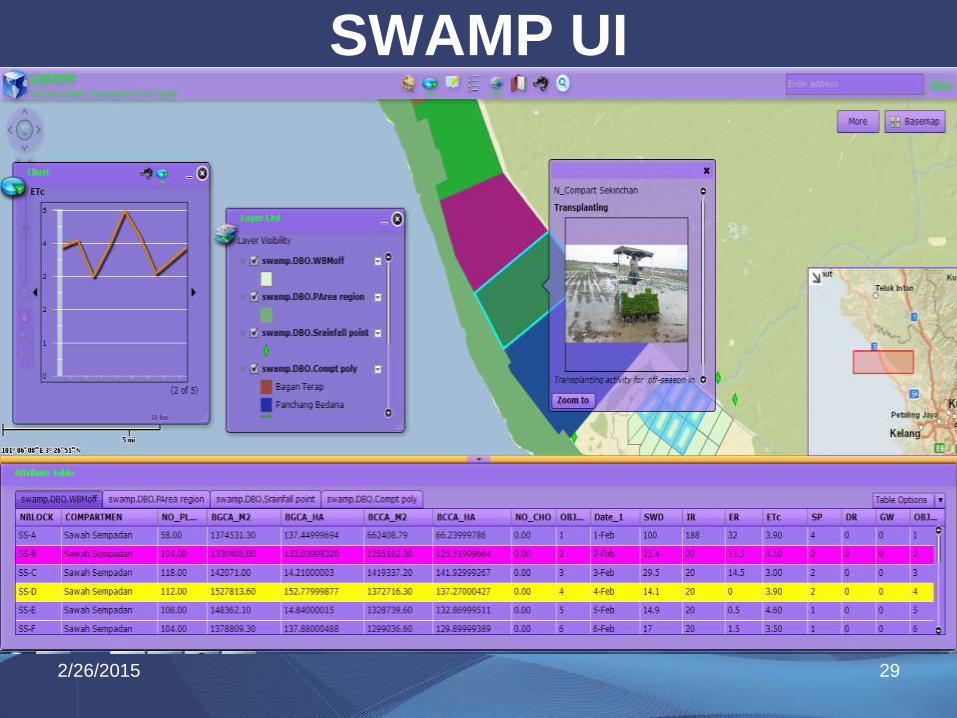
SWAMP UI
2/26/2015 29

LOGO
THANK YOU !