Embed Size (px)
Citation preview
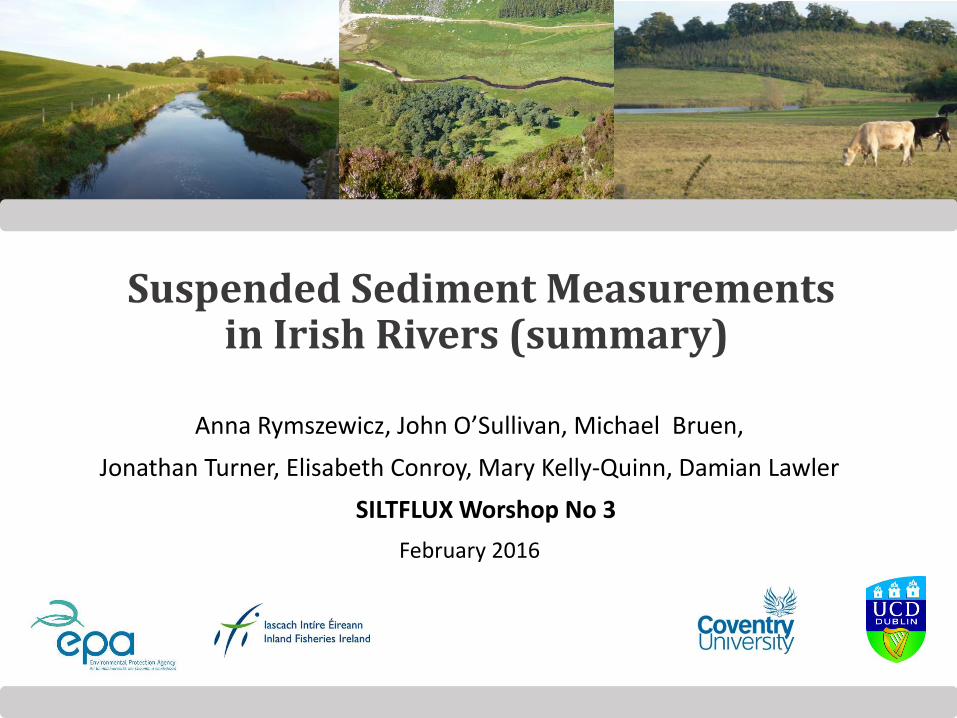
Suspended Sediment Measurements in Irish Rivers (summary)
Anna Rymszewicz, John O’Sullivan, Michael Bruen,
Jonathan Turner, Elisabeth Conroy, Mary Kelly-Quinn, Damian Lawler
SILTFLUX Worshop No 3
February 2016
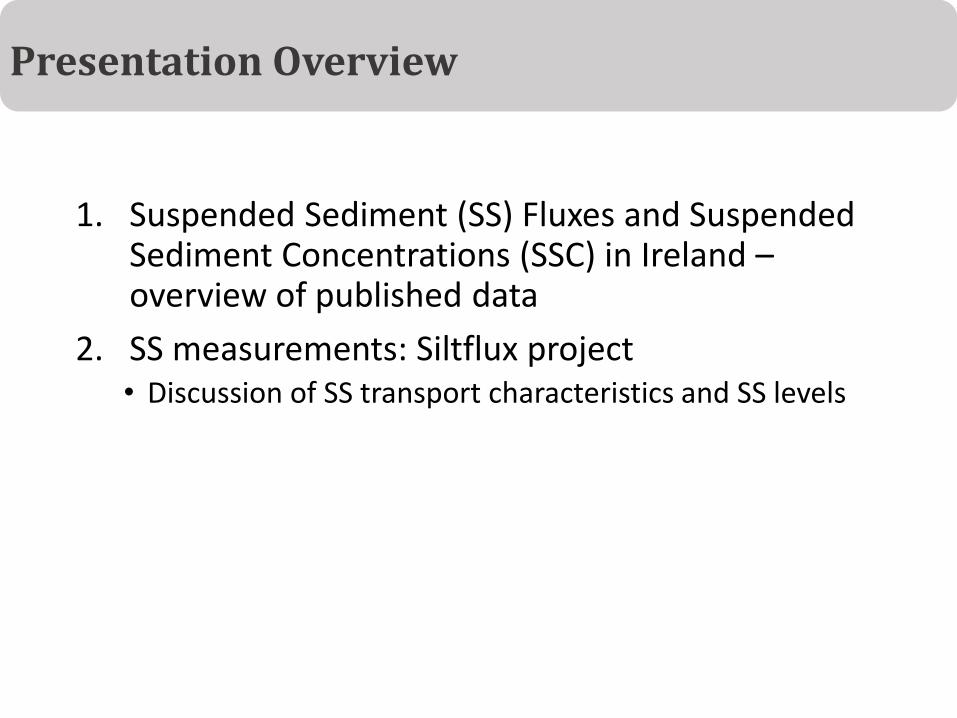
1. Suspended Sediment (SS) Fluxes and Suspended Sediment Concentrations (SSC) in Ireland –overview of published data
2. SS measurements: Siltflux project• Discussion of SS transport characteristics and SS levels
Presentation Overview
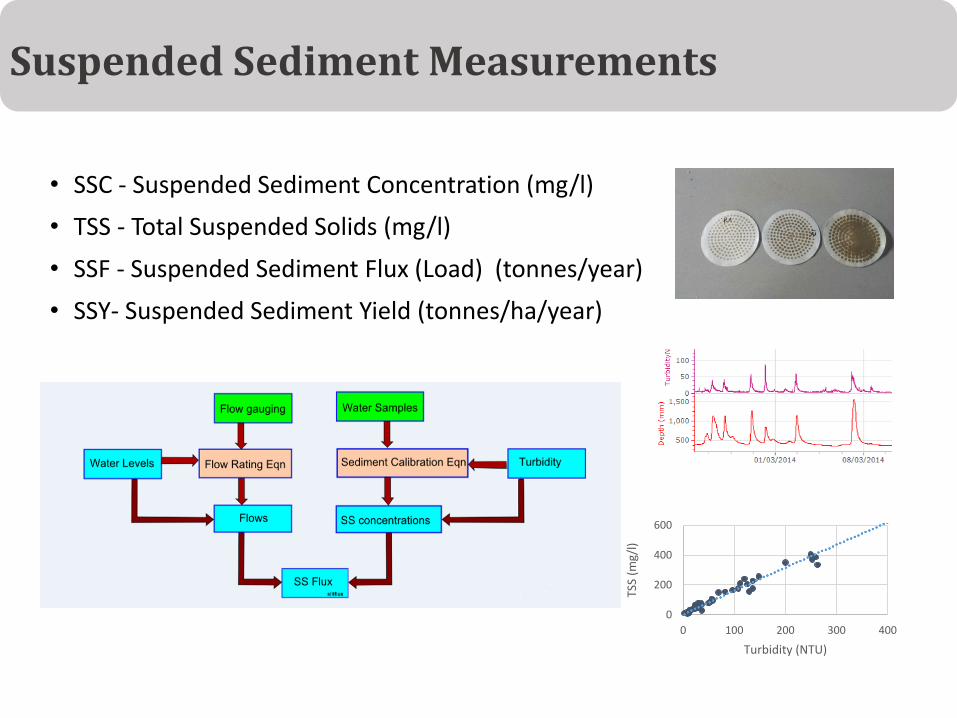
• SSC - Suspended Sediment Concentration (mg/l)
• TSS - Total Suspended Solids (mg/l)
• SSF - Suspended Sediment Flux (Load) (tonnes/year)
• SSY- Suspended Sediment Yield (tonnes/ha/year)
Suspended Sediment Measurements
0
200
400
600
0 100 200 300 400TS
S (m
g/l)
Turbidity (NTU)
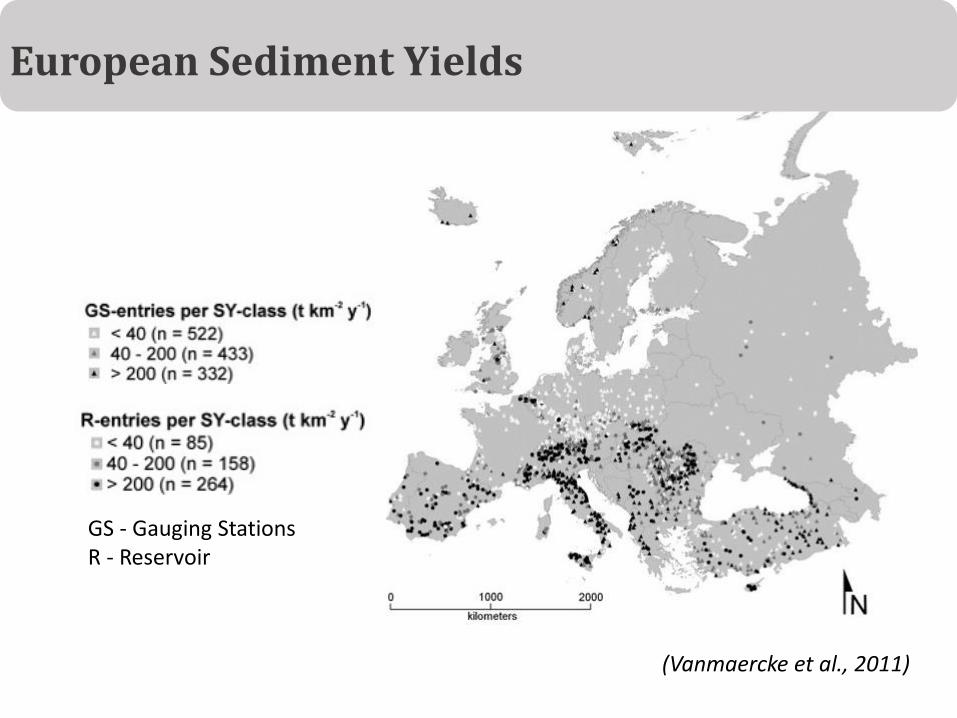
(Vanmaercke et al., 2011)
European Sediment Yields
GS - Gauging StationsR - Reservoir
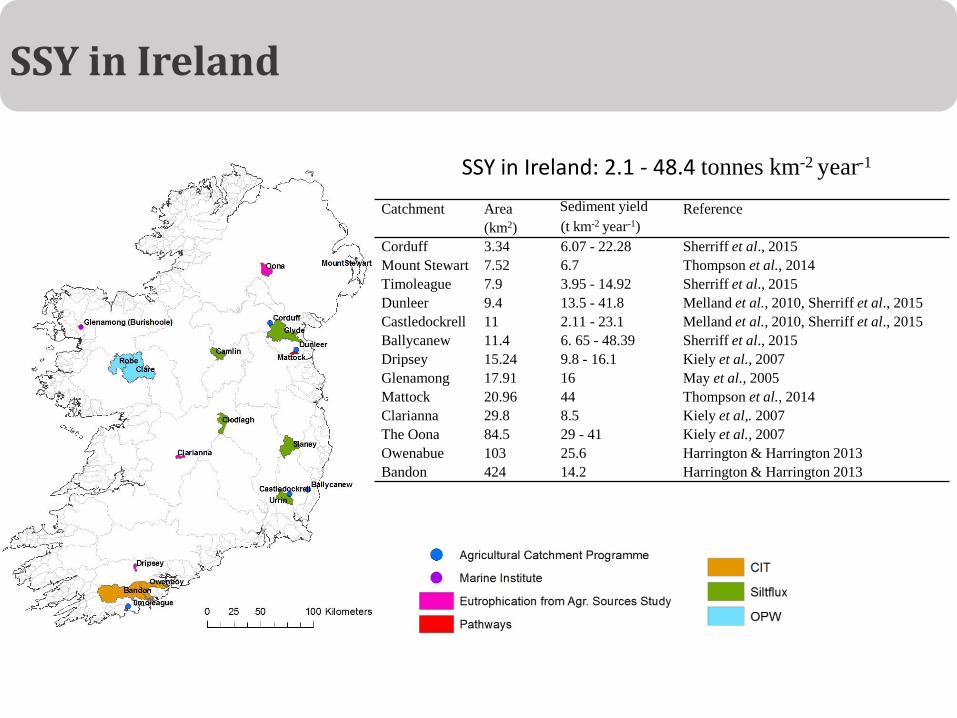
SSY in Ireland: 2.1 - 48.4 tonnes km-2 year-1
SSY in Ireland
Catchment Area
(km2)
Sediment yield
(t km-2 year-1)
Reference
Corduff 3.34 6.07 - 22.28 Sherriff et al., 2015
Mount Stewart 7.52 6.7 Thompson et al., 2014
Timoleague 7.9 3.95 - 14.92 Sherriff et al., 2015
Dunleer 9.4 13.5 - 41.8 Melland et al., 2010, Sherriff et al., 2015
Castledockrell 11 2.11 - 23.1 Melland et al., 2010, Sherriff et al., 2015
Ballycanew 11.4 6. 65 - 48.39 Sherriff et al., 2015
Dripsey 15.24 9.8 - 16.1 Kiely et al., 2007
Glenamong 17.91 16 May et al., 2005
Mattock 20.96 44 Thompson et al., 2014
Clarianna 29.8 8.5 Kiely et al,. 2007
The Oona 84.5 29 - 41 Kiely et al., 2007
Owenabue 103 25.6 Harrington & Harrington 2013
Bandon 424 14.2 Harrington & Harrington 2013
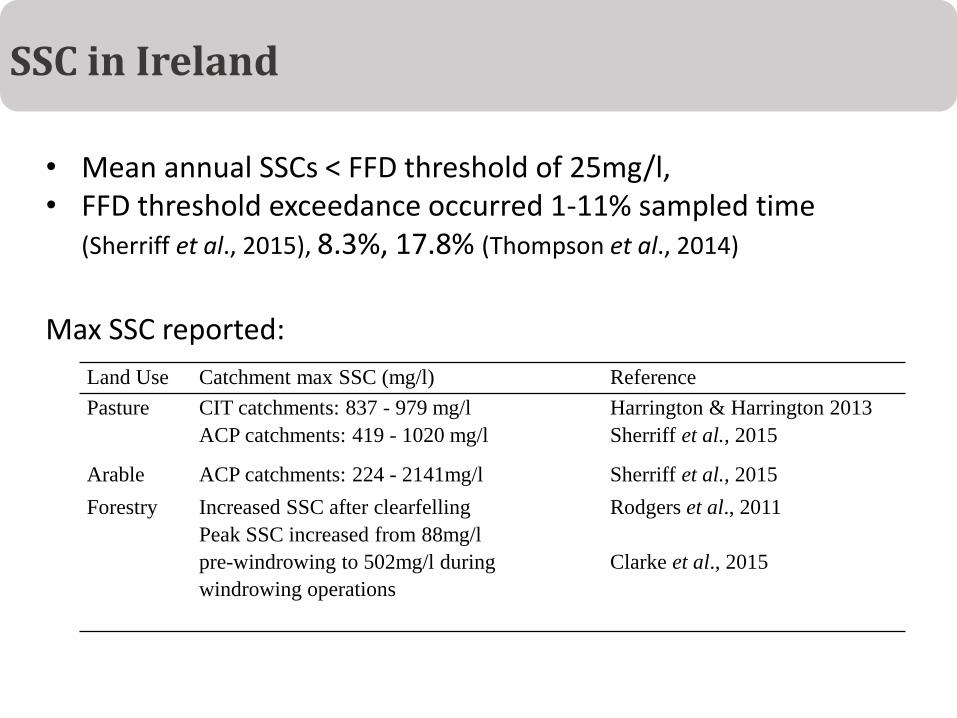
Max SSC reported:
SSC in Ireland
• Mean annual SSCs < FFD threshold of 25mg/l, • FFD threshold exceedance occurred 1-11% sampled time
(Sherriff et al., 2015), 8.3%, 17.8% (Thompson et al., 2014)
Land Use Catchment max SSC (mg/l) Reference
Pasture CIT catchments: 837 - 979 mg/l
ACP catchments: 419 - 1020 mg/l
Harrington & Harrington 2013
Sherriff et al., 2015
Arable ACP catchments: 224 - 2141mg/l Sherriff et al., 2015
Forestry Increased SSC after clearfelling
Peak SSC increased from 88mg/l
pre-windrowing to 502mg/l during
windrowing operations
Rodgers et al., 2011
Clarke et al., 2015
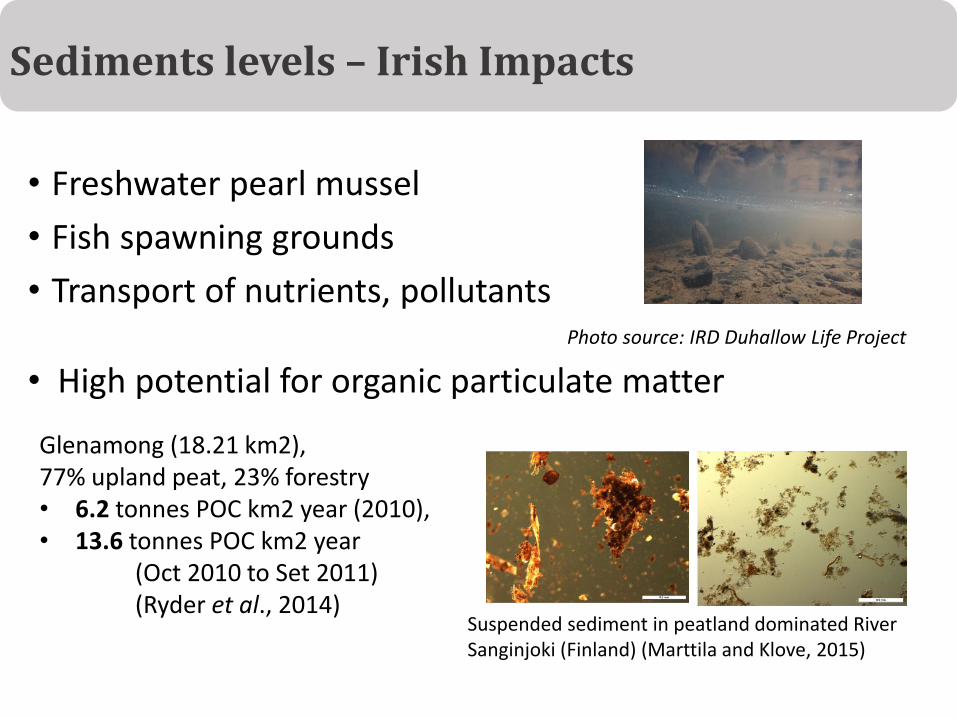
• Freshwater pearl mussel
• Fish spawning grounds
• Transport of nutrients, pollutants
Sediments levels – Irish Impacts
Suspended sediment in peatland dominated River Sanginjoki (Finland) (Marttila and Klove, 2015)
Glenamong (18.21 km2), 77% upland peat, 23% forestry• 6.2 tonnes POC km2 year (2010), • 13.6 tonnes POC km2 year
(Oct 2010 to Set 2011) (Ryder et al., 2014)
Photo source: IRD Duhallow Life Project
• High potential for organic particulate matter
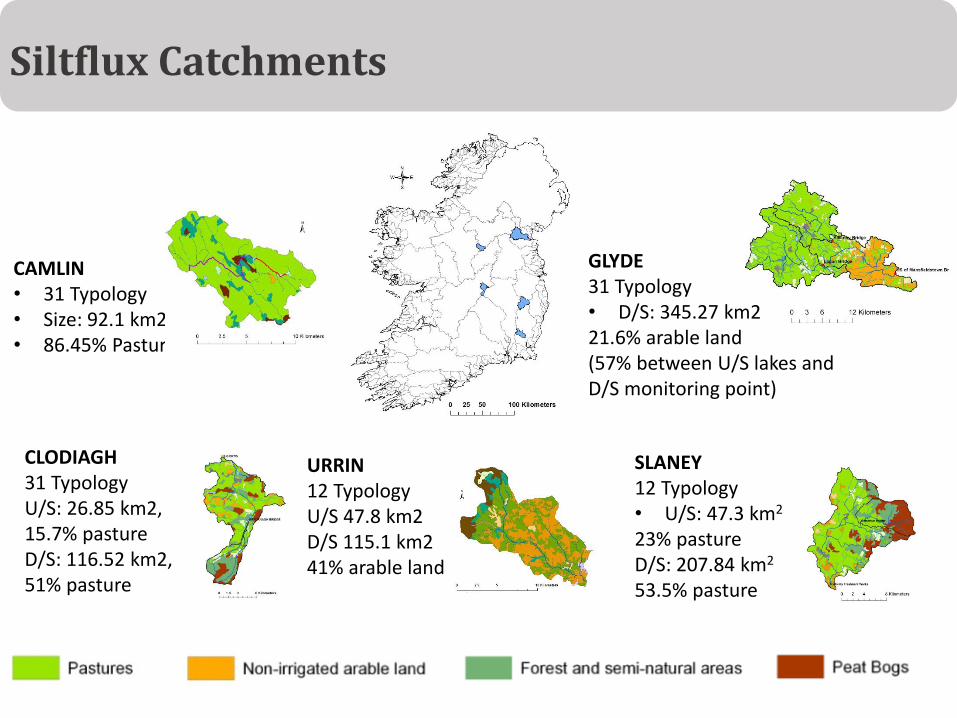
Siltflux Catchments
CAMLIN• 31 Typology• Size: 92.1 km2• 86.45% Pasture
SLANEY12 Typology• U/S: 47.3 km2
23% pastureD/S: 207.84 km2
53.5% pasture
GLYDE31 Typology• D/S: 345.27 km221.6% arable land (57% between U/S lakes and D/S monitoring point)
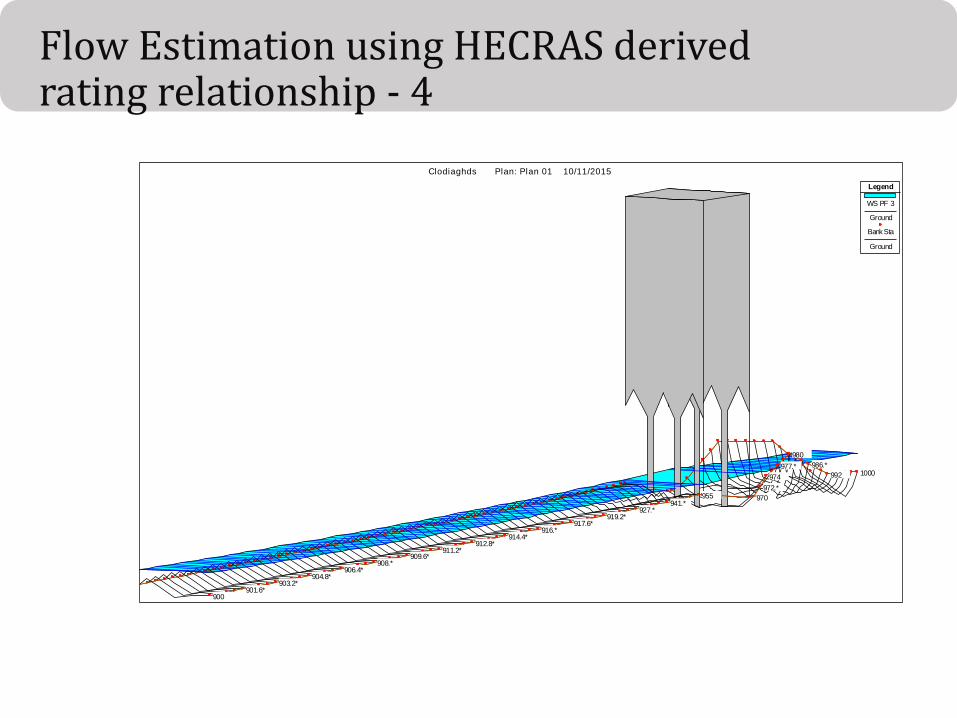
CLODIAGH31 TypologyU/S: 26.85 km2, 15.7% pastureD/S: 116.52 km2, 51% pasture
URRIN12 TypologyU/S 47.8 km2D/S 115.1 km241% arable land
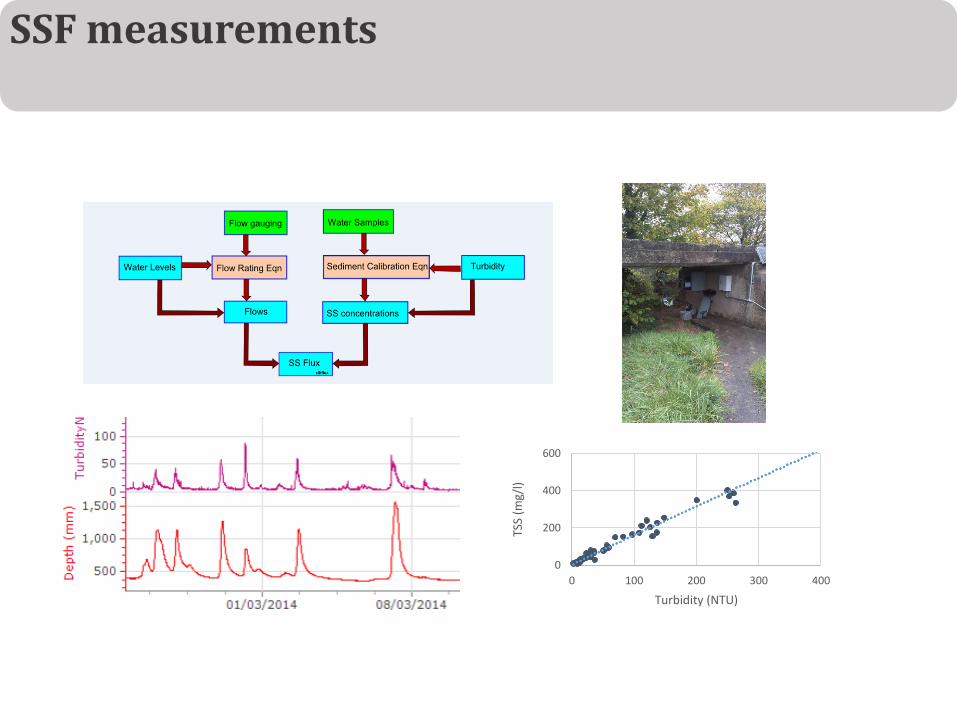
SSF measurements
0
200
400
600
0 100 200 300 400
TSS
(mg/
l)
Turbidity (NTU)
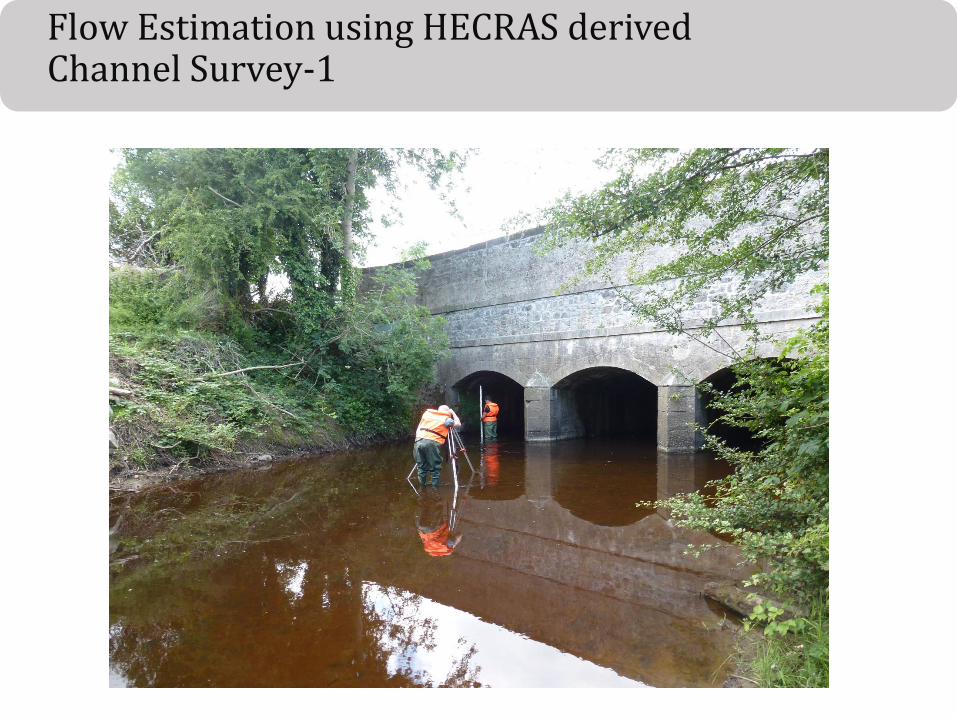
Flow Estimation using HECRAS derivedChannel Survey-1
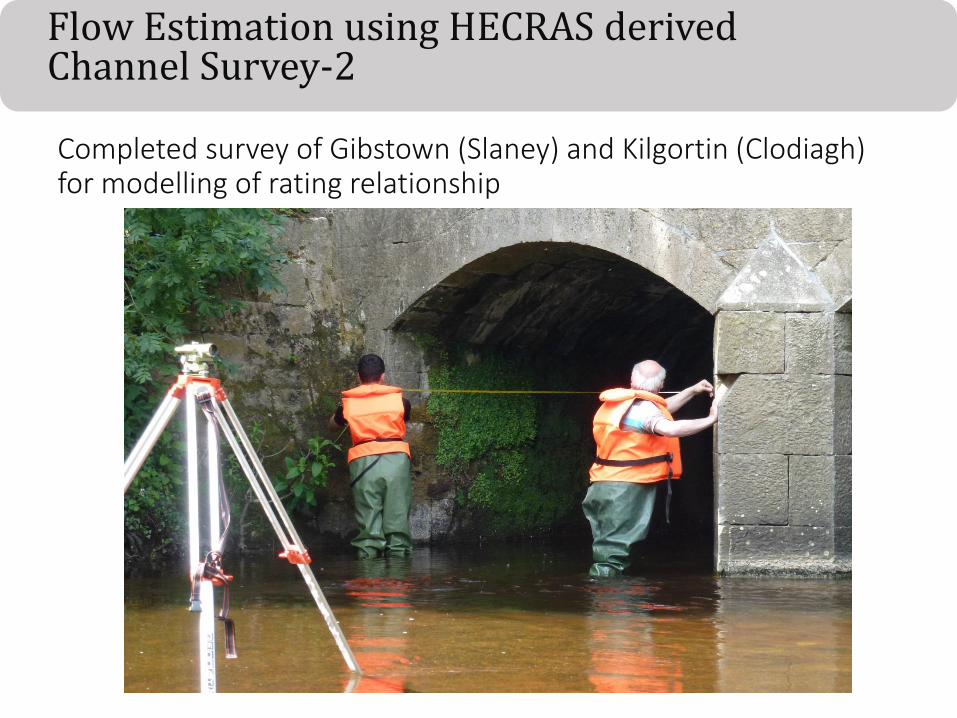
Completed survey of Gibstown (Slaney) and Kilgortin (Clodiagh) for modelling of rating relationship
Flow Estimation using HECRAS derivedChannel Survey-2
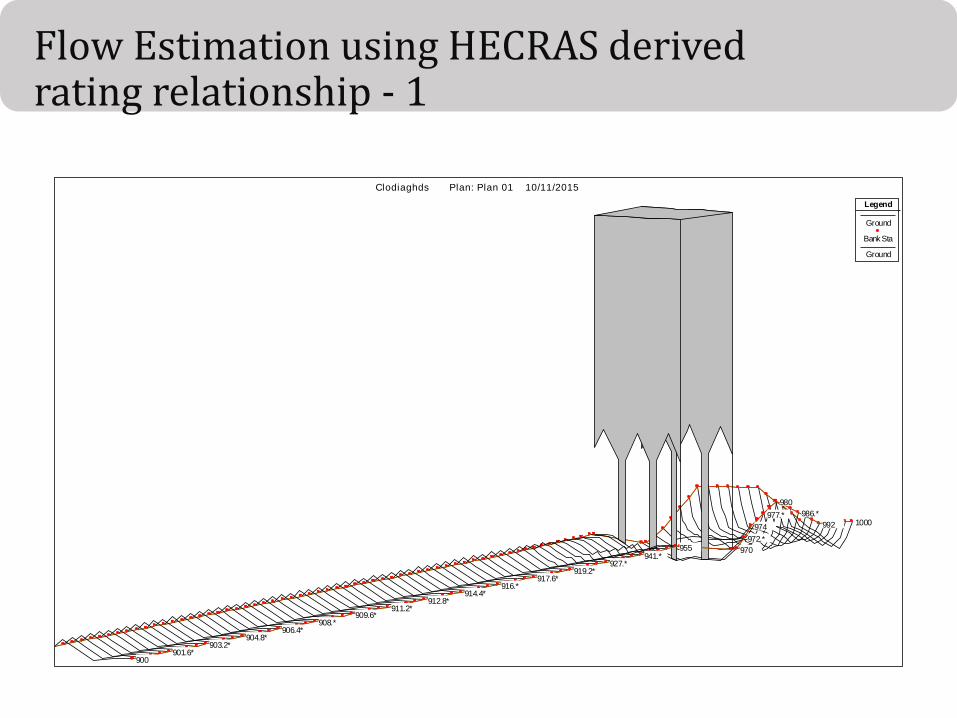
Flow Estimation using HECRAS derivedrating relationship - 1
1000 992
986.*
980
977.*
974
972.*
970 955 941.*
927.* 919.2*
917.6* 916.*
914.4* 912.8*
911.2* 909.6*
908.* 906.4*
904.8* 903.2*
901.6* 900
Clodiaghds Plan: Plan 01 10/11/2015
Legend
Ground
Bank Sta
Ground
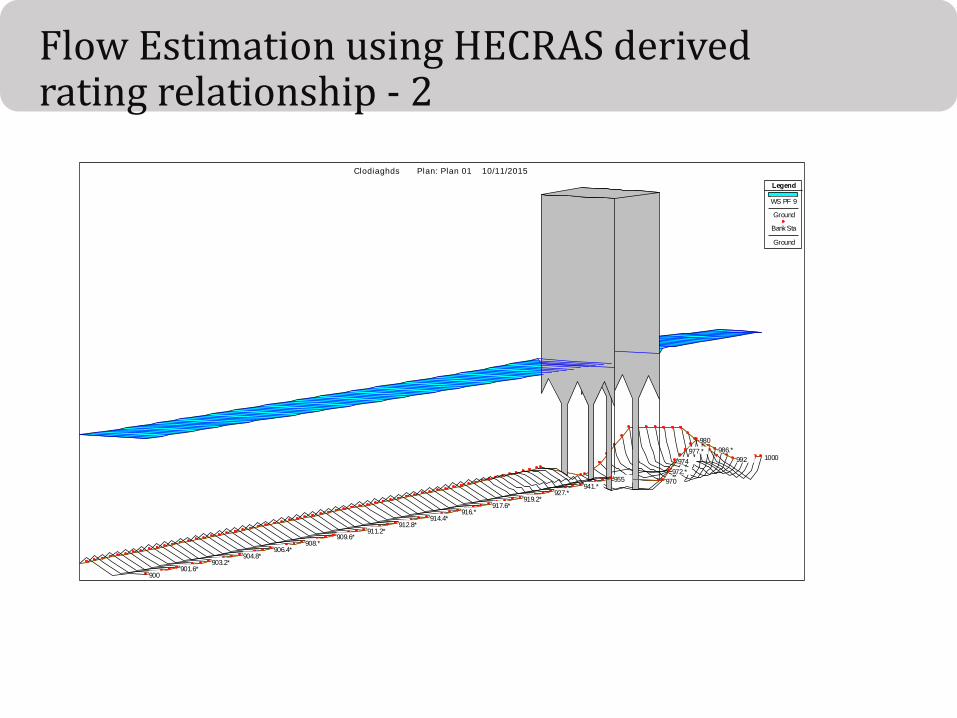
Flow Estimation using HECRAS derivedrating relationship - 2
1000 992
986.*
980
977.*
974
972.*
970 955 941.*
927.* 919.2*
917.6* 916.*
914.4* 912.8*
911.2* 909.6*
908.* 906.4*
904.8* 903.2*
901.6* 900
Clodiaghds Plan: Plan 01 10/11/2015
Legend
WS PF 9
Ground
Bank Sta
Ground
1000 992
986.*
980
977.*
974
972.*
970 955 941.*
927.* 919.2*
917.6* 916.*
914.4* 912.8*
911.2* 909.6*
908.* 906.4*
904.8* 903.2*
901.6* 900
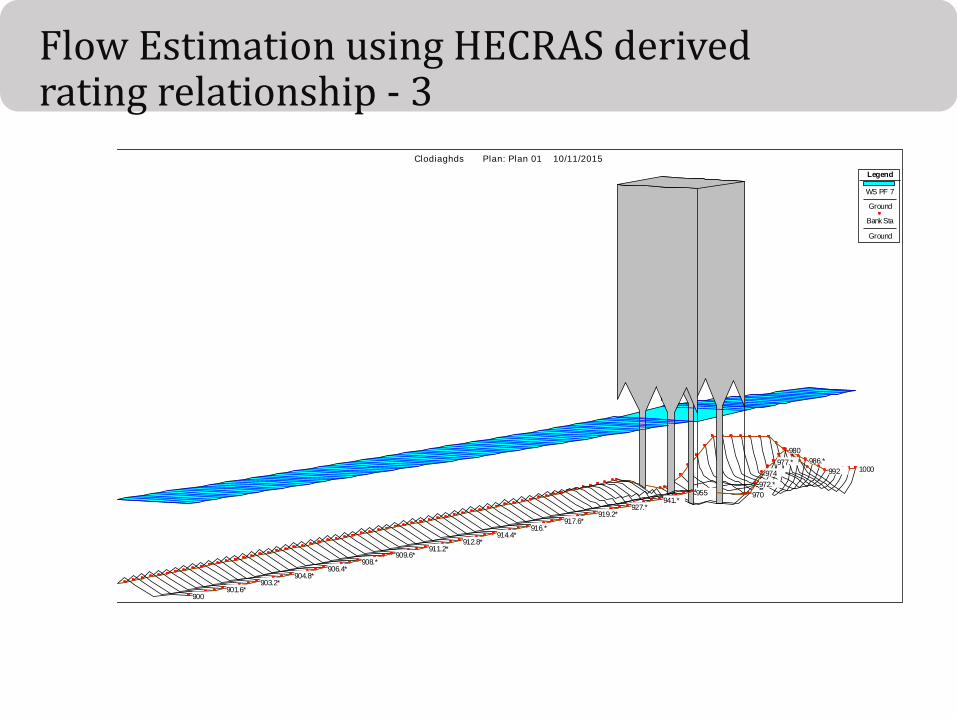
Clodiaghds Plan: Plan 01 10/11/2015
Legend
WS PF 7
Ground
Bank Sta
Ground
Flow Estimation using HECRAS derivedrating relationship - 3
1000 992
986.*
980
977.*
974
972.*
970 955 941.*
927.* 919.2*
917.6* 916.*
914.4* 912.8*
911.2* 909.6*
908.* 906.4*
904.8* 903.2*
901.6* 900
Clodiaghds Plan: Plan 01 10/11/2015
Legend
WS PF 3
Ground
Bank Sta
Ground
Flow Estimation using HECRAS derivedrating relationship - 4
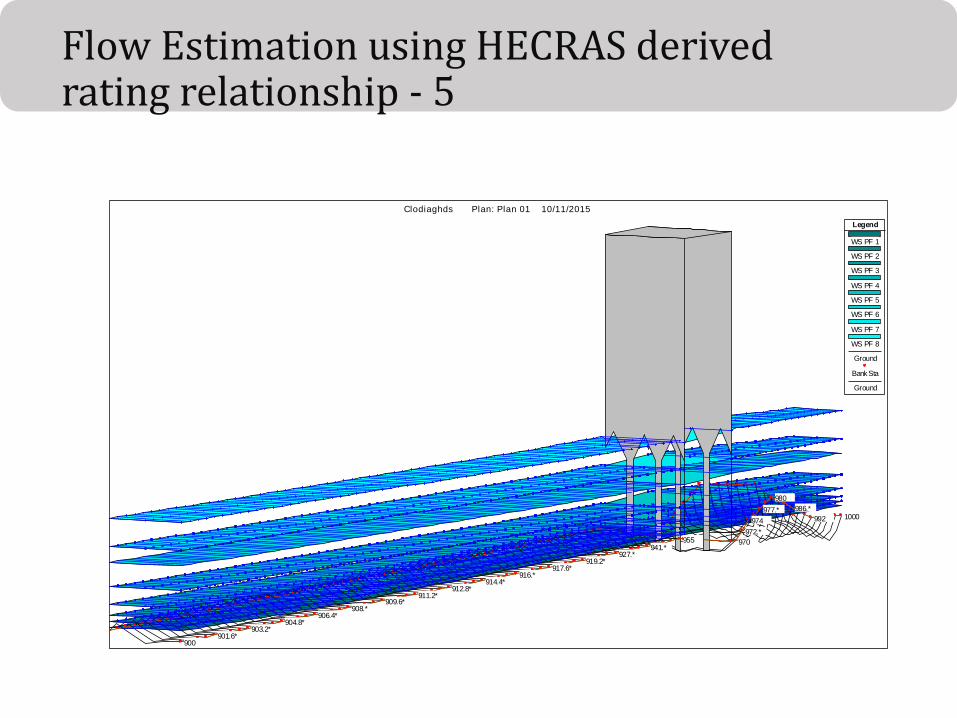
Flow Estimation using HECRAS derivedrating relationship - 5
1000 992
986.*
980
977.*
974
972.*
970 955 941.*
927.* 919.2*
917.6* 916.*
914.4* 912.8*
911.2* 909.6*
908.* 906.4*
904.8* 903.2*
901.6* 900
Clodiaghds Plan: Plan 01 10/11/2015
Legend
WS PF 1
WS PF 2
WS PF 3
WS PF 4
WS PF 5
WS PF 6
WS PF 7
WS PF 8
Ground
Bank Sta
Ground
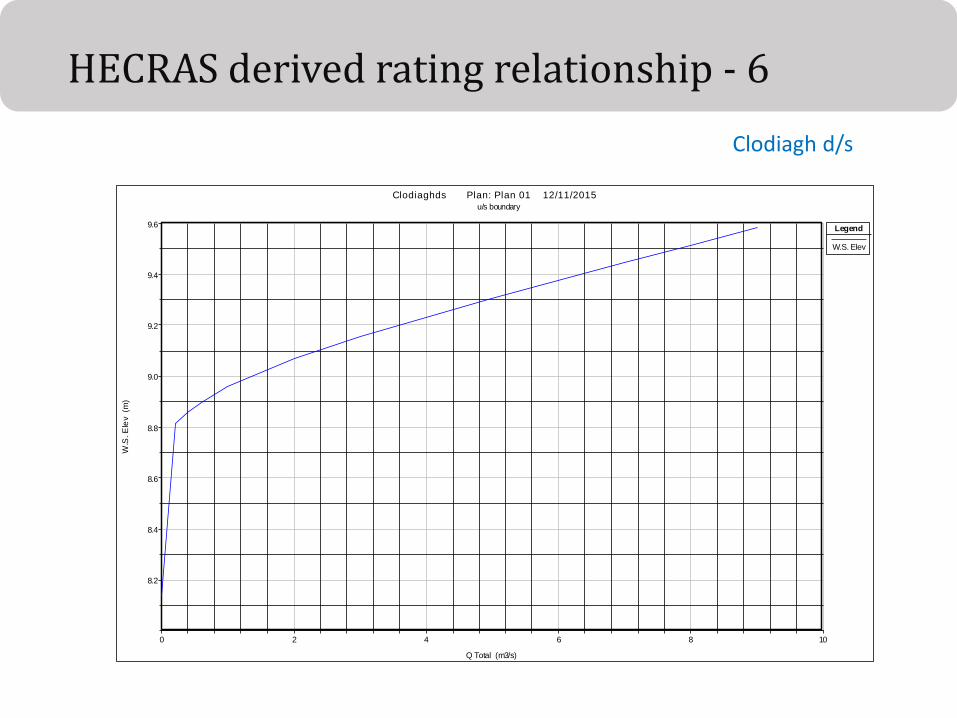
HECRAS derived rating relationship - 6
0 2 4 6 8 10
8.2
8.4
8.6
8.8
9.0
9.2
9.4
9.6
Clodiaghds Plan: Plan 01 12/11/2015 u/s boundary
Q Total (m3/s)
W.S
. E
lev
(m
)
Legend
W.S. Elev
Clodiagh d/s
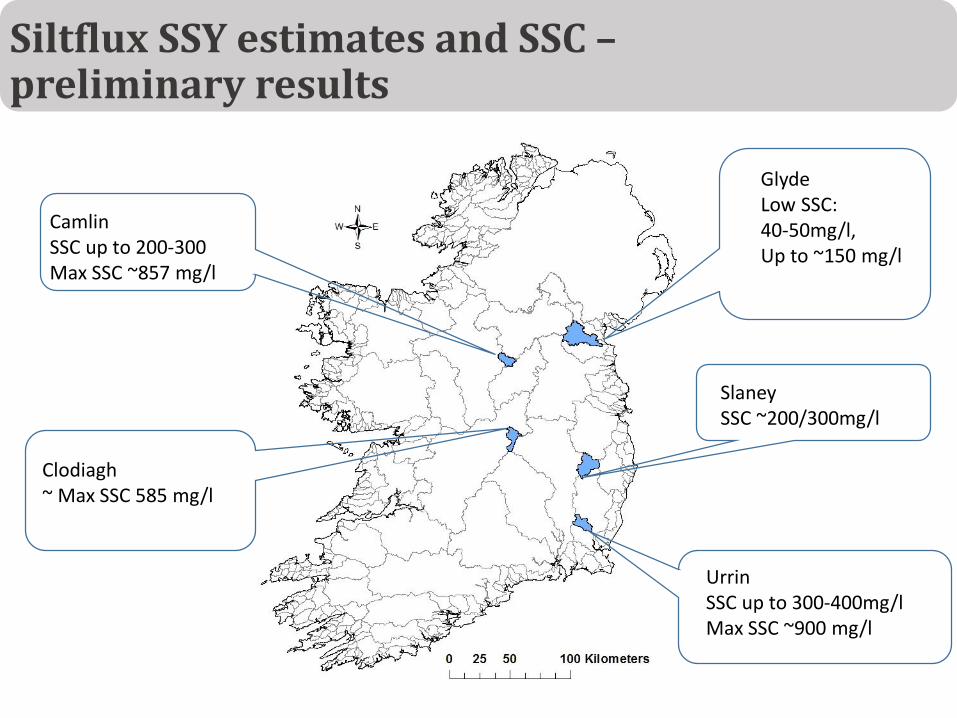
Siltflux SSY estimates and SSC –preliminary results
CamlinSSC up to 200-300Max SSC ~857 mg/l
GlydeLow SSC: 40-50mg/l,Up to ~150 mg/l
SlaneySSC ~200/300mg/l
Clodiagh~ Max SSC 585 mg/l
UrrinSSC up to 300-400mg/lMax SSC ~900 mg/l
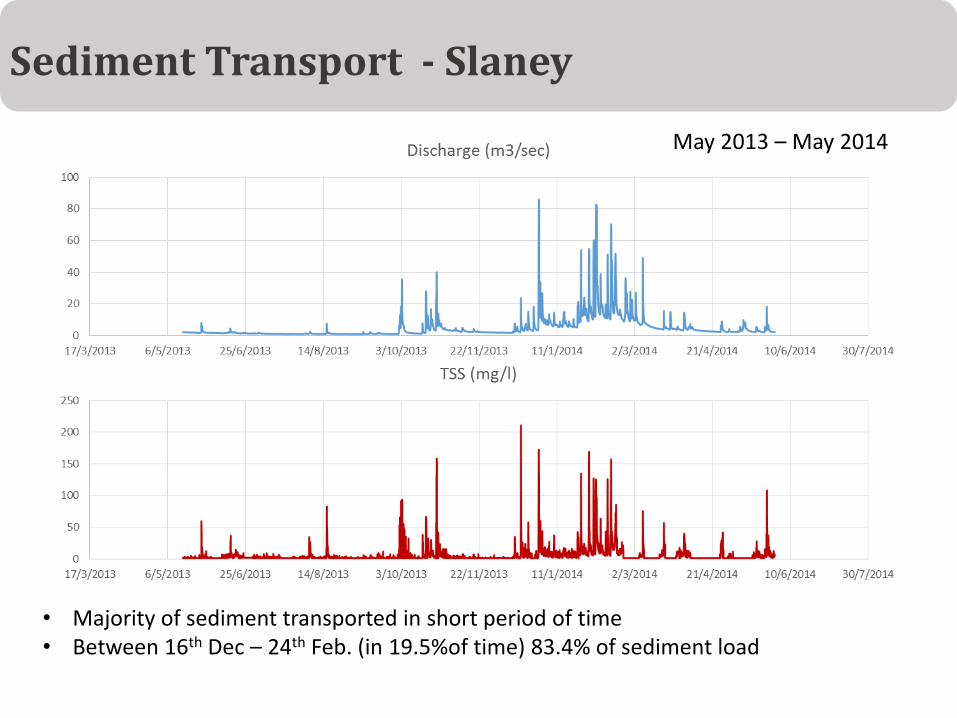
Sediment Transport - Slaney
• Majority of sediment transported in short period of time• Between 16th Dec – 24th Feb. (in 19.5%of time) 83.4% of sediment load
May 2013 – May 2014
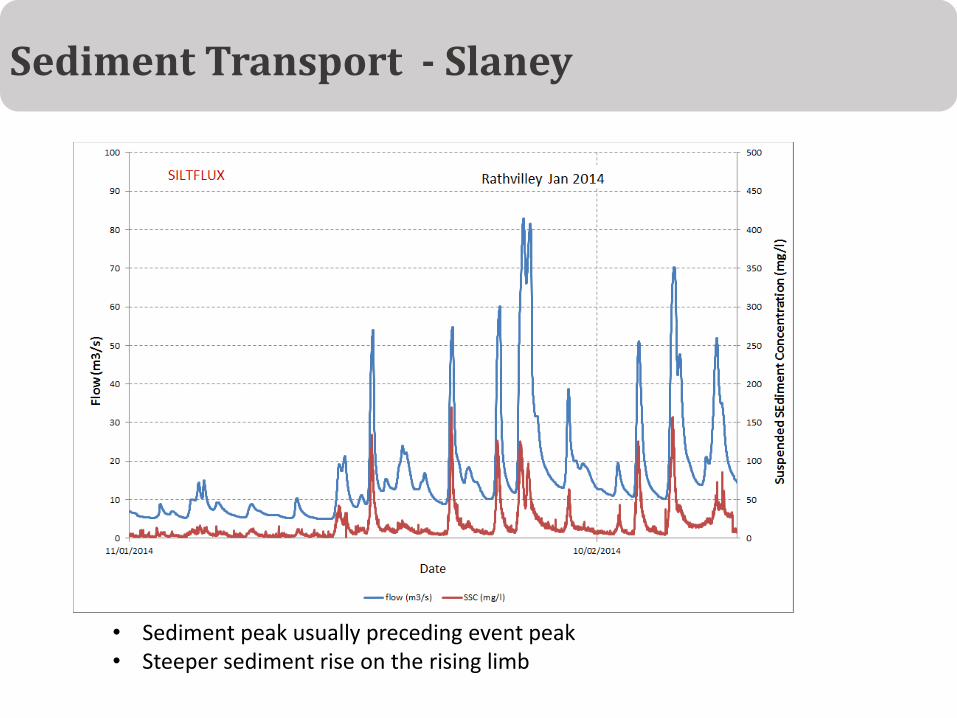
Sediment Transport - Slaney
• Sediment peak usually preceding event peak• Steeper sediment rise on the rising limb
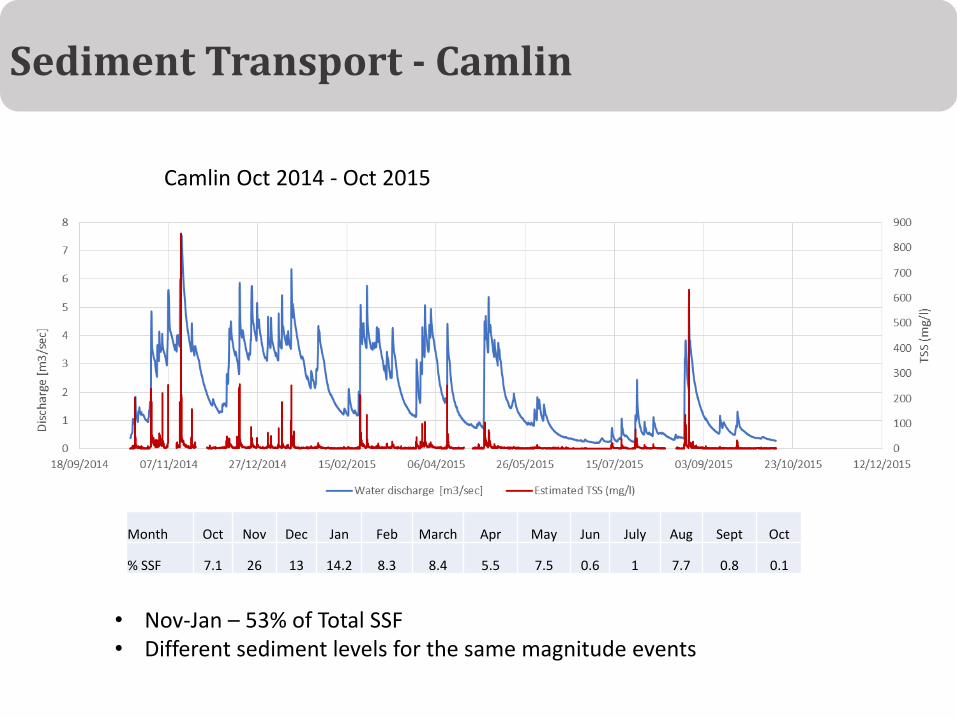
Sediment Transport - Camlin
Camlin Oct 2014 - Oct 2015
• Nov-Jan – 53% of Total SSF• Different sediment levels for the same magnitude events
Month Oct Nov Dec Jan Feb March Apr May Jun July Aug Sept Oct
% SSF 7.1 26 13 14.2 8.3 8.4 5.5 7.5 0.6 1 7.7 0.8 0.1
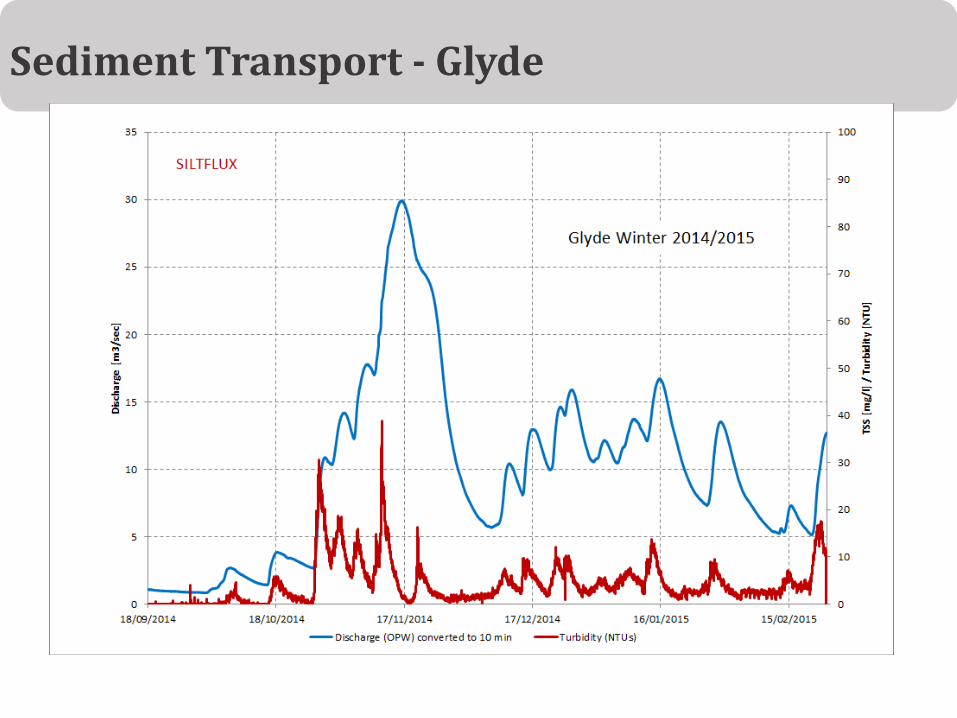
Sediment Transport - Glyde
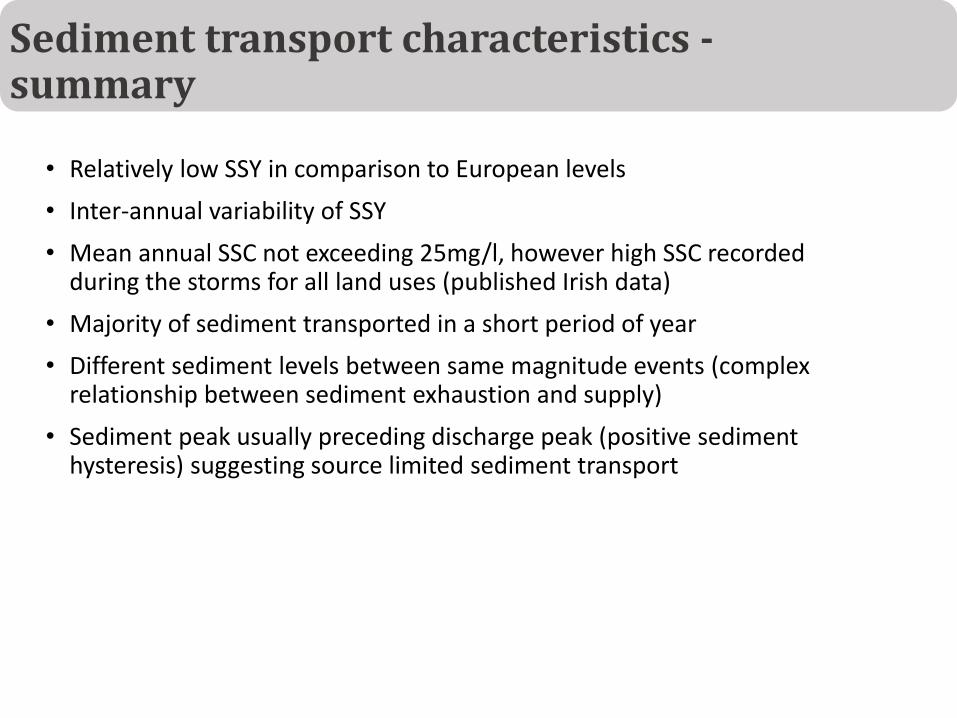
• Relatively low SSY in comparison to European levels
• Inter-annual variability of SSY
• Mean annual SSC not exceeding 25mg/l, however high SSC recorded during the storms for all land uses (published Irish data)
• Majority of sediment transported in a short period of year
• Different sediment levels between same magnitude events (complex relationship between sediment exhaustion and supply)
• Sediment peak usually preceding discharge peak (positive sediment hysteresis) suggesting source limited sediment transport
Sediment transport characteristics -summary
• Clarke, J., et al. (2015) The effect of forest windrowing on physico-chemical water quality in Ireland. Science of the Total Environment, 514, 155-169.
• Harrington, S. T. & Harrington, J. R. (2013) An assessment of the suspended sediment rating curve approach for load estimation on the Rivers Bandon and Owenabue, Ireland. Geomorphology, 185, 27-38.
• Kiely, G., et al. (2007) Eutrophication from agricultural sources (Phosphorus and Nitrogen). Sub-project Soil and Phosphorus: Catchment Studies. EPA, Ireland (Ref. 2000–LS–2.1.1a–M1).
• May, L., et al. (2005) Modelling soil erosion and transport in the Burrishoole catchment, Newport, Co. Mayo, Ireland. Freshwater Forum, 23, 139-154.
• Marttila, H. and Kløve, B. (2015) Spatial and temporal variation in particle size and particulate organic matter content in suspended particulate matter from peatland-dominated catchments in Finland. Hydrological Processes, 29, 1069-1079.
• Melland, A.R., et al. (2012) Stream water quality in intensive cereal cropping catchments with regulated nutrient management. Environmental Science & Policy, 24, 58-70.
• Rodgers, M., et al. (2011) Suspended solid yield from forest harvesting on upland blanket peat. Hydrological Process, 25, 207-216.
• Ryder, E., et al. (2014) Identifying the role of environmental drivers in organic carbon export from a forested peat catchment. Science of the Total Environment, 490, 28-36.
• Sherriff, S. et al. (2015) Identifying the controls of soil loss in agricultural catchments using ex situ turbidity-based suspended sediment monitoring. Hydrology and Earth System Sciences , 12, 2707-2740.
• Thompson, J., et al. (2014) Assessing suspended sediment dynamics in relation to ecological thresholds and sampling strategies in two Irish headwater catchments. Science of the Total Environment, 468-469, 345-357.
• Vanmaercke, M., et al. (2011) Sediment yield in Europe: Spatial patterns and scale dependency. Geomorphology, 130, 142-161.
References