Embed Size (px)
Citation preview
Crop Rotation Profitability, productivity, and resilience
Jake Munroe
Soil Fertility Specialist (Field Crops)
OMAFRA
Joanna Follings
Cereals Specialist
OMAFRA
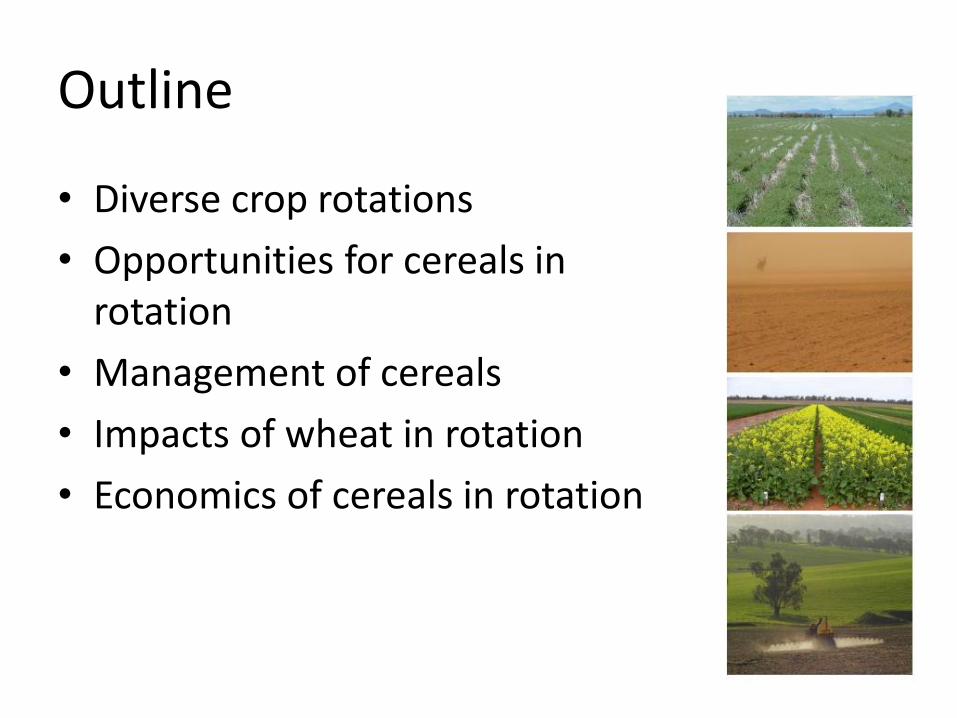
Outline
• Diverse crop rotations
• Opportunities for cereals in rotation
• Management of cereals
• Impacts of wheat in rotation
• Economics of cereals in rotation
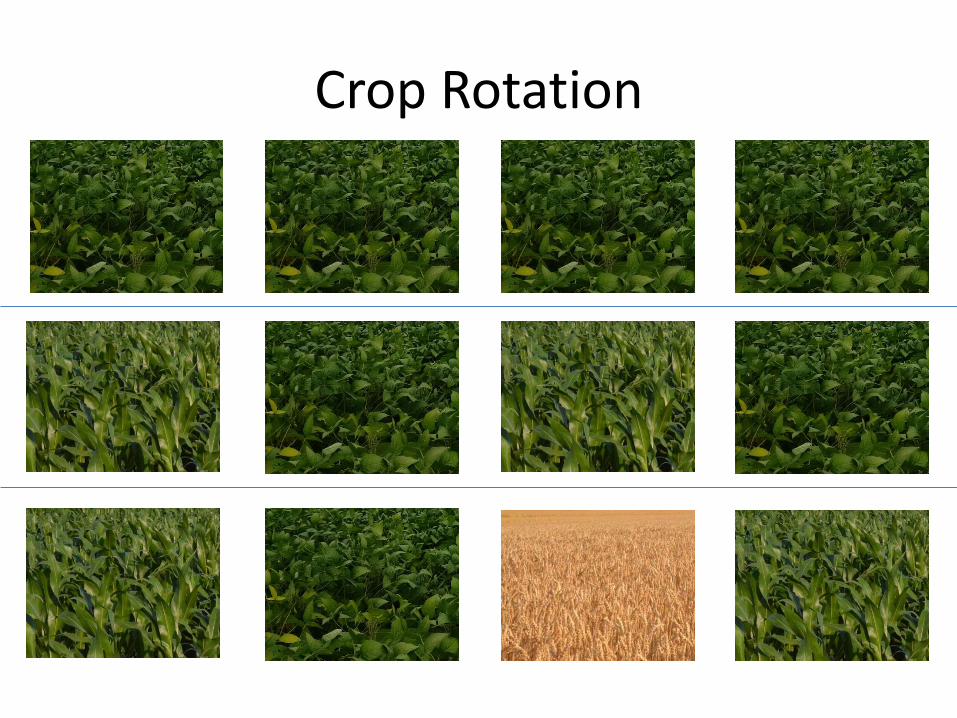
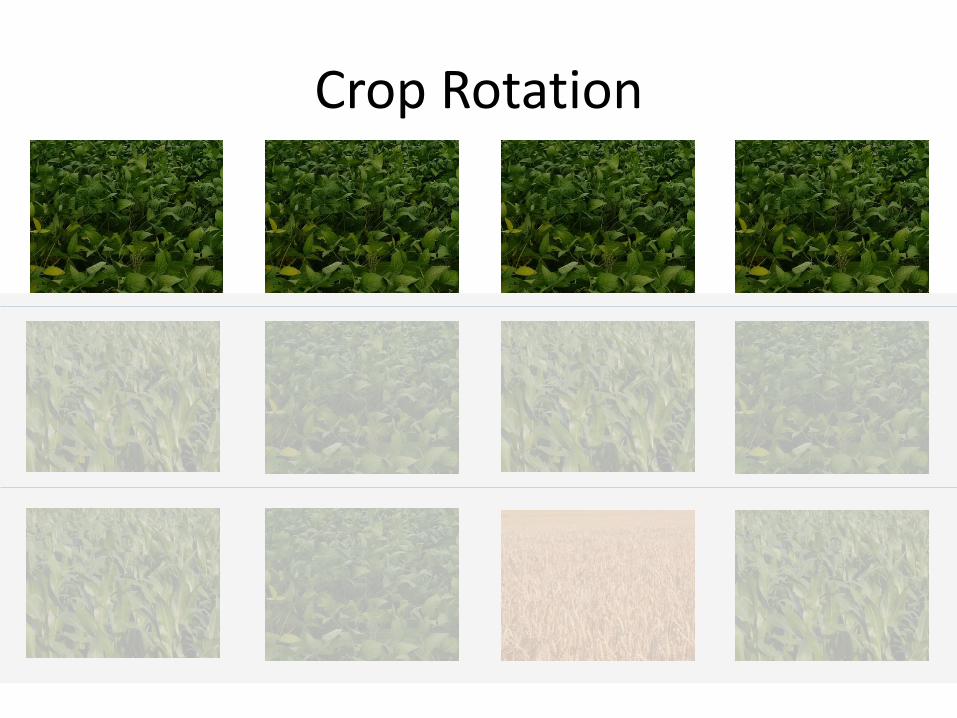
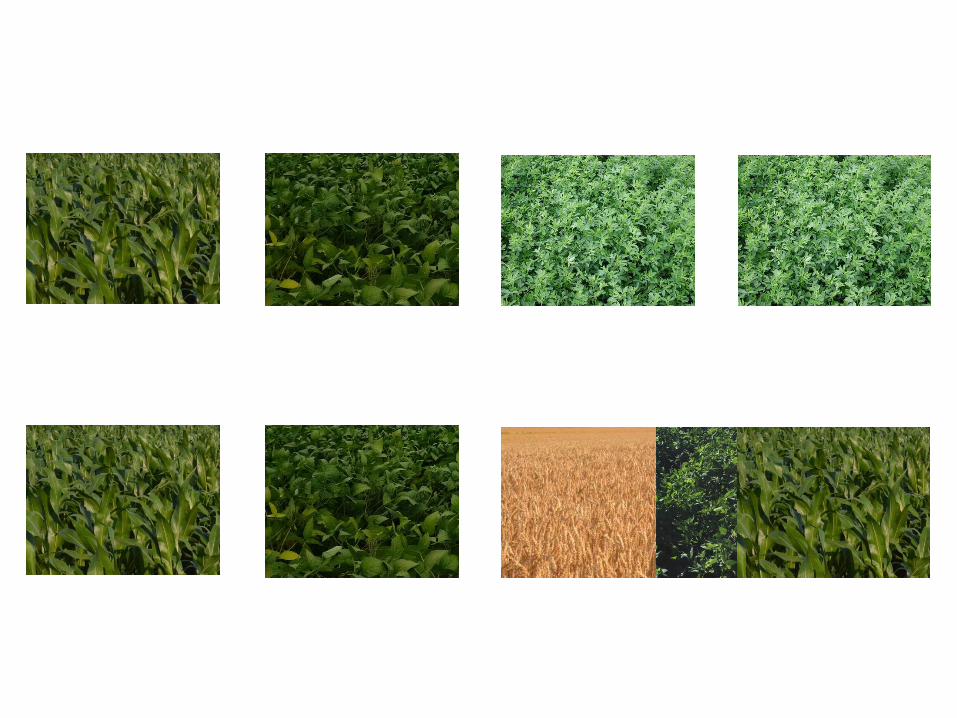
Crop Rotation
Crop Rotation
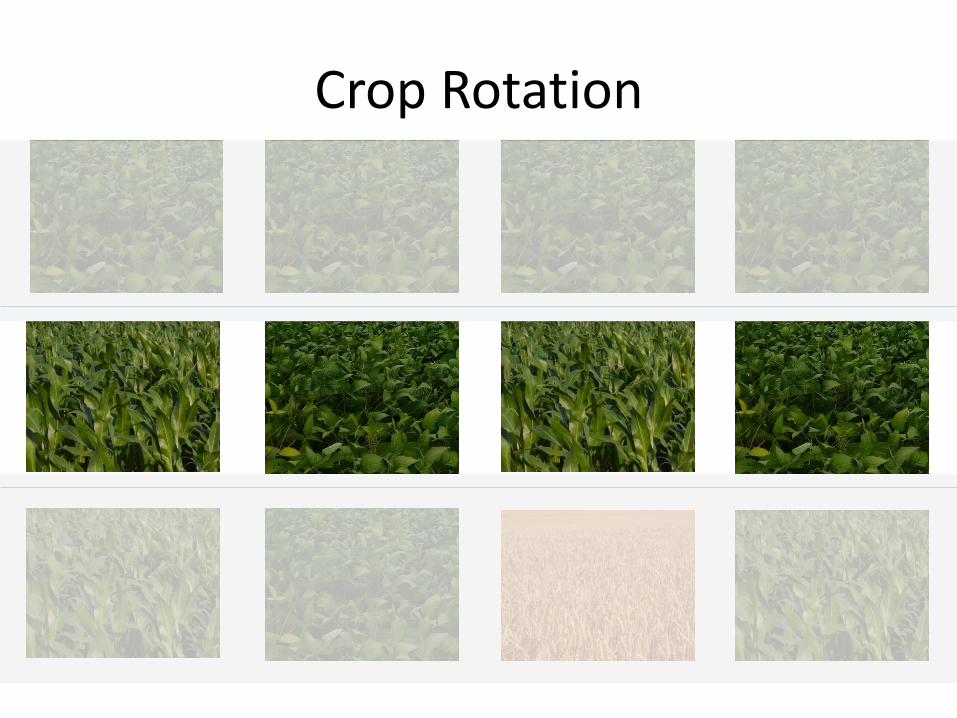
Crop Rotation
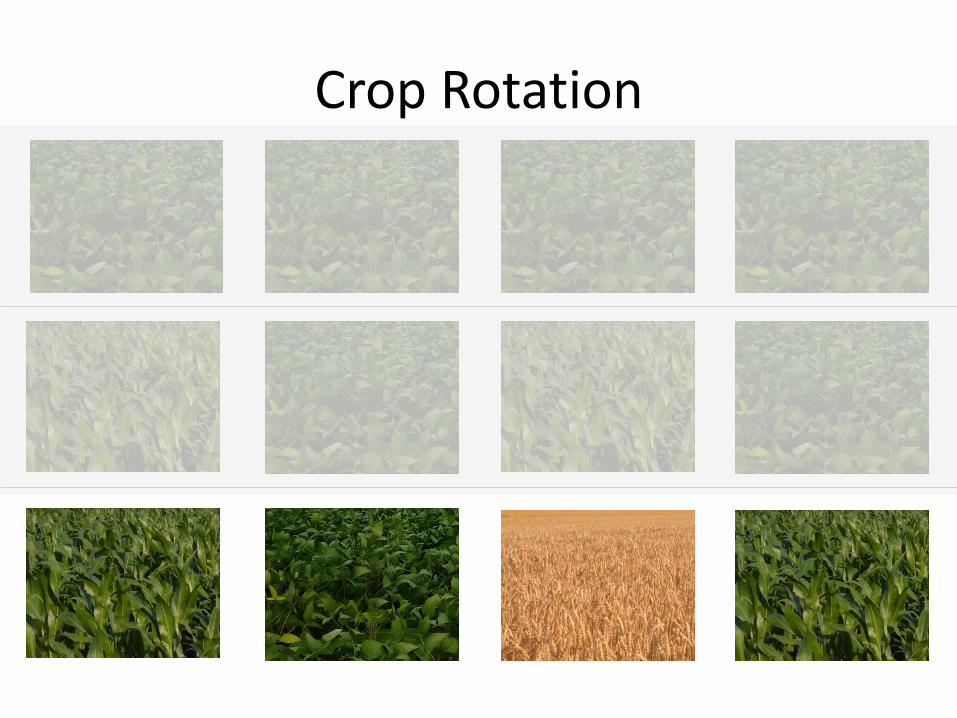
Crop Rotation
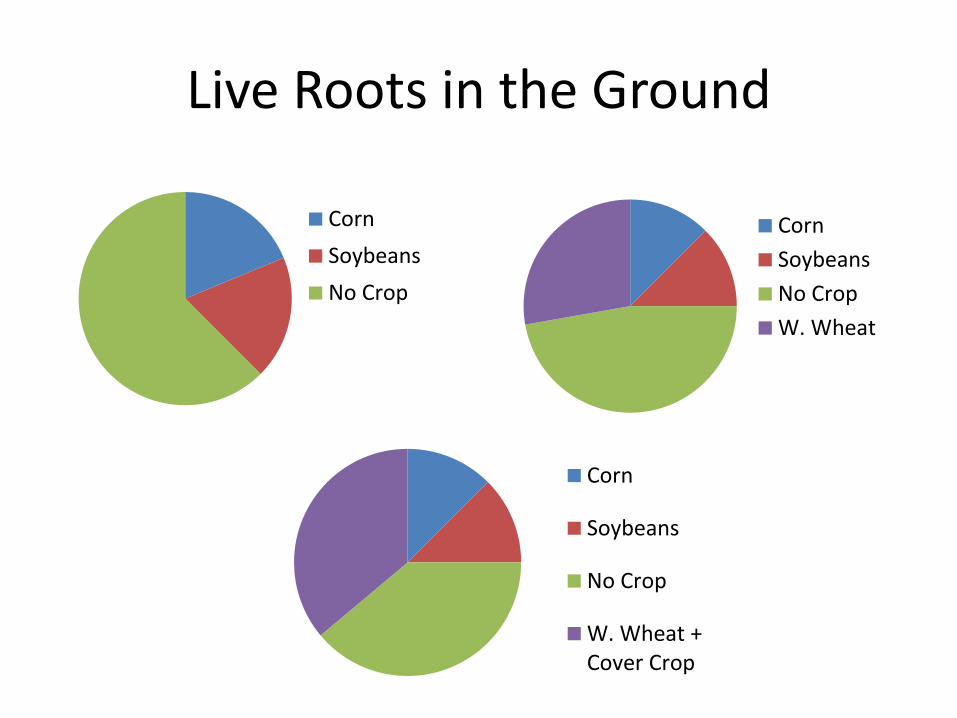
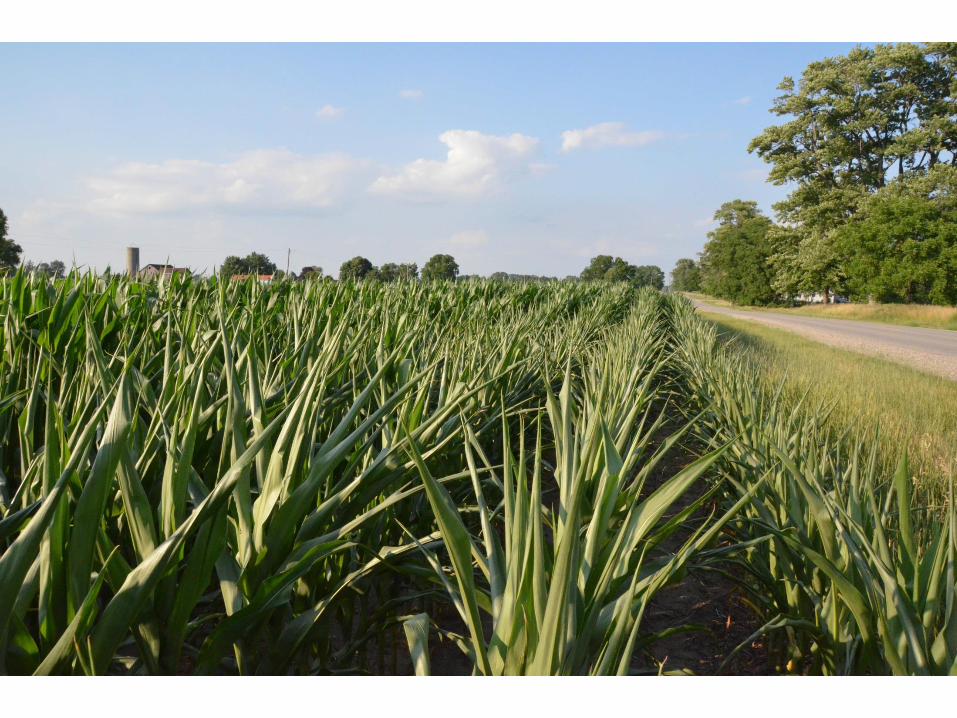
Live Roots in the Ground
Corn
Soybeans
No Crop
Corn
Soybeans
No Crop
W. Wheat
Corn
Soybeans
No Crop
W. Wheat +Cover Crop
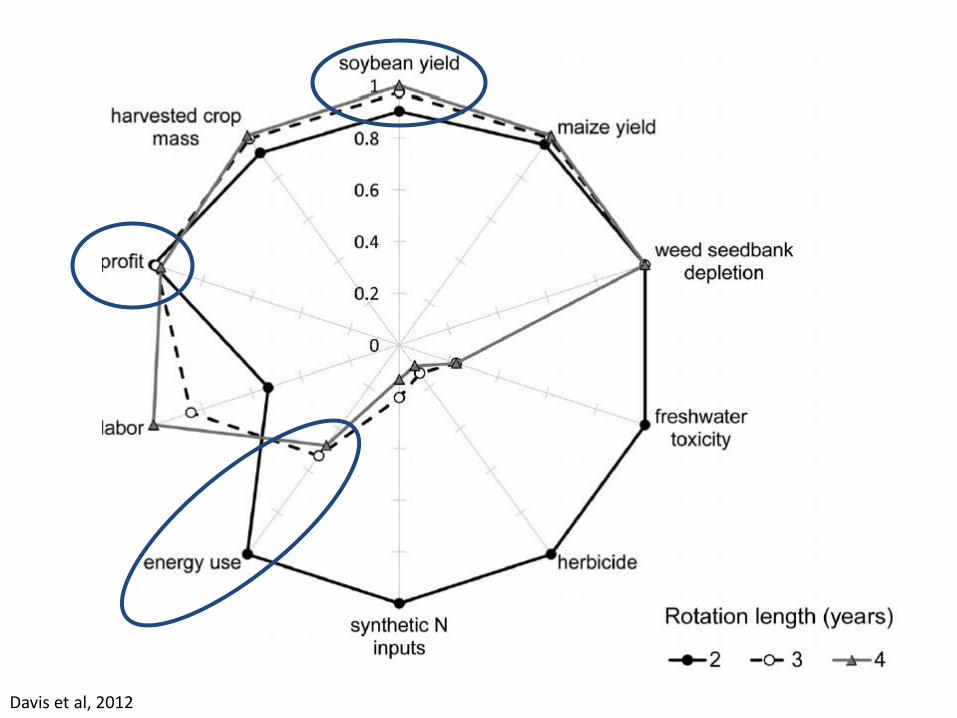
Davis et al, 2012
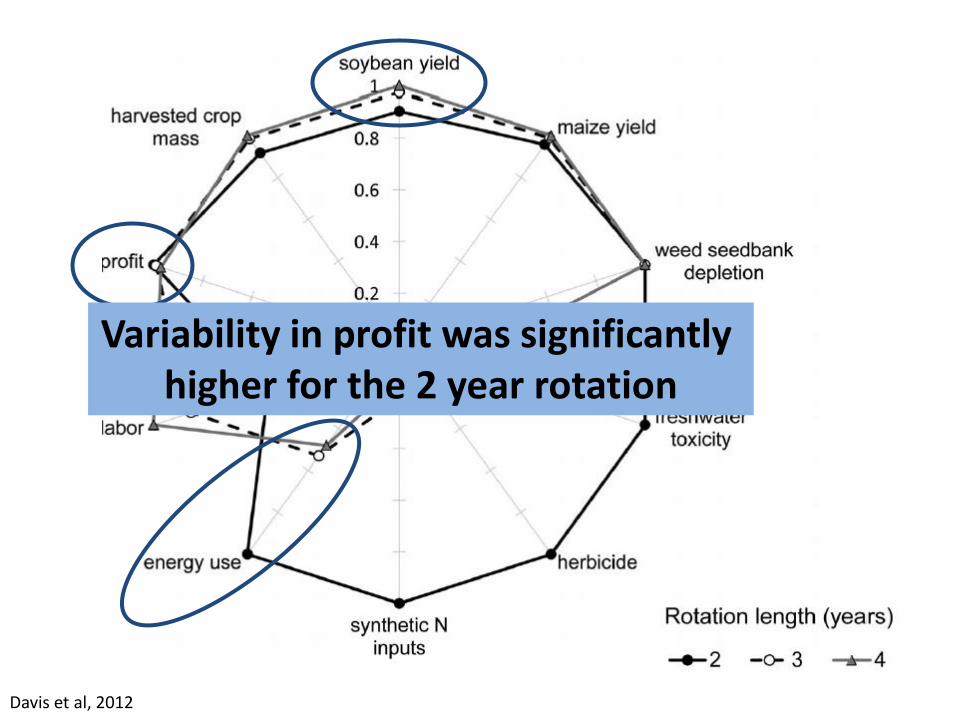
Davis et al, 2012
Variability in profit was significantly higher for the 2 year rotation
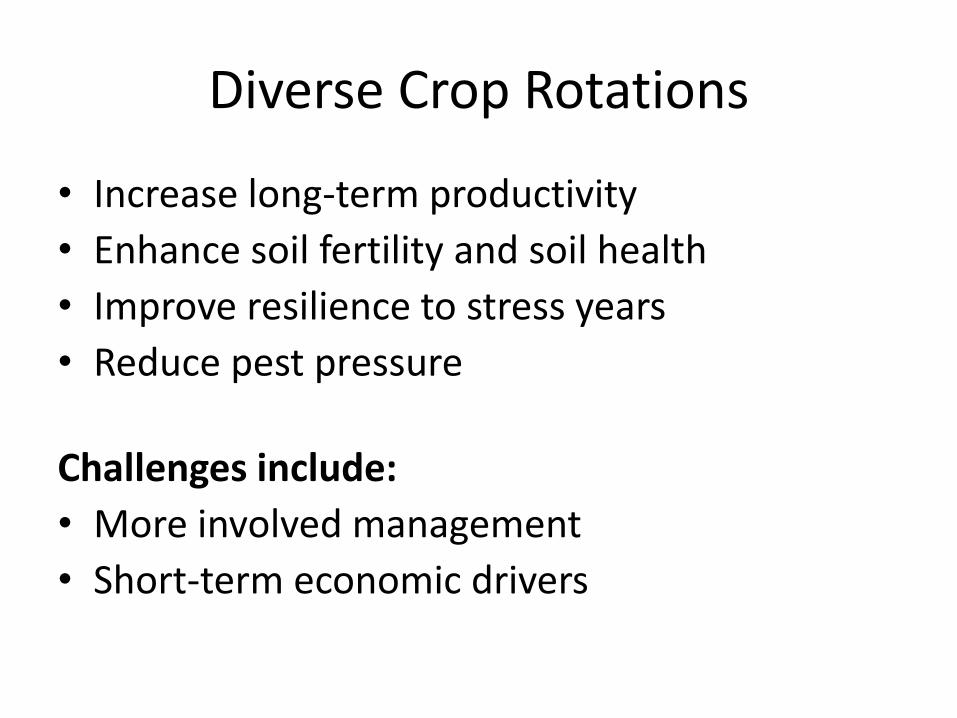
Diverse Crop Rotations
• Increase long-term productivity
• Enhance soil fertility and soil health
• Improve resilience to stress years
• Reduce pest pressure
Challenges include:
• More involved management
• Short-term economic drivers
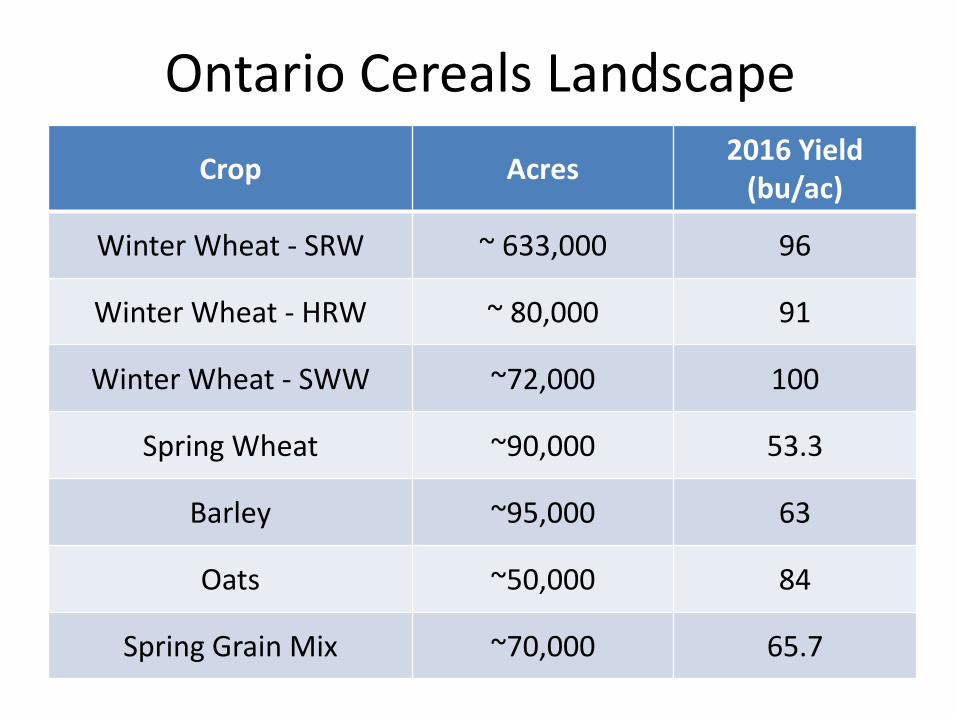
Ontario Cereals Landscape
Crop Acres 2016 Yield
(bu/ac)
Winter Wheat - SRW ~ 633,000 96
Winter Wheat - HRW ~ 80,000 91
Winter Wheat - SWW ~72,000 100
Spring Wheat ~90,000 53.3
Barley ~95,000 63
Oats ~50,000 84
Spring Grain Mix ~70,000 65.7
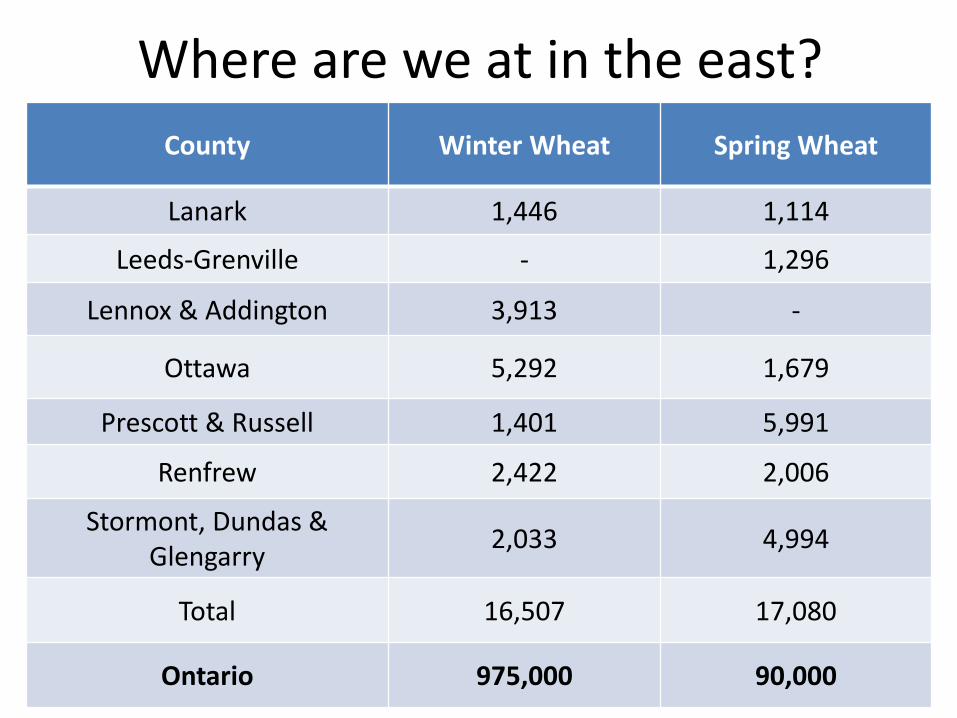
Where are we at in the east?
County Winter Wheat Spring Wheat
Lanark 1,446 1,114
Leeds-Grenville - 1,296
Lennox & Addington 3,913 -
Ottawa 5,292 1,679
Prescott & Russell 1,401 5,991
Renfrew 2,422 2,006
Stormont, Dundas & Glengarry
2,033 4,994
Total 16,507 17,080
Ontario 975,000 90,000
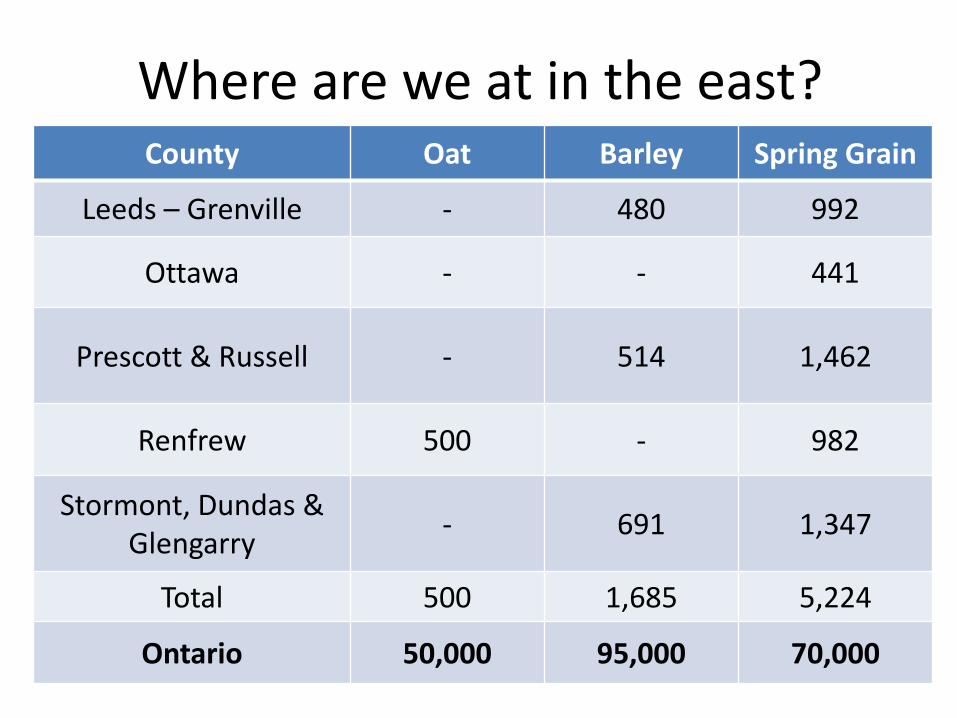
Where are we at in the east? County Oat Barley Spring Grain
Leeds – Grenville - 480 992
Ottawa - - 441
Prescott & Russell - 514 1,462
Renfrew 500 - 982
Stormont, Dundas & Glengarry
- 691 1,347
Total 500 1,685 5,224
Ontario 50,000 95,000 70,000
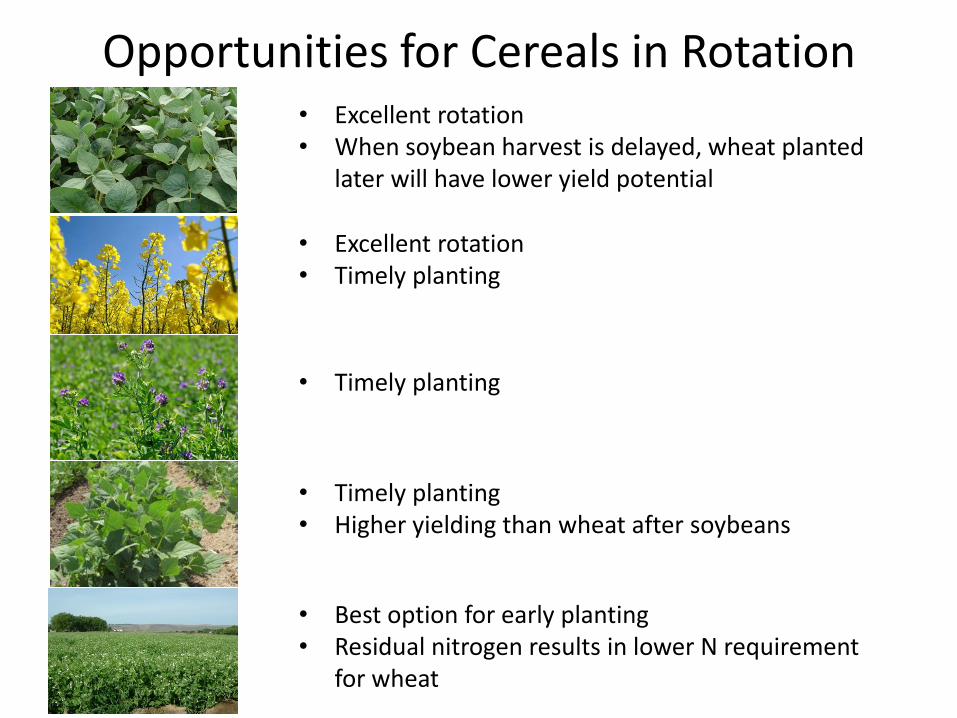
Opportunities for Cereals in Rotation
• Best option for early planting • Residual nitrogen results in lower N requirement
for wheat
• Timely planting • Higher yielding than wheat after soybeans
• Timely planting
• Excellent rotation • Timely planting
• Excellent rotation • When soybean harvest is delayed, wheat planted
later will have lower yield potential
Opportunities for Malting Barley
• Barley now represented by GFO
– 186,500 tonnes
– 147,383 acres
• Craft Brewing Industry
– 224 brewers in 2016, up from 40 in 2009
– 158 breweries have on-site retail stores. • Of those, approximately 153 could be considered small brewers
– 92 additional breweries planned
Current Malt House Capacity
• 2 small malt houses in Ontario – Harvest Hop and Malt, Guelph
• 100 tonne organic malt barley capacity
– Barn Owl Malt, Belleville • 100 tonne capacity
– Two potential malt houses opening in Erin and Windsor
• About 2000 tonnes of ON malt barley going to Canada Malt in Montreal
Malt Demand
• One tonne of finished malt will make 50 hL of beer
– 8 million hL of beer produced in Ontario
• How many acres?
– 160,000 tonnes
– Average yield 1.5-2 ton/ac
– ~80,000 - 100,000 acres of malting barley
Cereals Management
• Variety Selection
• Field Selection
• Planting (date, depth and seeding rate)
• Fertility
• Weed Control
• Fungicides
• Harvest/Storage

Variety Selection
• Disease resistance (FHB)
• Yield
• Protein
• Lodging
• Winter Survival
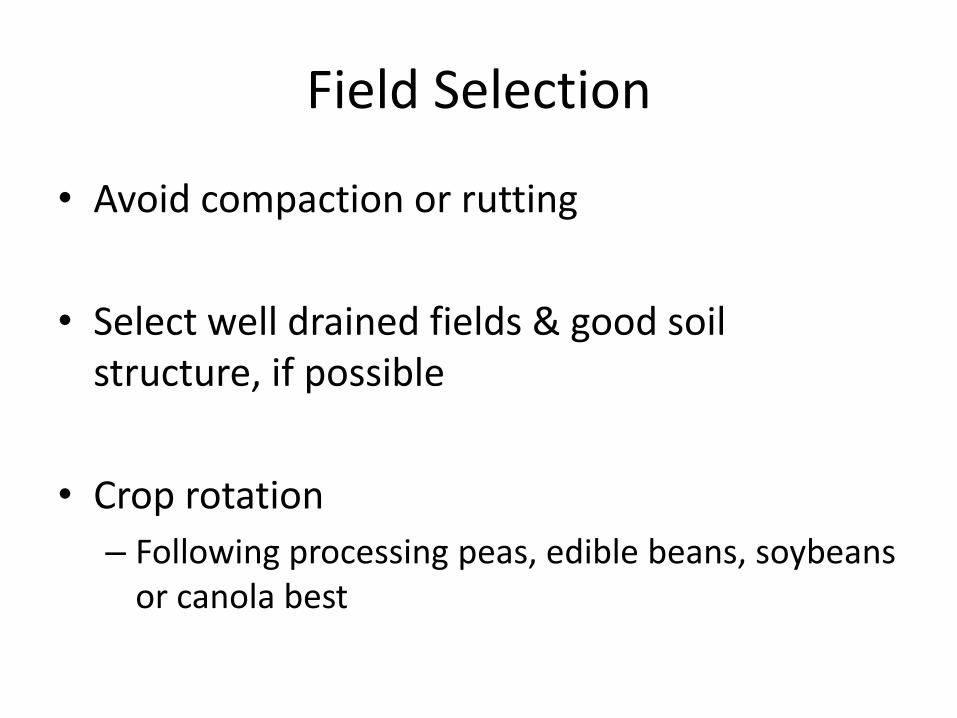
Field Selection
• Avoid compaction or rutting
• Select well drained fields & good soil structure, if possible
• Crop rotation
– Following processing peas, edible beans, soybeans or canola best
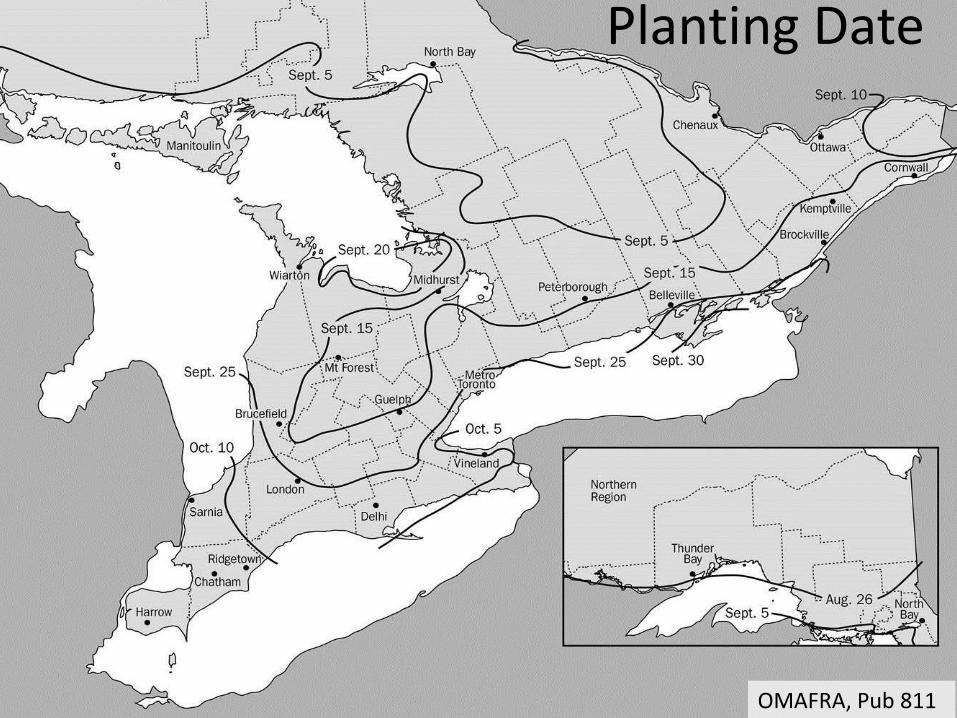
Planting Date
OMAFRA, Pub 811
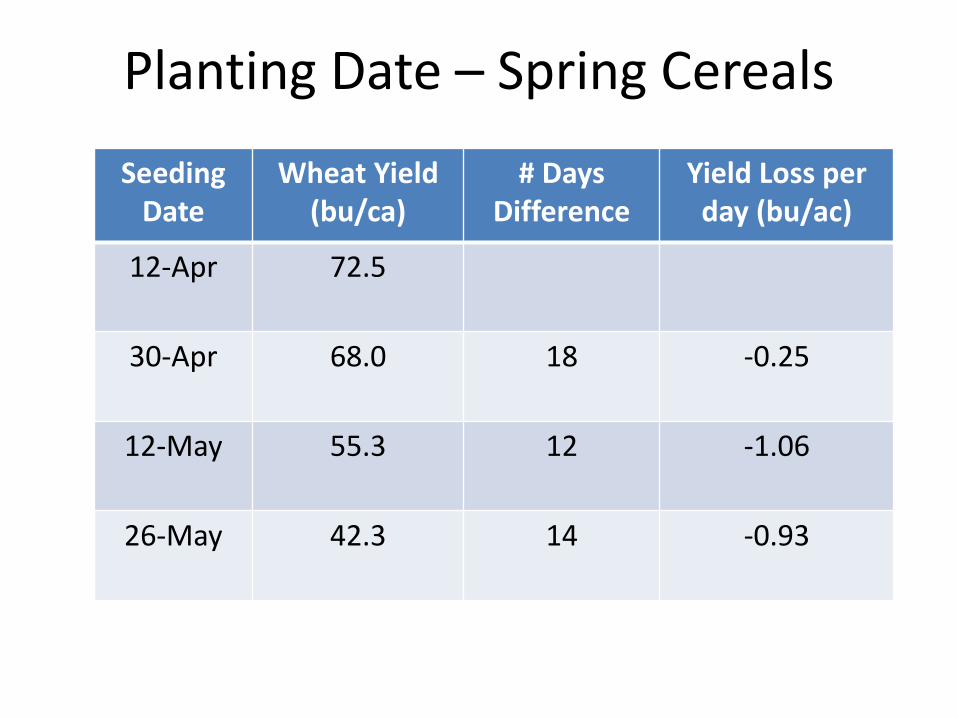
Planting Date – Spring Cereals
Seeding Date
Wheat Yield (bu/ca)
# Days Difference
Yield Loss per day (bu/ac)
12-Apr 72.5
30-Apr 68.0 18 -0.25
12-May 55.3 12 -1.06
26-May 42.3 14 -0.93
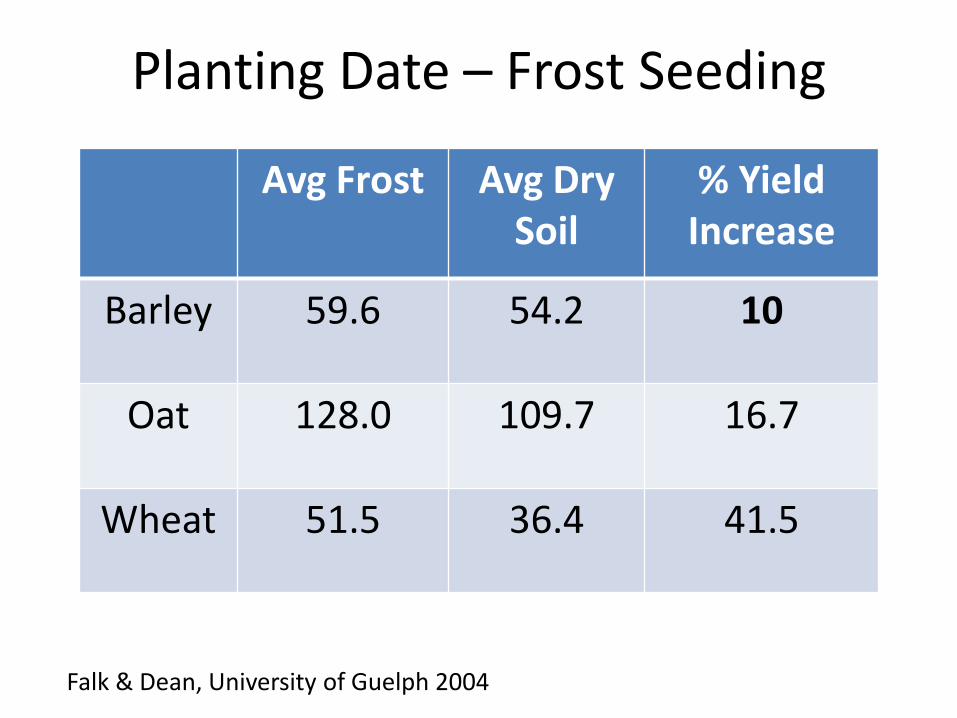
Planting Date – Frost Seeding
Avg Frost Avg Dry Soil
% Yield Increase
Barley 59.6 54.2 10
Oat 128.0 109.7 16.7
Wheat 51.5 36.4 41.5
Falk & Dean, University of Guelph 2004
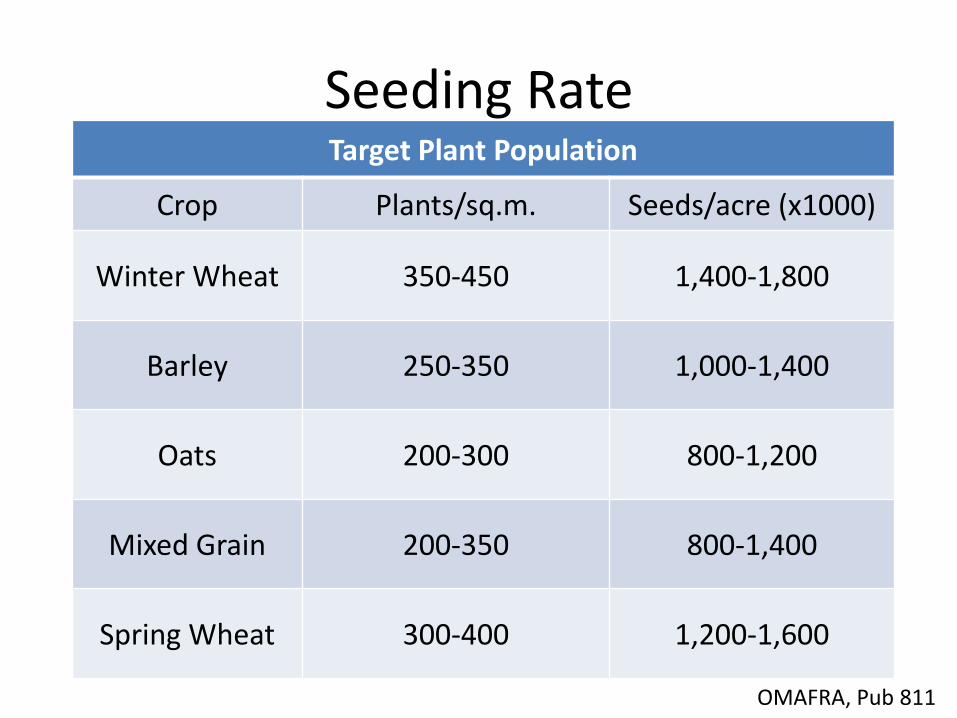
Seeding Rate Target Plant Population
Crop Plants/sq.m. Seeds/acre (x1000)
Winter Wheat 350-450 1,400-1,800
Barley 250-350 1,000-1,400
Oats 200-300 800-1,200
Mixed Grain 200-350 800-1,400
Spring Wheat 300-400 1,200-1,600
OMAFRA, Pub 811
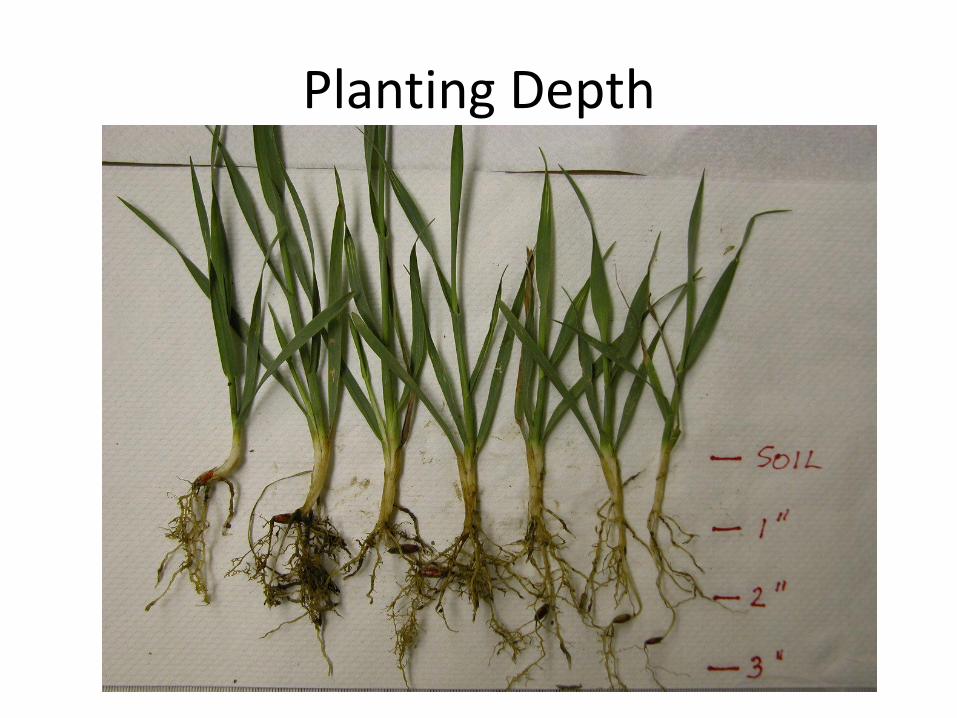
Planting Depth
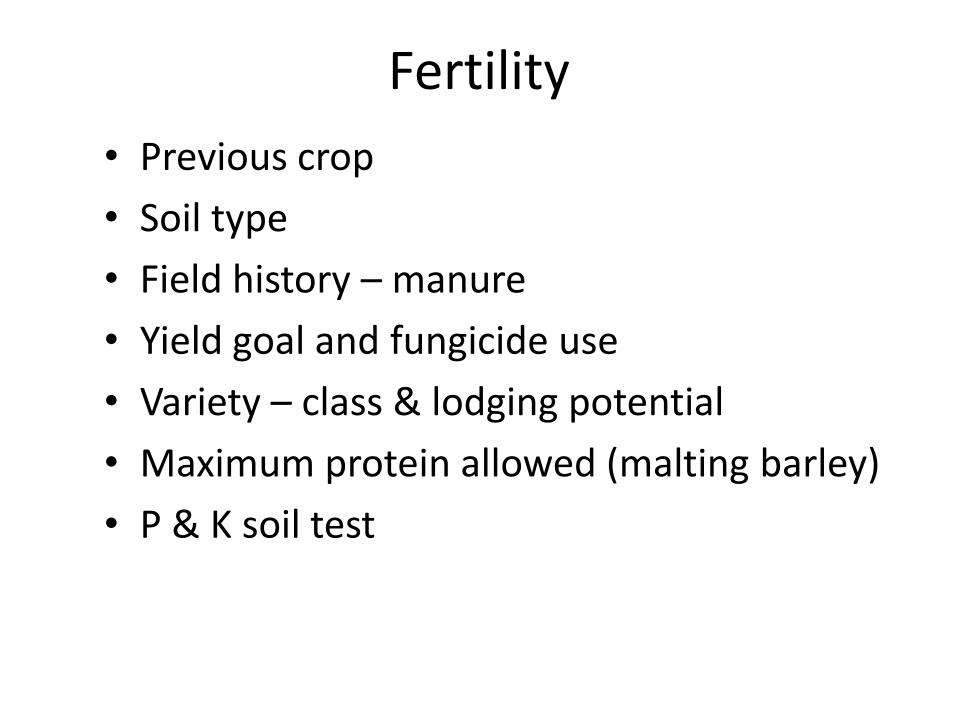
Fertility
• Previous crop
• Soil type
• Field history – manure
• Yield goal and fungicide use
• Variety – class & lodging potential
• Maximum protein allowed (malting barley)
• P & K soil test
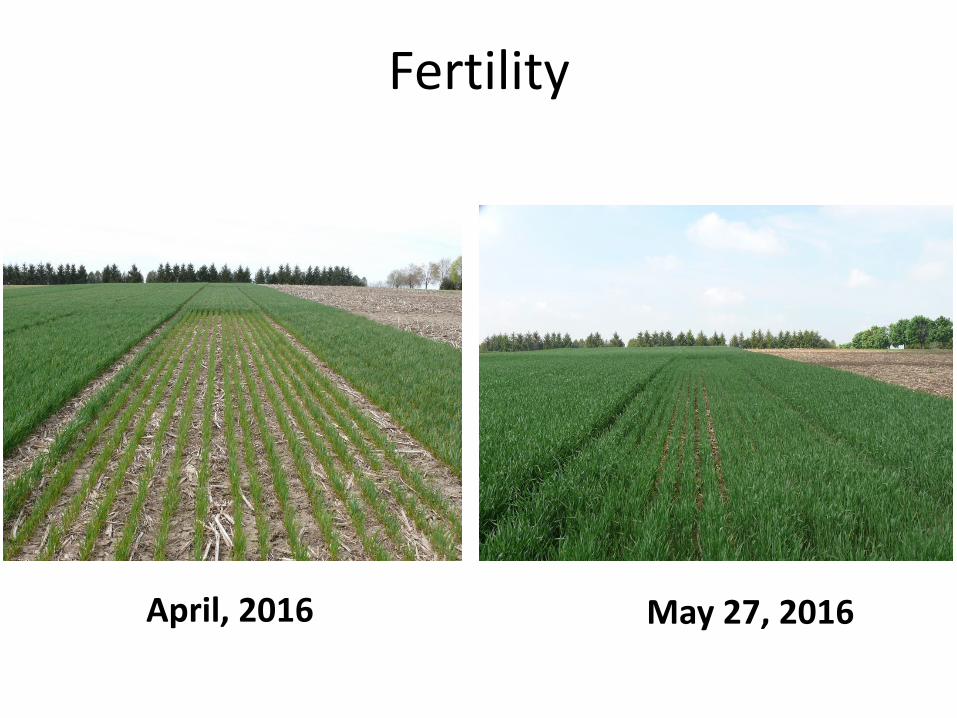
Fertility
May 27, 2016 April, 2016
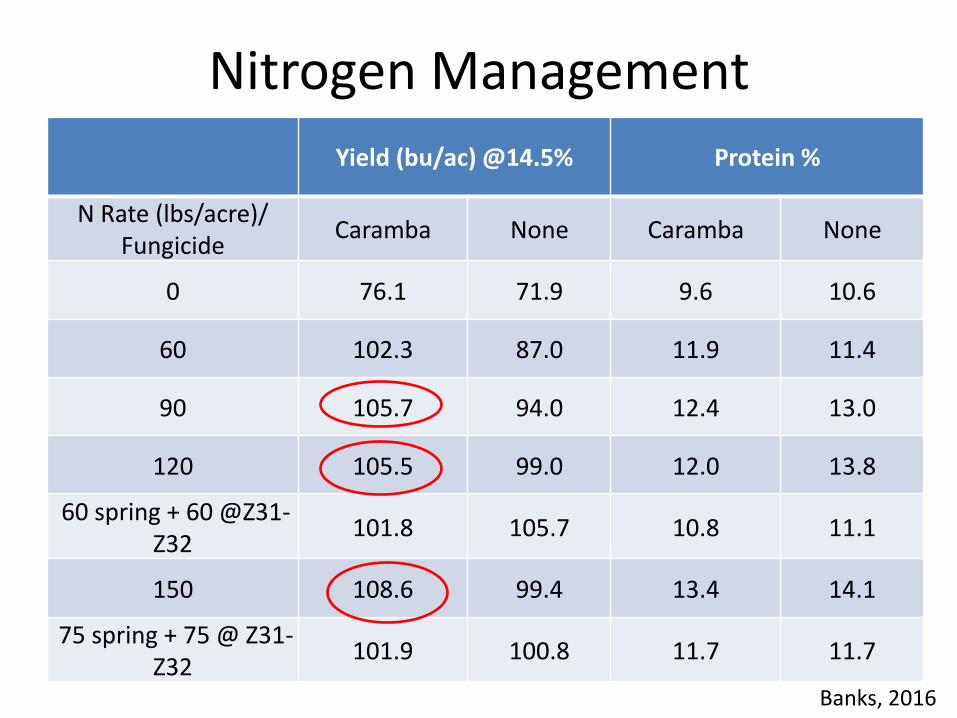
Nitrogen Management
Banks, 2016
Yield (bu/ac) @14.5% Protein %
N Rate (lbs/acre)/ Fungicide
Caramba None Caramba None
0 76.1 71.9 9.6 10.6
60 102.3 87.0 11.9 11.4
90 105.7 94.0 12.4 13.0
120 105.5 99.0 12.0 13.8
60 spring + 60 @Z31-Z32
101.8 105.7 10.8 11.1
150 108.6 99.4 13.4 14.1
75 spring + 75 @ Z31-Z32
101.9 100.8 11.7 11.7
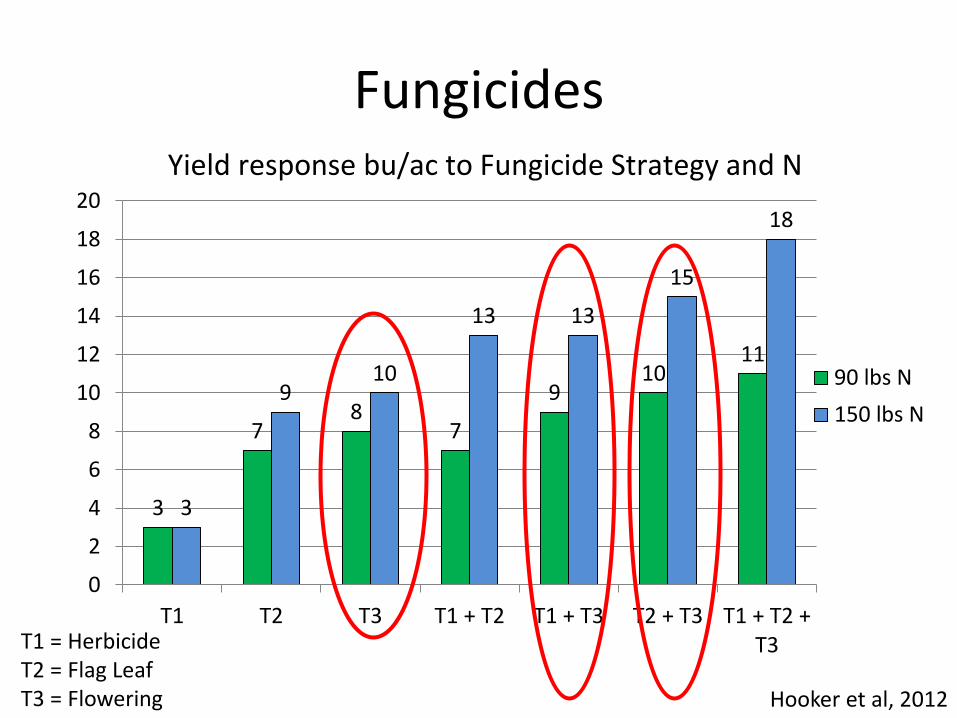
Fungicides
3
7 8
7
9 10
11
3
9 10
13 13
15
18
0
2
4
6
8
10
12
14
16
18
20
T1 T2 T3 T1 + T2 T1 + T3 T2 + T3 T1 + T2 +T3
90 lbs N
150 lbs N
Yield response bu/ac to Fungicide Strategy and N
Hooker et al, 2012
T1 = Herbicide T2 = Flag Leaf T3 = Flowering
10.8
11.0
11.2
11.4
11.6
11.8
12.0
12.2
12.4
35.0
40.0
45.0
50.0
55.0
60.0
65.0
70.0
75.0
80.0
85.0
0 30 60 90 120 150
Yie
ld (
bu
/acr
e)
N Rates
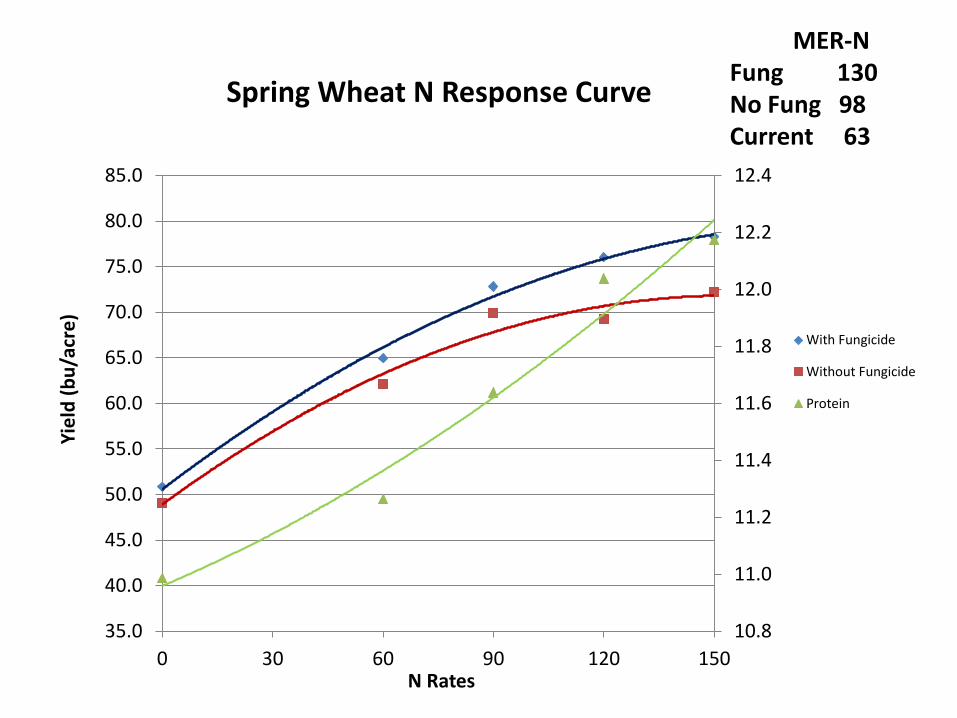
Spring Wheat N Response Curve
With Fungicide
Without Fungicide
Protein
MER-N Fung 130 No Fung 98 Current 63
10.0
10.5
11.0
11.5
12.0
12.5
90.0
100.0
110.0
120.0
130.0
140.0
0 30 60 90 120 150
Yie
ld (
bu
/acr
e)
N Rate
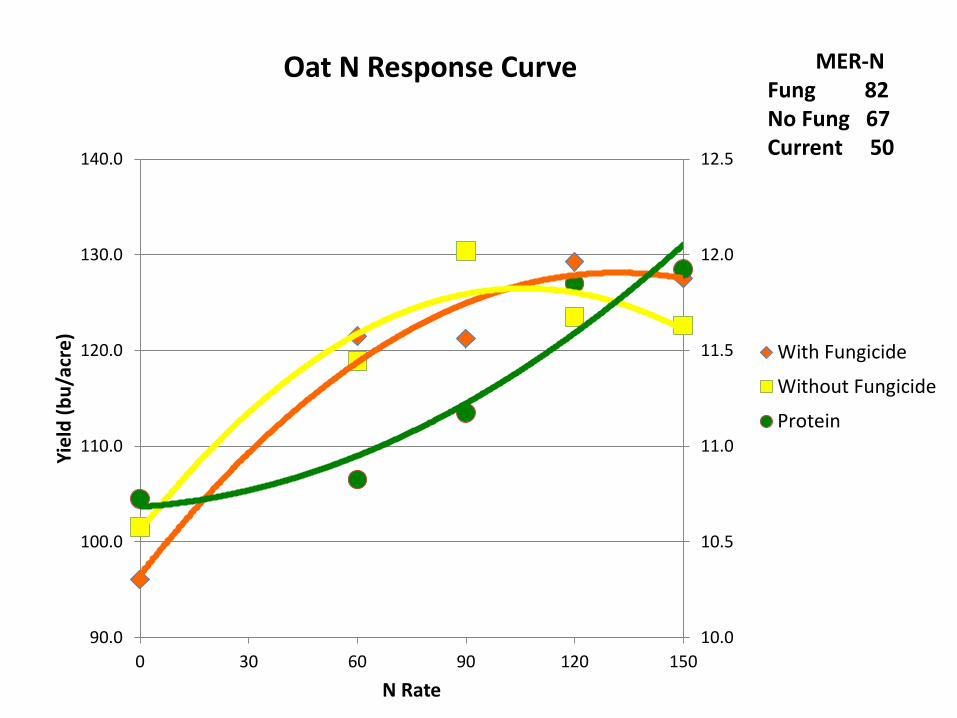
Nitrogen X Fungicide Interactions
With Fungicide
Without Fungicide
Protein
MER-N Fung 82 No Fung 67 Current 50
Oat N Response Curve
9.0
9.5
10.0
10.5
11.0
11.5
12.0
12.5
45.0
55.0
65.0
75.0
85.0
95.0
105.0
115.0
125.0
0 30 60 90 120 150
Yie
ld (
bu
/acr
e)
N Rates
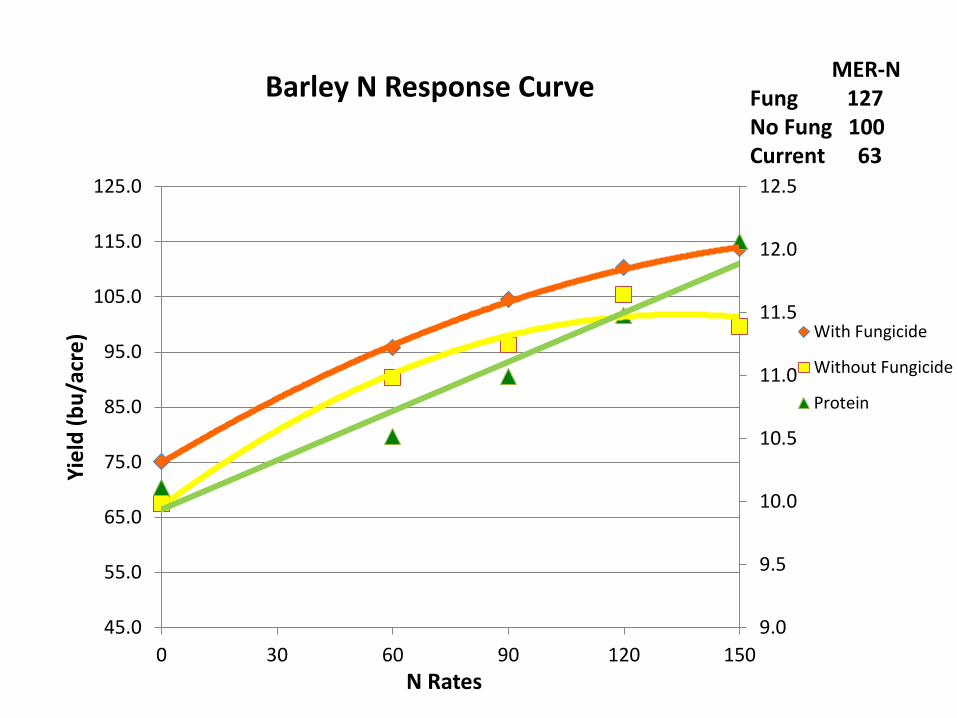
Nitrogen X Fungicide Interactions
With Fungicide
Without Fungicide
Protein
MER-N Fung 127 No Fung 100 Current 63
Barley N Response Curve
Confidential 35
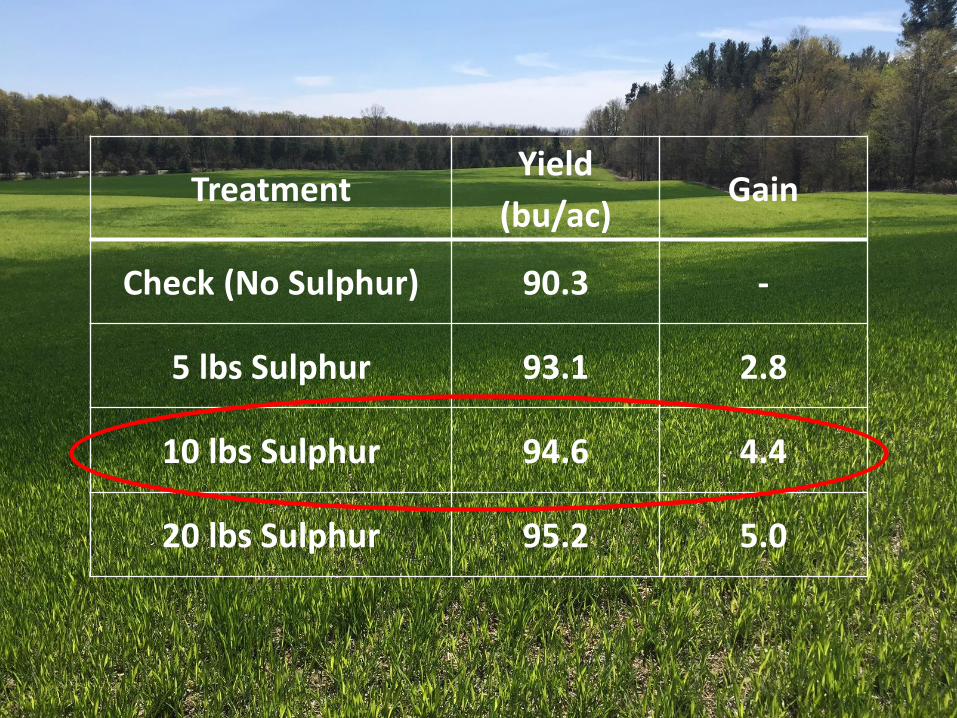
Treatment Yield
(bu/ac) Gain
Check (No Sulphur) 90.3 -
5 lbs Sulphur 93.1 2.8
10 lbs Sulphur 94.6 4.4
20 lbs Sulphur 95.2 5.0
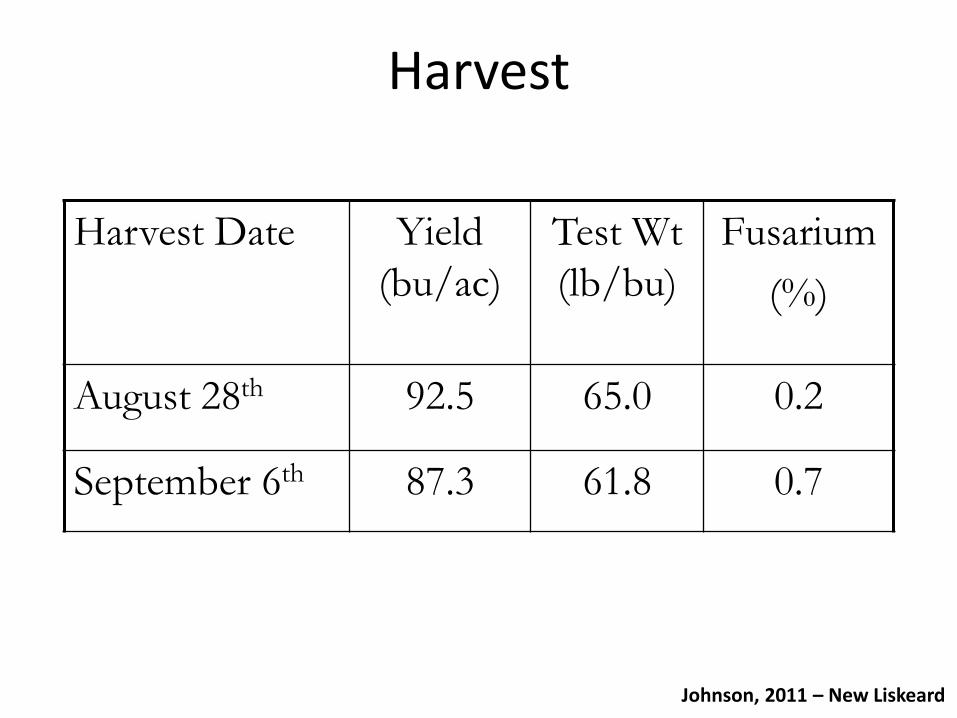
Harvest
Harvest Date Yield
(bu/ac)
Test Wt
(lb/bu)
Fusarium
(%)
August 28th 92.5 65.0 0.2
September 6th 87.3 61.8 0.7
Johnson, 2011 – New Liskeard
What are the impacts of cereals in your crop rotation?
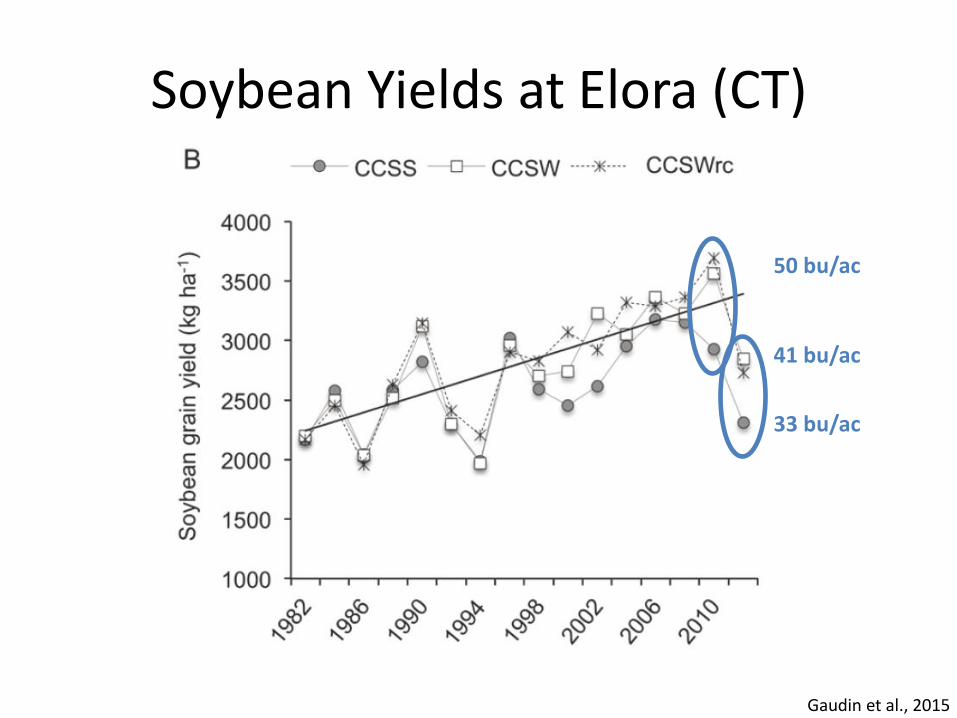
Soybean Yields at Elora (CT)
Gaudin et al., 2015
50 bu/ac
41 bu/ac
33 bu/ac
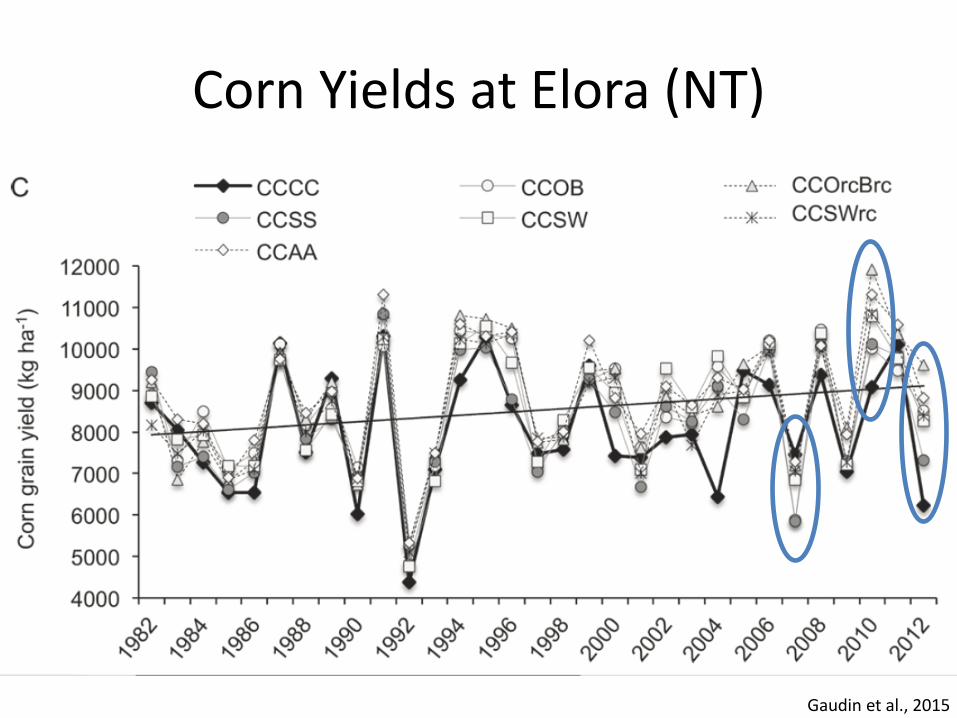
Corn Yields at Elora (NT)
Gaudin et al., 2015
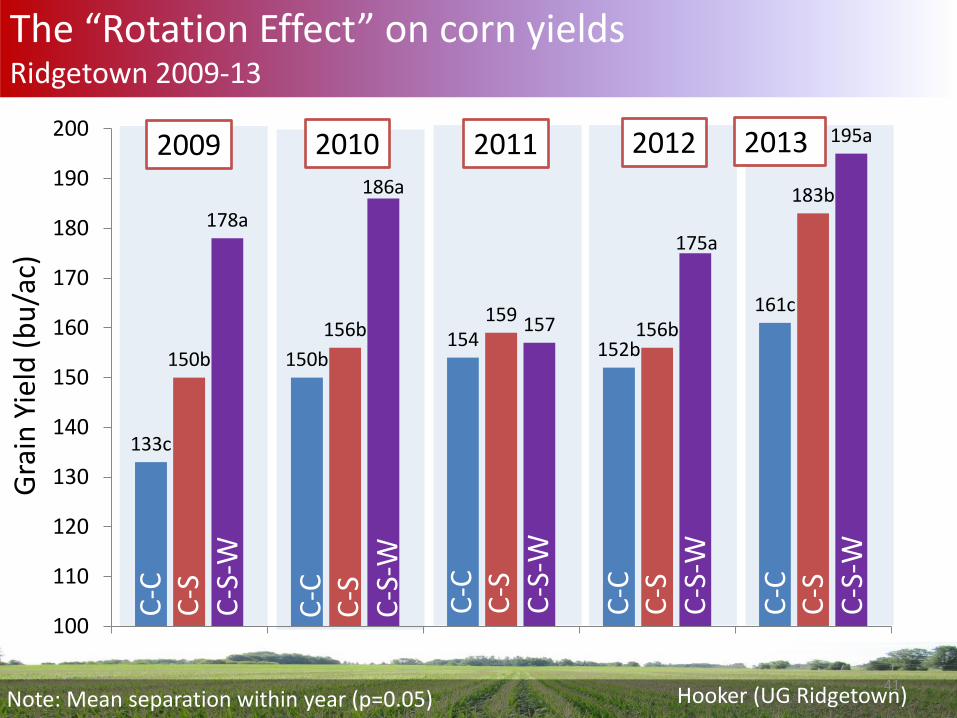
133c
150b 154 152b
161c
150b
156b 159
156b
183b 178a
186a
157
175a
195a
100
110
120
130
140
150
160
170
180
190
200
Gra
in Y
ield
(b
u/a
c)
2009 2010 2011
The “Rotation Effect” on corn yields Ridgetown 2009-13
C-C
C
-S
C-S
-W
2012
Note: Mean separation within year (p=0.05)
C-C
C
-S
C-S
-W
C-C
C
-S
C-S
-W
C-C
C
-S
C-S
-W
C-C
C
-S
C-S
-W
2013
Hooker (UG Ridgetown) 41
Opportunity for a Cover Crop
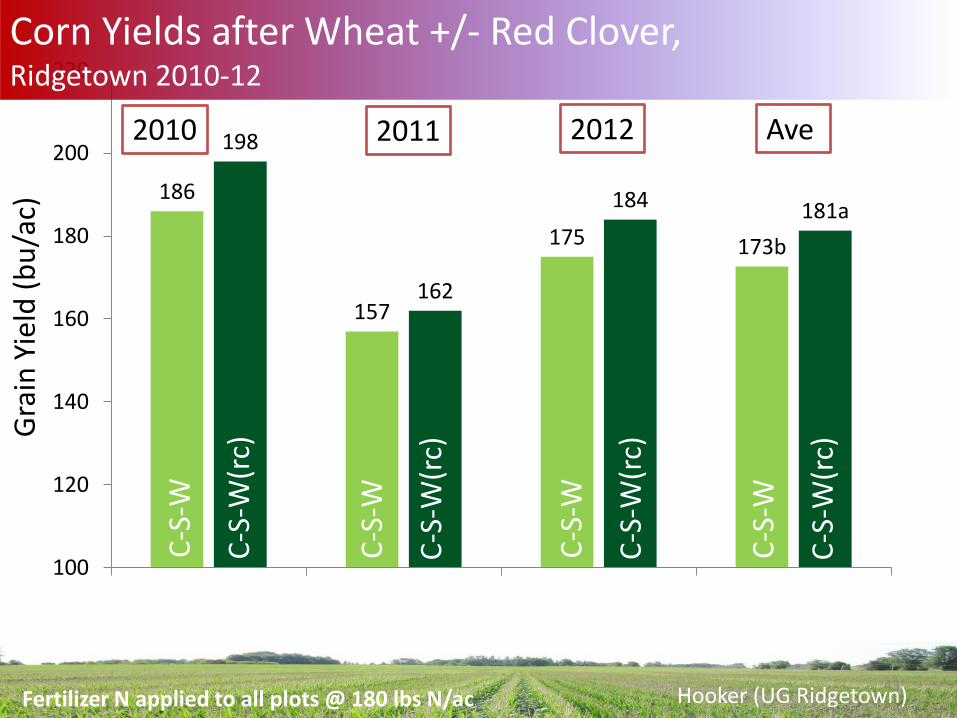
186
157
175 173b
198
162
184 181a
100
120
140
160
180
200
220
Gra
in Y
ield
(b
u/a
c)
2010 2011
Corn Yields after Wheat +/- Red Clover, Ridgetown 2010-12
C-S
-W
C-S
-W(r
c)
2012
C-S
-W
C-S
-W(r
c)
C-S
-W
C-S
-W(r
c)
C-S
-W
C-S
-W(r
c)
Ave
Hooker (UG Ridgetown) Fertilizer N applied to all plots @ 180 lbs N/ac 43
186
157
175 173b
198
162
184 181a
100
120
140
160
180
200
220
Gra
in Y
ield
(b
u/a
c)
2010 2011
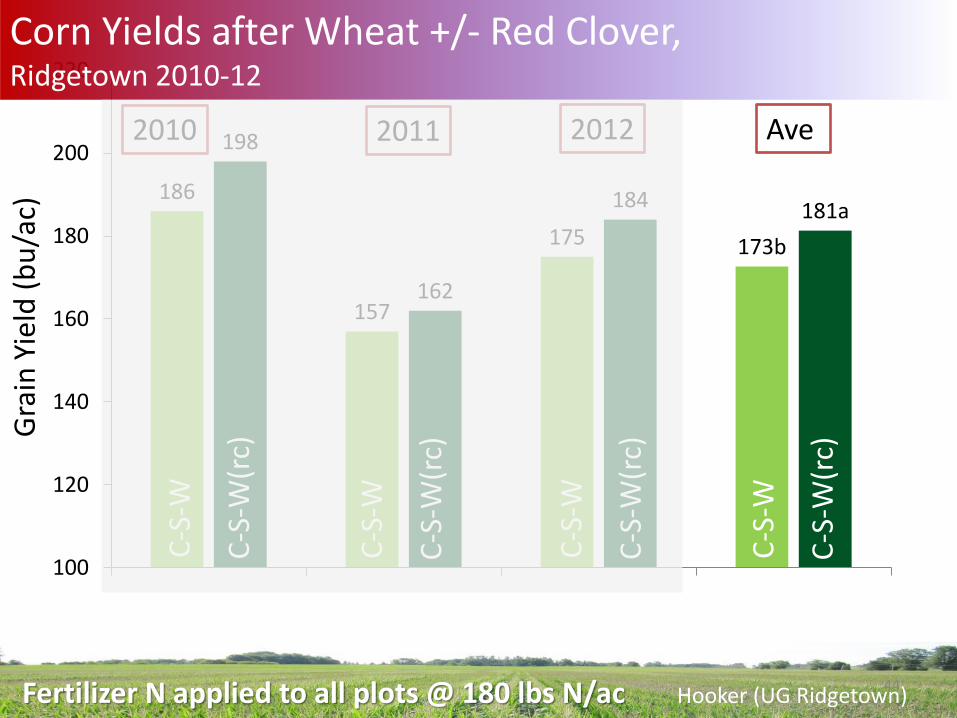
Corn Yields after Wheat +/- Red Clover, Ridgetown 2010-12
C-S
-W
C-S
-W(r
c)
2012
C-S
-W
C-S
-W(r
c)
C-S
-W
C-S
-W(r
c)
C-S
-W
C-S
-W(r
c)
Ave
Hooker (UG Ridgetown) Fertilizer N applied to all plots @ 180 lbs N/ac 44
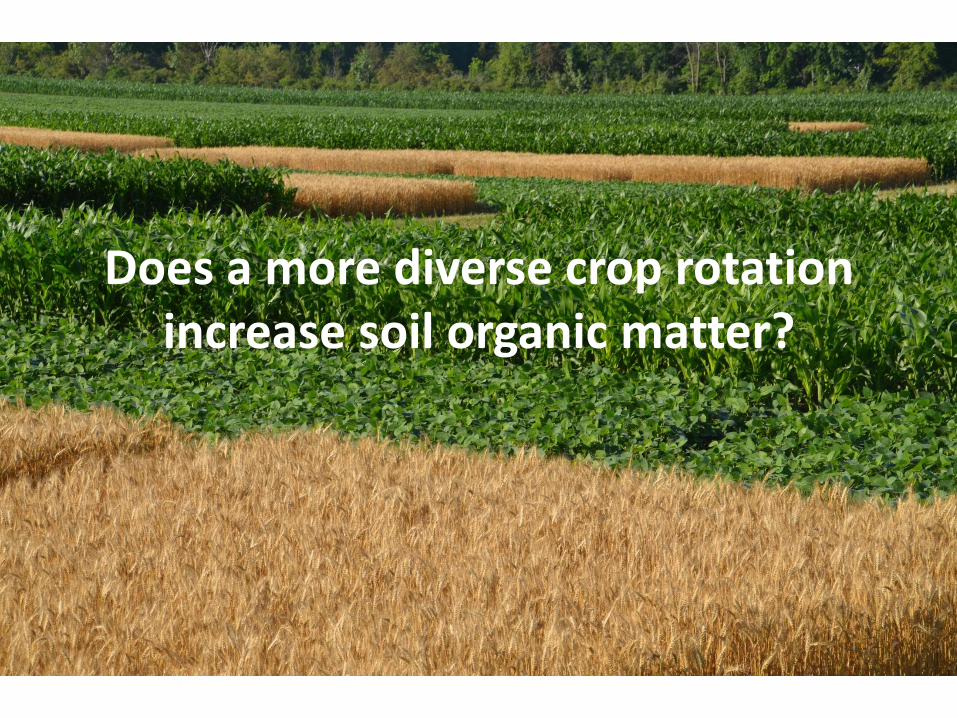
Does a more diverse crop rotation increase soil organic matter?
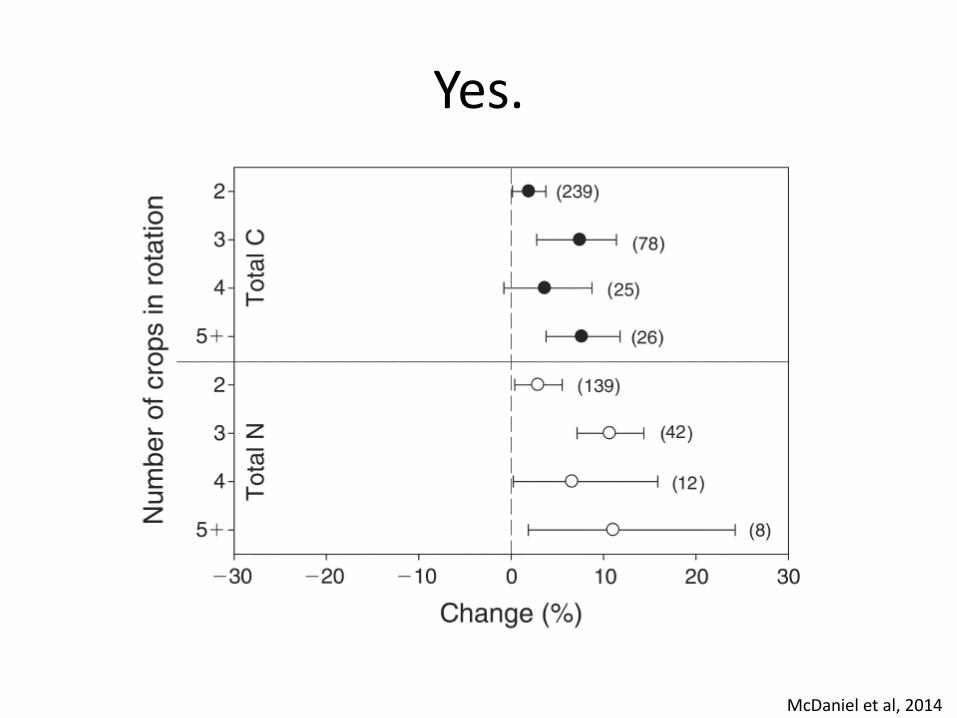
Yes.
McDaniel et al, 2014
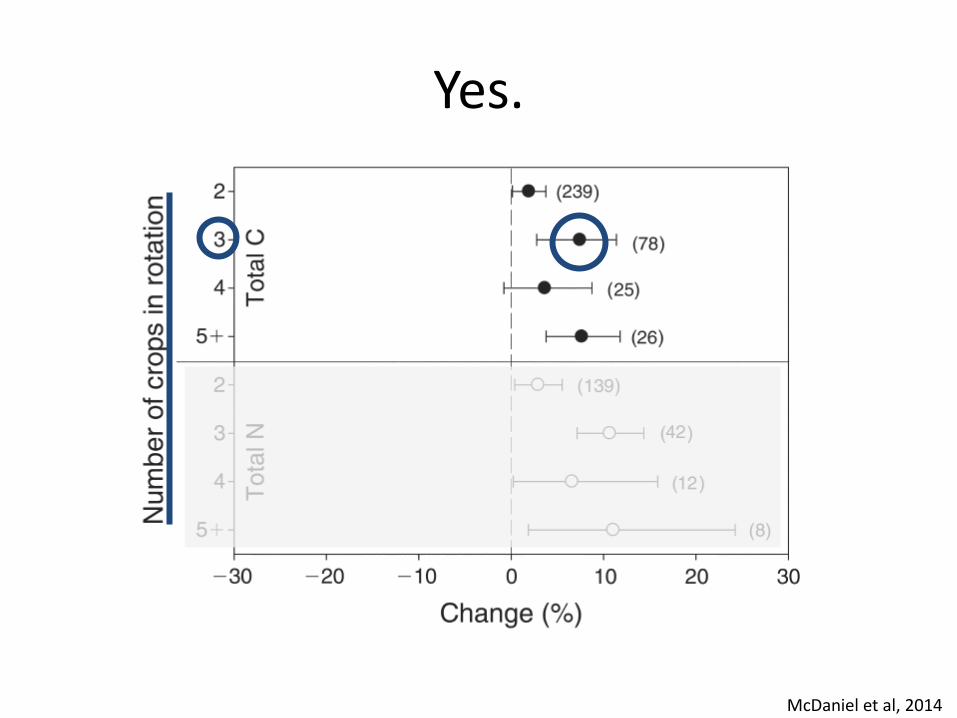
Yes.
McDaniel et al, 2014
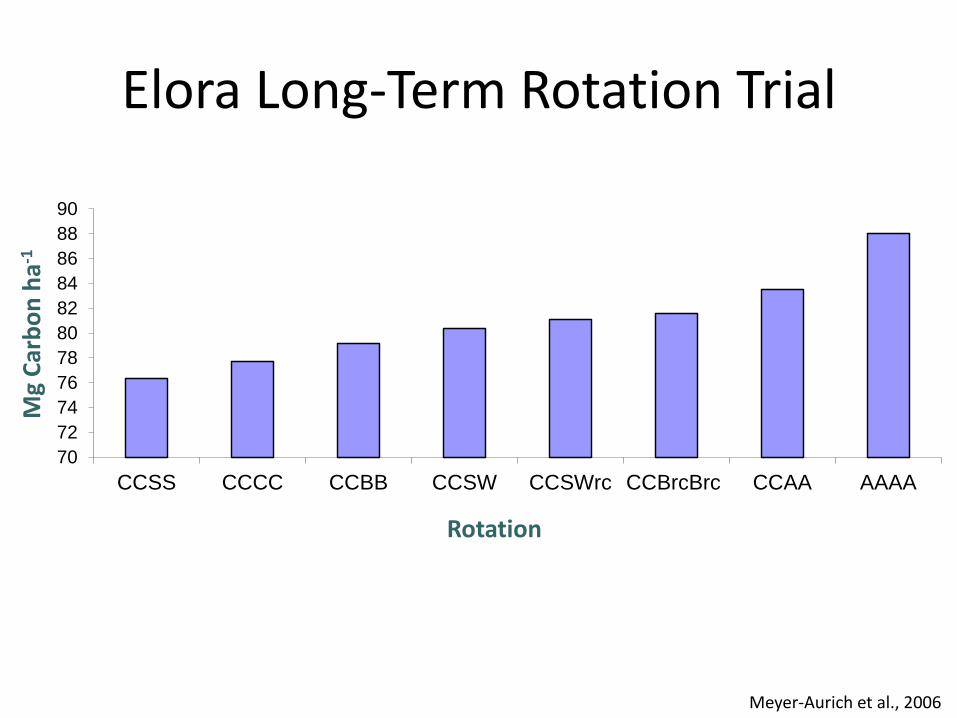
70
72
74
76
78
80
82
84
86
88
90
CCSS CCCC CCBB CCSW CCSWrc CCBrcBrc CCAA AAAA
Mg
Car
bo
n h
a-1
Rotation
Meyer-Aurich et al., 2006
Elora Long-Term Rotation Trial
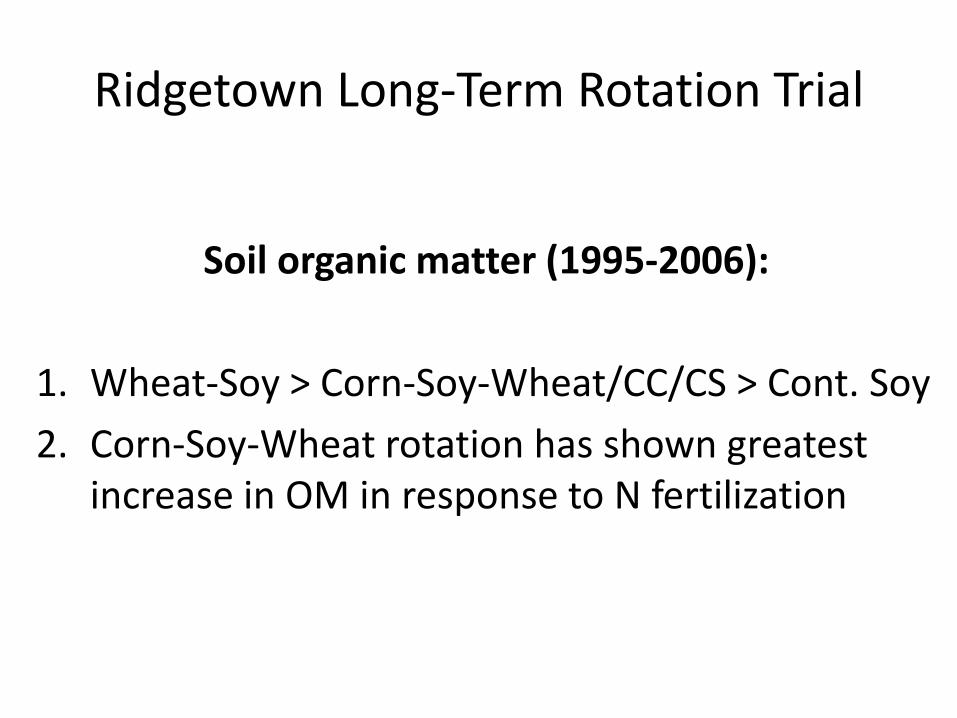
Ridgetown Long-Term Rotation Trial
Soil organic matter (1995-2006):
1. Wheat-Soy > Corn-Soy-Wheat/CC/CS > Cont. Soy
2. Corn-Soy-Wheat rotation has shown greatest increase in OM in response to N fertilization
How does a more diverse crop rotation increase soil organic matter?
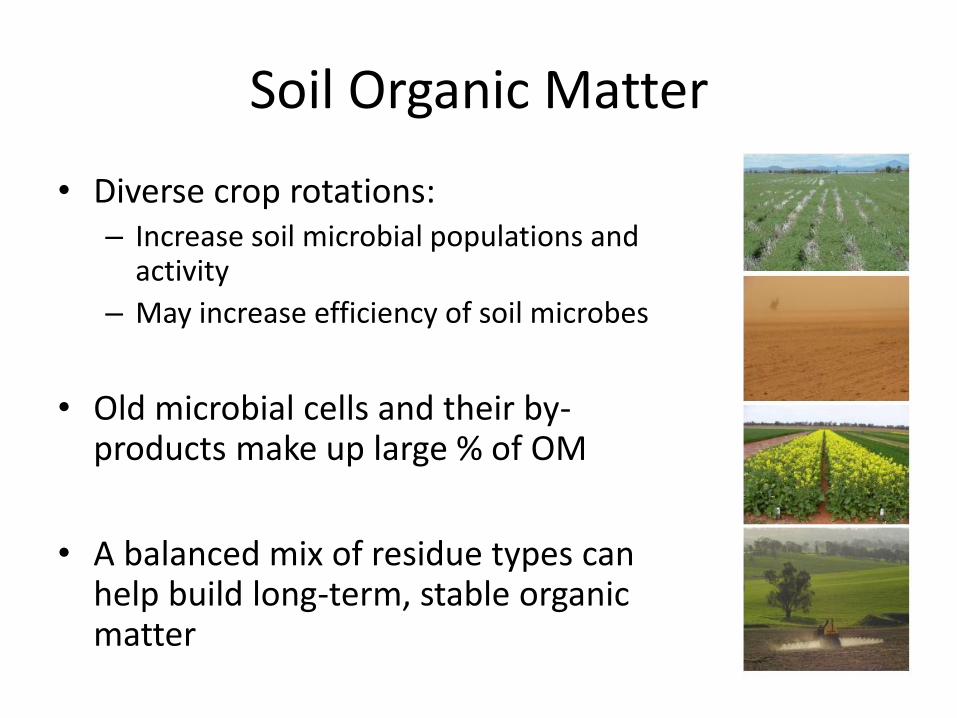
Soil Organic Matter
• Diverse crop rotations: – Increase soil microbial populations and
activity
– May increase efficiency of soil microbes
• Old microbial cells and their by-products make up large % of OM
• A balanced mix of residue types can
help build long-term, stable organic matter
Benefits of a Diverse Crop Rotation
• Improved soil health
• More stable yields (and income)
• Reduced N requirements and improved N use efficiency
• Others…?
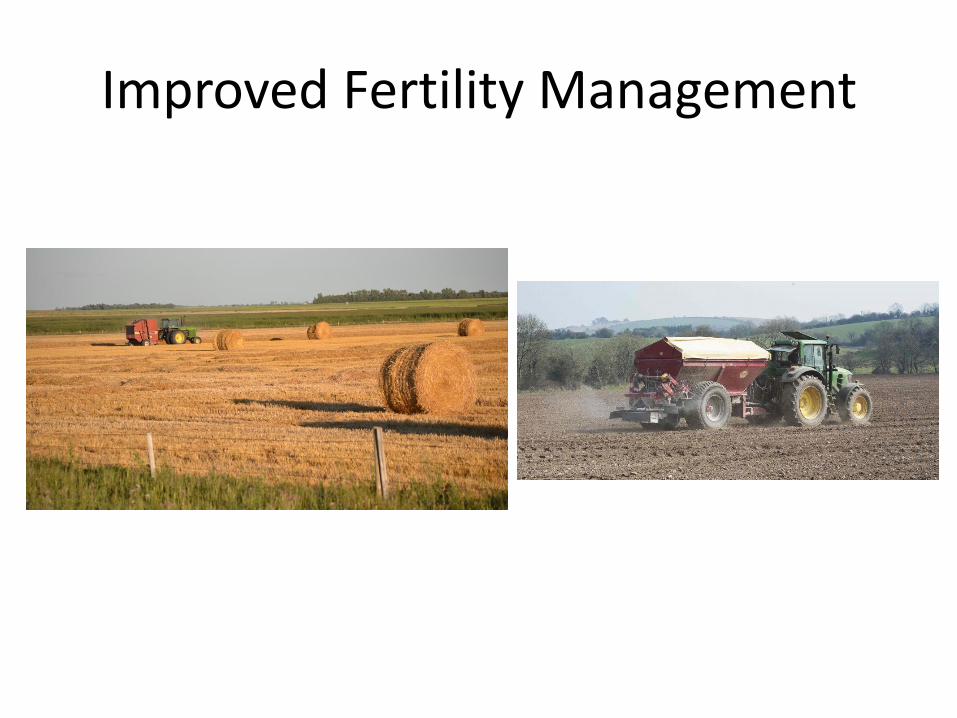
Improved Fertility Management
Does having winter wheat/cereals in the rotation pay?
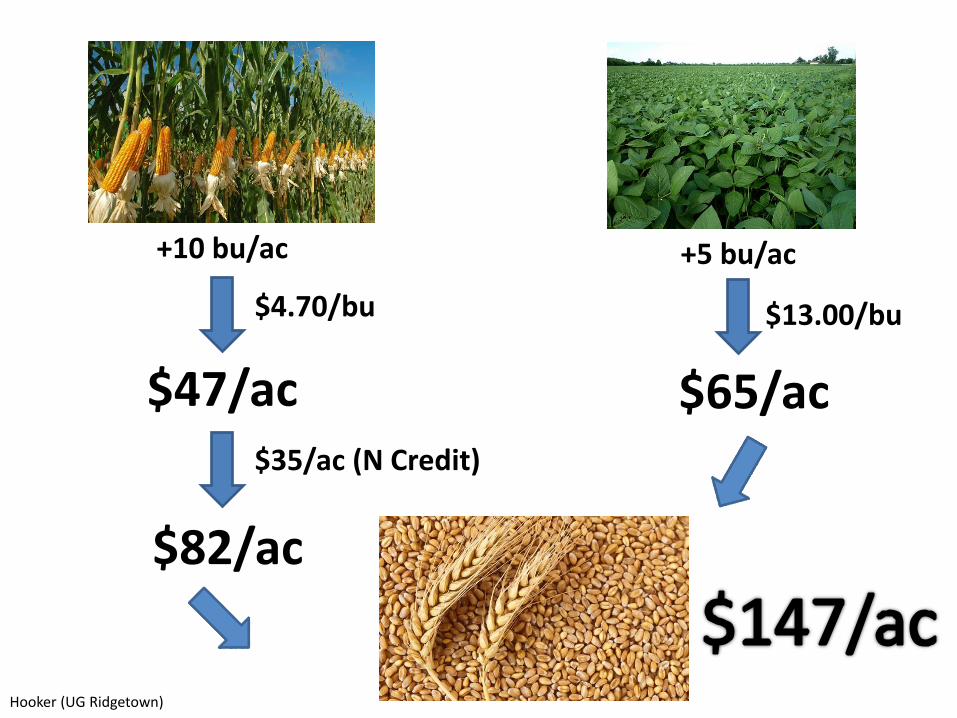
+10 bu/ac +5 bu/ac
$4.70/bu $13.00/bu
$47/ac $65/ac $35/ac (N Credit)
$82/ac
Hooker (UG Ridgetown)
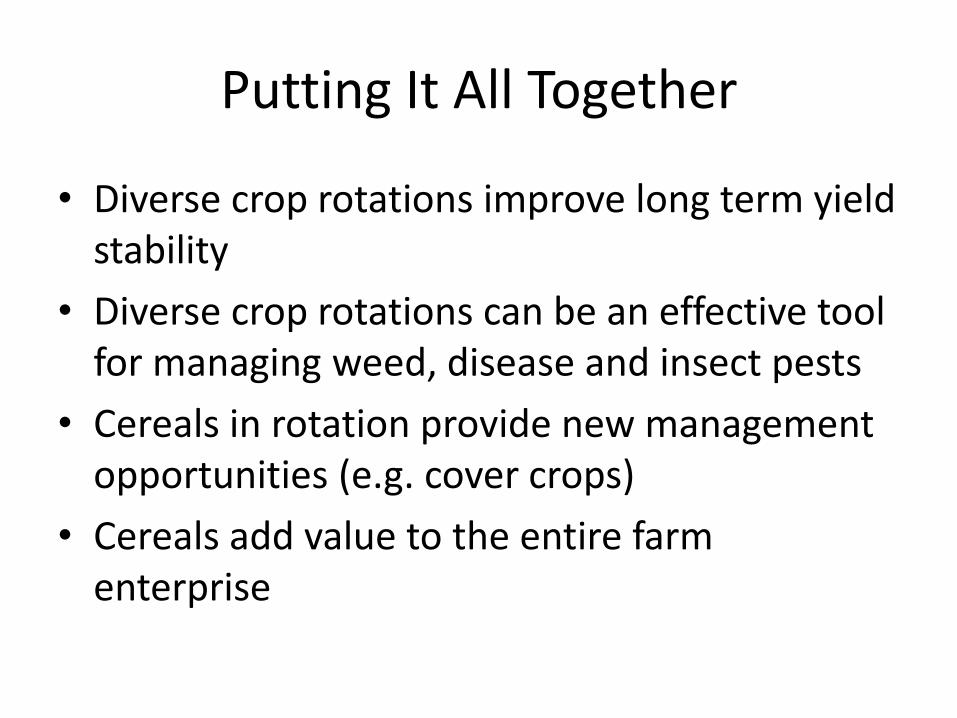
Putting It All Together
• Diverse crop rotations improve long term yield stability
• Diverse crop rotations can be an effective tool for managing weed, disease and insect pests
• Cereals in rotation provide new management opportunities (e.g. cover crops)
• Cereals add value to the entire farm enterprise
Questions?
Jake Munroe Soil Fertility Specialist (Field Crops)
519-271-9269 [email protected] Twitter: @onfieldcrops
Joanna Follings Cereals Specialist
519-271-8180 [email protected]
Twitter: @jofollings
www.fieldcropnews.com


![[Myles Munroe] Releasing Your Potential Exposing (BookZZ.org)](https://img.pdfslide.net/doc/110x75/55cf9411550346f57b9f682c/myles-munroe-releasing-your-potential-exposing-bookzzorg.jpg)