Embed Size (px)
Citation preview
Latin American Trends and Their Impact on
Food Industry
June 2014
Presented to: Enfocando Chile 2014

2 9833-88 Confidential - Property of Frost &
Sullivan
Presentation Guide
3 9833-88 Confidential - Property of Frost &
Sullivan 3 3
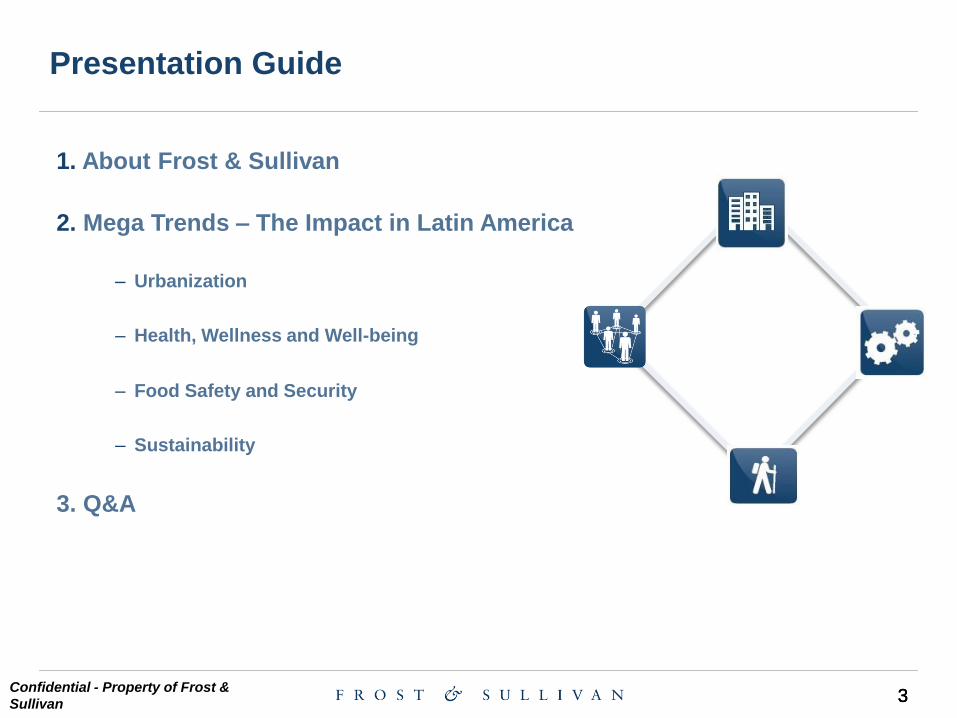
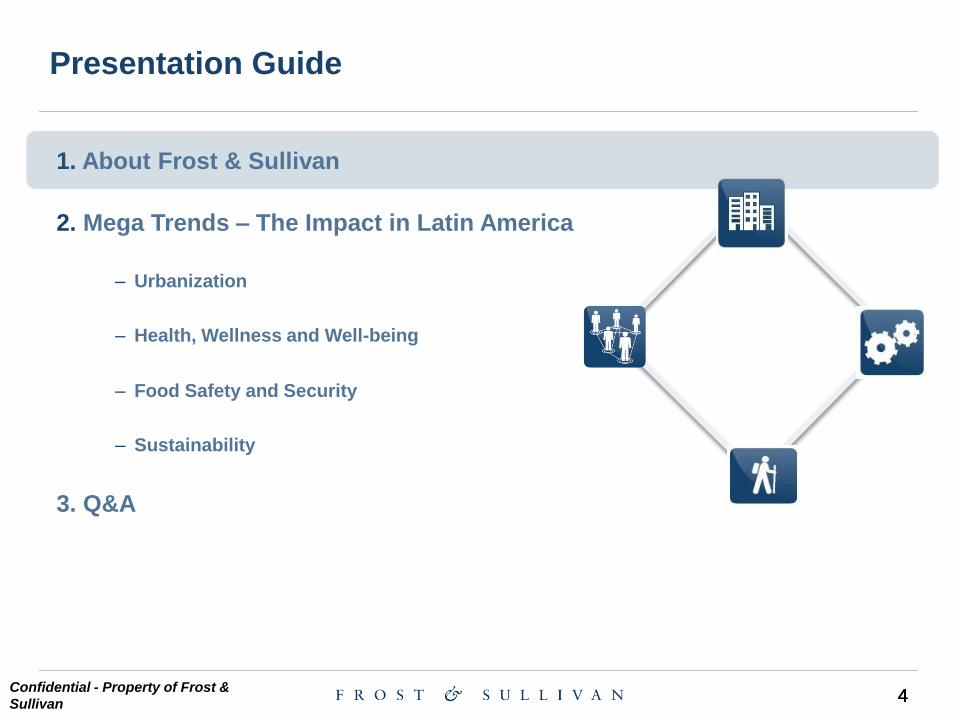
Presentation Guide
1. About Frost & Sullivan
2. Mega Trends – The Impact in Latin America
– Urbanization
– Health, Wellness and Well-being
– Food Safety and Security
– Sustainability
3. Q&A
4 9833-88 Confidential - Property of Frost &
Sullivan 4 4
Presentation Guide
1. About Frost & Sullivan
2. Mega Trends – The Impact in Latin America
– Urbanization
– Health, Wellness and Well-being
– Food Safety and Security
– Sustainability
3. Q&A
5 9833-88 Confidential - Property of Frost &
Sullivan
About Frost & Sullivan
9 9833-88 Confidential - Property of Frost &
Sullivan 9 9
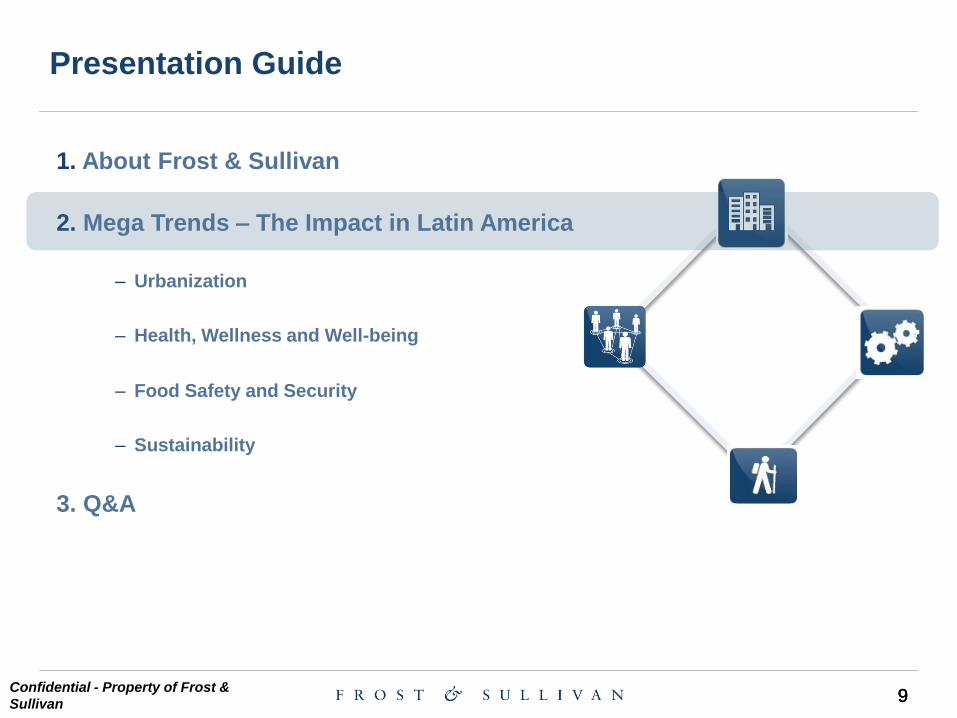
Presentation Guide
1. About Frost & Sullivan
2. Mega Trends – The Impact in Latin America
– Urbanization
– Health, Wellness and Well-being
– Food Safety and Security
– Sustainability
3. Q&A
10 9833-88 Confidential - Property of Frost &
Sullivan
Mega Trends
11 9833-88 Confidential - Property of Frost &
Sullivan 11 11
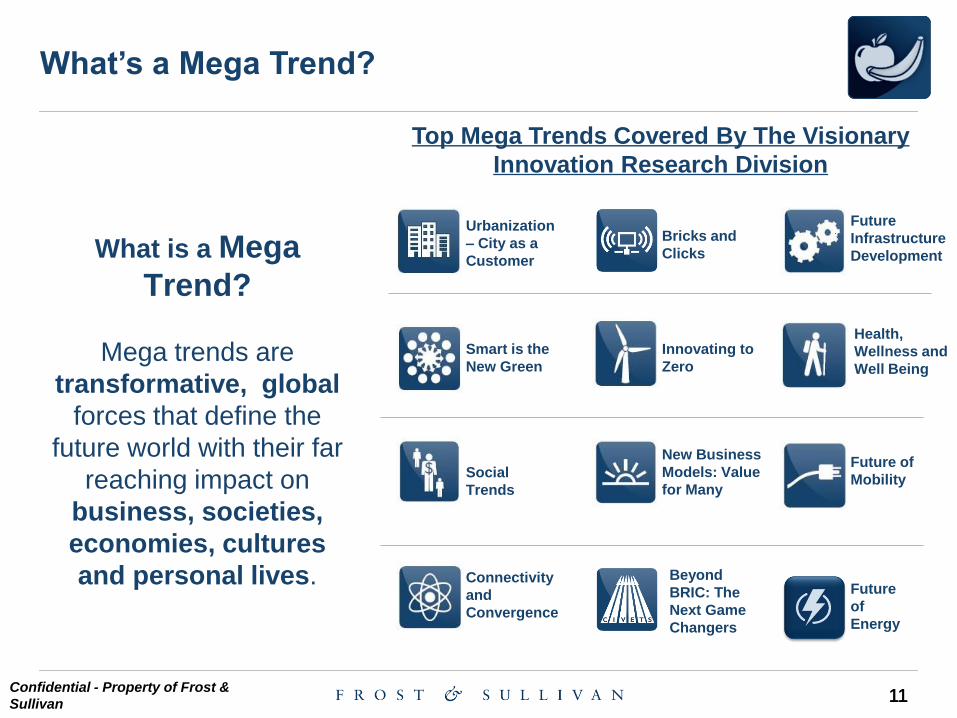
What is a Mega
Trend?
Mega trends are
transformative, global
forces that define the
future world with their far
reaching impact on
business, societies,
economies, cultures
and personal lives.
Urbanization
– City as a
Customer
Smart is the
New Green
Social
Trends
Connectivity
and
Convergence
Bricks and
Clicks
Innovating to
Zero
New Business
Models: Value
for Many
Beyond
BRIC: The
Next Game
Changers
Future
Infrastructure
Development
Health,
Wellness and
Well Being
Future of
Mobility
Top Mega Trends Covered By The Visionary
Innovation Research Division
Future
of
Energy
What’s a Mega Trend?
12 9833-88 Confidential - Property of Frost &
Sullivan
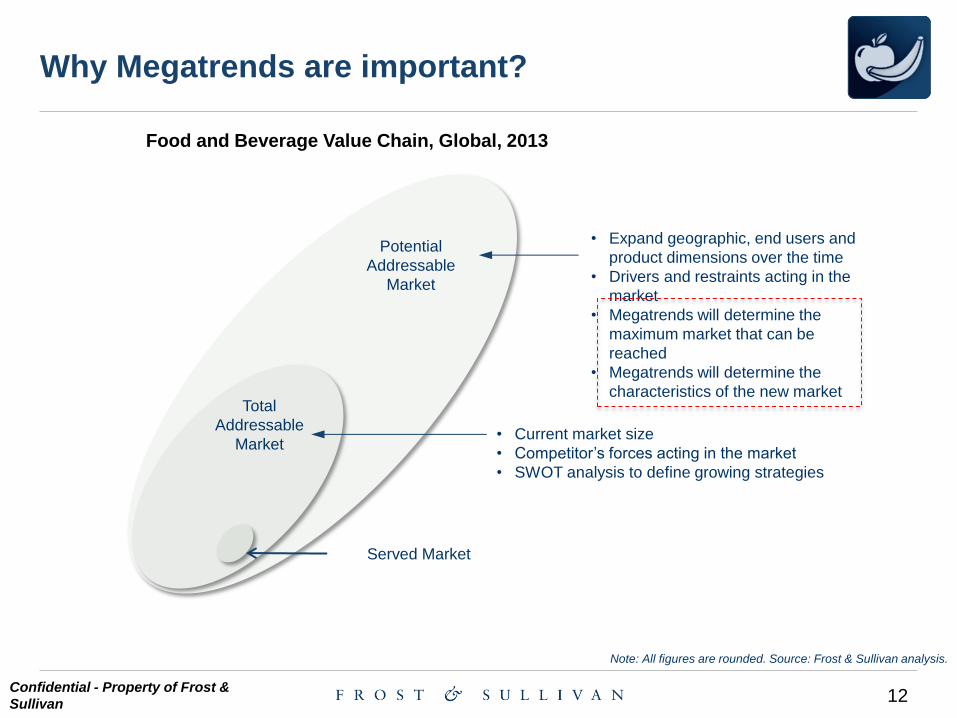
Served Market
• Expand geographic, end users and
product dimensions over the time
• Drivers and restraints acting in the
market
• Megatrends will determine the
maximum market that can be
reached
• Megatrends will determine the
characteristics of the new market
• Current market size
• Competitor’s forces acting in the market
• SWOT analysis to define growing strategies
Note: All figures are rounded. Source: Frost & Sullivan analysis.
Food and Beverage Value Chain, Global, 2013
Introduction
Potential
Addressable
Market
Total
Addressable
Market
Why Megatrends are important?
13 9833-88 Confidential - Property of Frost &
Sullivan
Food
Safety
Globalization and Changing Economy
Health &
Wellness
Sustainability
Consumer
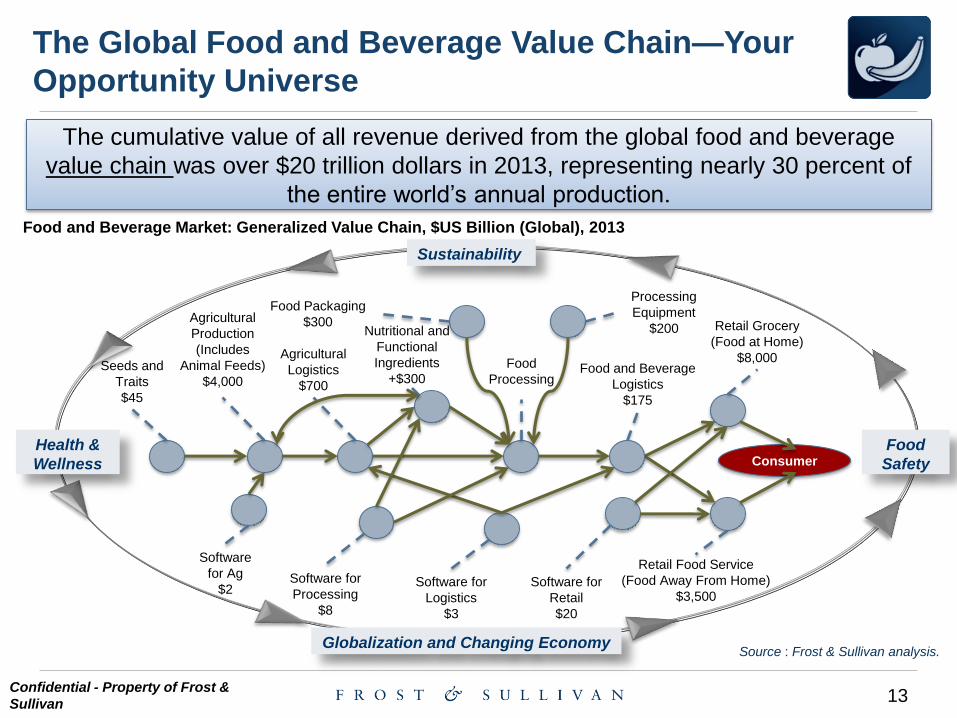
Seeds and
Traits
$45
Agricultural
Production
(Includes
Animal Feeds)
$4,000
Agricultural
Logistics
$700
Food and Beverage
Logistics
$175
Retail Grocery
(Food at Home)
$8,000
Retail Food Service
(Food Away From Home)
$3,500
Food
Processing
Software
for Ag
$2 Software for
Logistics
$3
Software for
Processing
$8
Software for
Retail
$20
Food Packaging
$300
Processing
Equipment
$200 Nutritional and
Functional
Ingredients
+$300
The cumulative value of all revenue derived from the global food and beverage
value chain was over $20 trillion dollars in 2013, representing nearly 30 percent of
the entire world’s annual production.
The Global Food and Beverage Value Chain—Your
Opportunity Universe
Food and Beverage Market: Generalized Value Chain, $US Billion (Global), 2013
Source : Frost & Sullivan analysis.
14 9833-88 Confidential - Property of Frost &
Sullivan
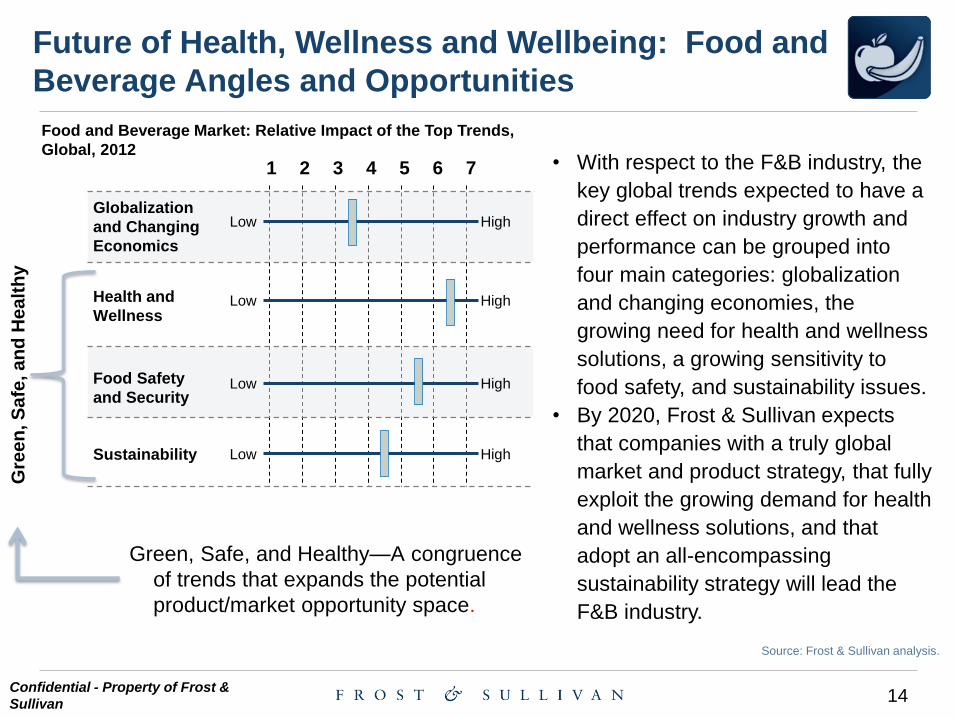
• With respect to the F&B industry, the
key global trends expected to have a
direct effect on industry growth and
performance can be grouped into
four main categories: globalization
and changing economies, the
growing need for health and wellness
solutions, a growing sensitivity to
food safety, and sustainability issues.
• By 2020, Frost & Sullivan expects
that companies with a truly global
market and product strategy, that fully
exploit the growing demand for health
and wellness solutions, and that
adopt an all-encompassing
sustainability strategy will lead the
F&B industry.
Food and Beverage Market: Relative Impact of the Top Trends,
Global, 2012
1 5 2 3 4 7 6
Low High
Low High Food Safety
and Security
Globalization
and Changing
Economics
Low High Sustainability
Low High Health and
Wellness
Source: Frost & Sullivan analysis.
Gre
en
, S
afe
, a
nd
He
alt
hy
Green, Safe, and Healthy—A congruence
of trends that expands the potential
product/market opportunity space.
Future of Health, Wellness and Wellbeing: Food and
Beverage Angles and Opportunities
15 9833-88 Confidential - Property of Frost &
Sullivan
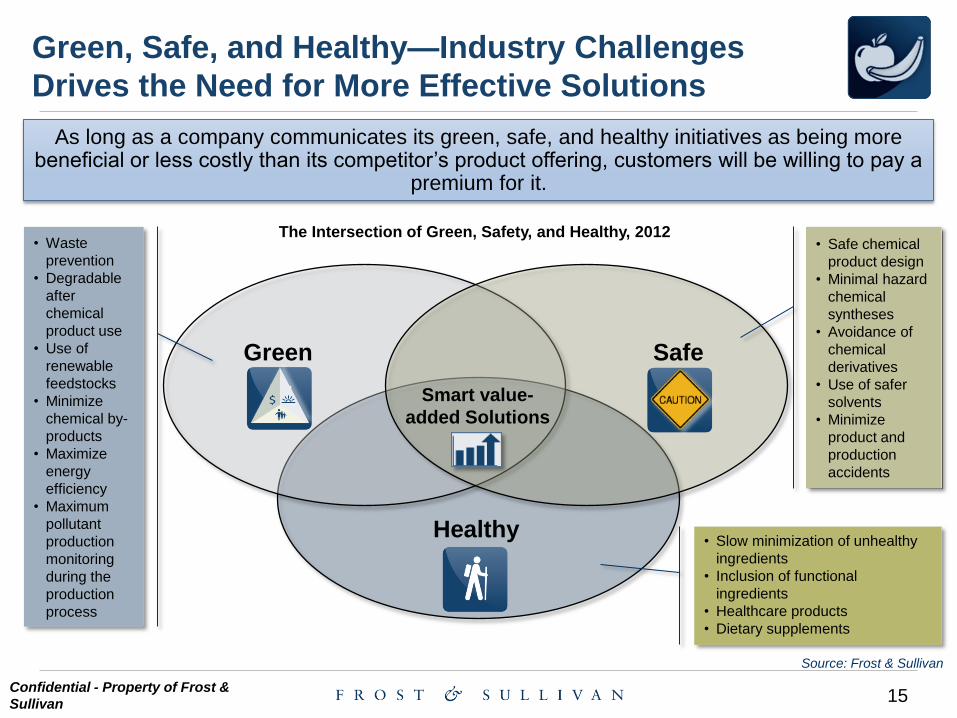
As long as a company communicates its green, safe, and healthy initiatives as being more beneficial or less costly than its competitor’s product offering, customers will be willing to pay a
premium for it.
Source: Frost & Sullivan
Green Safe
Healthy
• Waste
prevention
• Degradable
after
chemical
product use
• Use of
renewable
feedstocks
• Minimize
chemical by-
products
• Maximize
energy
efficiency
• Maximum
pollutant
production
monitoring
during the
production
process
• Slow minimization of unhealthy
ingredients
• Inclusion of functional
ingredients
• Healthcare products
• Dietary supplements
Smart value-
added Solutions
• Safe chemical
product design
• Minimal hazard
chemical
syntheses
• Avoidance of
chemical
derivatives
• Use of safer
solvents
• Minimize
product and
production
accidents
Green, Safe, and Healthy—Industry Challenges
Drives the Need for More Effective Solutions
The Intersection of Green, Safety, and Healthy, 2012
16 9833-88 Confidential - Property of Frost &
Sullivan
Globalization & Changing Economy
17 9833-88 Confidential - Property of Frost &
Sullivan
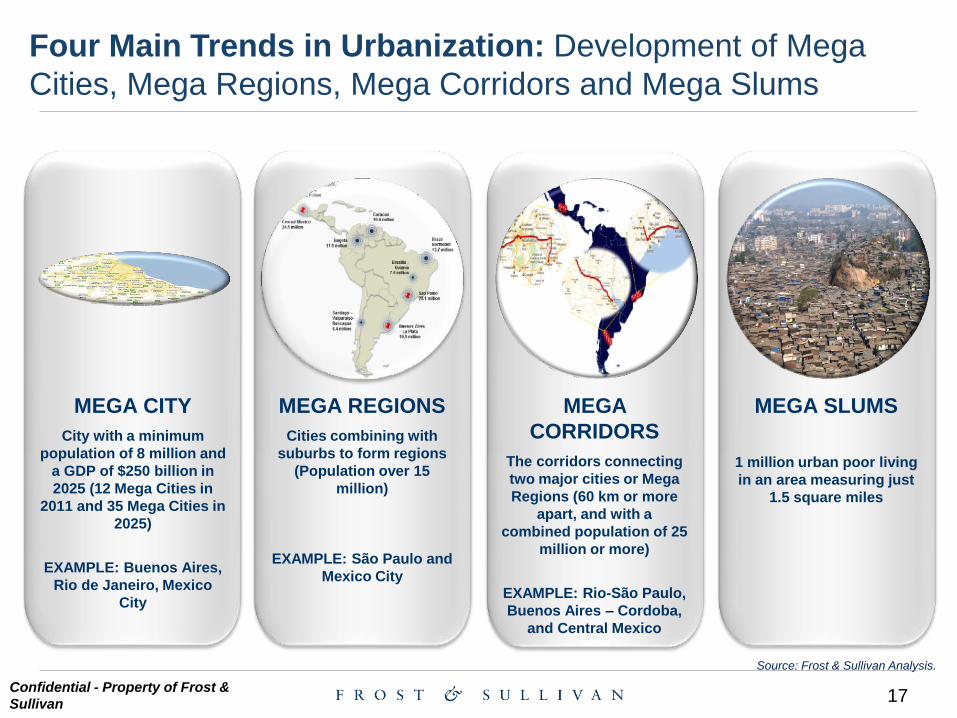
Four Main Trends in Urbanization: Development of Mega
Cities, Mega Regions, Mega Corridors and Mega Slums
MEGA REGIONS
Cities combining with
suburbs to form regions
(Population over 15
million)
EXAMPLE: São Paulo and
Mexico City
MEGA
CORRIDORS
The corridors connecting
two major cities or Mega
Regions (60 km or more
apart, and with a
combined population of 25
million or more)
EXAMPLE: Rio-São Paulo,
Buenos Aires – Cordoba,
and Central Mexico
MEGA CITY
City with a minimum
population of 8 million and
a GDP of $250 billion in
2025 (12 Mega Cities in
2011 and 35 Mega Cities in
2025)
EXAMPLE: Buenos Aires,
Rio de Janeiro, Mexico
City
MEGA SLUMS
1 million urban poor living
in an area measuring just
1.5 square miles
Source: Frost & Sullivan Analysis.
18 9833-88 Confidential - Property of Frost &
Sullivan
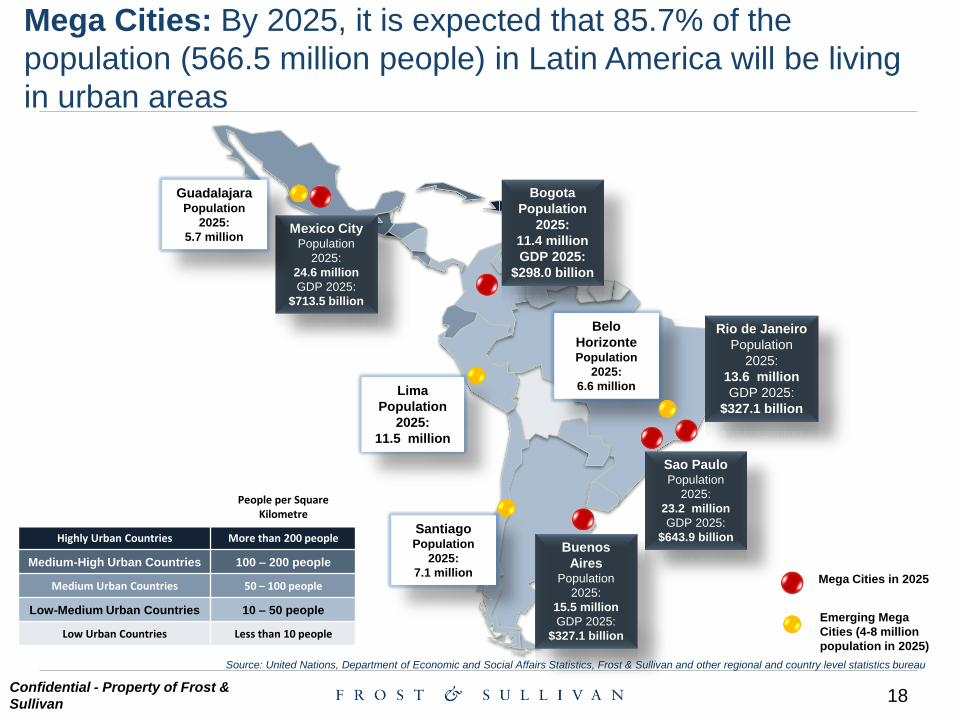
Mega Cities: By 2025, it is expected that 85.7% of the
population (566.5 million people) in Latin America will be living
in urban areas
People per Square Kilometre
Highly Urban Countries More than 200 people
Medium-High Urban Countries 100 – 200 people
Medium Urban Countries 50 – 100 people
Low-Medium Urban Countries 10 – 50 people
Low Urban Countries Less than 10 people
Mexico City Population
2025:
24.6 million
GDP 2025:
$713.5 billion
Bogota
Population
2025:
11.4 million
GDP 2025:
$298.0 billion
Rio de Janeiro
Population
2025:
13.6 million
GDP 2025:
$327.1 billion
Buenos
Aires Population
2025:
15.5 million
GDP 2025:
$327.1 billion
Sao Paulo Population
2025:
23.2 million
GDP 2025:
$643.9 billion
Mega Cities in 2025
Emerging Mega
Cities (4-8 million
population in 2025)
Santiago Population
2025:
7.1 million
Belo
Horizonte Population
2025:
6.6 million
Guadalajara Population
2025:
5.7 million
Source: United Nations, Department of Economic and Social Affairs Statistics, Frost & Sullivan and other regional and country level statistics bureau
Lima
Population
2025:
11.5 million
19 9833-88 Confidential - Property of Frost &
Sullivan
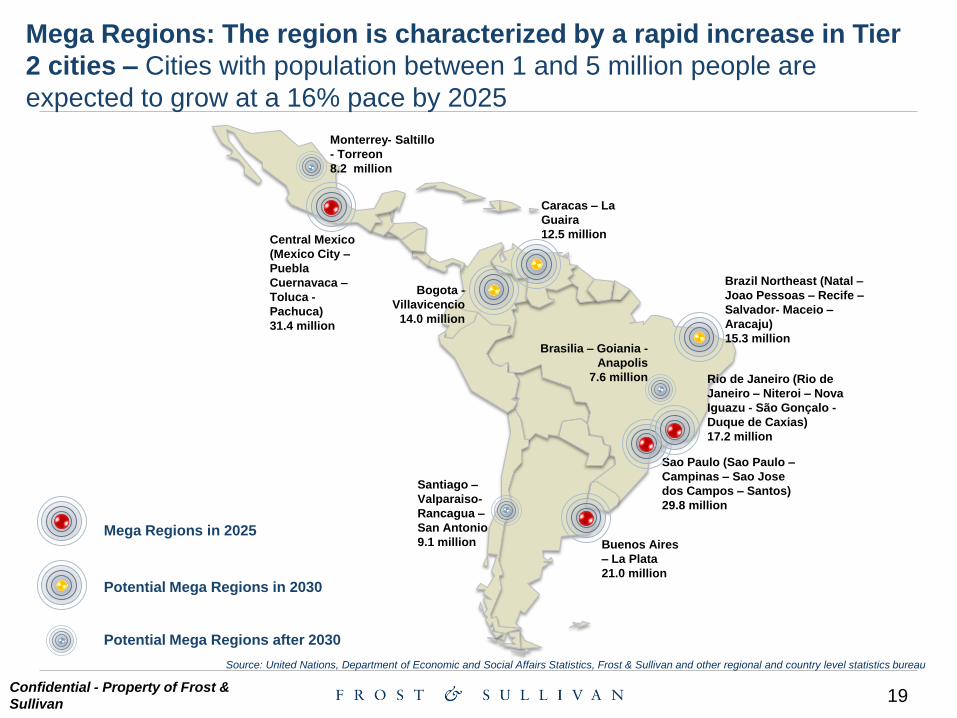
Mega Regions: The region is characterized by a rapid increase in Tier
2 cities – Cities with population between 1 and 5 million people are
expected to grow at a 16% pace by 2025
Source: United Nations, Department of Economic and Social Affairs Statistics, Frost & Sullivan and other regional and country level statistics bureau
Sao Paulo (Sao Paulo –
Campinas – Sao Jose
dos Campos – Santos)
29.8 million
Buenos Aires
– La Plata
21.0 million
Central Mexico
(Mexico City –
Puebla
Cuernavaca –
Toluca -
Pachuca)
31.4 million
Monterrey- Saltillo
- Torreon
8.2 million
Santiago –
Valparaiso-
Rancagua –
San Antonio
9.1 million
Brazil Northeast (Natal –
Joao Pessoas – Recife –
Salvador- Maceio –
Aracaju)
15.3 million
Caracas – La
Guaira
12.5 million
Bogota -
Villavicencio
14.0 million
Brasilia – Goiania -
Anapolis
7.6 million
Potential Mega Regions after 2030
Mega Regions in 2025
Potential Mega Regions in 2030
Rio de Janeiro (Rio de
Janeiro – Niteroi – Nova
Iguazu - São Gonçalo -
Duque de Caxias)
17.2 million
20 9833-88 Confidential - Property of Frost &
Sullivan
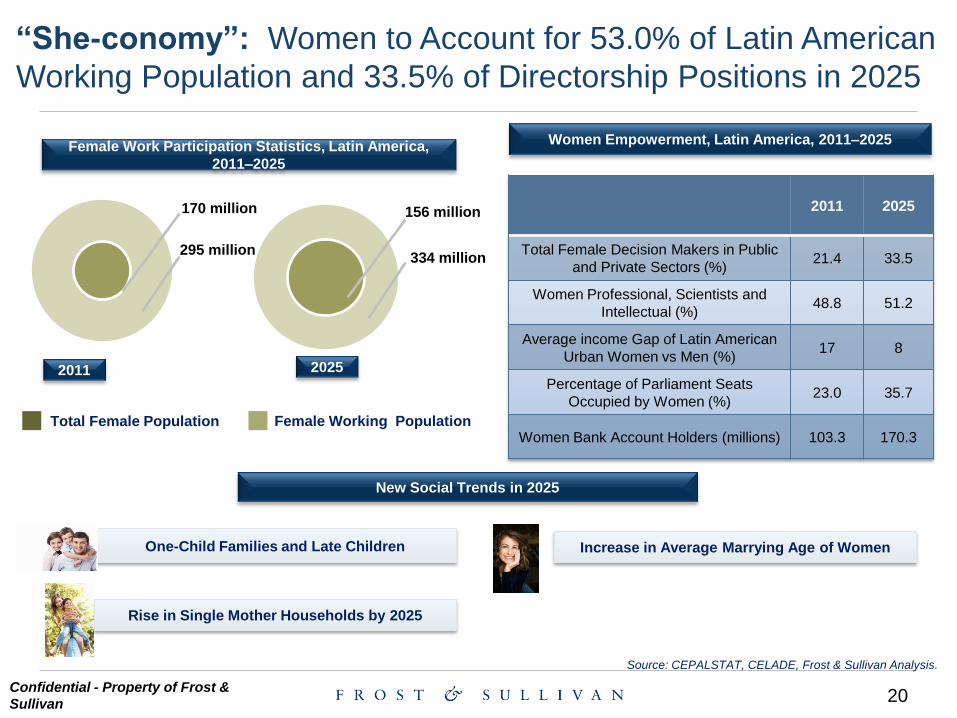
“She-conomy”: Women to Account for 53.0% of Latin American
Working Population and 33.5% of Directorship Positions in 2025
2011 2025
Total Female Decision Makers in Public
and Private Sectors (%) 21.4 33.5
Women Professional, Scientists and
Intellectual (%) 48.8 51.2
Average income Gap of Latin American
Urban Women vs Men (%) 17 8
Percentage of Parliament Seats
Occupied by Women (%) 23.0 35.7
Women Bank Account Holders (millions) 103.3 170.3
Women Empowerment, Latin America, 2011–2025
Source: CEPALSTAT, CELADE, Frost & Sullivan Analysis.
Rise in Single Mother Households by 2025
2025
Female Work Participation Statistics, Latin America,
2011–2025
2011
170 million
295 million
156 million
334 million
Total Female Population Female Working Population
One-Child Families and Late Children
New Social Trends in 2025
Increase in Average Marrying Age of Women
21 9833-88 Confidential - Property of Frost &
Sullivan
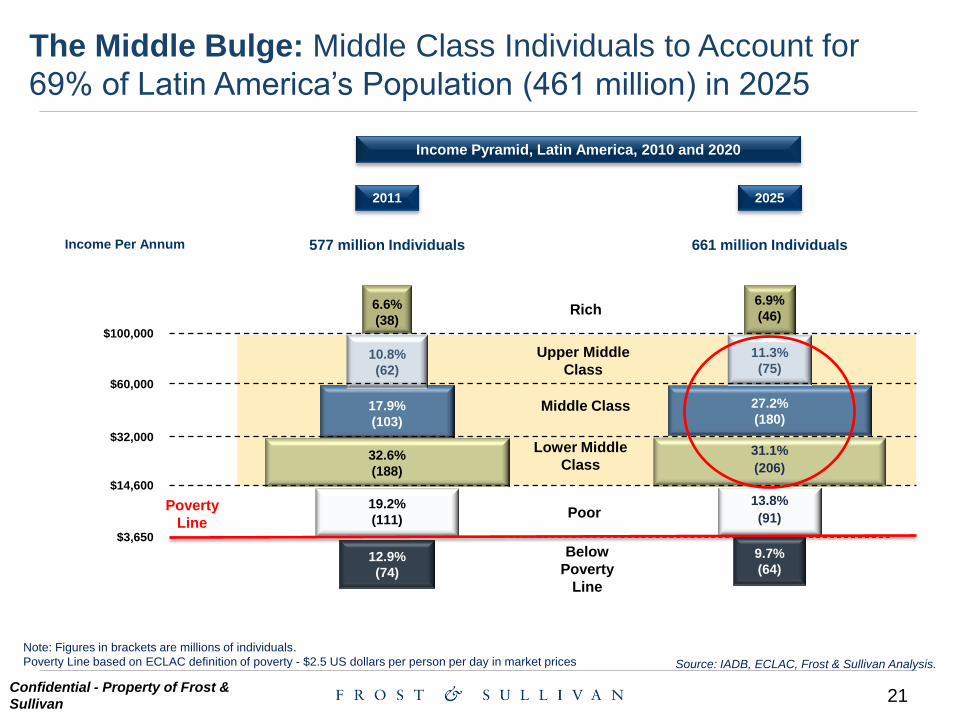
The Middle Bulge: Middle Class Individuals to Account for
69% of Latin America’s Population (461 million) in 2025
Source: IADB, ECLAC, Frost & Sullivan Analysis.
Note: Figures in brackets are millions of individuals.
Poverty Line based on ECLAC definition of poverty - $2.5 US dollars per person per day in market prices
2025
661 million Individuals
2011
577 million Individuals
$32,000
$14,600
$60,000
$3,650
$100,000
10.8%
(62)
Below
Poverty
Line
Poor
Lower Middle
Class
Middle Class
Upper Middle
Class
Rich
31.1%
(206)
9.7%
(64)
13.8%
(91)
27.2%
(180)
11.3%
(75)
Income Per Annum
Poverty
Line
12.9%
(74)
32.6%
(188)
6.6%
(38)
19.2%
(111)
17.9%
(103)
6.9%
(46)
Income Pyramid, Latin America, 2010 and 2020
22 9833-88 Confidential - Property of Frost &
Sullivan
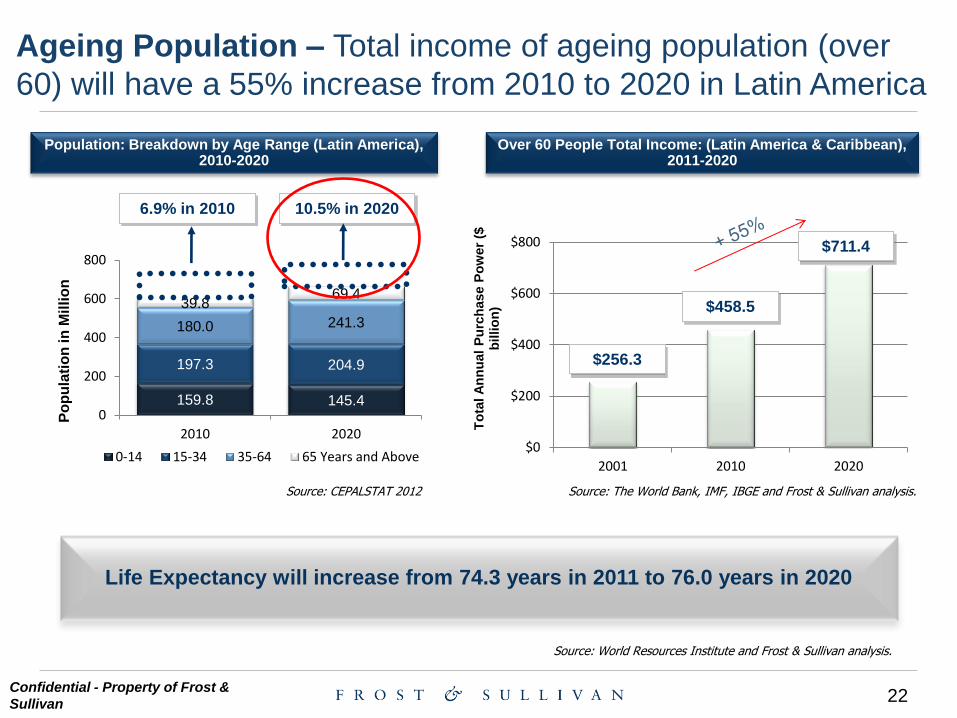
159.8 145.4
197.3 204.9
180.0 241.3
39.8 69.4
0
200
400
600
800
2010 2020
Po
pu
lati
on
in
Mil
lio
n
0-14 15-34 35-64 65 Years and Above
Life Expectancy will increase from 74.3 years in 2011 to 76.0 years in 2020
$0
$200
$400
$600
$800
2001 2010 2020T
ota
l A
nn
ual
Pu
rch
ase P
ow
er
($
billio
n)
Ageing Population – Total income of ageing population (over
60) will have a 55% increase from 2010 to 2020 in Latin America
Over 60 People Total Income: (Latin America & Caribbean), 2011-2020
$458.5
$711.4
Population: Breakdown by Age Range (Latin America), 2010-2020
6.9% in 2010 10.5% in 2020
Source: World Resources Institute and Frost & Sullivan analysis.
$256.3
Source: The World Bank, IMF, IBGE and Frost & Sullivan analysis. Source: CEPALSTAT 2012
23 9833-88 Confidential - Property of Frost &
Sullivan
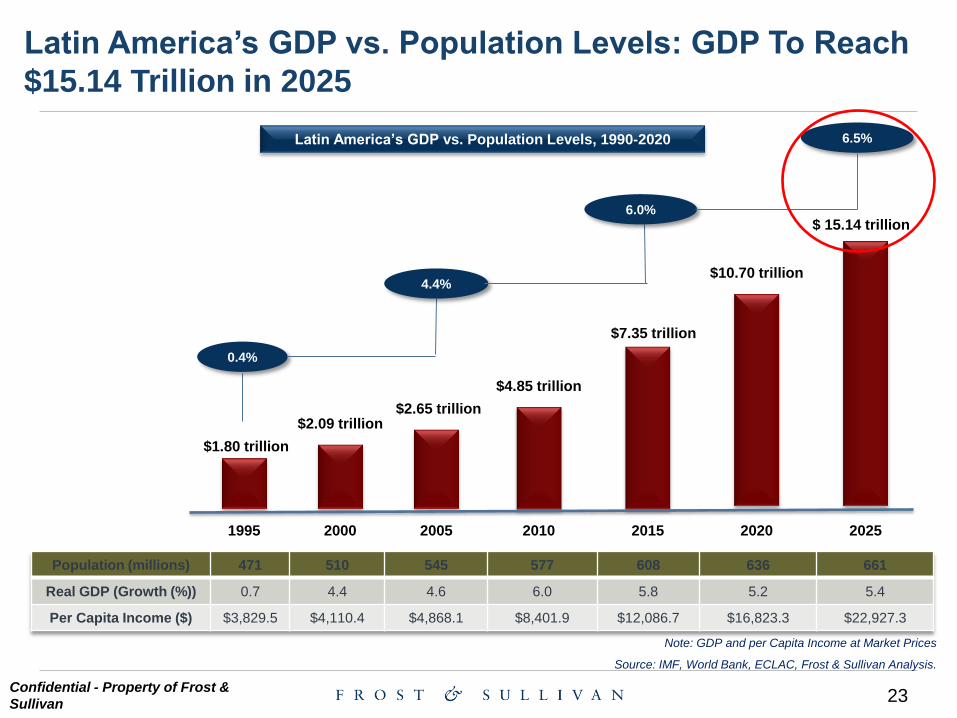
Latin America’s GDP vs. Population Levels: GDP To Reach
$15.14 Trillion in 2025
1995 2000 2005 2010 2015 2020 2025
Population (millions) 471 510 545 577 608 636 661
Real GDP (Growth (%)) 0.7 4.4 4.6 6.0 5.8 5.2 5.4
Per Capita Income ($) $3,829.5 $4,110.4 $4,868.1 $8,401.9 $12,086.7 $16,823.3 $22,927.3
$1.80 trillion
$2.65 trillion $2.09 trillion
$ 15.14 trillion
$10.70 trillion
$7.35 trillion
$4.85 trillion
Note: GDP and per Capita Income at Market Prices
Source: IMF, World Bank, ECLAC, Frost & Sullivan Analysis.
0.4%
4.4%
6.0%
6.5% Latin America’s GDP vs. Population Levels, 1990-2020
24 Confidential - Property of Frost &
Sullivan
Health & Wellness
25 9833-88 Confidential - Property of Frost &
Sullivan
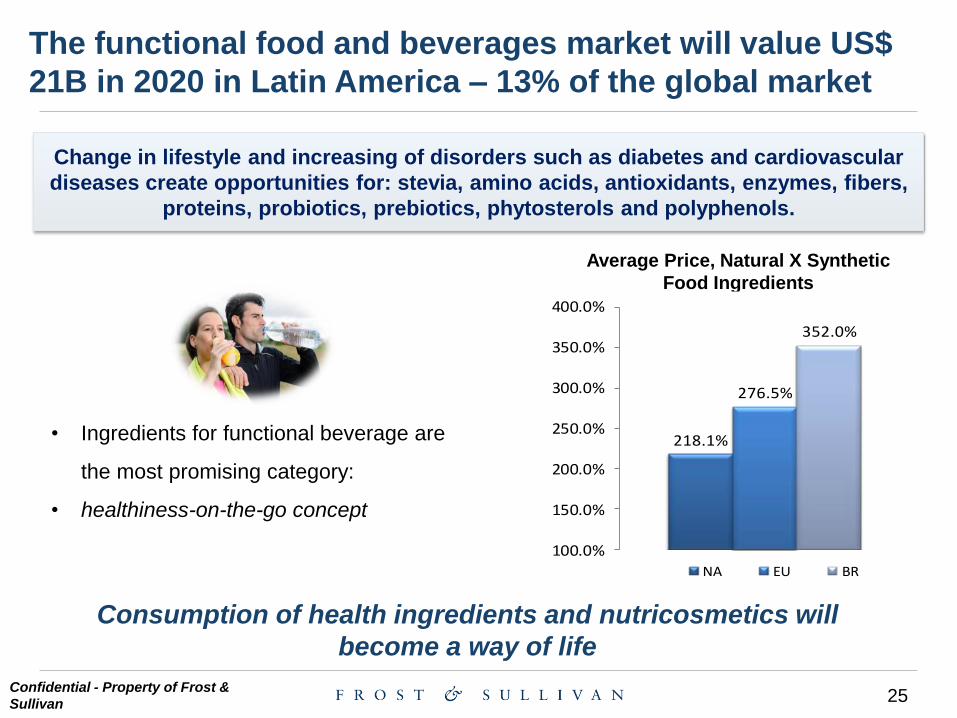
The functional food and beverages market will value US$
21B in 2020 in Latin America – 13% of the global market
Change in lifestyle and increasing of disorders such as diabetes and cardiovascular
diseases create opportunities for: stevia, amino acids, antioxidants, enzymes, fibers,
proteins, probiotics, prebiotics, phytosterols and polyphenols.
• Ingredients for functional beverage are
the most promising category:
• healthiness-on-the-go concept
Consumption of health ingredients and nutricosmetics will
become a way of life
Average Price, Natural X Synthetic
Food Ingredients
218.1%
276.5%
352.0%
100.0%
150.0%
200.0%
250.0%
300.0%
350.0%
400.0%
NA EU BR
26 9833-88 Confidential - Property of Frost &
Sullivan
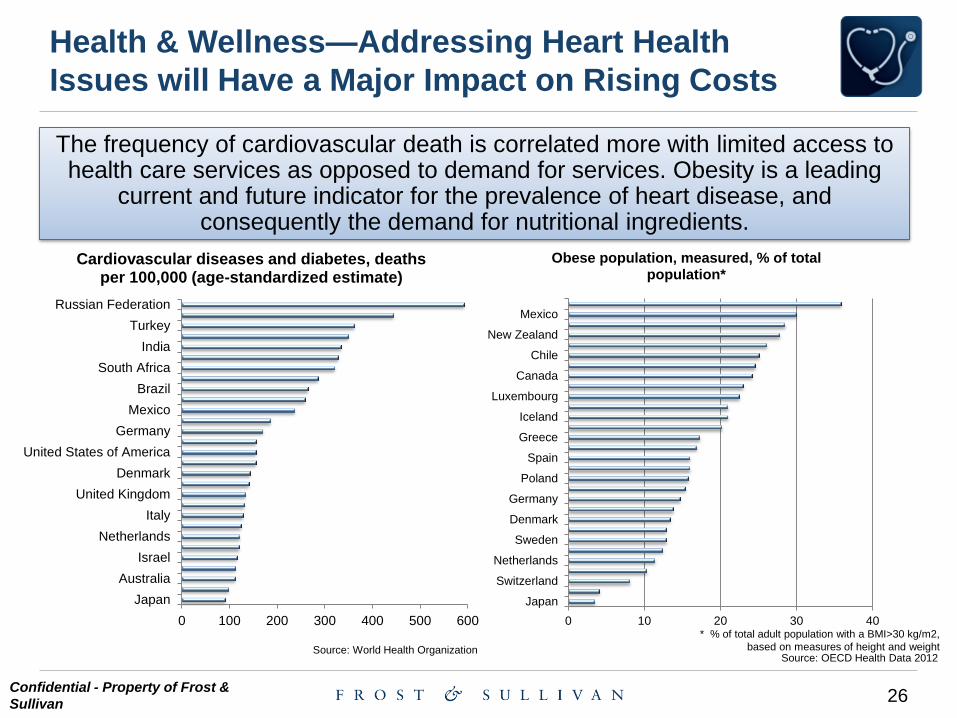
Health & Wellness—Addressing Heart Health
Issues will Have a Major Impact on Rising Costs
The frequency of cardiovascular death is correlated more with limited access to health care services as opposed to demand for services. Obesity is a leading
current and future indicator for the prevalence of heart disease, and consequently the demand for nutritional ingredients.
0 100 200 300 400 500 600
Japan
Australia
Israel
Netherlands
Italy
United Kingdom
Denmark
United States of America
Germany
Mexico
Brazil
South Africa
India
Turkey
Russian Federation
Cardiovascular diseases and diabetes, deaths per 100,000 (age-standardized estimate)
Source: World Health Organization
0 10 20 30 40
Japan
Switzerland
Netherlands
Sweden
Denmark
Germany
Poland
Spain
Greece
Iceland
Luxembourg
Canada
Chile
New Zealand
Mexico
Obese population, measured, % of total population*
Source: OECD Health Data 2012
* % of total adult population with a BMI>30 kg/m2,
based on measures of height and weight
27 9833-88 Confidential - Property of Frost &
Sullivan
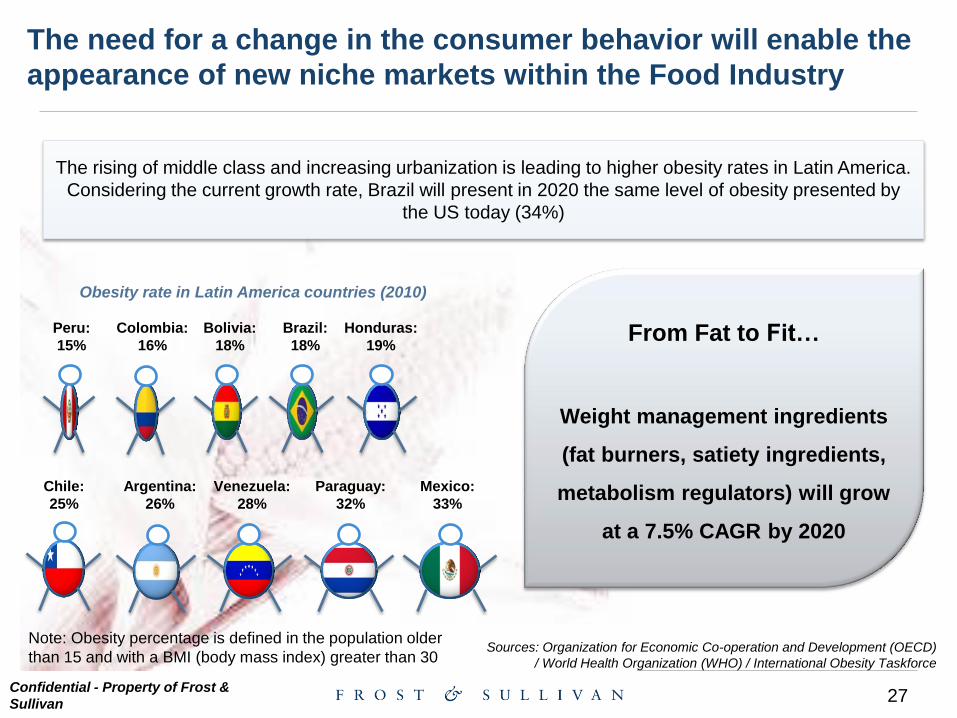
The need for a change in the consumer behavior will enable the
appearance of new niche markets within the Food Industry
Peru:
15%
Note: Obesity percentage is defined in the population older
than 15 and with a BMI (body mass index) greater than 30 Sources: Organization for Economic Co-operation and Development (OECD)
/ World Health Organization (WHO) / International Obesity Taskforce
Colombia:
16%
Bolivia:
18%
Brazil:
18%
Honduras:
19%
Chile:
25%
Argentina:
26%
Venezuela:
28%
Paraguay:
32%
Mexico:
33%
The rising of middle class and increasing urbanization is leading to higher obesity rates in Latin America.
Considering the current growth rate, Brazil will present in 2020 the same level of obesity presented by
the US today (34%)
From Fat to Fit…
Weight management ingredients
(fat burners, satiety ingredients,
metabolism regulators) will grow
at a 7.5% CAGR by 2020
Obesity rate in Latin America countries (2010)
28 9833-88 Confidential - Property of Frost &
Sullivan
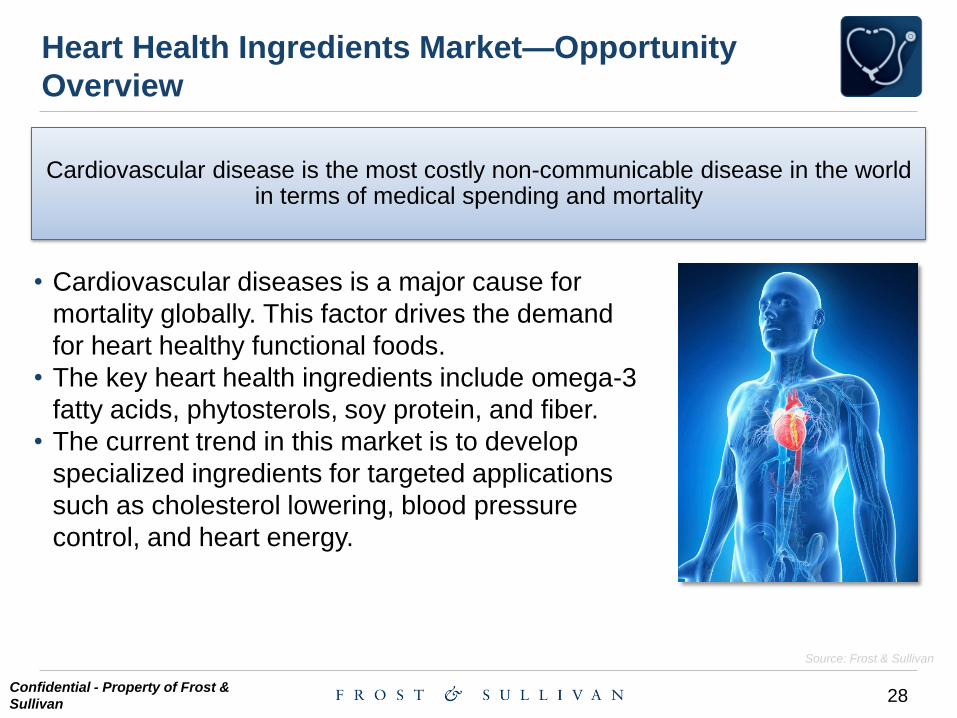
Heart Health Ingredients Market—Opportunity
Overview
• Cardiovascular diseases is a major cause for
mortality globally. This factor drives the demand
for heart healthy functional foods.
• The key heart health ingredients include omega-3
fatty acids, phytosterols, soy protein, and fiber.
• The current trend in this market is to develop
specialized ingredients for targeted applications
such as cholesterol lowering, blood pressure
control, and heart energy.
Source: Frost & Sullivan
Cardiovascular disease is the most costly non-communicable disease in the world in terms of medical spending and mortality
29 9833-88 Confidential - Property of Frost &
Sullivan
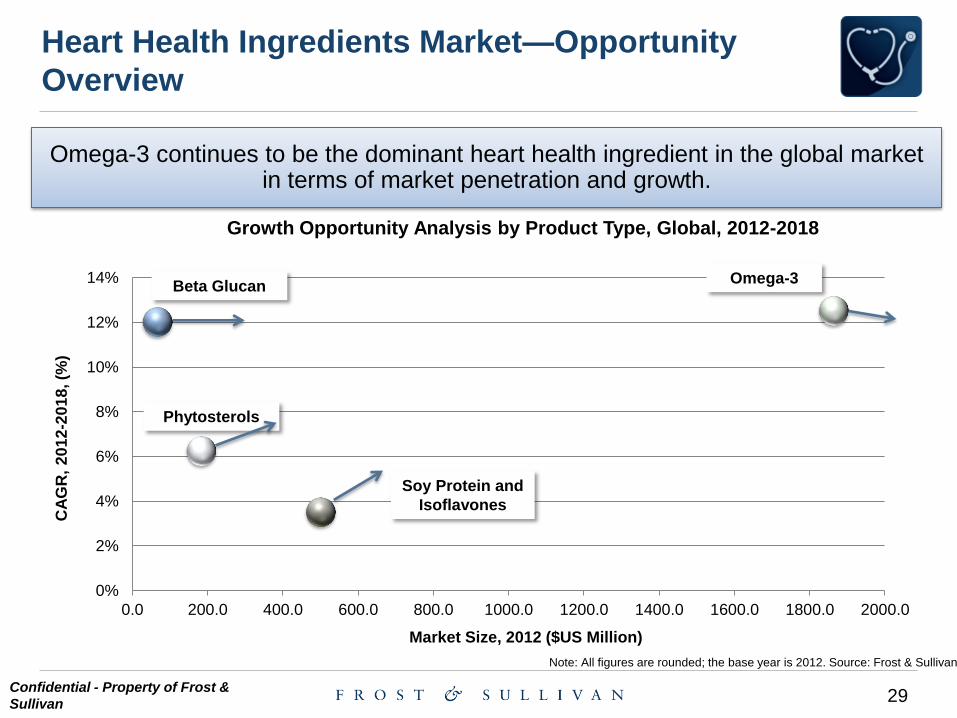
Heart Health Ingredients Market—Opportunity
Overview
Omega-3 continues to be the dominant heart health ingredient in the global market in terms of market penetration and growth.
0%
2%
4%
6%
8%
10%
12%
14%
0.0 200.0 400.0 600.0 800.0 1000.0 1200.0 1400.0 1600.0 1800.0 2000.0
CA
GR
, 2
01
2-2
01
8, (%
)
Market Size, 2012 ($US Million)
Growth Opportunity Analysis by Product Type, Global, 2012-2018
Note: All figures are rounded; the base year is 2012. Source: Frost & Sullivan
Beta Glucan Omega-3
Phytosterols
Soy Protein and
Isoflavones
30 9833-88 Confidential - Property of Frost &
Sullivan
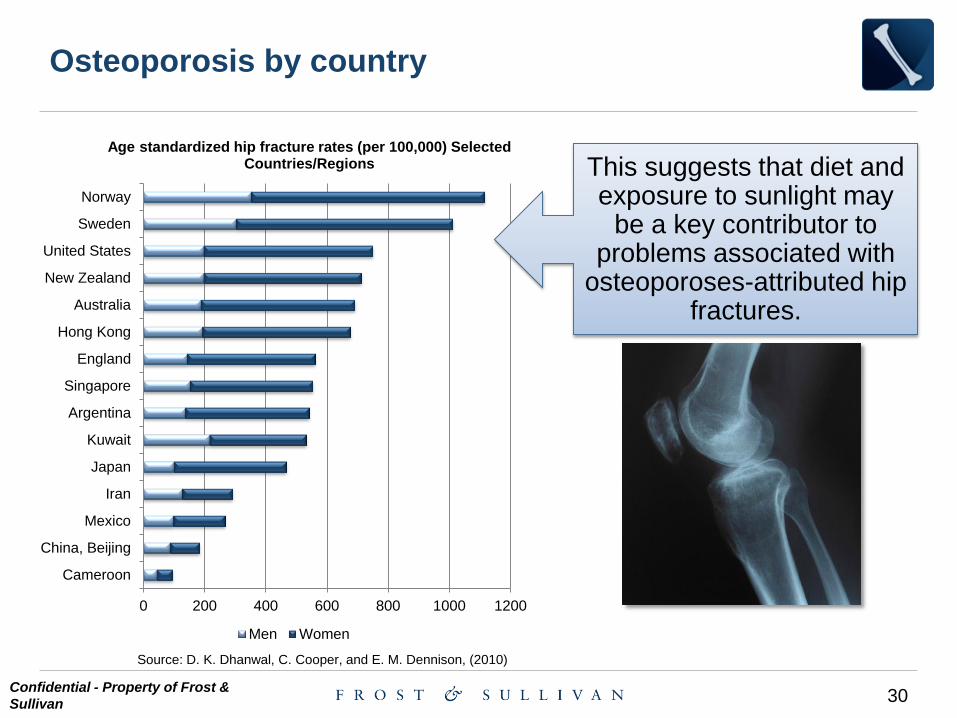
Osteoporosis by country
0 200 400 600 800 1000 1200
Cameroon
China, Beijing
Mexico
Iran
Japan
Kuwait
Argentina
Singapore
England
Hong Kong
Australia
New Zealand
United States
Sweden
Norway
Age standardized hip fracture rates (per 100,000) Selected Countries/Regions
Men Women
Source: D. K. Dhanwal, C. Cooper, and E. M. Dennison, (2010)
This suggests that diet and exposure to sunlight may
be a key contributor to problems associated with
osteoporoses-attributed hip fractures.
31 9833-88 Confidential - Property of Frost &
Sullivan
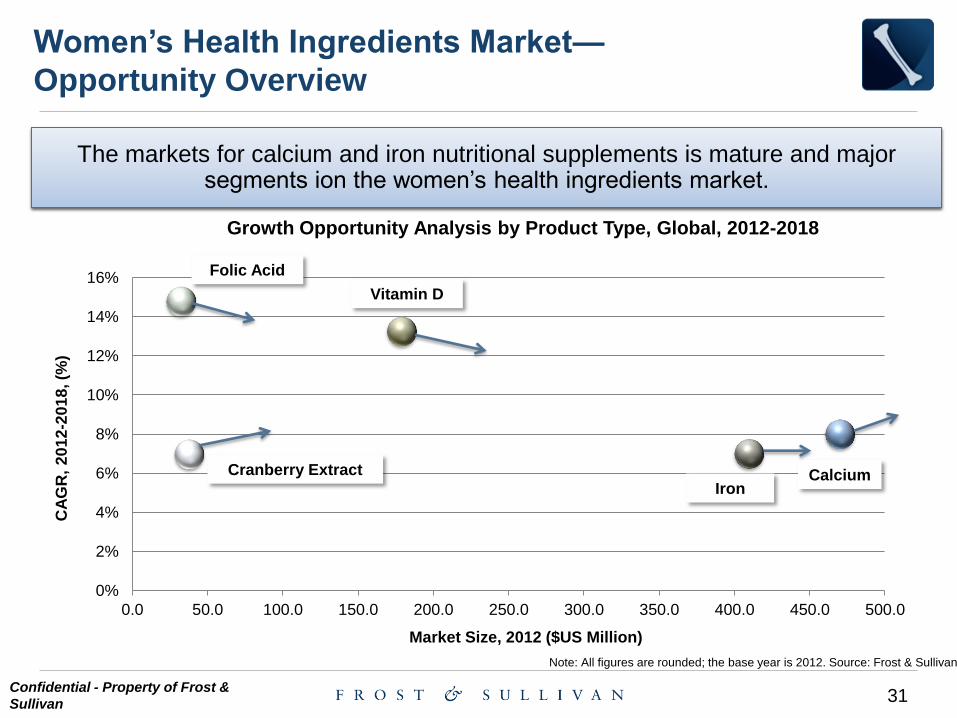
Women’s Health Ingredients Market—
Opportunity Overview
xxxxx The markets for calcium and iron nutritional supplements is mature and major
segments ion the women’s health ingredients market.
0%
2%
4%
6%
8%
10%
12%
14%
16%
0.0 50.0 100.0 150.0 200.0 250.0 300.0 350.0 400.0 450.0 500.0
CA
GR
, 2
01
2-2
01
8, (%
)
Market Size, 2012 ($US Million)
Growth Opportunity Analysis by Product Type, Global, 2012-2018
Note: All figures are rounded; the base year is 2012. Source: Frost & Sullivan
Iron Calcium
Vitamin D
Folic Acid
Cranberry Extract
32 9833-88 Confidential - Property of Frost &
Sullivan
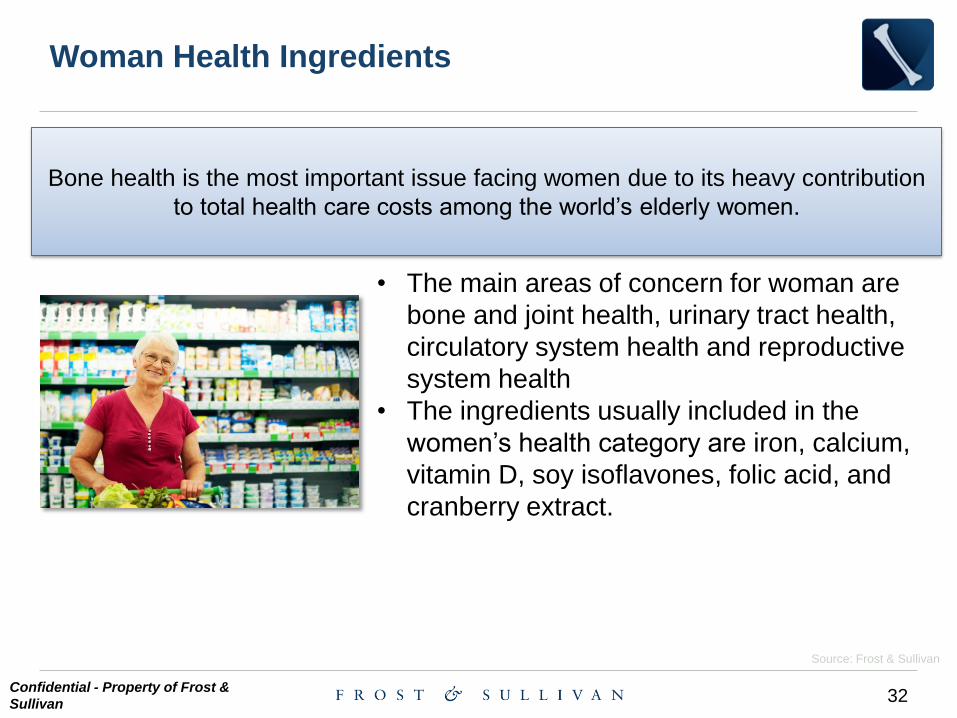
Woman Health Ingredients
• The main areas of concern for woman are
bone and joint health, urinary tract health,
circulatory system health and reproductive
system health
• The ingredients usually included in the
women’s health category are iron, calcium,
vitamin D, soy isoflavones, folic acid, and
cranberry extract.
Source: Frost & Sullivan
Bone health is the most important issue facing women due to its heavy contribution
to total health care costs among the world’s elderly women.
33 9833-88 Confidential - Property of Frost &
Sullivan
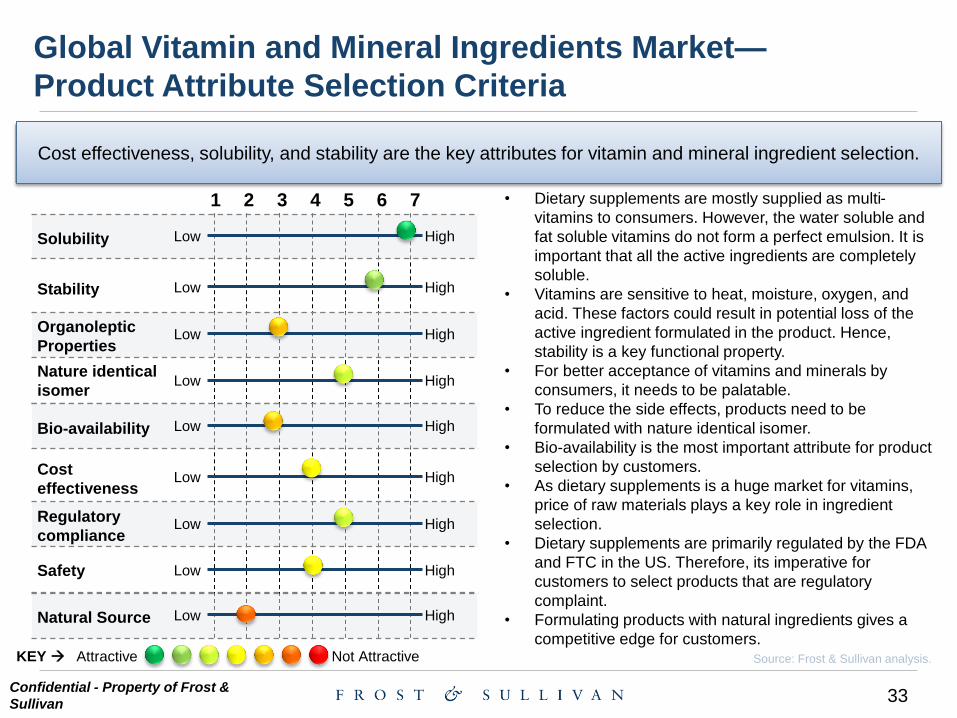
Global Vitamin and Mineral Ingredients Market—
Product Attribute Selection Criteria
Source: Frost & Sullivan analysis.
Cost effectiveness, solubility, and stability are the key attributes for vitamin and mineral ingredient selection.
1 5 2 3 4 7 6 • Dietary supplements are mostly supplied as multi-
vitamins to consumers. However, the water soluble and
fat soluble vitamins do not form a perfect emulsion. It is
important that all the active ingredients are completely
soluble.
• Vitamins are sensitive to heat, moisture, oxygen, and
acid. These factors could result in potential loss of the
active ingredient formulated in the product. Hence,
stability is a key functional property.
• For better acceptance of vitamins and minerals by
consumers, it needs to be palatable.
• To reduce the side effects, products need to be
formulated with nature identical isomer.
• Bio-availability is the most important attribute for product
selection by customers.
• As dietary supplements is a huge market for vitamins,
price of raw materials plays a key role in ingredient
selection.
• Dietary supplements are primarily regulated by the FDA
and FTC in the US. Therefore, its imperative for
customers to select products that are regulatory
complaint.
• Formulating products with natural ingredients gives a
competitive edge for customers.
Low High
Low High
Low High
Low High
Low High
Low High
Low High
Low High
Low High
Solubility
Organoleptic
Properties
Stability
Nature identical
isomer
Bio-availability
Regulatory
compliance
Cost
effectiveness
Safety
Natural Source
Attractive Not Attractive KEY
34 9833-88 Confidential - Property of Frost &
Sullivan
Food Safety
35 9833-88 Confidential - Property of Frost &
Sullivan
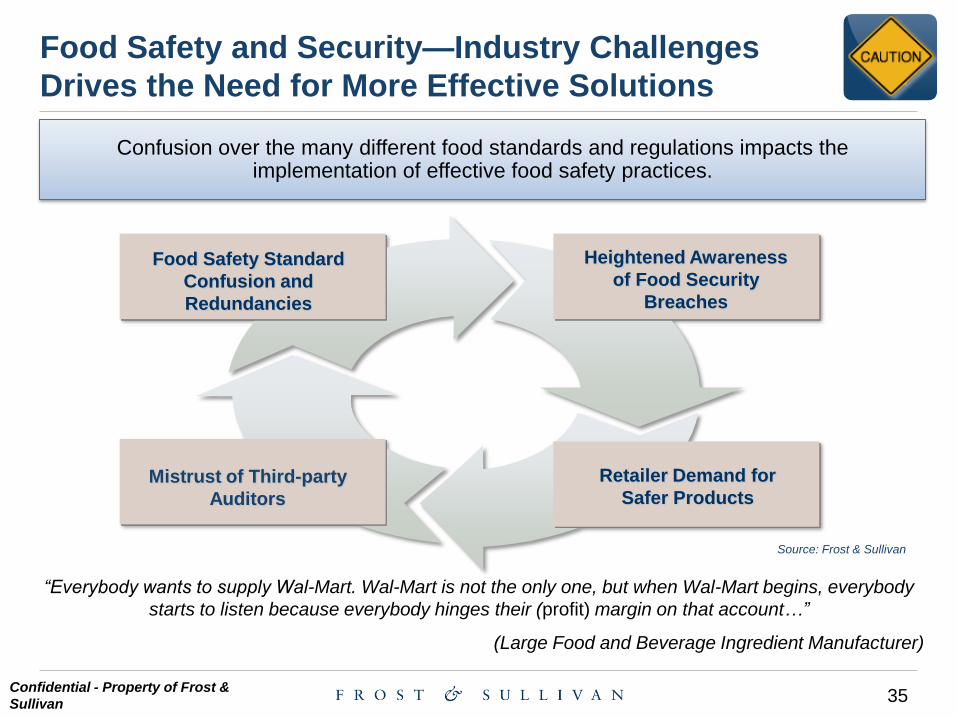
Confusion over the many different food standards and regulations impacts the implementation of effective food safety practices.
Food Safety and Security—Industry Challenges
Drives the Need for More Effective Solutions
“Everybody wants to supply Wal-Mart. Wal-Mart is not the only one, but when Wal-Mart begins, everybody
starts to listen because everybody hinges their (profit) margin on that account…”
(Large Food and Beverage Ingredient Manufacturer)
Source: Frost & Sullivan
Food Safety Standard
Confusion and
Redundancies
Heightened Awareness
of Food Security
Breaches
Retailer Demand for
Safer Products Mistrust of Third-party
Auditors
36 9833-88 Confidential - Property of Frost &
Sullivan
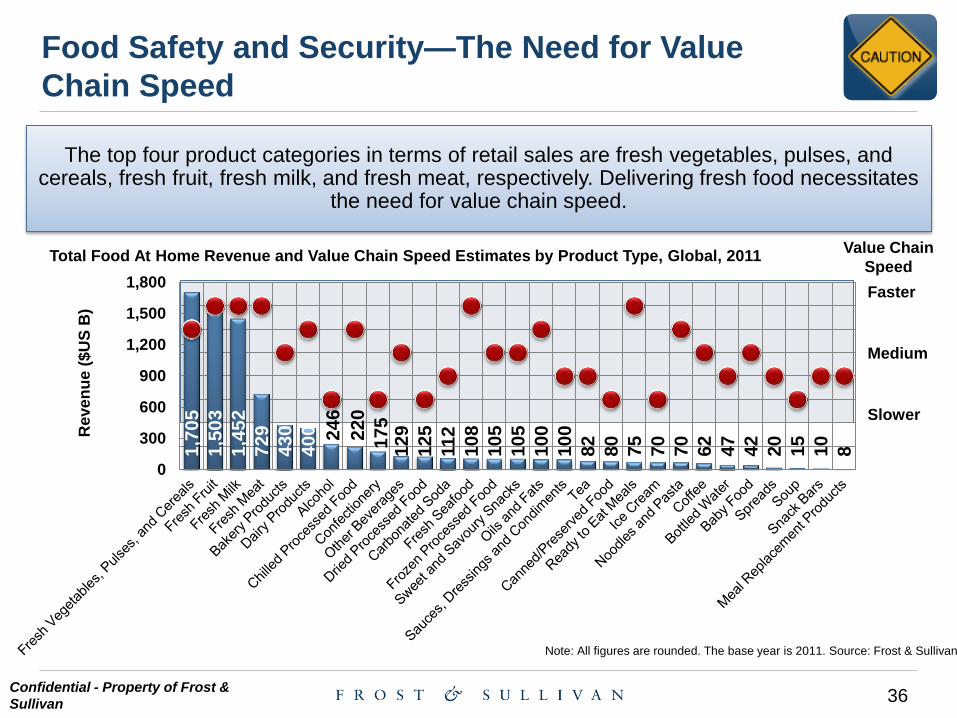
The top four product categories in terms of retail sales are fresh vegetables, pulses, and cereals, fresh fruit, fresh milk, and fresh meat, respectively. Delivering fresh food necessitates
the need for value chain speed.
Food Safety and Security—The Need for Value
Chain Speed
Note: All figures are rounded. The base year is 2011. Source: Frost & Sullivan
Total Food At Home Revenue and Value Chain Speed Estimates by Product Type, Global, 2011
1,7
05
1,5
03
1,4
52
729
430
400
246
220
175
129
125
112
108
105
105
100
100
82
80
75
70
70
62
47
42
20
15
10
8
-
1.0
2.0
3.0
4.0
5.0
6.0
7.0
8.0
0
300
600
900
1,200
1,500
1,800Faster Medium Slower
Value Chain
Speed
Reve
nu
e (
$U
S B
)
37 9833-88 Confidential - Property of Frost &
Sullivan
Food Safety—Why are Food Safety Standards
Needed?
• The burden of food safety breaches is significant. According to the World
Health Organization, food borne illnesses results in roughly 2 million deaths
per year from just diarrheal diseases and according to the Centers for
Disease Control and Prevention, approximately 1 in 6 Americans get sick
from food borne illnesses, with about 3,000 people dying annually.
• Thus, there is a strong need for a harmonized set of global food safety
standards that assures the following:
o Promotion of safe and quality food and animal products for global
consumers
o Protection against risk factors at all stages of the food supply chain,
from farm through to fork
o Protection of brand quality and manufacturer reputations
o Prevention of disease outbreaks or health concerns occurring as a
result of breaches in food safety
o Offers a benchmark against which food industry operators and food
supply organizations can be trained in the correct procedures for
provision of a safe consumer food supply
• Despite progress in the right direction, challenges persist globally in
implementing a truly global food safety system.
The burden of food safety breaches is very costly, resulting in billions of dollars of
wasted food product, wasted time, and most importantly, human lives.
Source: Frost & Sullivan
38 9833-88 Confidential - Property of Frost &
Sullivan
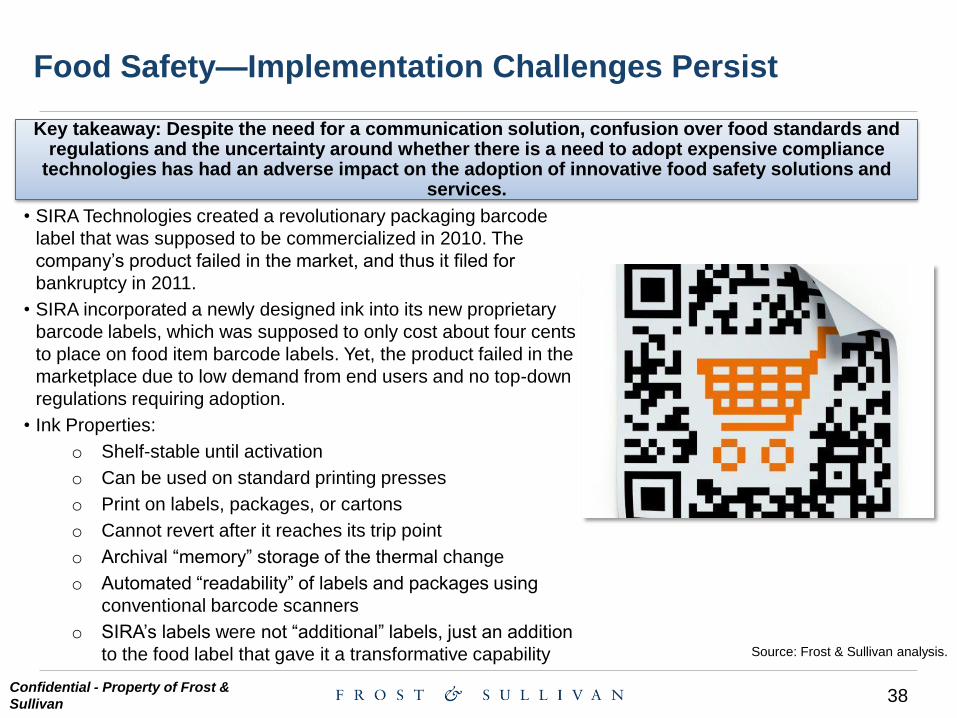
• SIRA Technologies created a revolutionary packaging barcode
label that was supposed to be commercialized in 2010. The
company’s product failed in the market, and thus it filed for
bankruptcy in 2011.
• SIRA incorporated a newly designed ink into its new proprietary
barcode labels, which was supposed to only cost about four cents
to place on food item barcode labels. Yet, the product failed in the
marketplace due to low demand from end users and no top-down
regulations requiring adoption.
• Ink Properties:
o Shelf-stable until activation
o Can be used on standard printing presses
o Print on labels, packages, or cartons
o Cannot revert after it reaches its trip point
o Archival “memory” storage of the thermal change
o Automated “readability” of labels and packages using
conventional barcode scanners
o SIRA’s labels were not “additional” labels, just an addition
to the food label that gave it a transformative capability
Food Safety—Implementation Challenges Persist
Key takeaway: Despite the need for a communication solution, confusion over food standards and regulations and the uncertainty around whether there is a need to adopt expensive compliance
technologies has had an adverse impact on the adoption of innovative food safety solutions and services.
Source: Frost & Sullivan analysis.
39 9833-88 Confidential - Property of Frost &
Sullivan
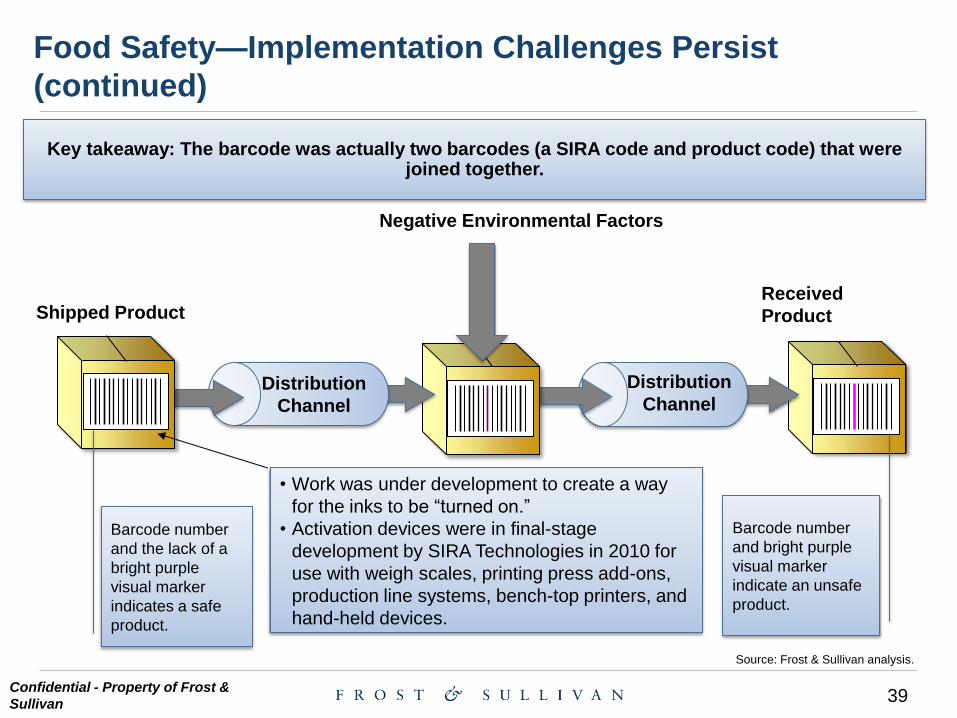
Barcode number
and bright purple
visual marker
indicate an unsafe
product.
Barcode number
and the lack of a
bright purple
visual marker
indicates a safe
product.
Negative Environmental Factors
Shipped Product
Distribution
Channel
Distribution
Channel
Received
Product
• Work was under development to create a way
for the inks to be “turned on.”
• Activation devices were in final-stage
development by SIRA Technologies in 2010 for
use with weigh scales, printing press add-ons,
production line systems, bench-top printers, and
hand-held devices.
Food Safety—Implementation Challenges Persist
(continued)
Key takeaway: The barcode was actually two barcodes (a SIRA code and product code) that were joined together.
Source: Frost & Sullivan analysis.
40 9833-88 Confidential - Property of Frost &
Sullivan
0
5,000
10,000
15,000
20,000
25,000
2012 2017CAGR (2012 -
2027)
Revenue 13,275 19,978 8.5%
Re
ve
nu
e (
$U
S M
)
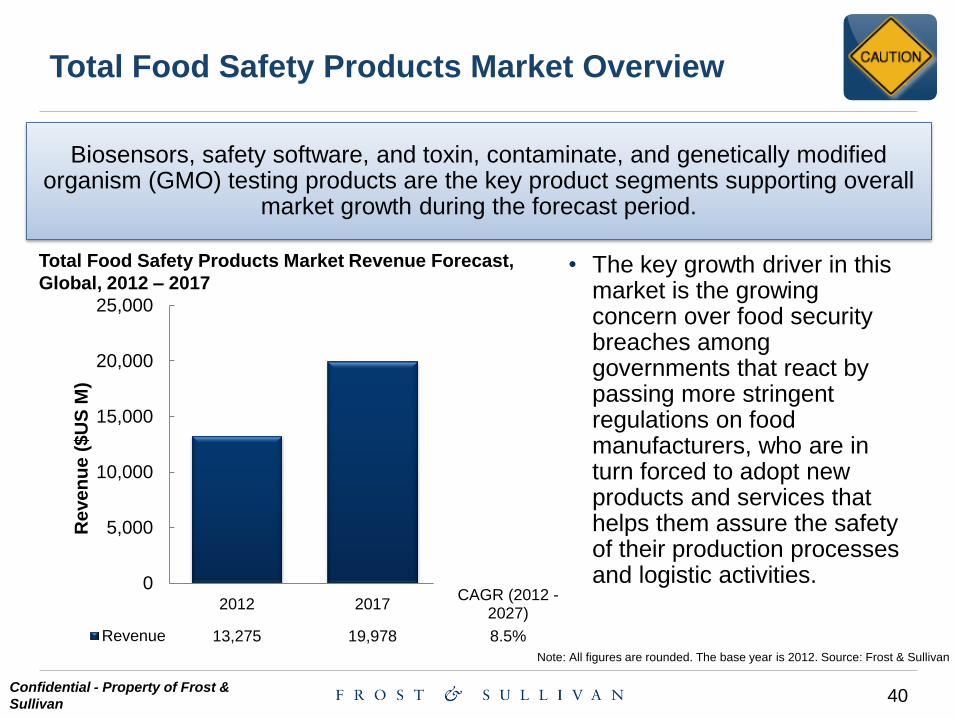
Biosensors, safety software, and toxin, contaminate, and genetically modified organism (GMO) testing products are the key product segments supporting overall
market growth during the forecast period.
Total Food Safety Products Market Overview
Note: All figures are rounded. The base year is 2012. Source: Frost & Sullivan
Total Food Safety Products Market Revenue Forecast,
Global, 2012 – 2017 • The key growth driver in this
market is the growing concern over food security breaches among governments that react by passing more stringent regulations on food manufacturers, who are in turn forced to adopt new products and services that helps them assure the safety of their production processes and logistic activities.
41 9833-88 Confidential - Property of Frost &
Sullivan
Total Food Safety Products Market—Selected
Country Trends
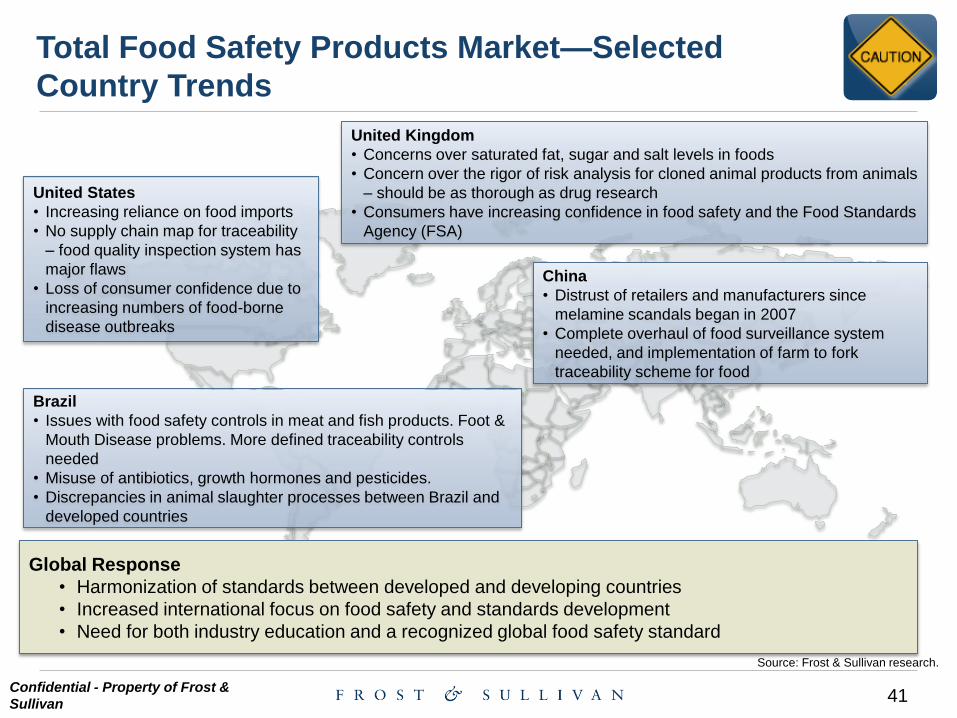
United States
• Increasing reliance on food imports
• No supply chain map for traceability
– food quality inspection system has
major flaws
• Loss of consumer confidence due to
increasing numbers of food-borne
disease outbreaks
United Kingdom
• Concerns over saturated fat, sugar and salt levels in foods
• Concern over the rigor of risk analysis for cloned animal products from animals
– should be as thorough as drug research
• Consumers have increasing confidence in food safety and the Food Standards
Agency (FSA)
China
• Distrust of retailers and manufacturers since
melamine scandals began in 2007
• Complete overhaul of food surveillance system
needed, and implementation of farm to fork
traceability scheme for food
Global Response
• Harmonization of standards between developed and developing countries
• Increased international focus on food safety and standards development
• Need for both industry education and a recognized global food safety standard
Brazil
• Issues with food safety controls in meat and fish products. Foot &
Mouth Disease problems. More defined traceability controls
needed
• Misuse of antibiotics, growth hormones and pesticides.
• Discrepancies in animal slaughter processes between Brazil and
developed countries
Source: Frost & Sullivan research.
42 9833-88 Confidential - Property of Frost &
Sullivan
Sustainability
43 9833-88 Confidential - Property of Frost &
Sullivan
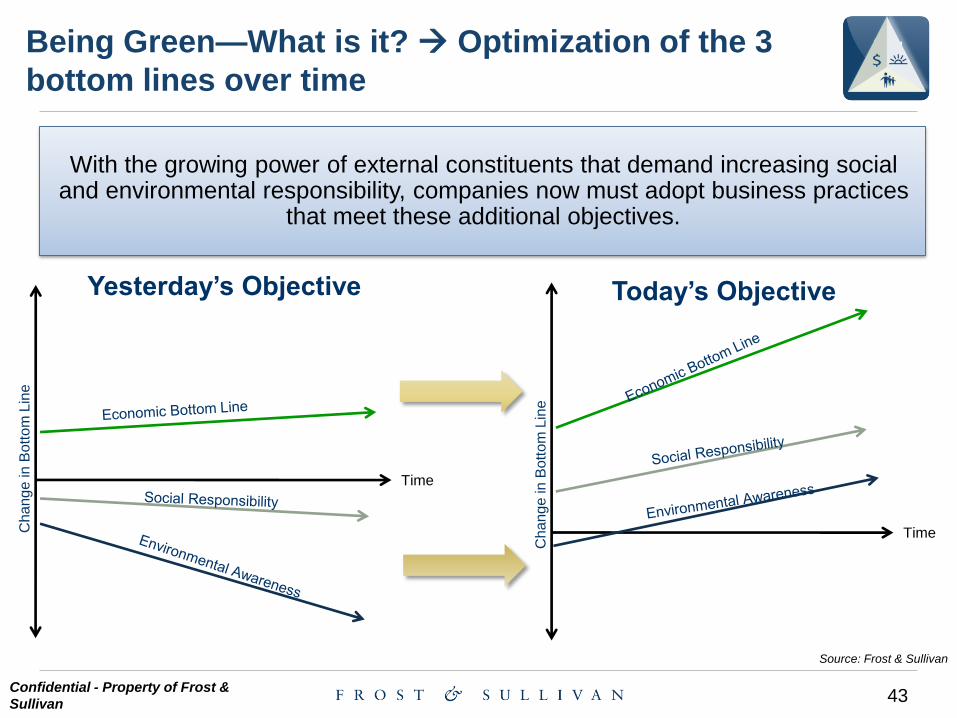
Being Green—What is it? Optimization of the 3
bottom lines over time
Ch
an
ge
in
Bo
tto
m L
ine
Time
Ch
an
ge
in
Bo
tto
m L
ine
Time
Yesterday’s Objective Today’s Objective
With the growing power of external constituents that demand increasing social and environmental responsibility, companies now must adopt business practices
that meet these additional objectives.
Source: Frost & Sullivan
44 9833-88 Confidential - Property of Frost &
Sullivan
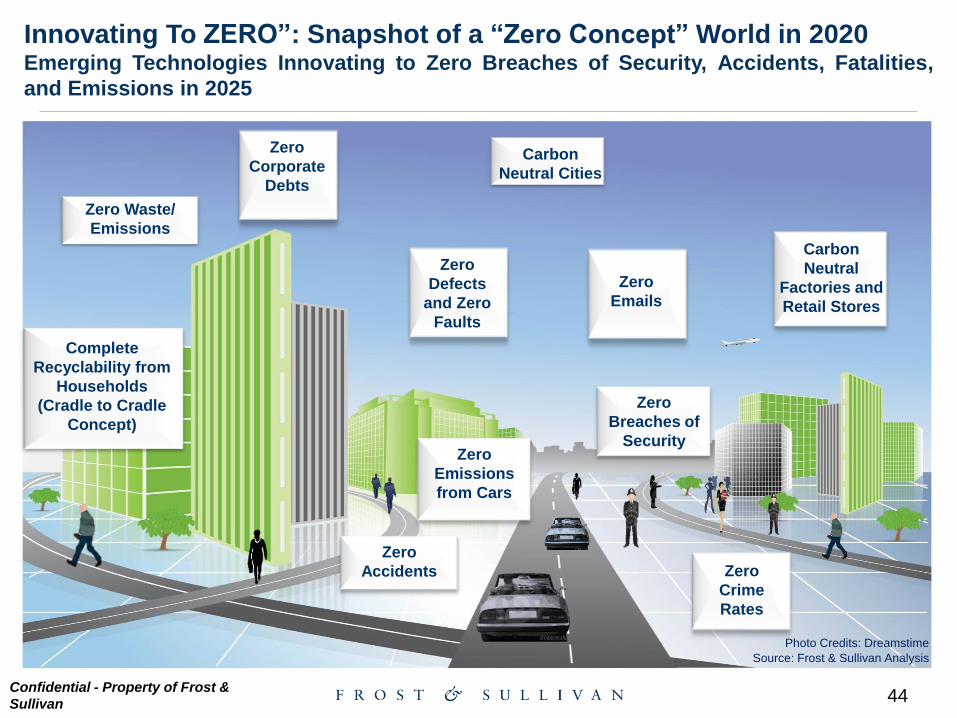
Zero
Emissions
from Cars
Zero
Accidents
Zero
Breaches of
Security
Zero
Crime
Rates
Zero Waste/
Emissions
Complete
Recyclability from
Households
(Cradle to Cradle
Concept)
Zero
Defects
and Zero
Faults
Carbon
Neutral
Factories and
Retail Stores
Carbon
Neutral Cities
Source: Frost & Sullivan Analysis
Innovating To ZERO”: Snapshot of a “Zero Concept” World in 2020 Emerging Technologies Innovating to Zero Breaches of Security, Accidents, Fatalities,
and Emissions in 2025
Photo Credits: Dreamstime
Zero
Corporate
Debts
Zero
Emails
45 9833-88 Confidential - Property of Frost &
Sullivan
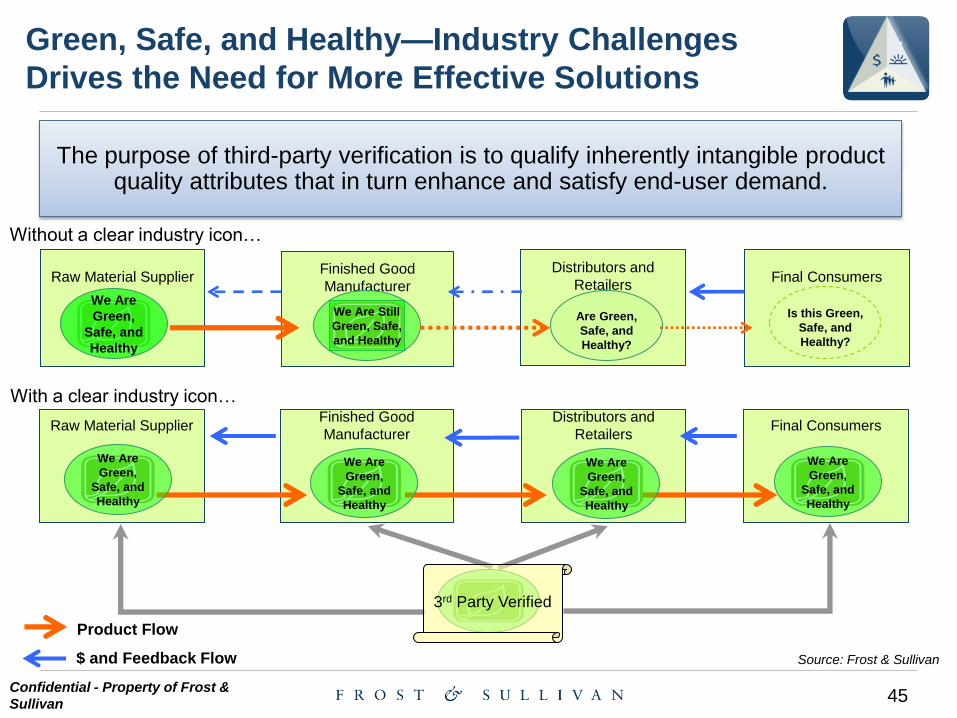
Green, Safe, and Healthy—Industry Challenges
Drives the Need for More Effective Solutions
The purpose of third-party verification is to qualify inherently intangible product quality attributes that in turn enhance and satisfy end-user demand.
Raw Material Supplier
Source: Frost & Sullivan
Distributors and
Retailers
Final Consumers
Finished Good
Manufacturer
We Are Still
Green, Safe,
and Healthy
Are Green,
Safe, and
Healthy?
Is this Green,
Safe, and
Healthy?
Distributors and
Retailers
Final Consumers
Finished Good
Manufacturer
Raw Material Supplier
We Are
Green,
Safe, and
Healthy
We Are
Green,
Safe, and
Healthy
We Are
Green,
Safe, and
Healthy
We Are
Green,
Safe, and
Healthy
3rd Party Verified
Without a clear industry icon…
With a clear industry icon…
We Are
Green,
Safe, and
Healthy
Product Flow
$ and Feedback Flow

46 9833-88 Confidential - Property of Frost &
Sullivan 46 46
Presentation Guide
1. About Frost & Sullivan
2. Mega Trends – The Impact in Latin America
– Urbanization
– Health, Wellness and Well-being
– Food Safety and Security
– Sustainability
3. Q&A
47 9833-88 Confidential - Property of Frost &
Sullivan
Thank you!

49
Gustavo Ferrari Research Analyst
Chemicals, Materials & Food
+55 11 3065-8462
Lead Consultant
Contacts