Embed Size (px)
Citation preview
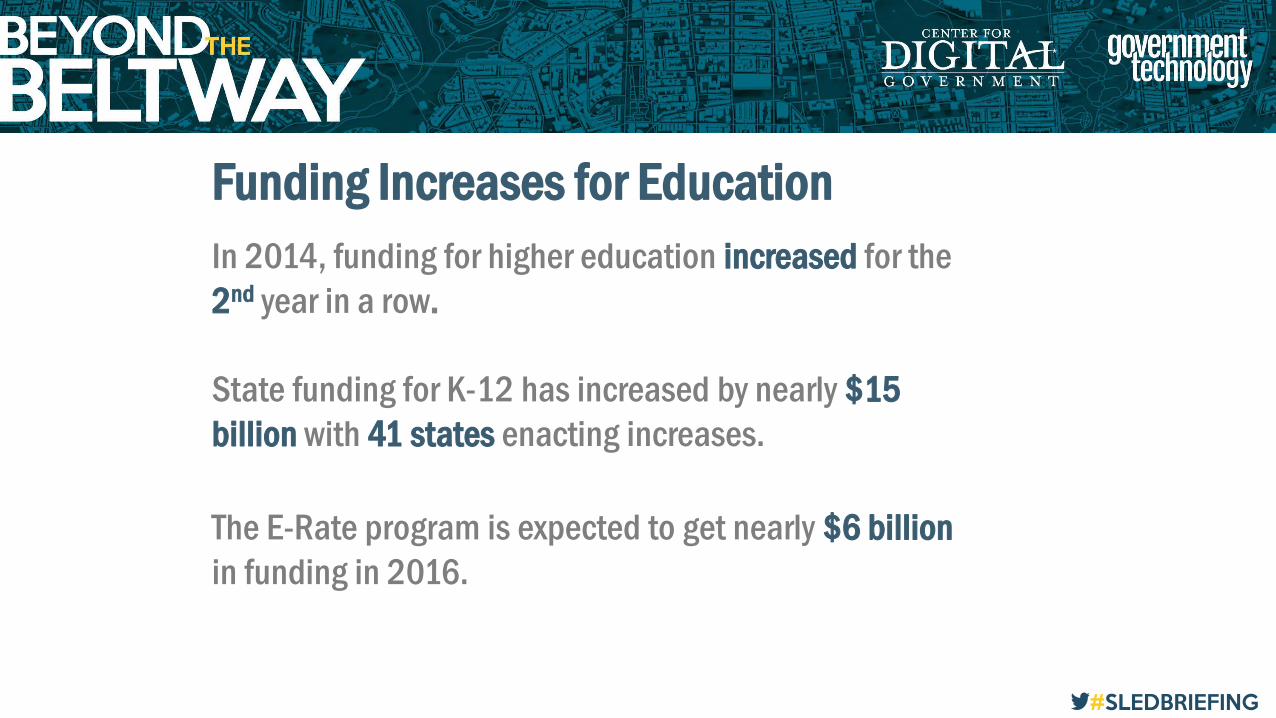
Funding Increases for EducationIn 2014, funding for higher education increased for the 2nd year in a row.
State funding for K-12 has increased by nearly $15 billion with 41 states enacting increases.
The E-Rate program is expected to get nearly $6 billion in funding in 2016.
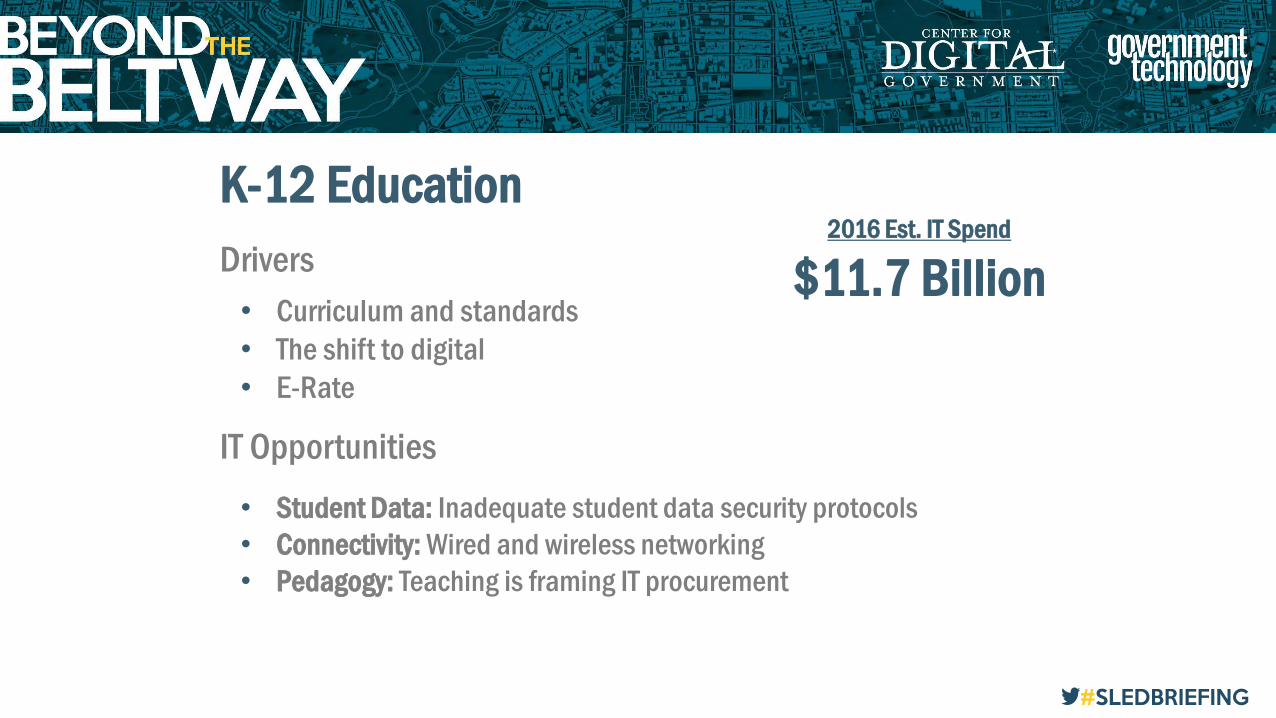
K-12 EducationDrivers• Curriculum and standards• The shift to digital• E-Rate
IT Opportunities• Student Data: Inadequate student data security protocols• Connectivity: Wired and wireless networking• Pedagogy: Teaching is framing IT procurement
2016 Est. IT Spend
$11.7 Billion
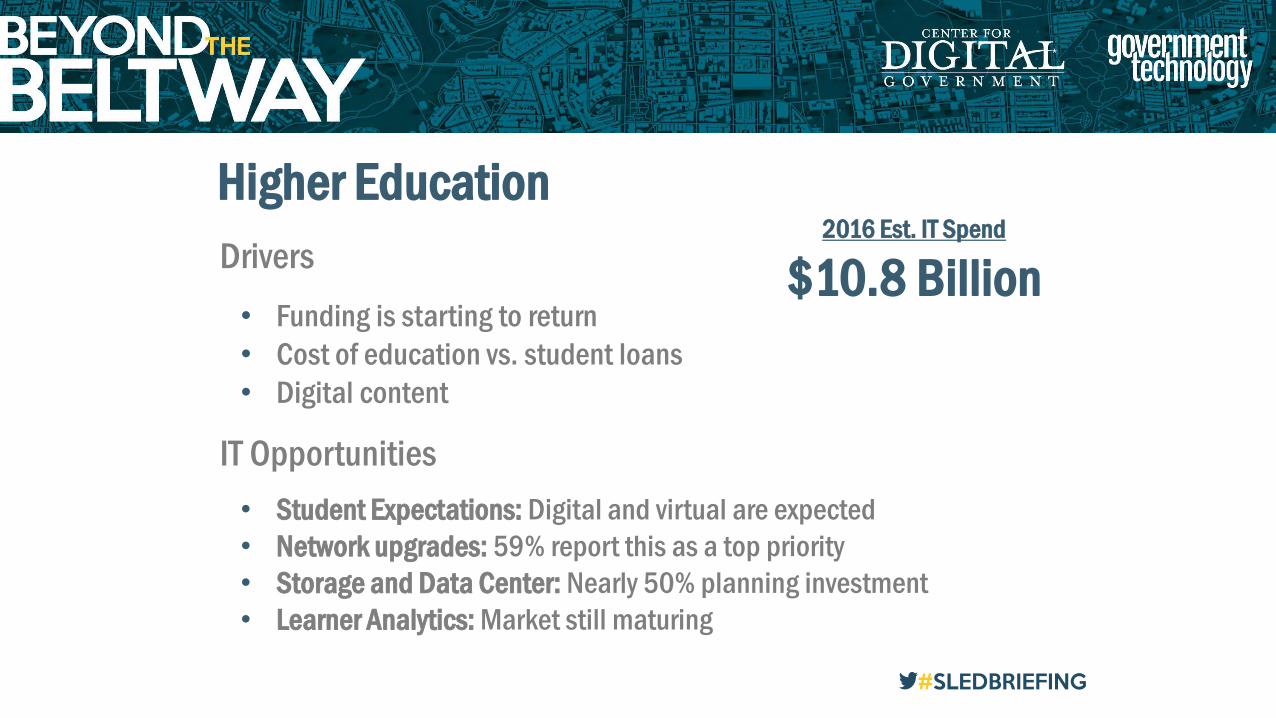
Higher EducationDrivers• Funding is starting to return• Cost of education vs. student loans• Digital content
IT Opportunities• Student Expectations: Digital and virtual are expected• Network upgrades: 59% report this as a top priority• Storage and Data Center: Nearly 50% planning investment• Learner Analytics: Market still maturing
2016 Est. IT Spend
$10.8 Billion
K-12 IT Spending Drivers, Priorities & Outlook

9 President Obama signed sweeping education bill in late 20159 The rewrite of the 2002 No Child Left Behind (NCLB) law gives more power to states and
reduces federally mandated testing.
9 Common Core — 46 states have adopted the Common Core State Standards
9 E-rate — Second Modernization Report and Order released in 20159 Redefined to focus on broadband/managed Wi-Fi9 $1.5 billion funding increase9 New “build your own WAN network” option
K-12 Legislative Update
© 2016 e.Republic
SOURCE: http://bigstory.ap.org/article/d910f4202ffb492c9110c08eeb24144f/house-vote-no-child-left-behind-rewrite; http://academicbenchmarks.com/common-core-state-adoption-map/
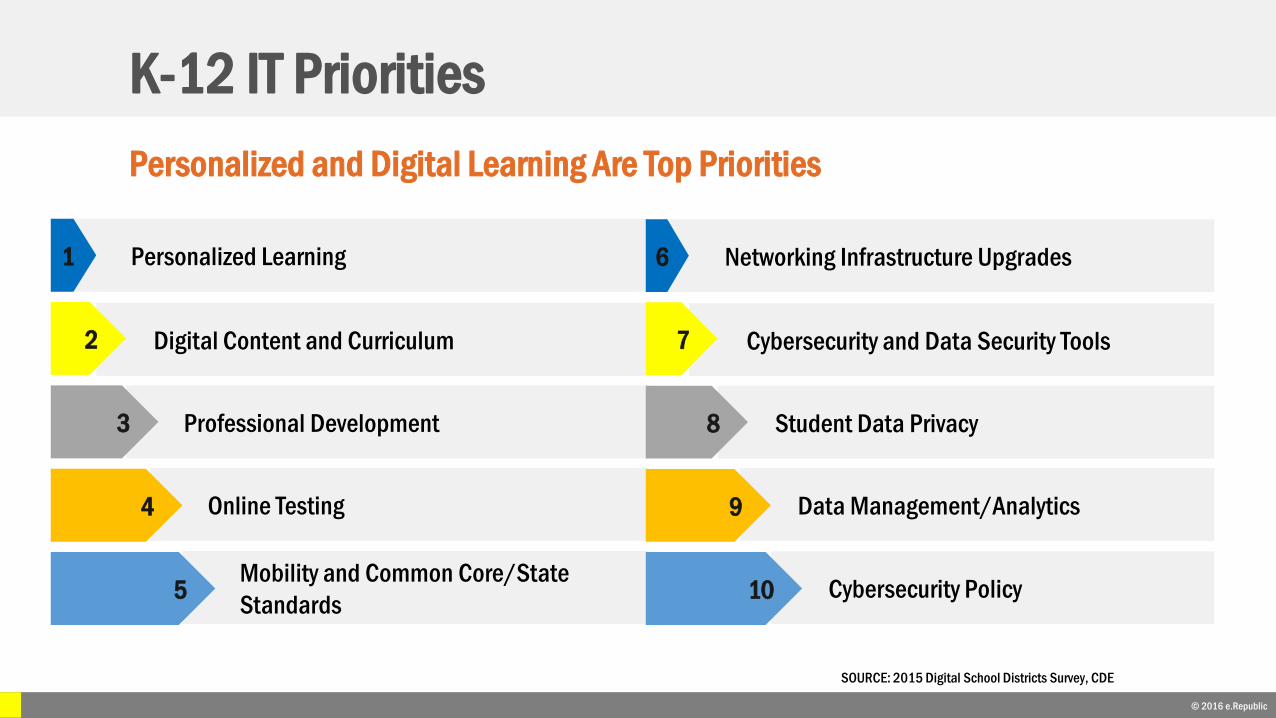
Personalized and Digital Learning Are Top Priorities
K-12 IT Priorities
© 2015 e.Republic
Mobility and Common Core/State Standards
Online Testing
Professional Development
Digital Content and Curriculum
Personalized Learning1
2
3
4
5 Cybersecurity Policy
Data Management/Analytics
Student Data Privacy
Cybersecurity and Data Security Tools
Networking Infrastructure Upgrades6
7
8
9
10
SOURCE: 2015 Digital School Districts Survey, CDE
© 2016 e.Republic
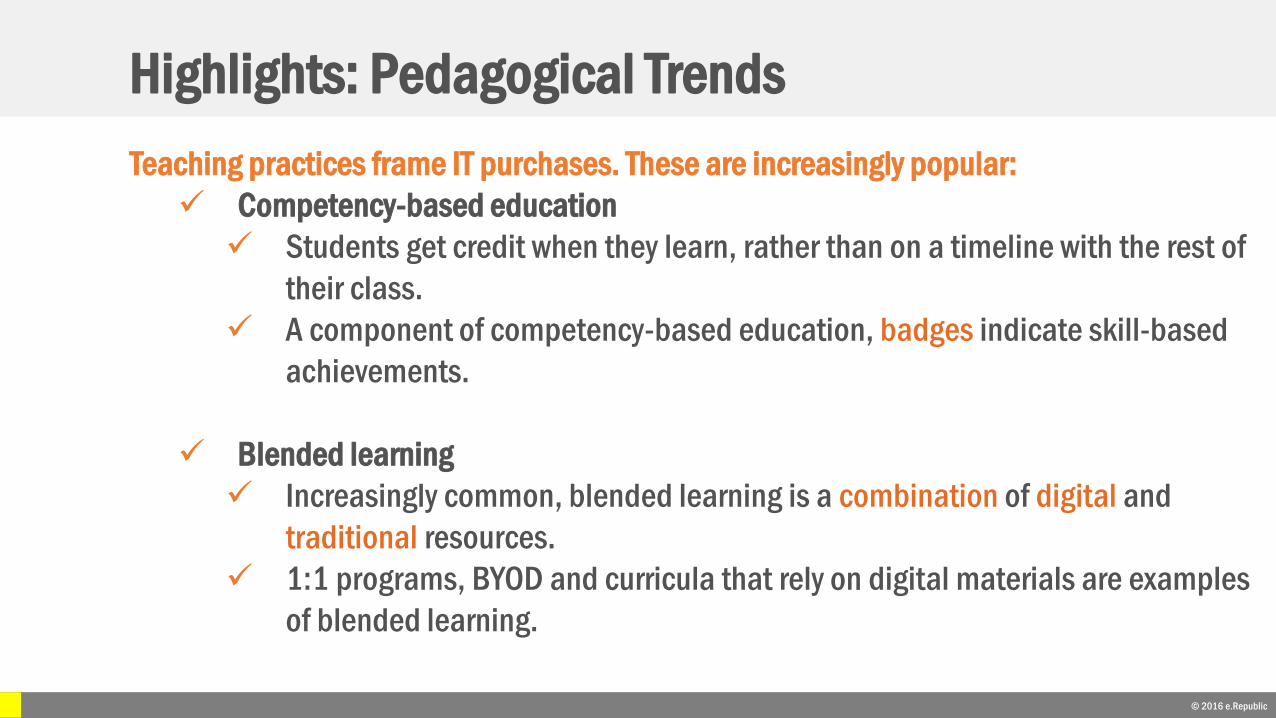
Teaching practices frame IT purchases. These are increasingly popular:9 Competency-based education9 Students get credit when they learn, rather than on a timeline with the rest of
their class.9 A component of competency-based education, badges indicate skill-based
achievements.
9 Blended learning9 Increasingly common, blended learning is a combination of digital and
traditional resources.9 1:1 programs, BYOD and curricula that rely on digital materials are examples
of blended learning.
Highlights: Pedagogical Trends
© 2015 e.Republic© 2016 e.Republic
Plans to Implement Personalized Learning
© 2016 e.Republic
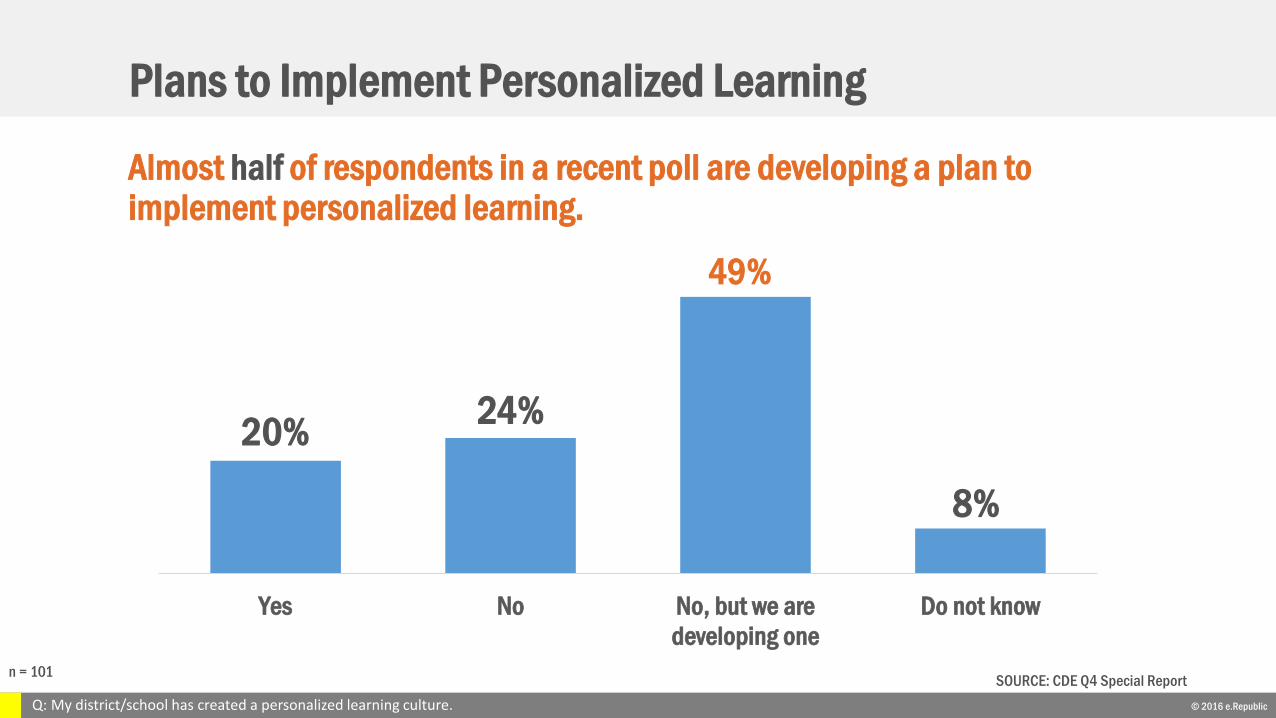
20% 24%
49%
8%
Yes No No, but we aredeveloping one
Do not know
n = 101 SOURCE: CDE Q4 Special ReportQ: My district/school has created a personalized learning culture.
Almost half of respondents in a recent poll are developing a plan to implement personalized learning.
Highlights: E-rate Changes
© 2015 e.Republic
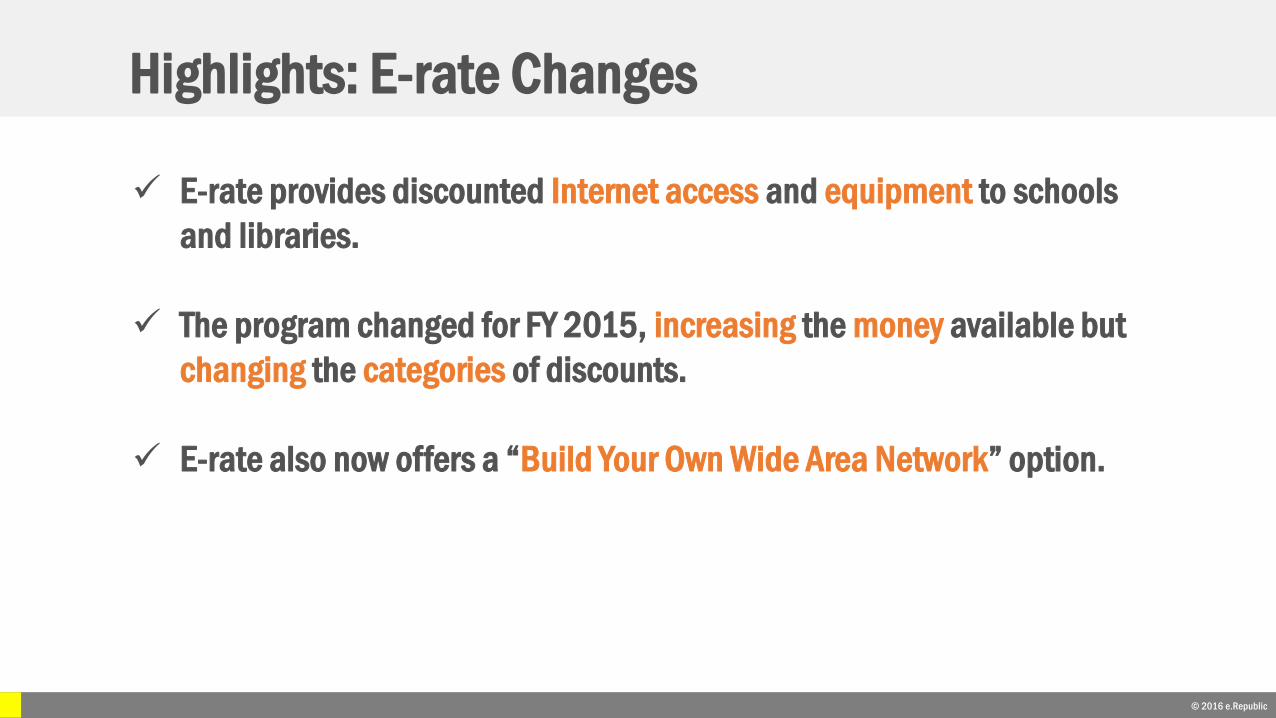
9 E-rate provides discounted Internet access and equipment to schools and libraries.
9 The program changed for FY 2015, increasing the money available but changing the categories of discounts.
9 E-rate also now offers a “Build Your Own Wide Area Network” option.
© 2016 e.Republic
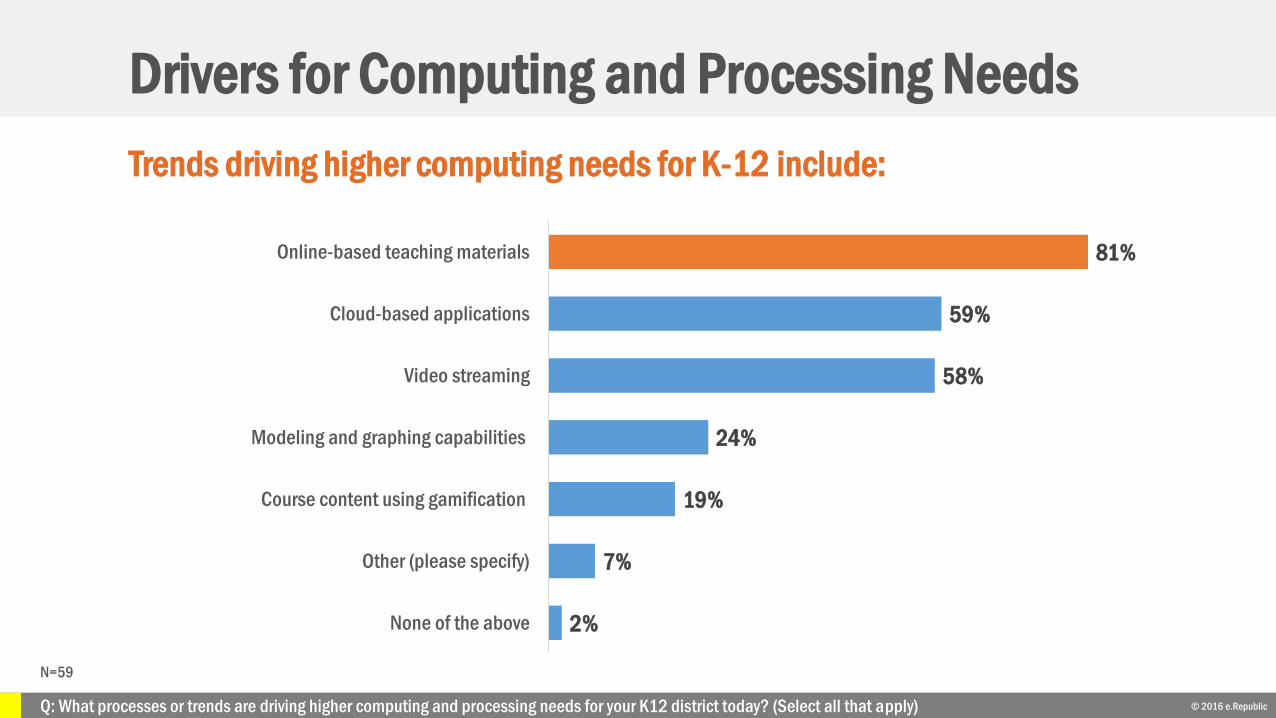
Drivers for Computing and Processing NeedsTrends driving higher computing needs for K-12 include:
© 2016 e.Republic
2%
7%
19%
24%
58%
59%
81%
None of the above
Other (please specify)
Course content using gamification
Modeling and graphing capabilities
Video streaming
Cloud-based applications
Online-based teaching materials
N=59
Q: What processes or trends are driving higher computing and processing needs for your K12 district today? (Select all that apply)

9 In a recent study conducted by the Center for Digital Education, technology training for teachers topped the list of important IT investment plans.
Planned IT Investments: Technology Training, Network Upgrades
© 2016 e.Republic
SOURCE: Center for Digital Education 2015 K12 Survey
Technology training for teachers
Q5: Does your district or school have a person responsible for … helping teacher incorporate technology into their teaching?
Network security solutions
Smart classroom technologies
5
Devices for BYOD/1:1 programs
Network infrastructure upgrades
3
4
1
2
Opportunity and Challenge: Professional Development
© 2016 e.RepublicQ5: Does your district or school have a person responsible for … helping teachers incorporate technology into their teaching? (n=98) SOURCE: Center for Digital Education 2015 K12 Survey
80%
14%
6%
Incorporating Technology into Teaching
Yes No Do not know
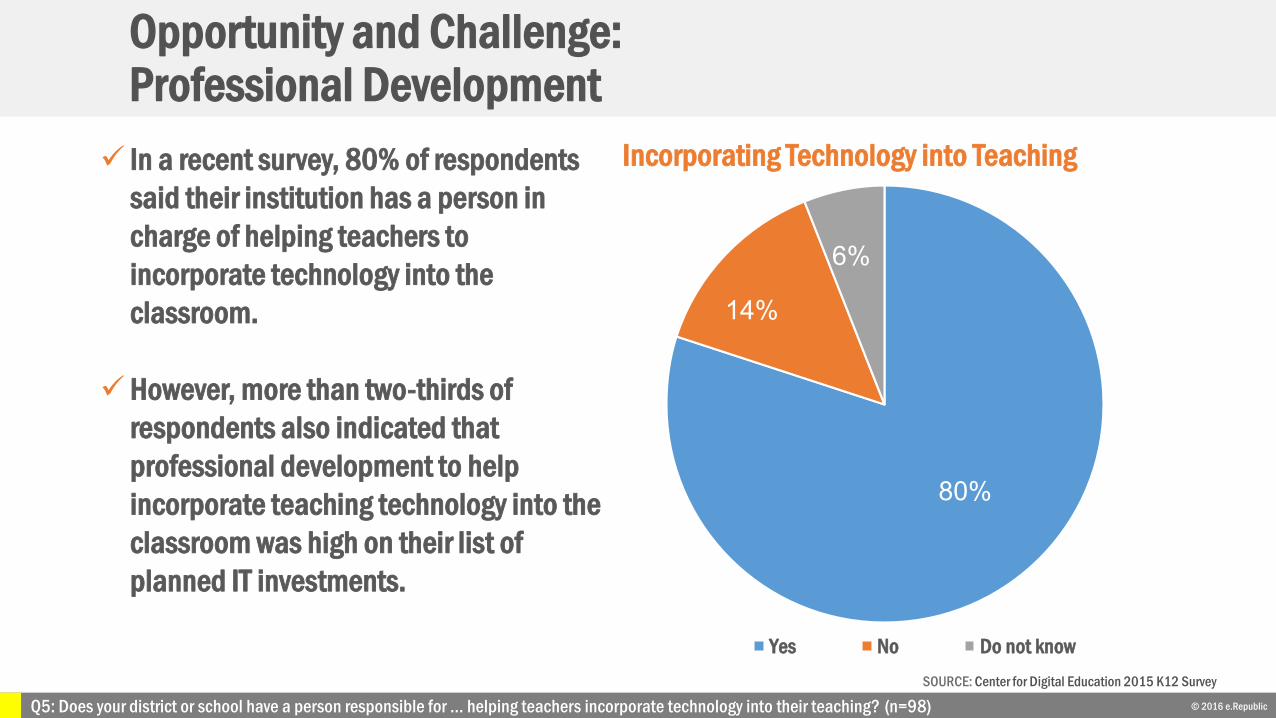
9 In a recent survey, 80% of respondents said their institution has a person in charge of helping teachers to incorporate technology into the classroom.
9However, more than two-thirds of respondents also indicated that professional development to help incorporate teaching technology into the classroom was high on their list of planned IT investments.
Challenge: Networks Often Insufficient
© 2016 e.RepublicQ18: With the next round of Common Core testing, which statement best describes your network? (n=98)
41%
40%
3% 4%
2%10%
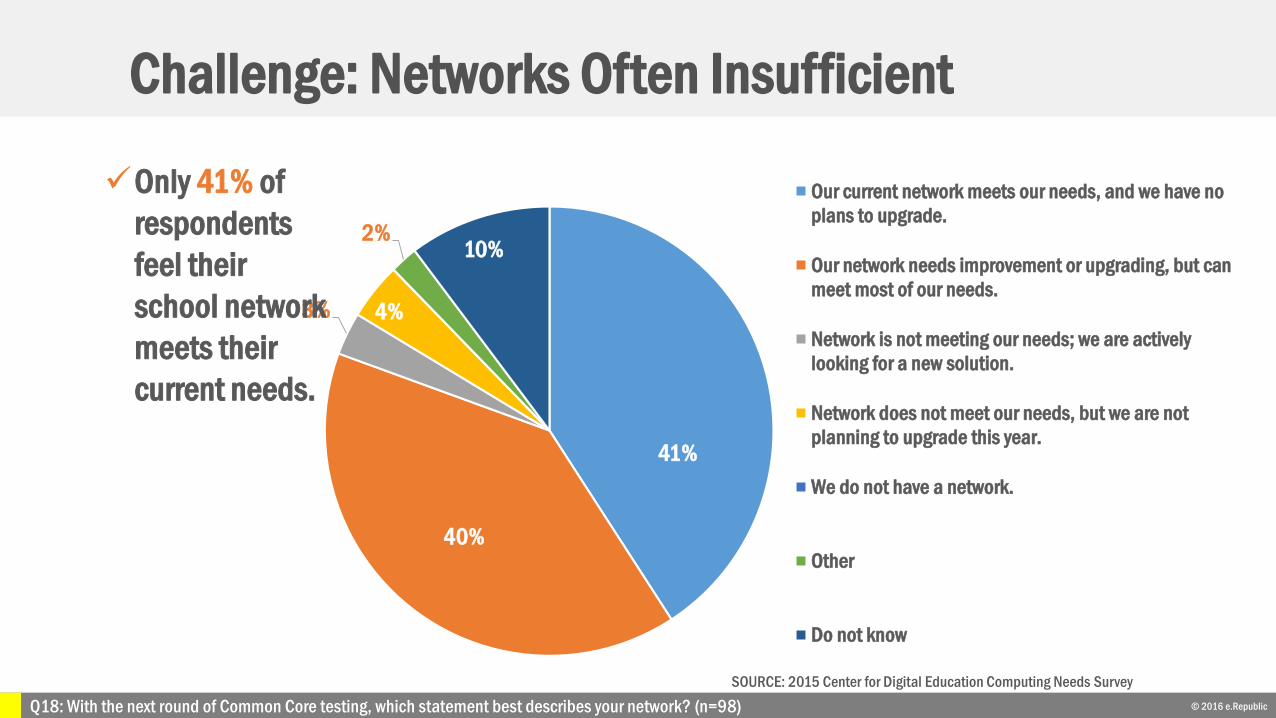
Our current network meets our needs, and we have noplans to upgrade.
Our network needs improvement or upgrading, but canmeet most of our needs.
Network is not meeting our needs; we are activelylooking for a new solution.
Network does not meet our needs, but we are notplanning to upgrade this year.
We do not have a network.
Other
Do not know
9Only 41% of respondents feel their school network meets their current needs.
SOURCE: 2015 Center for Digital Education Computing Needs Survey
10%
30%46%
14%
Tech purchases/time of year
January - March (Q1)
April - June (Q2)
July - September (Q3)
October - December (Q4)
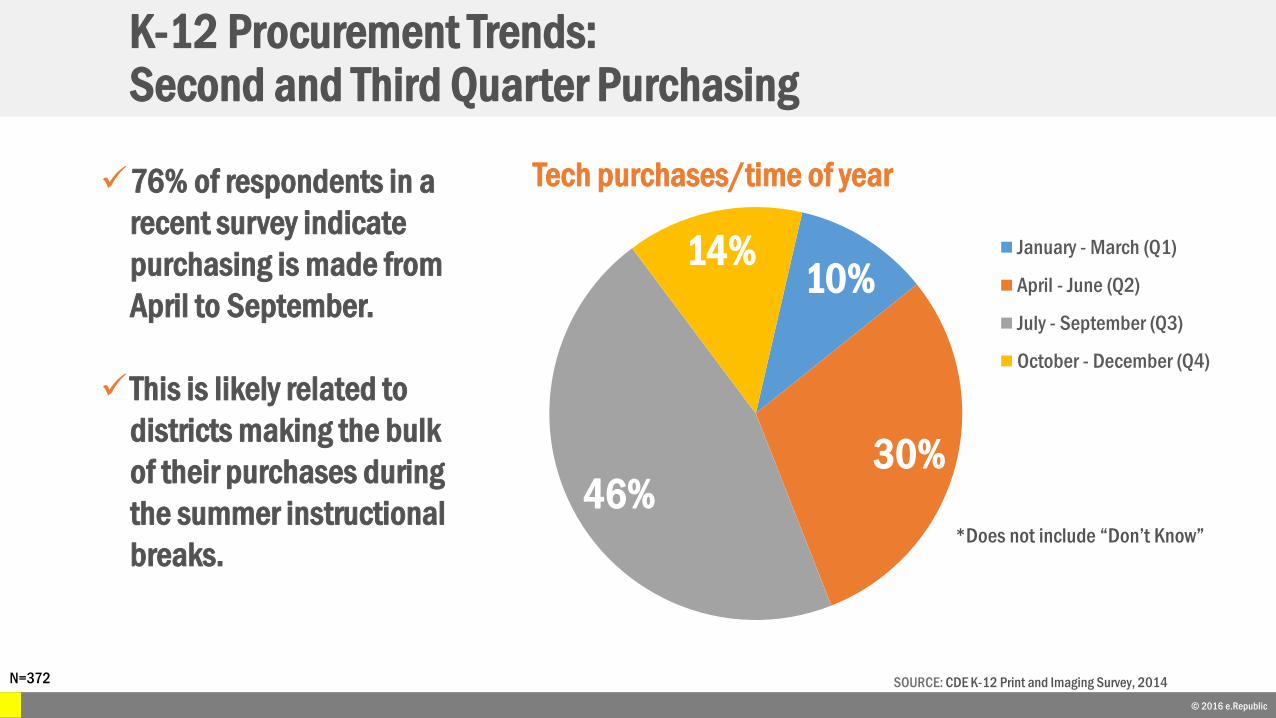
976% of respondents in a recent survey indicate purchasing is made from April to September.
9This is likely related to districts making the bulk of their purchases during the summer instructional breaks.
K-12 Procurement Trends:Second and Third Quarter Purchasing
© 2015 e.Republic
N=372
*Does not include “Don’t Know”
SOURCE: CDE K-12 Print and Imaging Survey, 2014© 2016 e.Republic
Key Takeaways
© 2015 e.Republic
9 Personalized learning tops priority list for educators, administrators
9 Upcoming tech investments include professional development and network/security upgrades
9 New legislation changes testing requirements
9 E-rate changes increase money available, slow down process
© 2016 e.Republic

Higher Ed IT Spending Drivers, Priorities & Outlook
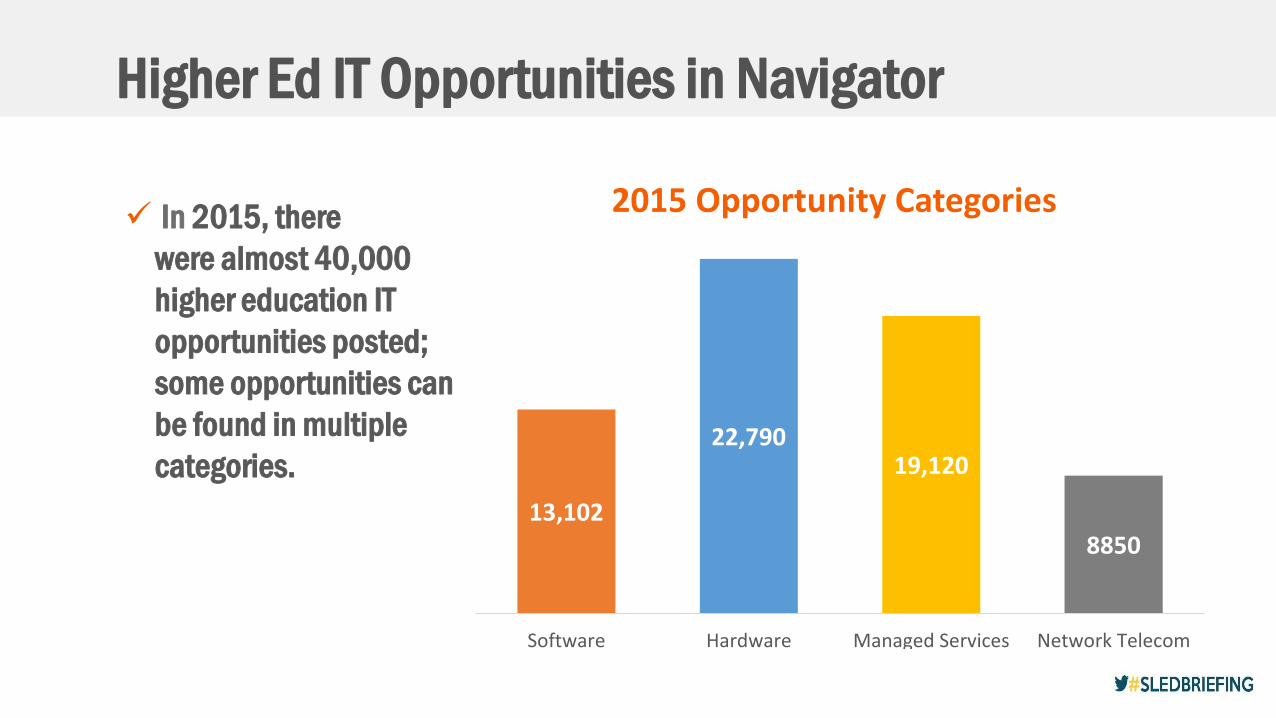
Higher Ed IT Opportunities in Navigator
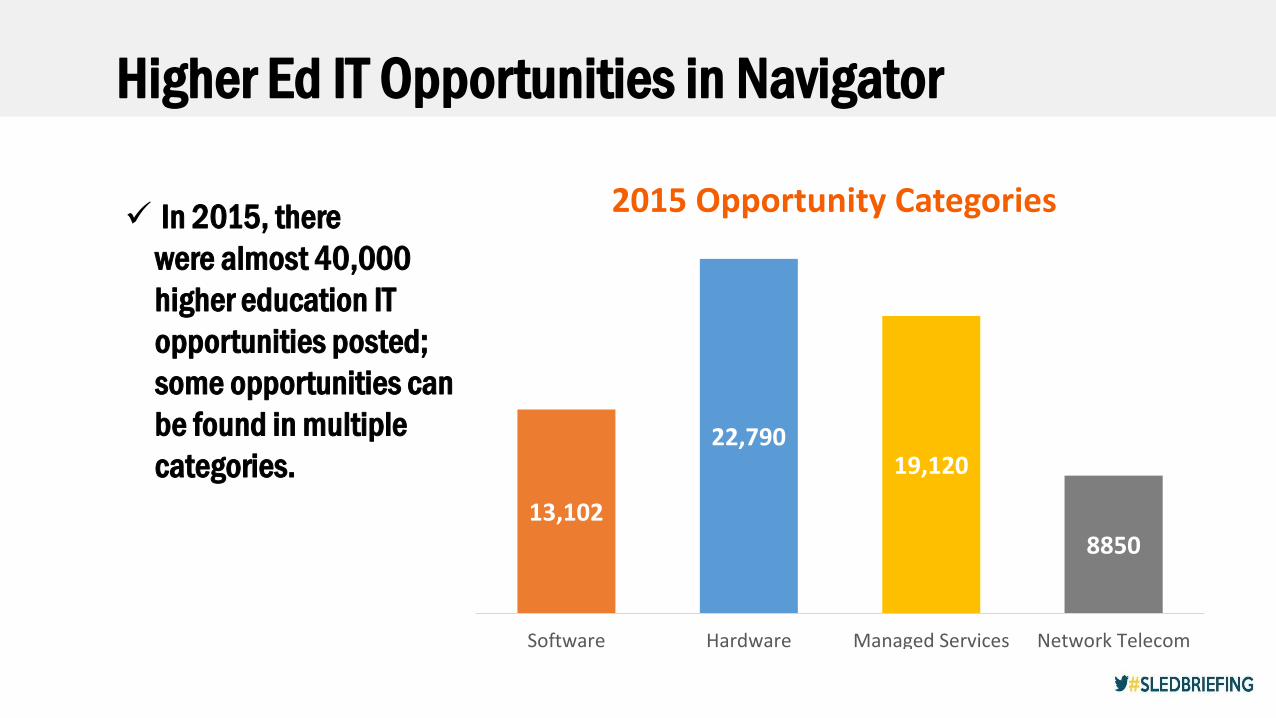
9 In 2015, there were almost 40,000 higher education IT opportunities posted; some opportunities can be found in multiple categories.
13,102
22,79019,120
8850
Software Hardware Managed Services Network Telecom
2015 Opportunity Categories

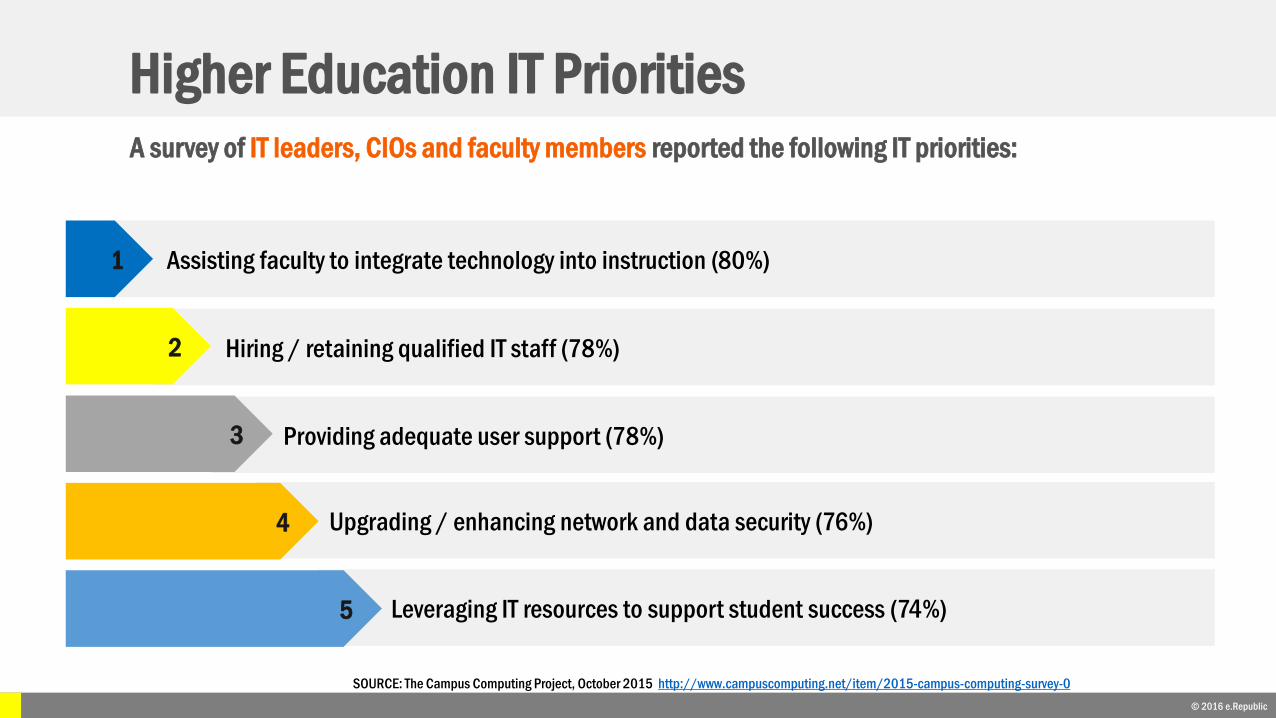
Higher Education IT Priorities
1 © 2016 e.Republic
Leveraging IT resources to support student success (74%)
Upgrading / enhancing network and data security (76%)
Providing adequate user support (78%)
Hiring / retaining qualified IT staff (78%)
Assisting faculty to integrate technology into instruction (80%)1
2
3
4
5
SOURCE: The Campus Computing Project, October 2015 http://www.campuscomputing.net/item/2015-campus-computing-survey-0
A survey of IT leaders, CIOs and faculty members reported the following IT priorities:
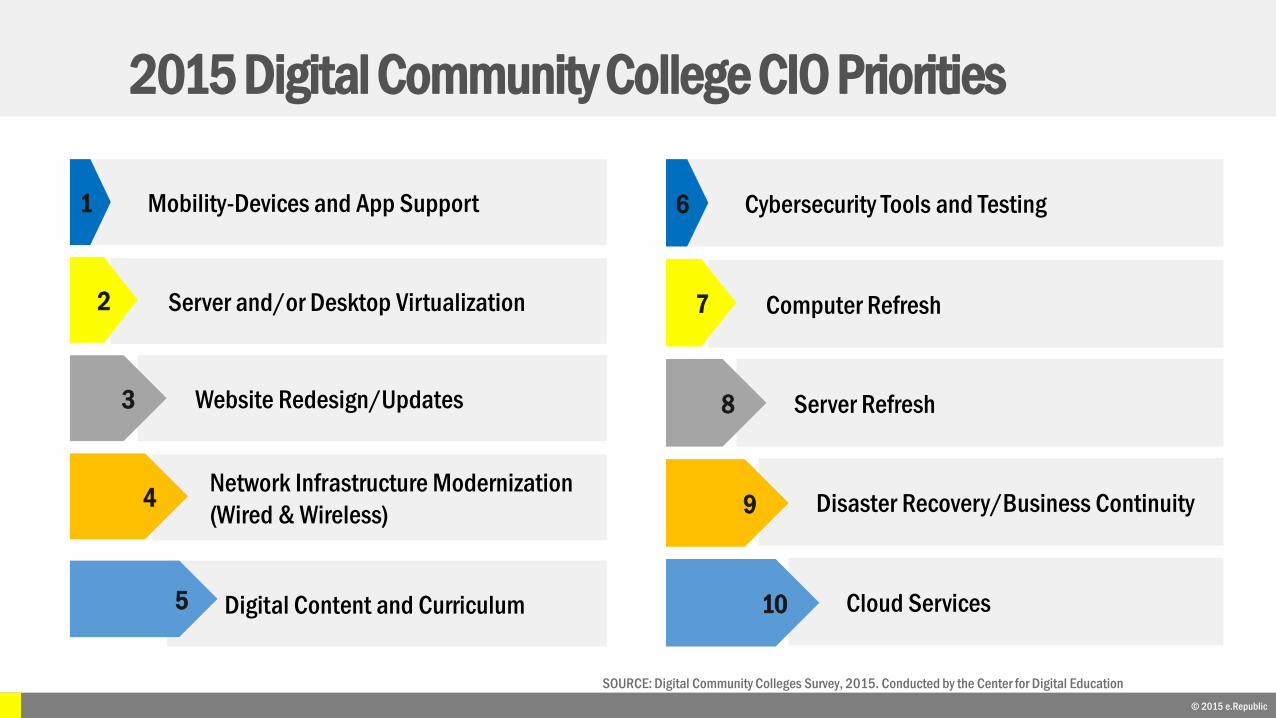
2015 Digital Community College CIO Priorities
© 2015 e.Republic
Digital Content and Curriculum
Network Infrastructure Modernization (Wired & Wireless)
Website Redesign/Updates
Server and/or Desktop Virtualization
Mobility-Devices and App Support1
2
3
4
5 Cloud Services
Disaster Recovery/Business Continuity
Server Refresh
Computer Refresh
Cybersecurity Tools and Testing6
7
8
9
10
SOURCE: Digital Community Colleges Survey, 2015. Conducted by the Center for Digital Education
© 2016 e.Republic
Market Trends

9 Customer relationship management (CRM) (26%)
9 E-mail: faculty/staff (23%)
9 IT service desk management (23%)
Systems most likely to be replaced in the next three years:
© 2016 e.Republic
SOURCE: Educause Core Data Service Almanac, February 2016
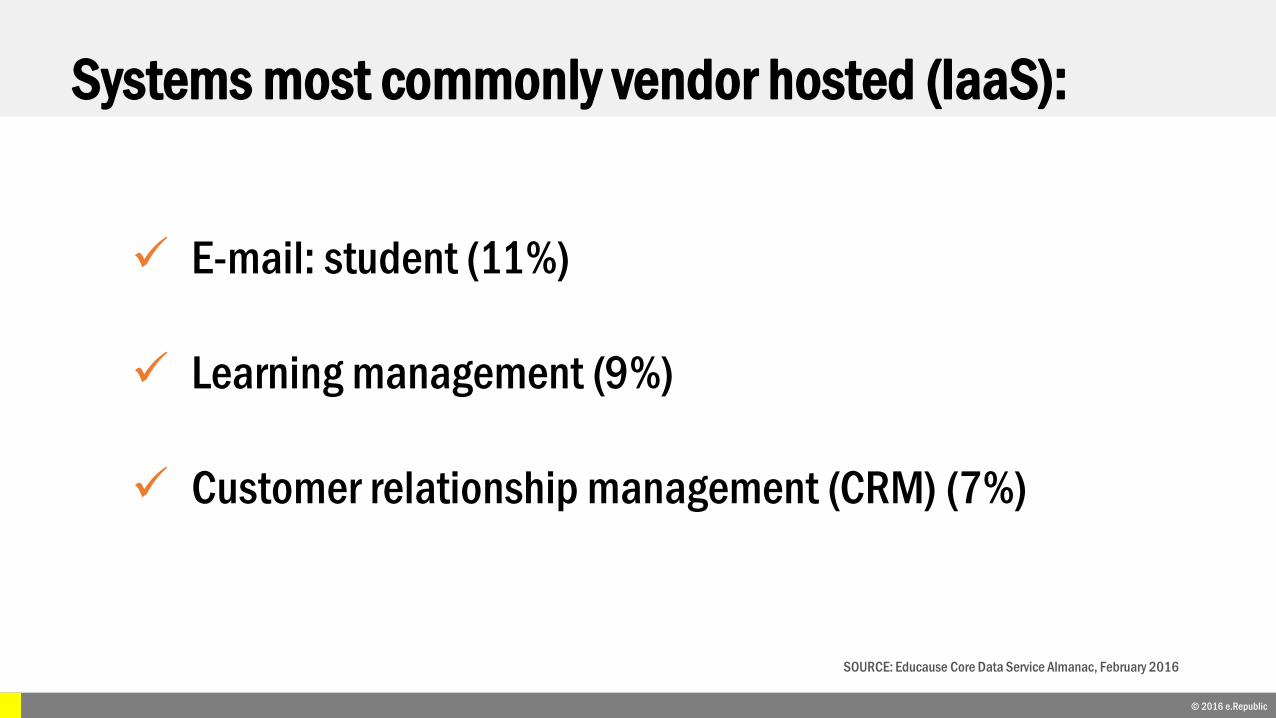
9 E-mail: student (11%)
9 Learning management (9%)
9 Customer relationship management (CRM) (7%)
Systems most commonly vendor hosted (IaaS):
© 2016 e.Republic
SOURCE: Educause Core Data Service Almanac, February 2016
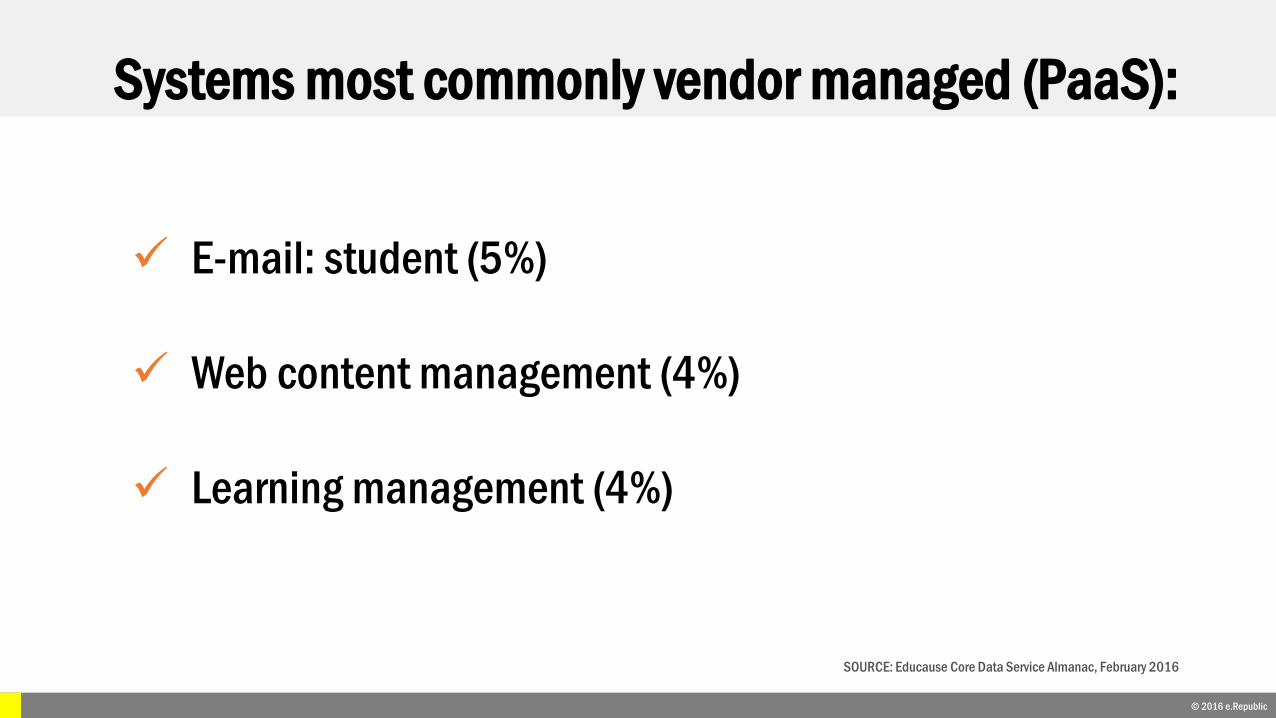
9 E-mail: student (5%)
9 Web content management (4%)
9 Learning management (4%)
Systems most commonly vendor managed (PaaS):
© 2016 e.Republic
SOURCE: Educause Core Data Service Almanac, February 2016
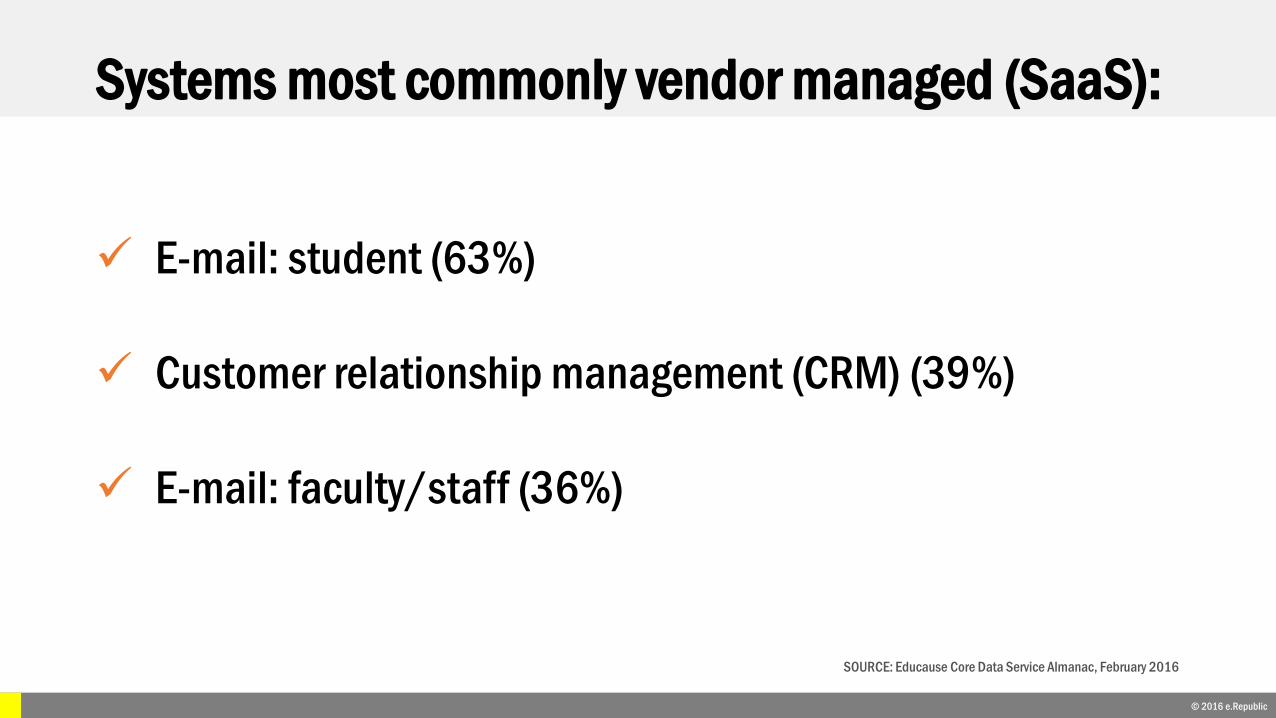
9 E-mail: student (63%)
9 Customer relationship management (CRM) (39%)
9 E-mail: faculty/staff (36%)
Systems most commonly vendor managed (SaaS):
© 2016 e.Republic
SOURCE: Educause Core Data Service Almanac, February 2016
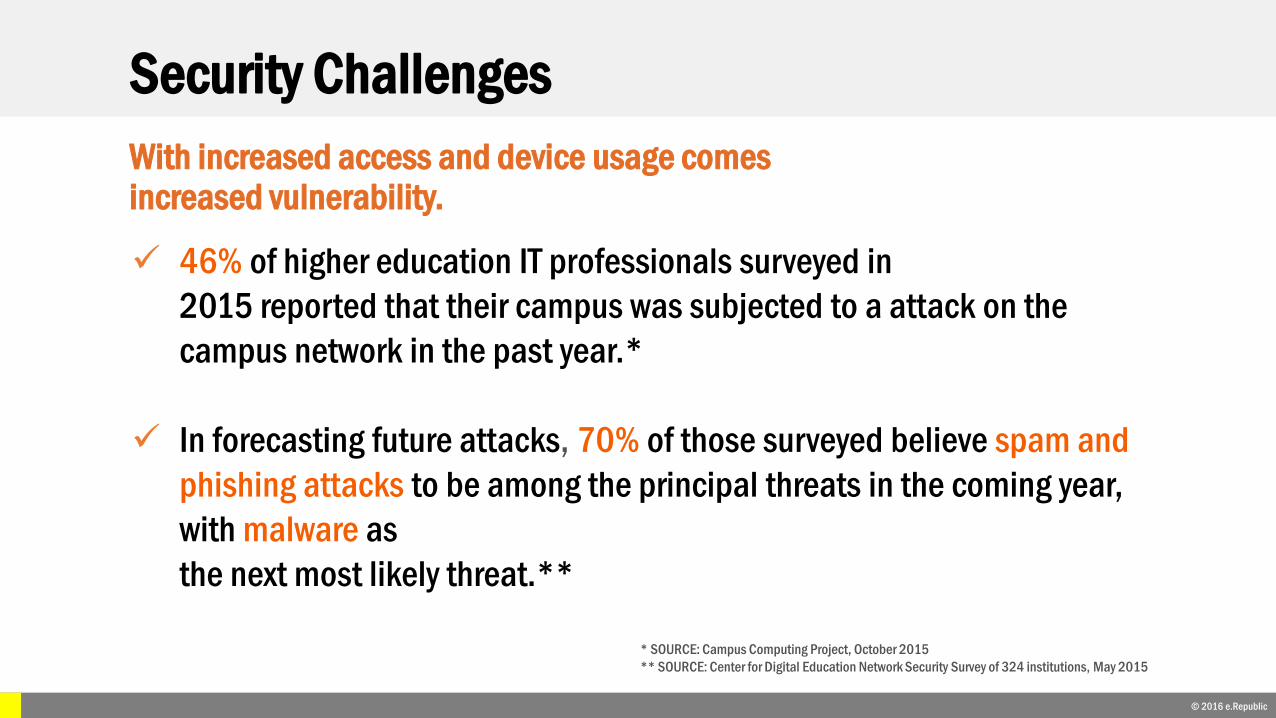
With increased access and device usage comes increased vulnerability.
9 46% of higher education IT professionals surveyed in 2015 reported that their campus was subjected to a attack on the campus network in the past year.*
9 In forecasting future attacks, 70% of those surveyed believe spam and phishing attacks to be among the principal threats in the coming year, with malware as the next most likely threat.**
Security Challenges
© 2016 e.Republic
* SOURCE: Campus Computing Project, October 2015** SOURCE: Center for Digital Education Network Security Survey of 324 institutions, May 2015
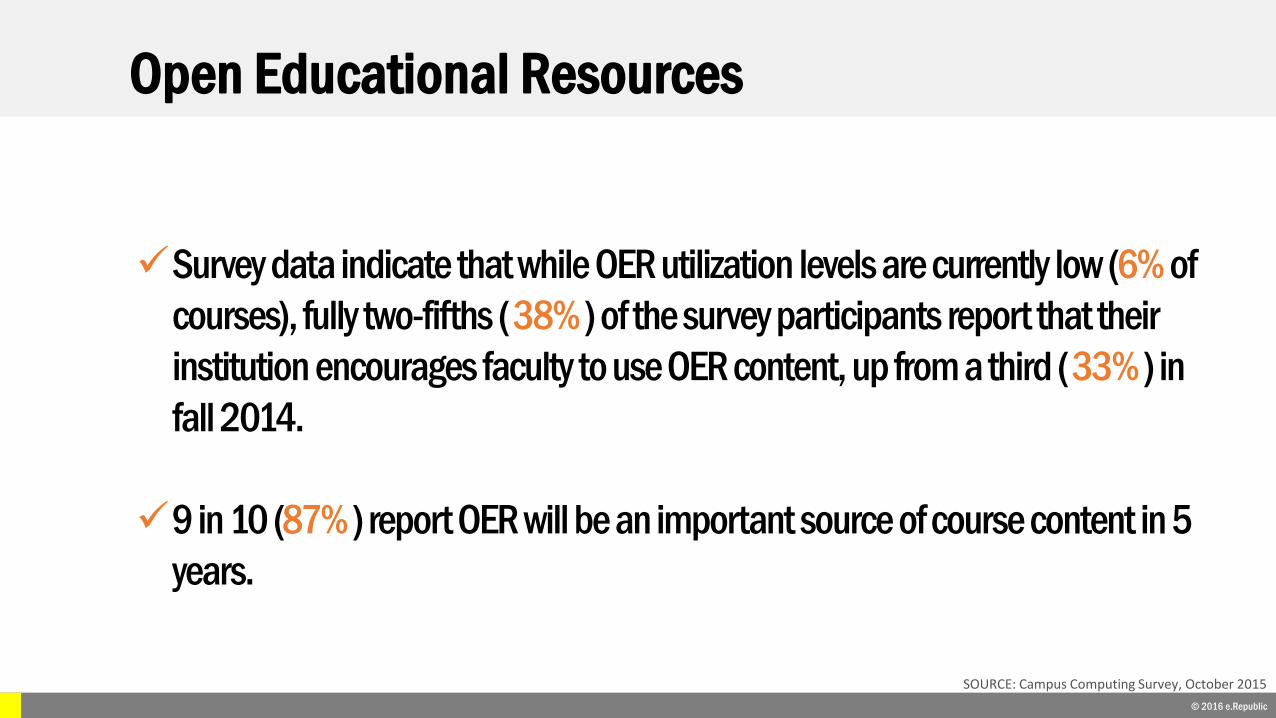
9Survey data indicate that while OER utilization levels are currently low (6% of courses), fully two-fifths ( 38% ) of the survey participants report that their institution encourages faculty to use OER content, up from a third ( 33% ) in fall 2014.
99 in 10 (87% ) report OER will be an important source of course content in 5 years.
Open Educational Resources
© 2016 e.Republic
SOURCE: Campus Computing Survey, October 2015

Higher Education Outlook
© 2016 e.Republic
9 Overall, the higher education market is continuing to recover from the fiscal challenges associated with the recession.
9 The higher education market is challenged by core issues related to rising costs associated with tuition and the overall importance of a traditional higher education experience.
9 Much like K-12, higher education is responding to similar market forces: mobility, digital content and the need for more personalized learning.
“American College Promise”: Access to Community College
© 2016 e.Republic
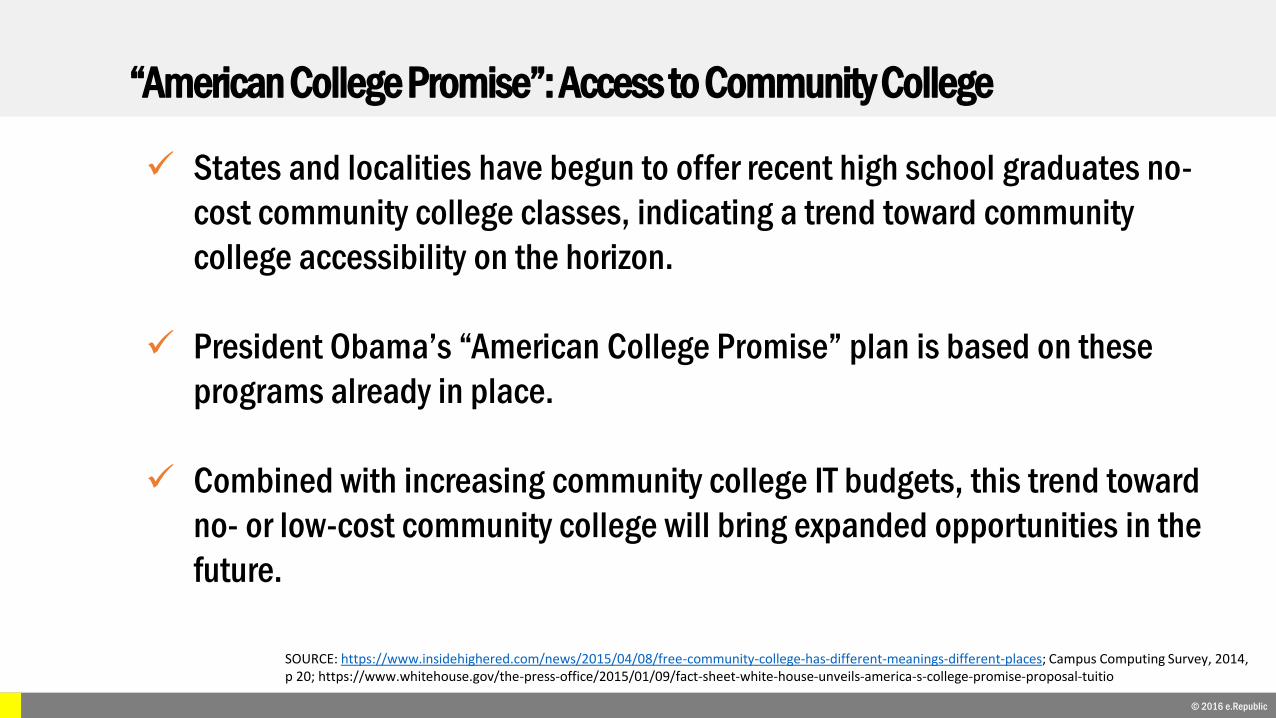
9 States and localities have begun to offer recent high school graduates no-cost community college classes, indicating a trend toward community college accessibility on the horizon.
9 President Obama’s “American College Promise” plan is based on these programs already in place.
9 Combined with increasing community college IT budgets, this trend toward no- or low-cost community college will bring expanded opportunities in the future.
SOURCE: https://www.insidehighered.com/news/2015/04/08/free-community-college-has-different-meanings-different-places; Campus Computing Survey, 2014, p 20; https://www.whitehouse.gov/the-press-office/2015/01/09/fact-sheet-white-house-unveils-america-s-college-promise-proposal-tuitio
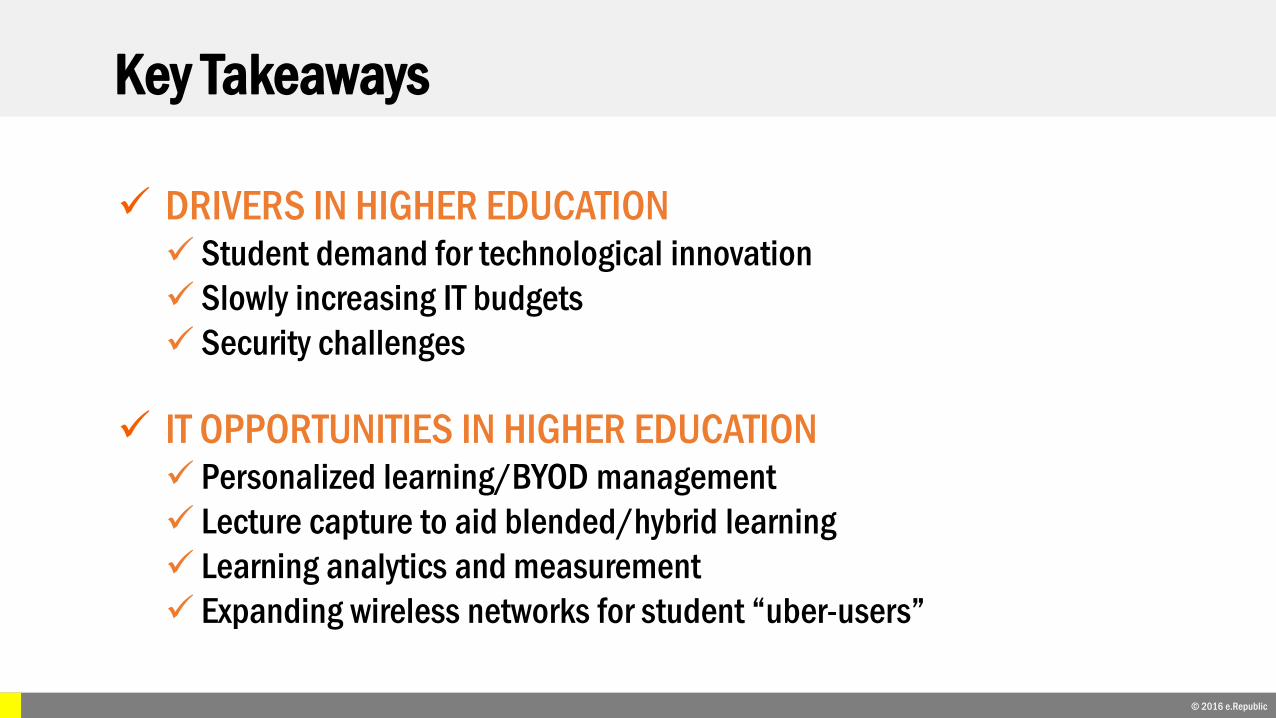
9 DRIVERS IN HIGHER EDUCATION9 Student demand for technological innovation9 Slowly increasing IT budgets9 Security challenges
9 IT OPPORTUNITIES IN HIGHER EDUCATION9 Personalized learning/BYOD management9 Lecture capture to aid blended/hybrid learning9 Learning analytics and measurement9 Expanding wireless networks for student “uber-users”
Key Takeaways
© 2016 e.Republic
Higher Ed IT Spending Drivers, Priorities & Outlook
Higher Ed IT Opportunities in Navigator
9 In 2015, there were almost 40,000 higher education IT opportunities posted; some opportunities can be found in multiple categories.
13,102
22,79019,120
8850
Software Hardware Managed Services Network Telecom
2015 Opportunity Categories
Higher Education IT Priorities
1 © 2016 e.Republic
Leveraging IT resources to support student success (74%)
Upgrading / enhancing network and data security (76%)
Providing adequate user support (78%)
Hiring / retaining qualified IT staff (78%)
Assisting faculty to integrate technology into instruction (80%)1
2
3
4
5
SOURCE: The Campus Computing Project, October 2015 http://www.campuscomputing.net/item/2015-campus-computing-survey-0
A survey of IT leaders, CIOs and faculty members reported the following IT priorities:

2015 Digital Community College CIO Priorities
© 2015 e.Republic
Digital Content and Curriculum
Network Infrastructure Modernization (Wired & Wireless)
Website Redesign/Updates
Server and/or Desktop Virtualization
Mobility-Devices and App Support1
2
3
4
5 Cloud Services
Disaster Recovery/Business Continuity
Server Refresh
Computer Refresh
Cybersecurity Tools and Testing6
7
8
9
10
SOURCE: Digital Community Colleges Survey, 2015. Conducted by the Center for Digital Education
Thank you!
© 2016 e.Republic
Seeking additional marketing intelligence? Ask about our other products and services such as:
• Surveys and interviews• Navigator subscription
(online state/local government opportunities and market intelligence portal)• Market playbooks and certification courses• State/local government and education sales training
The Center for Digital Education is a division of e.Republic, the nation’s only media and research company focused exclusively on state and local government and education. www.erepublic.com / www.centerdigitaled.com