Embed Size (px)
Citation preview
Monitoring of Migra on Dataand Policy Changes Conductedin Ukraine, Poland, Czechia and Slovakia(September 2015 — June 2016)
Dušan Drbohlav, Marta Jaroszewicz,Markéta Seidlová, Dita Čermáková(editors)
MO
NITO
RIN
G O
F MIG
RA
TION
DA
TAA
ND
PO
LICY C
HA
NG
ES CO
ND
UC
TED
9 788074 440472
Monitoring of Migra on Dataand Policy Changes Conductedin Ukraine, Poland, Czechia and Slovakia(September 2015 — June 2016)
Charles UniversityFaculty of Science
Prague 2016
Monitoring of Migra on Dataand Policy Changes Conductedin Ukraine, Poland, Czechia and Slovakia(September 2015 — June 2016)
Dušan Drbohlav, Marta Jaroszewicz,Markéta Seidlová, Dita Čermáková(editors)
Editors: Dušan Drbohlav, Marta Jaroszewicz, Markéta Seidlová, Dita ČermákováPublished by Charles University, Faculty of Science,Department of Social Geography and Regional Development,Albertov 6, Prague 2, Czechia; [email protected] photo: AP Photo / Sergei Grits (Kiev, Ukraine, December 2013)First published.
© Charles University, Faculty of Science, 2016
ISBN 978-80-7444-047-2
SFPASlovak Foreign Policy Association
This publication originated in the framework of the project Ukraine’s migration monitoring: forced and labour mobility (2015–2016) financed by the International Visegrad Fund.
The project was carried out by Geomigrace from Charles University (Czechia), together with the Centre for Eastern Studies (OSW) from Poland, the Slovak Foreign Policy Association, and ‘Europe without Barriers’ from Ukraine.
The publication presents results of the monitoring of available migration data and policy changes conducted in Ukraine, Poland, Czechia and Slovakia in September 2015 – June 2016. The monthly reports served as a statistical and policy basis for our field qualitative study presented in Volume I of the book (Ukrainian migration in times of crisis: forced and labour mobility).

Table of contents
UKRAINEMain trends and figures of migra on from and in UkraineKateryna Kulchytska
September 2015 14October 2015 17November 2015 19December 2015 21January 2016 22February 2016 25March 2016 27April 2016 29May 2016 33June 2016 36
POLANDUkrainian migra on in Poland: figures and trends Marta Jaroszewicz
September 2015 40October 2015 42November 2015 44December 2015 46January 2016 48February 2016 51March 2016 54April 2016 57May 2016 61June 2016 65
CZECHIAUkrainian migra on in Czechia: facts and figuresMarkéta Seidlová
September 2015 72October 2015 74November 2015 76December 2015 78January 2016 80February 2016 83March 2016 86April 2016 88May 2016 91June 2016 93
SLOVAKIAUkrainian ci zens in Slovakia: migra on overview Vladimír Benč
September 2015 98October 2015 102November 2015 108December 2015 111January 2016 114February 2016 118March 2016 122April 2016 127May 2016 129June 2016 132
List of tables
UKRAINETab. 1 Total Schengen visas issued to Ukrainians in 2014–2015 30Tab. 2 First instance decisions on applica on for asylum from Ukrainians
in EU member states in January–March 2016 34
POLANDTab. 3 Visas issued by Polish consulates to Ukrainians (2013–2015) 58Tab. 4 Visas issued by Polish consulates to Ukrainians by place of consulate (2015) 58Tab. 5 Visas issued by Polish consulates to Ukrainians and their type (2013–2015) 62Tab. 6 Visas issued by Polish consulates to Ukrainians by place of consulate (2015) 62Tab. 7 All valid permits issued to Ukrainian na onals in Poland
by 31 December of each year 65Tab. 8 Number of visas issued by Poland in Ukraine in 2013–2015 66
CZECHIATab. 9 Applica ons for short-term visas to Czechia 94
SLOVAKIATab. 10 Number of valid residence permits of third countries na onals
in Slovakia (top 10 countries, 2013 and 2014) 100Tab. 11 Illegal migra on in the territory of the Slovak Republic
(Ukrainian ci zens) in 2012–2014 100Tab. 12 Asylum applica ons submi ed in Slovakia (2012–2015) 100Tab. 13 Overview of persons and vehicles crossing the external border
legally at border crossing points by the direc on of crossing (2012–2015) 104Tab. 14 Overview of persons and vehicles crossing the external border
legally by individual border crossing points (2012–2015) 104Tab. 15 Overview of third country na onals who entered the territory of the Schengen
area legally and stayed illegally in EU/SR (overstayers) (2013–2015) 106Tab. 16 Overview of third country na onals who entered the territory of the Schengen
area legally and stayed illegally in EU/SR (overstayers) (2014–2015) 108Tab. 17 Overview of persons and vehicles crossing the external border legally at border
crossing points by the direc on of crossing (January–September 2015) 112Tab. 18 Overview of persons and vehicles crossing the external border legally
by individual border crossing points (January–September 2015) 112Tab. 19 Effec ve returns from the territory of the SR disaggregated by country
of return in 2014–2015 115Tab. 20 Number of decisions on expulsion issued in 2013–2015 116
Tab. 21 Effec ve returns of illegal migrants from the territory of Slovakiato a third country in 2014 by the type of return in 2014–2015 116
Tab. 22 Overview of persons and vehicles crossing the external borderlegally at border crossing points by the direc on of crossing (2012–2015) 118
Tab. 23 Overview of persons and vehicles crossing the external borderlegally by individual border crossing points (2012–2015) 118
Tab. 24 Top na onali es with valid residence permit – third countries na onalsin Slovakia (2013 versus 2015) 120
Tab. 25 Number of valid residence permits of third country na onalsin Slovakia on 31 December 2014 and on 31 December 2015by the purpose of their residence 121
Tab. 26 Overview of illegal migra on on the territory of the Slovak Republicin 2014 and 2015 122
Tab. 27 Illegal stayers disaggregated by na onality and placeof detec on (2014–2015) 124
Tab. 28 Illegal border crossings – top 10 na onali es (2014–2015) 124Tab. 29 Visa applica ons and granted visas by the embassies
of the Slovak Republic by visa type and na onality of applicants –top 10 na onali es (2013–2015) 128
Tab. 30 Security checks related to visa applica ons (2012–2015) 129Tab. 31 Visa refusal rate by consulates of the Slovak Republic by na onality
of applicants – top 4 na onali es (2012–2015) 130Tab. 32 Recommenda ons to reject visa applica ons according to the hit
in Schengen informa on system – top 10 na onali es (2013–2015) 130Tab. 33 Number of security checks of invita ons for visa applica ons (2012–2015) 131Tab. 34 Employment of foreigners in Slovakia (at the end of a year, 2008–2015) 132Tab. 35 The employment of migrants and third-country na onals
in the Slovak Republic according to the dura on of employmentby 31 December 2015 133
Tab. 36 The employment of migrants and third-country na onalsin the Slovak Republic in accordance with the prac ce of the professionby 31 December 2015 133
Tab. 37 The employment of migrants and third-country na onalsin the Slovak Republic by their level of educa on by 31 December 2015 134
List of figures
UKRAINEFig. 1 Number of registered IDPs in September–October 2015 (in thousands) 17Fig. 2 Number of registered IDPs in September–November 2015 (in thousands) 19Fig. 3 IOM assistance to IDPs and popula on affected by conflict in Ukraine 23Fig. 4 Surveyed IDPs by inten ons of migra on within the next 12 months
by current labour market status (%) 31
POLANDFig. 5 The evolu on of number of students from Ukraine in Poland (2005–2016) 67
CZECHIAFig. 6 Share of Ukrainian migrants in the total popula on living in districts
of Czechia (as of 31 December 2015) 81Fig. 7 Share of Ukrainian migrants on the total popula on of foreigners
living in the districts of Czechia (as of 31 January 2016) 84Fig. 8 Share of Ukrainian migrants on the total popula on of foreigners
living in the districts of Czechia (as of 31 March 2016) 89Fig. 9 Granted asylum and subsidiary protec on to Ukrainians in Czechia
(May 2015 – May 2016) 95
SLOVAKIAFig. 10 Valid residence permits for Ukrainian ci zens in Slovakia (2012–2015) 99Fig. 11 Visa applica ons versus granted visas to Ukrainian ci zens
by Slovakia (2012–2015) 99Fig. 12 The Schengen border between Slovakia and Ukraine and border
crossing points 102Fig. 13 Illegal crossing of the state border of the Slovak Republic
(number of persons per month, 2012–2015) 103Fig. 14 Illegal stay in the territory of the Slovak Republic
(number of persons per month, 2012–2015) 107Fig. 15 Illegal crossing of the state border of the Slovak Republic in 2015
(number of persons per month) 109Fig. 16 Illegal stays in the territory of the Slovak Republic in 2015
(number of persons per month) 110Fig. 17 Level of individual indicators of illegal migra on on the territory
of the Slovak Republic (January 2014 – December 2015) 123Fig. 18 Illegal crossings of the state border of the Slovak Republic
and Ukraine (2012–2015) 123Fig. 19 Visa applica ons and granted visa to Ukrainian ci zens
by the Slovak Republic (2012–2015) 127

UkraineMAIN TRENDS AND FIGURES OF MIGRATION FROM AND IN UKRAINE
Kateryna Kulchytska
14 UKRAINE
SEPTEMBER
Security factors influencing Ukrainian migra on pa ern
The poor economic situation and the bloody armed conflict are factors that could po-tentially and significantly increase the migration of Ukrainians to the countries of the European Union (EU). However, this phenomenon has been observed so far mainly in Poland, and it is more accurate to speak about residents of western Ukraine. This is prob-ably the result of two factors: Firstly, the forced migrants from the Donbas have still not developed their migration networks within the EU (in contrast to Russia). Secondly, they still hope that the conflict is temporary, and that they will be able to return to their homes and usual places of residence.
At the same time, due to the conflict in the East of Ukraine, the EU itself fears the import of various security threats into its territory, including terrorism, extremism and principally the uncontrolled proliferation of arms along the part of Ukraine’s border with Russia which is controlled by pro-Russian separatists (approximately 400 km). One solution that could appease these concerns of the EU would be the creation by Ukraine of a well-controlled zone which would isolate the territory occupied by the separatists; another solution would be the creation of a database and of a system of passes which would prevent members of organised crime groups and terrorist organisations from entering Ukrainian territory and obtaining Ukrainian biometric passports.
In the autumn of 2014, the Ukrainian government began to construct a so-called ‘wall’, a system of fortifications along the ceasefire line (trenches, barbed wire, and in the future electronic monitoring) and in January 2015, the government introduced a system for monitoring passenger transport out of the separatist-controlled territories. However, it is hard to believe that Ukraine can continue to build this reinforcement during intense exchanges of fire.
Internally displaced persons (IDPs)
Surprisingly, the conflict in the east of Ukraine has had only li�le impact on the migration situation or on the refugee situation in the European Union. Given the huge number of internally displaced persons, the number of Ukrainians who have applied for refugee status in EU countries (around 10,000 people in 2014, mainly in Poland, Germany and Sweden) is quite modest.
As is quite common throughout the world, the internal displacement in Ukraine is the product of a political crisis. The first wave of displacement occurred in March 2014 prior to Crimea’s referendum to join the Russian Federation. The second wave then fol-lowed aer Russia’s annexation of Crimea. The displaced population consisted mainly
UKRAINE 15
of pro-Ukraine activists, journalists, government officials, and Crimean Tatars (a Muslim ethnic minority group).
According to the State Emergency Service of Ukraine, approximately 20,000 persons out of the total of 1.2 million IDPs in the country are from Crimea.
Refugees/Asylum seekers from Ukraine
In addition to internally displaced persons, many Ukrainians have reportedly sought ref-uge outside of the country. According to the figures provided by governments of receiving countries, as of April 30th, 2015, there were 822,700 Ukrainians who have sought asylum, residence permits, and other forms of legal stay in foreign countries, with the majority going to the Russian Federation (678,200) and to Belarus (81,070).
In addition to these, there were also 3,648 applications for international protection in Germany, 3,270 in Poland, 2,647 in Italy, 1,637 in Sweden, 1,625 in France, and smaller numbers in Moldova, Romania, Hungary, and Slovakia¹.
In 2014, we can speak about a spike of activity of Ukrainian asylum seekers in the EU², as the number of the applications from them increased 13-fold compared with the previous year. However, even 14,050 Ukrainian asylum applicants accounted only for 2.2% of the total number of asylum seekers in the EU from all non-member countries of EU. This trend also continued in the first half of 2015, when 11,440 Ukrainians applied for asylum in the EU-28. But the low speed of processing applications and the high level of rejection of these demands (74%) let us assume that Ukrainian applicants were not priority for EU administrations or not eligible for refugee status. For example, in the first half of 2015, in Poland, there were only 5 positive decisions for Ukrainians applying for asylum, and another 925 applications were rejected.
Labour migrants
The main destination countries of labour migrants were Russia, Poland, Italy and Czechia. The current number of labour migrants from Ukraine working abroad is prob-ably more than 1.2 million people due to socio-economic factors in Ukraine itself. One of the possible ways to track the actual number of Ukrainian labour migrants in the EU is to explore residence permit statistics. However, it is necessary to bear in mind that not all labour migrants are working with valid work permits. According to available data, the number of such permits for Ukrainians in the EU-28 increased by 4% in 2014 if compared with previous year. However, there is still no available information from 6 countries. In more detail, the Ukrainians worked usually for short periods (from 3 to
¹ “UNHCR Ukraine Operational Update, 11–30 April 2015,” UNHCR Kyiv, April 30, 2015, h�p://reliefweb.int/report/ukraine/unhcr-ukraine-operational-update-11-30-april-2015
² h�p://ec.europa.eu/eurostat/statistics-explained/index.php/Asylum_statistics
16 UKRAINE
5 months) in Poland, while in Germany, Slovakia, Lithuania and France it was for more than 12 months.
According to the Polish Ministry of Labour and Social Policy, Ukrainians have received 331,000 simplified certificates allowing them to work in Poland legally (an increase of 50% if compared to the previous year), as well as 26,000 work permits in 2014 (up to October). It should be also remembered that the actual number of Ukrainian citizens working in Poland is in fact lower, as the certificates give to their holders the right to work legally only for a period up to six months. Long-term migrants are those who have their residence permits in Poland; as of February 2015, Ukrainians held 48,000 valid residence permits. Interest in studying in Poland has also increased (supported by both scholarship programmes and the possibility to avoid military service). Many citizens of Ukraine have, however, in fact delayed their final decision to leave their home country: they only de-cided to formally legalise their stay in Poland, while in fact they have not yet le Ukraine.
A new, disturbing phenomenon for the EU is the increased number of journeys un-dertaken by young men from western Ukraine to the EU countries bordering Ukraine in connection with the new wave of recruitment into the army announced at the end of January 2015.
Irregular migrants
Irregular migration (measured by illegal border crossings) on the EU borders with Ukraine has risen, but is still relatively low (a few thousand persons annually), and is not compa-rable with the situation in southern Europe (where 230,000 people tried to enter the EU illegally via the Mediterranean Sea last year). Despite the recent annexation of Crimea and the armed conflict in Eastern Ukraine, there have been no significant changes in irregular migration movements towards the EU. For example, in the first quarter of 2015, 32% fewer³ Ukrainians who were in the EU illegally were detected compared to the previous quarter. Frontex⁴ experts reported that in 2014 detections for illegal border-crossing and document fraud remain insignificant all along the green border with Ukraine. The num-ber of refusals of entry for Ukrainians in 2014 remained comparable to previous years.
³ h�p://frontex.europa.eu/assets/Publications/Risk_Analysis/EB_Q1_2015.pdf ⁴ h�p://statewatch.org/news/2015/jul/eu-frontex-fran-q1.pdf
UKRAINE 17
OCTOBER
Internally displaced persons (IDPs)
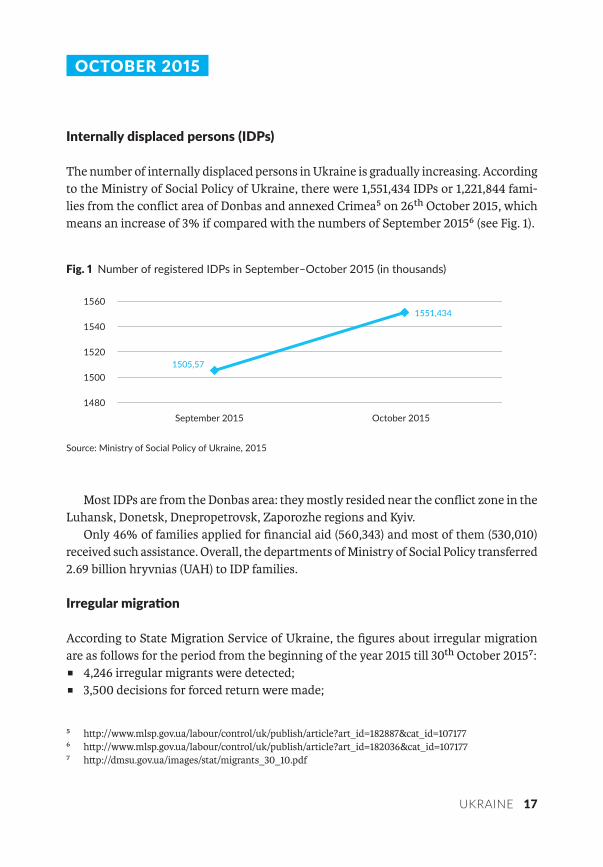
The number of internally displaced persons in Ukraine is gradually increasing. According to the Ministry of Social Policy of Ukraine, there were 1,551,434 IDPs or 1,221,844 fami-lies from the conflict area of Donbas and annexed Crimea⁵ on 26th October 2015, which means an increase of 3% if compared with the numbers of September 2015⁶ (see Fig. 1).
Most IDPs are from the Donbas area: they mostly resided near the conflict zone in the Luhansk, Donetsk, Dnepropetrovsk, Zaporozhe regions and Kyiv.
Only 46% of families applied for financial aid (560,343) and most of them (530,010) received such assistance. Overall, the departments of Ministry of Social Policy transferred 2.69 billion hryvnias (UAH) to IDP families.
Irregular migra on
According to State Migration Service of Ukraine, the figures about irregular migration are as follows for the period from the beginning of the year 2015 till 30th October 2015⁷:
� 4,246 irregular migrants were detected; � 3,500 decisions for forced return were made;
⁵ h�p://www.mlsp.gov.ua/labour/control/uk/publish/article?art_id=182887&cat_id=107177⁶ h�p://www.mlsp.gov.ua/labour/control/uk/publish/article?art_id=182036&cat_id=107177⁷ h�p://dmsu.gov.ua/images/stat/migrants_30_10.pdf
Fig. Number of registered IDPs in September–October (in thousands)
1505,57
1551,434
1480
1500
1520
1540
1560
September 2015 October 2015
Source: Ministry of Social Policy of Ukraine, 2015
18 UKRAINE
� 242 irregular migrants were transferred to the administration of the State Border Service of Ukraine;
� 178 irregular migrants were placed in temporary accommodation centres.
Unfortunately, there is no available information about the age, sex, place of birth or status (IDP) of detected irregular migrants, so it is not possible to have this information about the IDPs who irregularly crossed the border.
Asylum seekers
The last available data about asylum seekers from Ukraine are from 14th August 2015. According to UNHCR⁸, the majority of Ukrainian asylum seekers resided in the Russian Federation (383,300). Much smaller numbers of asylum seekers from Ukraine were regis-tered in Poland (3,900), Belarus (1,200) and Moldova (200). The number of asylum seekers in other countries neighbouring Ukraine does not exceed 60 individuals.
⁸ h�p://unhcr.org.ua/en/2011-08-26-06-58-56/news-archive/1231-internally-displaced-people
UKRAINE 19
NOVEMBER
Internally displaced persons (IDPs)
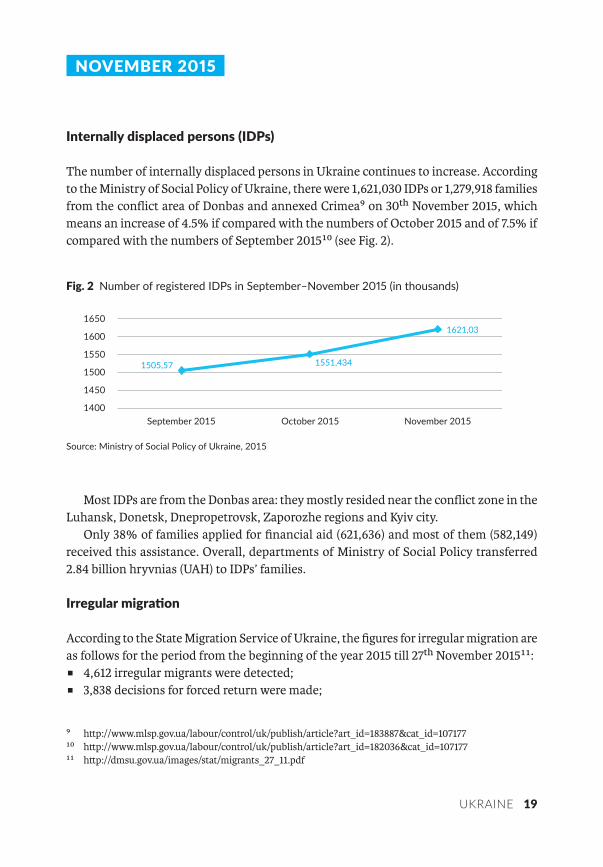
The number of internally displaced persons in Ukraine continues to increase. According to the Ministry of Social Policy of Ukraine, there were 1,621,030 IDPs or 1,279,918 families from the conflict area of Donbas and annexed Crimea⁹ on 30th November 2015, which means an increase of 4.5% if compared with the numbers of October 2015 and of 7.5% if compared with the numbers of September 2015¹⁰ (see Fig. 2).
Most IDPs are from the Donbas area: they mostly resided near the conflict zone in the Luhansk, Donetsk, Dnepropetrovsk, Zaporozhe regions and Kyiv city.
Only 38% of families applied for financial aid (621,636) and most of them (582,149) received this assistance. Overall, departments of Ministry of Social Policy transferred 2.84 billion hryvnias (UAH) to IDPs’ families.
Irregular migra on
According to the State Migration Service of Ukraine, the figures for irregular migration are as follows for the period from the beginning of the year 2015 till 27th November 2015¹¹:
� 4,612 irregular migrants were detected; � 3,838 decisions for forced return were made;
⁹ h�p://www.mlsp.gov.ua/labour/control/uk/publish/article?art_id=183887&cat_id=107177 ¹⁰ h�p://www.mlsp.gov.ua/labour/control/uk/publish/article?art_id=182036&cat_id=107177 ¹¹ h�p://dmsu.gov.ua/images/stat/migrants_27_11.pdf
Fig. Number of registered IDPs in September–November (in thousands)
1505,57 1551,434
1621,03
1400
1450
1500
1550
1600
1650
September 2015 October 2015 November 2015
Source: Ministry of Social Policy of Ukraine, 2015
20 UKRAINE
� 243 irregular migrants were transferred to the administration of the State Border Service of Ukraine;
� 146 irregular migrants were placed in temporary accommodation centres.
As in the previous month, there is still no available information about the age, sex, place of birth or status (IDP) of detected irregular migrants, so it is still not possible to have this information about the IDPs who irregularly crossed the border.
Asylum seekers
As of 30th November 2015, the last available data about asylum seekers are still those from 14th August 2015¹². According to UNHCR, the majority of Ukrainian asylum seekers resided in the Russian Federation (383,300). Much smaller numbers of asylum seekers from Ukraine were registered in Poland (3,900), Belarus (1,200) and Moldova (200).
¹² h�p://unhcr.org.ua/en/2011-08-26-06-58-56/news-archive/1231-internally-displaced-people
UKRAINE 21
DECEMBER
Internally displaced persons (IDPs)
The number of internally displaced persons in Ukraine is gradually increasing. According to the Ministry of Social Policy of Ukraine, there were 1,621,000 IDPs from the conflict area of Donbas and annexed Crimea on 26th October 2015¹³.
Most IDPs are from the Donbas area: they mostly resided near the conflict zone in the Luhansk, Donetsk, Dnepropetrovsk, Zaporozhe regions and Kyiv city.
Irregular migra on
According to the State Migration Service of Ukraine, the figures for irregular migration are as follows for the period from the beginning of the year 2015 till 31st December 2015¹⁴:
� 5,151 irregular migrants were detected; � 4,305 decisions for forced return were made; � 252 irregular migrants were transferred to the administration of the State Border
Service of Ukraine; � 171 irregular migrants were placed in temporary accommodation centres.
Asylum seekers
The report by the UN refugee agency (UNHCR) states that a total of 271,200 Ukrainians have applied for refugee status or temporary asylum in Russia since the outbreak of the Ukraine conflict in 2014.
About 19,000 Ukrainians also applied for asylum in another 67 other countries. Of these, the countries with the highest numbers of Ukrainian asylum seekers are Germany (2,700); Poland and Italy (with roughly 2,100 each) and France (1,400).
¹³ h�p://www.dcz.gov.ua/statdatacatalog/document?id=351058 ¹⁴ h�p://dmsu.gov.ua/images/stat/migrants_31_12.pdf
22 UKRAINE
JANUARY
Internally displaced persons (IDPs)
As of 18th January 2016, the Ministry of Social Policy of Ukraine has reported a total of 1,684,815 registered IDPs. According to the information from structural departments of social protection of the population of the Regional state administrations, there are 1,332,405 registered families from Donbas and Crimea. More than 695,000 displaced families have applied for state financial aid and over 652,000 families have received it. The total amount of the funds transferred to IDPs at the beginning of 2016 was 24,058,000 UAH¹⁵.
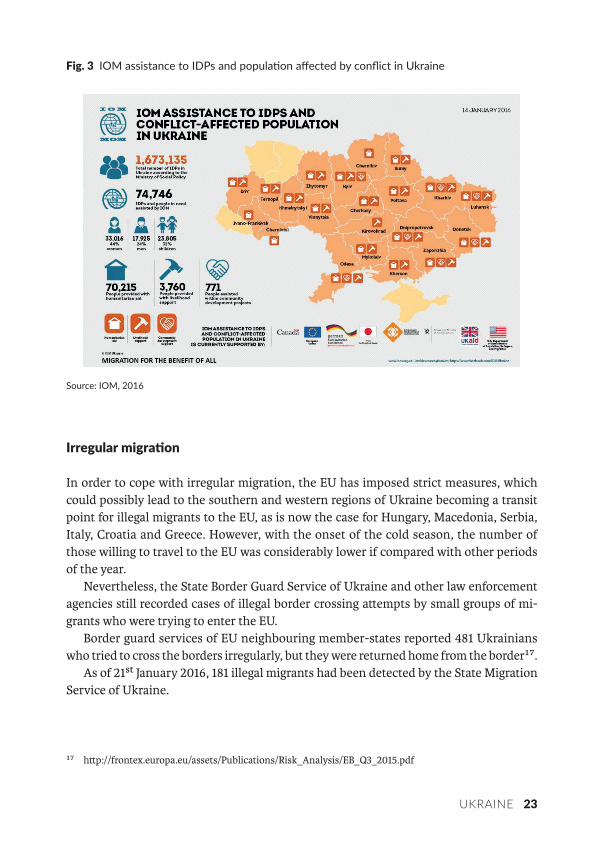
To meet the needs of displaced persons, international organizations actively partici-pated in the assistance to IDPs. As of mid-January, the IOM had assisted almost 75,000 vulnerable internally displaced persons and conflict-affected people in 21 regions of Ukraine (see Fig. 3). They were provided with cash assistance, medicine, hygiene items, clothes and shoes, household items, legal counselling and psychological support, as well as with livelihood support¹⁶.
The most difficult problem for the IDPs remains the provision of housing. Currently, there are only two options for the rese�lement of IDPs: in the private sector (rented houses and apartments) or in state-owned properties (hotels, dormitories, summer camps, health resorts, boarding houses, etc.). For the Lviv region, which is very popular among displaced persons, the se�lement ratio in the private and public sectors is 90% to 10%. A very similar situation can be observed all over Ukraine: only a small propor-tion of displaced persons live in state-owned properties. The usual problem with the buildings designed for temporary accommodation of IDPs, is the delay of state funding. The state has assumed its obligation to compensate for the expenses associated with the accommodation of displaced persons, but in reality, it fails to do so to the level needed. As result, many buildings cannot continue to provide help to displaced persons. At the same time, some displaced persons with disabilities (including disabled children) have the opportunity to live in wellness boarding houses and in health resorts. For example, approximately 2,100 people with disabilities were se�led in the Odessa province (which makes this the province with the largest number of displaced persons with disabilities): 900 of them were placed in health resorts and in boarding houses, whilst the remaining 1,200 were forced to find a place of residence by themselves.
¹⁵ www.mlsp.gov.ua ¹⁶ www.iom.org.ua
UKRAINE 23
Irregular migra on
In order to cope with irregular migration, the EU has imposed strict measures, which could possibly lead to the southern and western regions of Ukraine becoming a transit point for illegal migrants to the EU, as is now the case for Hungary, Macedonia, Serbia, Italy, Croatia and Greece. However, with the onset of the cold season, the number of those willing to travel to the EU was considerably lower if compared with other periods of the year.
Nevertheless, the State Border Guard Service of Ukraine and other law enforcement agencies still recorded cases of illegal border crossing a�empts by small groups of mi-grants who were trying to enter the EU.
Border guard services of EU neighbouring member-states reported 481 Ukrainians who tried to cross the borders irregularly, but they were returned home from the border¹⁷.
As of 21st January 2016, 181 illegal migrants had been detected by the State Migration Service of Ukraine.
¹⁷ h�p://frontex.europa.eu/assets/Publications/Risk_Analysis/EB_Q3_2015.pdf
Fig. IOM assistance to IDPs and popula on affected by conflict in Ukraine
Source: IOM, 2016
24 UKRAINE
Asylum seekers
As of 31st January 2016, the last available data about asylum seekers are still those of 14th August 2015¹⁸. According to UNHCR, the majority of Ukrainian asylum seekers resided in the Russian Federation (383,300). Much smaller numbers of asylum seekers from Ukraine were registered in Poland (3,900), Belarus (1,200) and Moldova (200).
Given that active hostilities are continuing in the countries of origin of asylum seekers in Ukraine, and that EU member states are closing their borders to illegal migrants from North Africa and the Middle East, a flow of migrants (including those willing to travel to the EU) may flood into Ukraine at any moment.
Labour migra on
According to an expert forecast (prepared by the Bloomberg Agency), Ukraine’s GDP will grow by 1.2% in 2016 aer falling by 13% in 2015. However, according to another expert forecast, prepared by the Ministry of Economic Development of Ukraine in December 2015, Ukraine’s real GDP dropped only by 10.3% in 2015 (the most pessimistic estimate speaks about 13.5%, the most optimistic about 9%). However, it is expected that in 2016 it will grow by 1% (the most pessimistic assessment speaks about a decline of 3% in GDP, and the most optimistic speaks about growth of 2.9%). The inflation rate in January–De-cember 2015 was 143.3%, and in December 2015 alone it was 100.7%¹⁹. So the medium term forecast can expect an increase in the flow of labour migrants to the EU.
¹⁸ h�p://unhcr.org.ua/en/2011-08-26-06-58-56/news-archive/1231-internally-displaced-people ¹⁹ www.me.gov.ua
UKRAINE 25
FEBRUARY
Internally displaced persons (IDPs)
As of 22th February 2016, the Ministry of Social Policy of Ukraine registered 1,734,958 IDPs. According to information from structural departments of social protection of the population of the regional state administrations, there are 1,374,054 registered families from Donbas and Crimea. More than 694,946 displaced families have applied for state financial aid, and over 652,000 families received it. The total amount of funds transferred to IDPs at the beginning of 2016 was 56,000 UAH²⁰.
International organizations actively participate in assistance to IDPs in order to meet the needs of displaced persons.
UNDP is actively implementing a project called “Rapid Response to Social and Eco-nomic Issues of Internally displaced persons in Ukraine” (USD 6.3 million), which aims to improve the livelihood of IDPs through employment and entrepreneurship opportunities, access to essential social services, building the capacity of the government to respond to IDPs issues and by promotion of reconciliation and social cohesion.
Another UNDP project “Economic and Social Recovery of Donbas Region” (USD 5 mil-lion) aims to improve the livelihood of local populations in the Donetsk and Luhansk regions by boosting employment and opportunities for creating an income. It includes provision of vocational training, support for small and medium-sized enterprises and businesses, and building the capacity of the government to create a positive business environment.
UNICEF together with the Ministry of Education of Ukraine and local administrations continue to improve access to quality education for children affected by the conflict in Eastern Ukraine (a project worth USD 3.7 million). Thirty-five schools will be renovated in the Donetsk and Luhansk regions to ensure access to education for 10,000 children. Another 30,000 children will receive education kits – equipment and educational articles will be provided for 50 schools in the areas affected by the conflict.
Irregular migra on
Border guard services of EU neighbouring member-states reported 481 Ukrainians who tried to cross the borders illegally, but ended up being returned home from the border²¹.
As of 21st February 2016, 541 illegal migrants were detected by the State Migration Service of Ukraine.
²⁰ h�p://www.mlsp.gov.ua/labour/control/uk/publish/article;jsessionid=BB01C88093217A15B736FF1AAAA90FF8.app1?art_id=186344&cat_id=107177
²¹ h�p://frontex.europa.eu/assets/Publications/Risk_Analysis/EB_Q3_2015.pdf
26 UKRAINE
Asylum seekers
As of the end of February 2016, the last available data about asylum seekers are still those of 14th August 2015²². According to UNHCR, the majority of Ukrainian asylum seekers resided in the Russian Federation (383,300). Much smaller numbers of asylum seekers from Ukraine were registered in Poland (3,900), Belarus (1,200) and Moldova (200).
Some new figures on asylum seekers from Ukraine were, however, published in a re-port by the NGO “Slovo I Dilo”. According to this report, 900,600 people migrated from Ukraine during the years 2014–2015.
Labour migra on
The International organization for Migration (IOM) recently published the results of a survey on migration and remi�ances in Ukraine²³.
According to this study, the sum of money transferred back home by Ukrainians working abroad is higher than the sum of all the funds invested by foreign companies in the country and of money given by international donors to contribute to development. Ukrainian migrant workers transferred almost 2.8 billion USD in 2014 through formal and informal channels. In addition, about 100 million US dollars was received in goods as in-kind remi�ances.
The results of this study also show that the Russian Federation remained the main country of destination for Ukrainian migrant workers (30% of Ukrainian migrant work-ers) in 2014. The other most important destinations for long-term migrant workers were Poland (21%), Czechia (15%) and Italy (11%).
²² h�p://unhcr.org.ua/en/2011-08-26-06-58-56/news-archive/1231-internally-displaced-people ²³ h�p://www.iom.org.ua/sites/default/files/iom_migration_as_an_enabler_of_development_in_ukraine.pdf
UKRAINE 27
MARCH
Internally displaced persons (IDPs)
As of 4th April 2016, the Ministry of Social Policy of Ukraine registered 1,760,972 IDPs. According to the information from structural departments of social protection of the population, there were 1,407,382 registered families from Donbas and Crimea. 787,660 of the displaced families have applied for state financial aid, and over 736,000 families received it. The total amount of funds transferred to IDPs at the beginning of 2016 was more than 868,000 UAH²⁴.
The State Security Service has strengthened control over social payments for regis-tered IDPs since February 2016. By the end of March 2016, the prosecutors had already begun 40 criminal proceedings against local officials who appointed social payments to fictitious IDPs²⁵. According to the Minister of Social Policy of Ukraine, Pavlo Rozenko, these criminal proceedings were initiated only against officials who appointed social payments for people registered at fictitious addresses in government-controlled areas.
At the same time, the United Nations Office for the Coordination of Humanitarian Affairs stresses that the Ukrainian government has suspended social payments and started the procedure of verification for registered IDPs from five eastern Ukrainian re-gions (Dnipropetrovsk, Donetsk, Kharkiv, Zaporizhia and Luhansk) owing to suspicions of fraud schemes²⁶. As the official data are not available, the field reports have indicated that more than 600,000 IDPs may have had their social welfare payments suspended or in the process of their ultimate cancelation.
International organizations actively participate in the assistance to IDPs in order to meet the needs of displaced persons. The IOM has launched a number of training sessions for self-employment and to boost micro-business development for IDPs and hosted community members in Donetsk, Luhansk, Kharkiv, Odesa, Zaporizhia, Poltava, Dnipropetrovsk, Vinnytsia, Lviv, Ternopil, Kyiv, Khmelnytsky, Zhytomyr, Cherkasy, Sumy, Mykolayiv, Kirovograd and Kherson regions²⁷. Currently, grants are being provided to the winners.
UNHCR have provided 5 million UAH to support internally displaced persons (IDPs) in the framework of the “Station Region” project in Kharkiv region in 2016²⁸. Within this project, the IDPs will receive access to funding for community based initiatives, new
²⁴ h�p://www.mlsp.gov.ua/labour/control/uk/publish/article;jsessionid=BB01C88093217A15B736FF1AAAA90FF8.app1?art_id=186344&cat_id=107177
²⁵ h�p://www.mlsp.gov.ua/labour/control/uk/publish/article?art_id=187874&cat_id=107177 ²⁶ h�p://reliefweb.int/sites/reliefweb.int/files/resources/bulletin_march_16_v1_eng.pdf ²⁷ h�p://iom.org.ua/en/assisting-displaced-persons-and-affected-communities²⁸ h�p://unhcr.org.ua/en/
28 UKRAINE
vocational training, social counselling, and internet services at the community centres run by partner NGO “Station Kharkiv”.
Irregular migra on
From the beginning of the year till 1st April 2016, 1,376 irregular migrants were detected by the State Migration Service of Ukraine²⁹. 1,240 decisions for forced return to Ukraine were made as well as 83 decisions for forced deportation from Ukraine. 191 individuals were placed in temporary accommodation centres. 52 individuals (including 9 Ukrainians) illegally crossing the external borders of the European Union on the Eastern route³⁰ were also detected.
Asylum seekers
At the end of March 2016, the last available data about Ukrainian asylum seekers are those of 2015. The majority³¹ of Ukrainian asylum seekers were seeking refuge in the Russian Federation (459,500), and significantly smaller numbers in Italy (4,685), Germany (4,660), Spain (3,345) and Poland (2,295).
According to the statistics of Federal Migration Service of the Russian Federation, more than 414,000 Ukrainian citizens applied for temporary asylum in the Russian Fed-eration during the years 2014–2015 and 96% of them received a positive decision³². Only 325 Ukrainian citizens have received refugee status in the Russian Federation although 6,000 have applied for it. The number of asylum seekers from Ukraine in Belarus is sig-nificantly lower. According to the statistics of Ministry of Internal Affairs of Belarus, 1,600 Ukrainian citizens applied for asylum there and 1,000 received subsidiary protection³³ during the years 2014–2015.
Labour migra on
According to the survey on migration and remi�ances in Ukraine, conducted by the In-ternational Organization for Migration, it is expected that 1.6% of the total population of Ukraine will be engaged in long-term labour migration by 2016³⁴. The Russian Federation, Poland, Czechia, Italy and Belarus are the top five destination countries and account for about 80% of total current short-term and long-term emigration from Ukraine. The main sectors of employment of migrants are construction, manufacturing, hospitality, domestic care and agriculture.
²⁹ h�p://dmsu.gov.ua/images/stat/migrants_01_04_16.pdf ³⁰ h�p://frontex.europa.eu/trends-and-routes/migratory-routes-map/ ³¹ h�p://unhcr.org.ua/en/2011-08-26-06-58-56/news-archive/1231-internally-displaced-people ³² h�ps://www.fms.gov.ru/about/activity/stats/Statistics/Predostavlenie_ubezhishha_v_Rossijskoj ³³ h�p://mvd.gov.by/main.aspx?guid=69883 ³⁴ h�p://www.iom.org.ua/sites/default/files/iom_migration_as_an_enabler_of_development_in_ukraine.pdf
UKRAINE 29
APRIL
Internally displaced persons (IDPs)
Armed conflict in the eastern Ukraine and the annexation of Crimea has caused massive rese�lement inside Ukraine. On 4th May 2016, the Ministry of Social Policy of Ukraine registered 1,783,361 IDPs or 1,441,324 families from Donbas and Crimea. 816,021 displaced families have applied for state financial aid, and more than 762,000 families received it. The total amount of funds transferred to IDPs since the beginning of 2016 is already 1,164,797 UAH³⁵.
A new Ministry for Temporary Occupied Territories and Internally Displaced Persons of Ukraine, headed by Vadym Chernysh³⁶, was created on 20th April 2016. One of the biggest challenges faced by this newly established Ministry is the issue of social pay-ments. According to the UN, the Government suspended payments to 600,000 IDPs in February 2016 in order to verify their status, because of suspicion of fraud schemes. The humanitarian community called upon the Government to halt the suspensions and draw up a scheme for the prevention of fraud based on national and international human rights standards³⁷. Ukrainian NGOs have also prepared a proposed resolution for the Cabinet of Ministers of Ukraine (No. 509, “On account of internally displaced persons”) in order to avoid irreparable consequences for IDPs who would be le without means of subsist-ence³⁸.
The international organizations still continue to assist IDPs. In April 2016, the UNHCR renovated the surgical unit at the Mariupol Oncology Dispensary where 2,878 IDPs were treated during 2015³⁹. In addition, a new Centre for support to the family, the elderly and protection of women was opened in Sviatohirsk, Donetsk region (a government-controlled area) with the support of UNHCR. Besides Sviatohirsk, such centres will also run in Sloviansk and in Krasnyi Lyman. IDPs and local residents will have access to a wide range of services, including legal, social and psychological assistance, employment ad-vice, vocational training, etc.⁴⁰ The UNHCR also provided non-food items and emergency shelter to more than 3,000 people⁴¹ in April 2016.
³⁵ h�p://www.mlsp.gov.ua/labour/control/uk/publish/article?art_id=188646&cat_id=107177 ³⁶ h�p://www.kmu.gov.ua/control/ru/cardnpd?docid=248982208 ³⁷ h�p://www.un.org.ua/en/information-centre/news/3834-10-things-you-need-to-know-about-ukraines-
crisis ³⁸ h�p://donbasssos.org/220160427_lyst/ ³⁹ h�p://unhcr.org.ua/en/2011-08-26-06-58-56/news-archive/1585-unhcr-renovates-surgery-unit-at-mari-
upol-oncology-dispensary ⁴⁰ h�p://unhcr.org.ua/en/2011-08-26-06-58-56/news-archive/1588-centers-for-idps-and-local-communities-
opened-in-northern-donetsk-with-support-of-unhcr ⁴¹ h�p://reliefweb.int/sites/reliefweb.int/files/resources/5614d3�9.pdf
30 UKRAINE
Irregular migra on
FFrom the beginning of the year till 29th April 2016, 1,785 irregular migrants were detected by the State Migration Service of Ukraine⁴², which means that their number continues to grow. 1,632 decisions for forced return to Ukraine were made, as well as 101 decisions for forced deportation from Ukraine. 190 individuals were placed in temporary accom-modation centres.
Asylum seekers
As of the end of April 2016, data about Ukrainians who applied for asylum in 2016 are available only for some EU member states. According to the older data, the majority⁴³ of asylum seekers from Ukraine went to the Russian Federation (459,500). Significantly smaller numbers were registered in Italy (4,685), Germany (4,660), Spain (3,345) and Poland (2,295).
Labour migra on
The ILO Decent Work Technical Support Team and the Country Office for Central and Eastern Europe have conducted a targeted survey of 2,000 IDPs aged 18–70 years in June 2015 in 9 regions of Ukraine, titled “Employment needs assessment and employability of internally displaced persons in Ukraine”. According to the results of this survey, the majority of IDPs (61%) do not plan to move somewhere else within next 12 months⁴⁴. About 17% plan to return to their previous place of residence, 6.6% would probably move
⁴² h�p://dmsu.gov.ua/images/stat/migrants_29_04_2016.pdf ⁴³ h�p://unhcr.org.ua/en/2011-08-26-06-58-56/news-archive/1231-internally-displaced-people ⁴⁴ h�p://www.ilo.org/wcmsp5/groups/public/---europe/---ro-geneva/---sro-budapest/documents/publica-
tion/wcms_457535.pdf
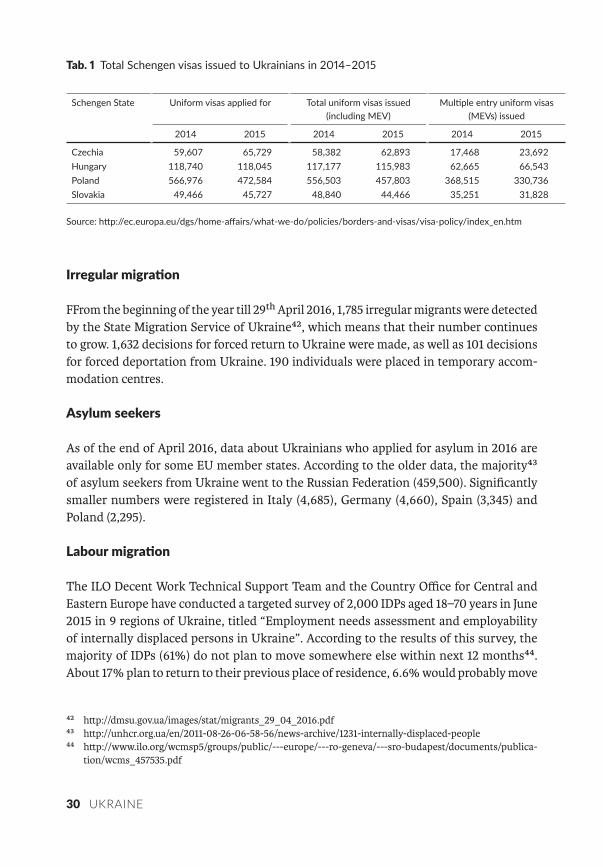
Tab. Total Schengen visas issued to Ukrainians in –
Schengen State Uniform visas applied for Total uniform visas issued (including MEV)
Mul ple entry uniform visas (MEVs) issued
2014 2015 2014 2015 2014 2015
Czechia 59,607 65,729 58,382 62,893 17,468 23,692Hungary 118,740 118,045 117,177 115,983 62,665 66,543Poland 566,976 472,584 556,503 457,803 368,515 330,736Slovakia 49,466 45,727 48,840 44,466 35,251 31,828
Source: h p://ec.europa.eu/dgs/home-affairs/what-we-do/policies/borders-and-visas/visa-policy/index_en.htm
UKRAINE 31
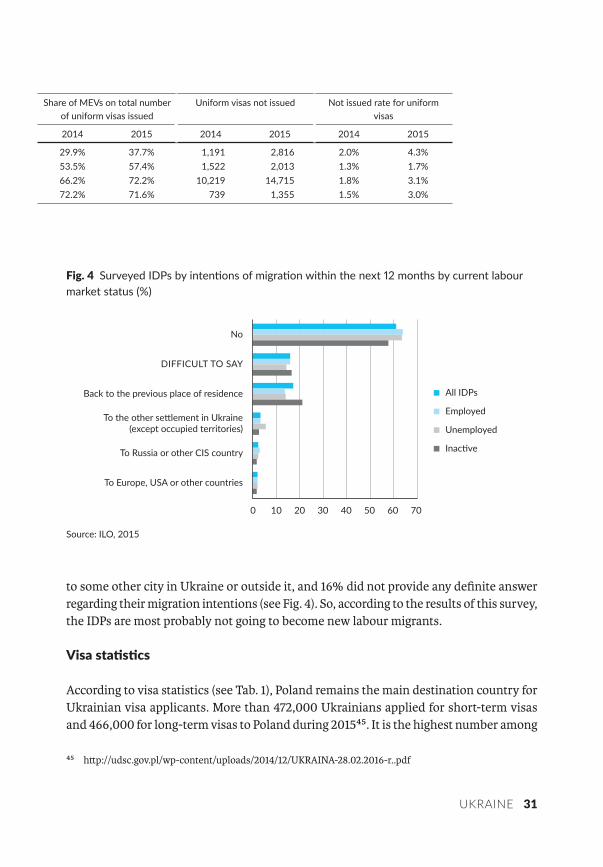
to some other city in Ukraine or outside it, and 16% did not provide any definite answer regarding their migration intentions (see Fig. 4). So, according to the results of this survey, the IDPs are most probably not going to become new labour migrants.
Visa sta s cs
According to visa statistics (see Tab. 1), Poland remains the main destination country for Ukrainian visa applicants. More than 472,000 Ukrainians applied for short-term visas and 466,000 for long-term visas to Poland during 2015⁴⁵. It is the highest number among
⁴⁵ h�p://udsc.gov.pl/wp-content/uploads/2014/12/UKRAINA-28.02.2016-r..pdf
Share of MEVs on total number of uniform visas issued
Uniform visas not issued Not issued rate for uniform visas
2014 2015 2014 2015 2014 2015
29.9% 37.7% 1,191 2,816 2.0% 4.3%53.5% 57.4% 1,522 2,013 1.3% 1.7%66.2% 72.2% 10,219 14,715 1.8% 3.1%72.2% 71.6% 739 1,355 1.5% 3.0%
Fig. Surveyed IDPs by inten ons of migra on within the next months by current labour market status (%)
0 10 20 30 40 50 60 70
No
DIFFICULT TO SAY
Back to the previous place of residence
To Russia or other CIS country
To Europe, USA or other countries
(except occupied territories)
All IDPs
Source: ILO, 2015
32 UKRAINE
both Visegrad countries and Schengen-member states. However, if compared to 2014, the number of Ukrainian Schengen visa applicants to Poland decreased by 16%.
One of the positive trends is the increased percentage of multiply entry visas issued to Ukrainians by Visegrad countries. In 2015 this increased by 4% for Ukrainian appli-cants to Hungary, by 6% for applicants to Poland, and by 8% for applicants to Czechia. The exception is Slovak visa practice, where the share of multiply entry visas slightly decreased (0.6%).
The main concern of Ukrainian visa applicants is the level of visa refusals which in-creased among all Visegrad countries (see Tab. 1). The highest rates of visa refusals was registered in Czech consulates (4.3%), the lowest in consulates of Hungary (1.7%). The consulate-general of Poland in Vinnytsia made the (negative) record as it denied visas to 12% of applicants. Last year this consulate-general refused to issue visas to only 1.6% Ukrainians. The level of refusals also increased in the consulate-general of Poland in other cities of Ukraine, but the level of refusal was more “normal” (1.4–4.3%).
UKRAINE 33
MAY
Internally displaced persons (IDPs)
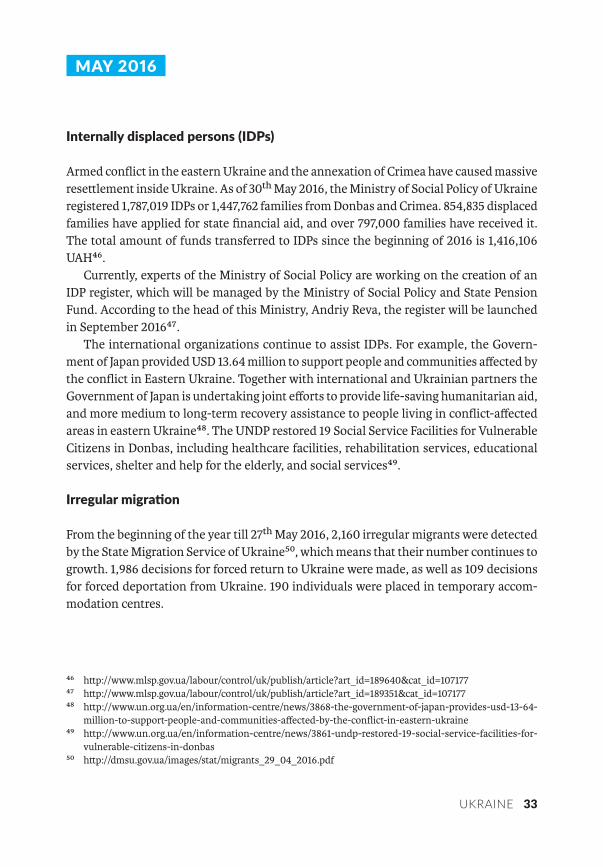
Armed conflict in the eastern Ukraine and the annexation of Crimea have caused massive rese�lement inside Ukraine. As of 30th May 2016, the Ministry of Social Policy of Ukraine registered 1,787,019 IDPs or 1,447,762 families from Donbas and Crimea. 854,835 displaced families have applied for state financial aid, and over 797,000 families have received it. The total amount of funds transferred to IDPs since the beginning of 2016 is 1,416,106 UAH⁴⁶.
Currently, experts of the Ministry of Social Policy are working on the creation of an IDP register, which will be managed by the Ministry of Social Policy and State Pension Fund. According to the head of this Ministry, Andriy Reva, the register will be launched in September 2016⁴⁷.
The international organizations continue to assist IDPs. For example, the Govern-ment of Japan provided USD 13.64 million to support people and communities affected by the conflict in Eastern Ukraine. Together with international and Ukrainian partners the Government of Japan is undertaking joint efforts to provide life-saving humanitarian aid, and more medium to long-term recovery assistance to people living in conflict-affected areas in eastern Ukraine⁴⁸. The UNDP restored 19 Social Service Facilities for Vulnerable Citizens in Donbas, including healthcare facilities, rehabilitation services, educational services, shelter and help for the elderly, and social services⁴⁹.
Irregular migra on
From the beginning of the year till 27th May 2016, 2,160 irregular migrants were detected by the State Migration Service of Ukraine⁵⁰, which means that their number continues to growth. 1,986 decisions for forced return to Ukraine were made, as well as 109 decisions for forced deportation from Ukraine. 190 individuals were placed in temporary accom-modation centres.
⁴⁶ h�p://www.mlsp.gov.ua/labour/control/uk/publish/article?art_id=189640&cat_id=107177 ⁴⁷ h�p://www.mlsp.gov.ua/labour/control/uk/publish/article?art_id=189351&cat_id=107177 ⁴⁸ h�p://www.un.org.ua/en/information-centre/news/3868-the-government-of-japan-provides-usd-13-64-
million-to-support-people-and-communities-affected-by-the-conflict-in-eastern-ukraine ⁴⁹ h�p://www.un.org.ua/en/information-centre/news/3861-undp-restored-19-social-service-facilities-for-
vulnerable-citizens-in-donbas ⁵⁰ h�p://dmsu.gov.ua/images/stat/migrants_29_04_2016.pdf
34 UKRAINE
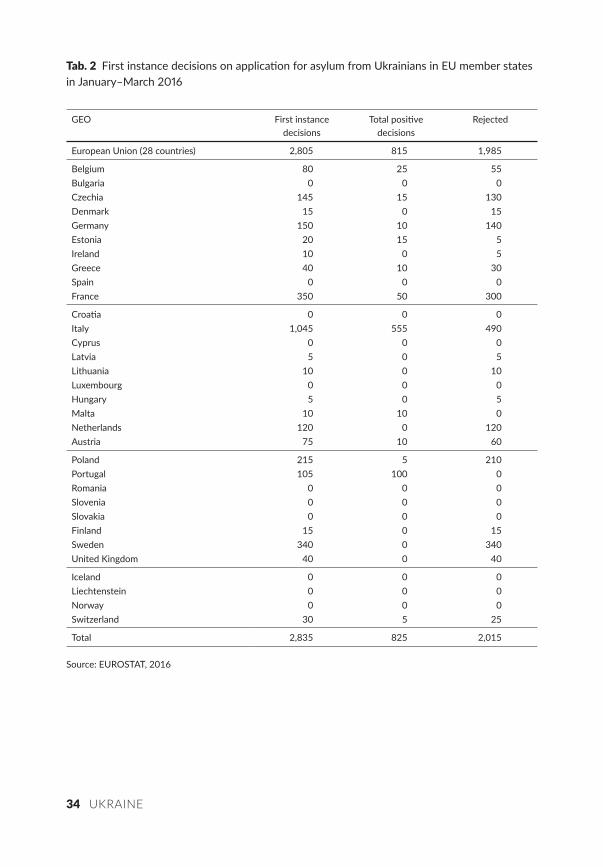
Tab. First instance decisions on applica on for asylum from Ukrainians in EU member states in January–March
GEO First instance decisions
Total posi ve decisions
Rejected
European Union (28 countries) 2,805 815 1,985
Belgium 80 25 55Bulgaria 0 0 0Czechia 145 15 130Denmark 15 0 15Germany 150 10 140Estonia 20 15 5Ireland 10 0 5Greece 40 10 30Spain 0 0 0France 350 50 300
Croa a 0 0 0Italy 1,045 555 490Cyprus 0 0 0Latvia 5 0 5Lithuania 10 0 10Luxembourg 0 0 0Hungary 5 0 5Malta 10 10 0Netherlands 120 0 120Austria 75 10 60
Poland 215 5 210Portugal 105 100 0Romania 0 0 0Slovenia 0 0 0Slovakia 0 0 0Finland 15 0 15Sweden 340 0 340United Kingdom 40 0 40
Iceland 0 0 0Liechtenstein 0 0 0Norway 0 0 0Switzerland 30 5 25
Total 2,835 825 2,015
Source: EUROSTAT, 2016
UKRAINE 35
Asylum seekers
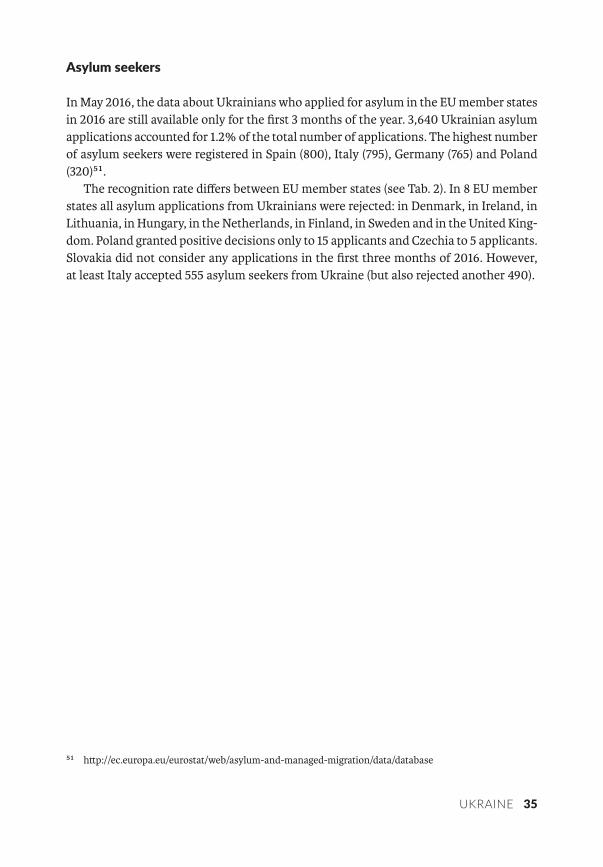
In May 2016, the data about Ukrainians who applied for asylum in the EU member states in 2016 are still available only for the first 3 months of the year. 3,640 Ukrainian asylum applications accounted for 1.2% of the total number of applications. The highest number of asylum seekers were registered in Spain (800), Italy (795), Germany (765) and Poland (320)⁵¹.
The recognition rate differs between EU member states (see Tab. 2). In 8 EU member states all asylum applications from Ukrainians were rejected: in Denmark, in Ireland, in Lithuania, in Hungary, in the Netherlands, in Finland, in Sweden and in the United King-dom. Poland granted positive decisions only to 15 applicants and Czechia to 5 applicants. Slovakia did not consider any applications in the first three months of 2016. However, at least Italy accepted 555 asylum seekers from Ukraine (but also rejected another 490).
⁵¹ h�p://ec.europa.eu/eurostat/web/asylum-and-managed-migration/data/database
36 UKRAINE
JUNE
Internally displaced persons (IDPs)
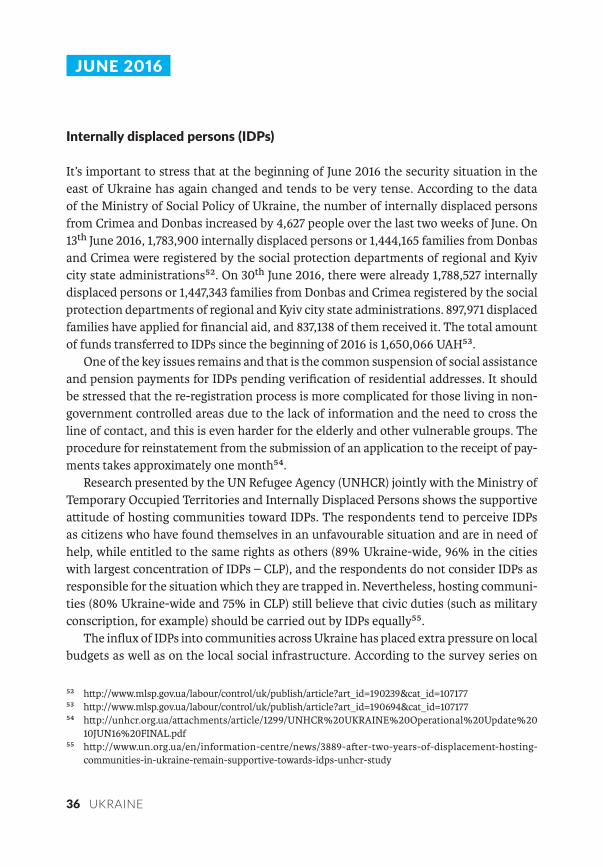
It’s important to stress that at the beginning of June 2016 the security situation in the east of Ukraine has again changed and tends to be very tense. According to the data of the Ministry of Social Policy of Ukraine, the number of internally displaced persons from Crimea and Donbas increased by 4,627 people over the last two weeks of June. On 13th June 2016, 1,783,900 internally displaced persons or 1,444,165 families from Donbas and Crimea were registered by the social protection departments of regional and Kyiv city state administrations⁵². On 30th June 2016, there were already 1,788,527 internally displaced persons or 1,447,343 families from Donbas and Crimea registered by the social protection departments of regional and Kyiv city state administrations. 897,971 displaced families have applied for financial aid, and 837,138 of them received it. The total amount of funds transferred to IDPs since the beginning of 2016 is 1,650,066 UAH⁵³.
One of the key issues remains and that is the common suspension of social assistance and pension payments for IDPs pending verification of residential addresses. It should be stressed that the re-registration process is more complicated for those living in non-government controlled areas due to the lack of information and the need to cross the line of contact, and this is even harder for the elderly and other vulnerable groups. The procedure for reinstatement from the submission of an application to the receipt of pay-ments takes approximately one month⁵⁴.
Research presented by the UN Refugee Agency (UNHCR) jointly with the Ministry of Temporary Occupied Territories and Internally Displaced Persons shows the supportive a�itude of hosting communities toward IDPs. The respondents tend to perceive IDPs as citizens who have found themselves in an unfavourable situation and are in need of help, while entitled to the same rights as others (89% Ukraine-wide, 96% in the cities with largest concentration of IDPs – CLP), and the respondents do not consider IDPs as responsible for the situation which they are trapped in. Nevertheless, hosting communi-ties (80% Ukraine-wide and 75% in CLP) still believe that civic duties (such as military conscription, for example) should be carried out by IDPs equally⁵⁵.
The influx of IDPs into communities across Ukraine has placed extra pressure on local budgets as well as on the local social infrastructure. According to the survey series on
⁵² h�p://www.mlsp.gov.ua/labour/control/uk/publish/article?art_id=190239&cat_id=107177 ⁵³ h�p://www.mlsp.gov.ua/labour/control/uk/publish/article?art_id=190694&cat_id=107177 ⁵⁴ h�p://unhcr.org.ua/a�achments/article/1299/UNHCR%20UKRAINE%20Operational%20Update%20
10JUN16%20FINAL.pdf ⁵⁵ h�p://www.un.org.ua/en/information-centre/news/3889-aer-two-years-of-displacement-hosting-
communities-in-ukraine-remain-supportive-towards-idps-unhcr-study
UKRAINE 37
IDP integration recently launched by the International Organization for Migration (IOM), housing and lack of employment remain the biggest obstacles to the integration of IDPs. Only slightly more than a half of those employed before displacement managed to find a job in their new place of residence. About 40% of surveyed IDPs claim that they have to save even on food. About 70% of IDPs are renting accommodation and complain about high rents⁵⁶.
Irregular migra on
From the beginning of the year till 24th June 2016, 2,616 irregular migrants were detected by the State Migration Service of Ukraine⁵⁷, which means that their number continues to growth. 2,403 decisions for forced return to Ukraine were made as well as 136 decisions for forced deportation from Ukraine. 173 individuals were placed in temporary accom-modation centres⁵⁸.
Asylum seekers
The UNHCR, using particular national asylum authorities, have given the total number of Ukrainians currently seeking asylum or other forms of legal stay in neighbouring countries as 1,389,452, with the majority going to the Russian Federation (1,092,212) and Belarus (139,143). 261 Ukrainians have sought asylum in Moldova, 79 in Romania, 71 in Hungary and 26 in Slovakia.
Since the beginning of the crisis till 10th June 2016, the top five receiving countries of asylum seekers from Ukraine within the EU were Germany (7,967 applications for international protection), Italy (7,267), Poland (5,153), France (3,176) and Sweden (2,742)⁵⁹.
The same data source also reveals that there was a daily average net flow of 219 people leaving Ukraine for the Russian Federation at the time of reporting period (from 14th May to 10th June), which represents a reversal of the trend seen in recent months of more people entering Ukraine.
⁵⁶ h�p://www.iom.org.ua/en/idps-and-host-communities-need-comprehensive-support-and-innovative-solutions-cope-recovery-and
⁵⁷ h�p://dmsu.gov.ua/images/stat/migrants_27_05_2016.pdf ⁵⁸ h�p://dmsu.gov.ua/images/stat/migrants_24_06_2016.pdf ⁵⁹ h�p://unhcr.org.ua/a�achments/article/1299/UNHCR%20UKRAINE%20Operational%20Update%20
10JUN16%20FINAL.pdf

38 UKRAINE
PolandUKRAINIAN MIGRATION IN POLAND: FIGURES AND TRENDS
Marta Jaroszewicz
40 POLAND
SEPTEMBER
Main figures
As of mid-September 2015, the number of long-term residence permits issued to Ukrai-nian citizens totalled 62,000 (for comparison the same number at the end of 2013 was 37,000). In 2015 (by mid-September) Ukrainian citizens submi�ed 39,000 applications for temporary stay permits, 6,300 applications for permanent residence and 651 applications for the status of EU long-term resident. In total, Ukrainian citizens submi�ed 63% of all applications for different type of residence permits. Moreover, in the first six months of this year Ukrainian citizens received 402,000 so-called “employer’s declarations” for short-term employment (a complementary scheme to work permits). For comparison, in the entire 2014, Ukrainians received 372,000 declarations. As far as asylum applications are concerned, in 2015 (till 24th September) Ukrainian citizens submi�ed 1,865 applica-tions for international protection (compared with 2,318 in the whole of 2014).
Irregular migra on
There are no estimations of the possible stock of irregular migrants. No research on that subject has been conducted in Poland since the outbreak of armed conflict in Eastern Ukraine. However, the irregular migration of Ukrainians to Poland may be growing as there are an increasing number of illegal stay detections and refusals of entry.
Main determinants
As 2013–2014 Forecasting migration… research has shown (2014)¹, the main pull factors a�racting Ukrainian migrants to Poland are language and cultural proximity, low costs of travel, and liberal migration and visa policies. Poland is currently the main destination state for Ukrainian migrants in the EU.
Currently there is no statistical or qualitative evidence to determine whether the growth of migration from Ukraine is stimulated by war-related factors.
¹ M. Jaroszewicz, M. Lesińska (eds.) (2014): Forecasting Migration Between the EU, V4 and Eastern Europe. Impact of Visa Abolition. Warsaw: Centre for Eastern Studies.
POLAND 41
Migra on pa erns
There are two significantly different types of migration pa�erns represented by Ukrai-nians in Poland. The first one is short-term circular labour migration, governed by the liberal rules of short-term access to the Polish labour market. The bulk of the Ukrainian migrants who come to Poland are in this group and usually have no intention to stay in Po-land. The other group, smaller but constantly growing, are long-term migrants who look for permanent jobs in Poland, study there or are married to Polish citizens. A particular feature of Ukrainian migration in Poland is the predominance of women (around 60%).
42 POLAND
OCTOBER
Main figures
The migration dynamics in Poland are still characterized by a significant increase in the number of residence applications of different types made by Ukrainian citizens. In Janu-ary–October 2015, 55,000 Ukrainian citizens applied for residence permits in Poland (63% of all the residence applications submi�ed in Poland). 47,500 Ukrainians asked for temporary stay permits and 7,278 asked for permanent residence. In general, between January and October 2015 foreign citizens submi�ed more than 88,000 applications for residence permits of different types in Poland. In comparison, in a similar period in 2014 (i.e. January–October 2014) the observed growth in the number of all kinds of residence applications totalled 67%, mostly due to increased interest on the part of Ukrainians. In October 2015, only 7,331 Ukrainians applied for residence permits in Poland.
However, the biggest increase can be observed in the case of short-term migration for labour purposes. In the first six months of this year (2015) Ukrainian citizens received 402,000 so-called “employer’s declarations” for short-term work (a complementary scheme for work permits). In comparison, in the whole of 2014 Ukrainians received only 372,000 declarations. Unfortunately monthly data related to the “employer’s declara-tions” are not yet available.
As far as asylum applications are concerned, in 2015 (till 1st November) 2,016 Ukrai-nian citizens submi�ed applications for international protection (in the whole of 2014 there were 2,318). While the growth in asylum applications was considerable in the first half of the year, currently we can observe a decrease. Currently the main nationality of people applying for asylum or other forms of protection in Poland are Russians (mainly inhabitants of Northern Caucasus). In October 2015, 115 Ukrainians submi�ed asylum claims (while the number for Russians was 1,128, i.e. 10 times more). The newest trend with regard to Ukrainian asylum seekers in Poland is the growing numbers of Ukrainians who receive refugee status or subsidiary protection aer an appeal. Up to 1st November 2015, seven Ukrainians received refugee status in Poland and 14 received subsidiary protection.
Irregular migra on
There are no estimations related to the possible stock of irregular migrants. No research on that subject has been conducted in Poland since the outbreak of armed conflict in Eastern Ukraine. However, irregular migration of Ukrainians to Poland may be growing as there are an increasing number of illegal stay detections and refusals of entry.
POLAND 43
Main determinants
As 2013–2014 Forecasting migration… research has shown (2014)², the main pull factors a�racting Ukrainian migrants to Poland are language and cultural proximity, low costs of travel, liberal migration and visa policies. Poland is currently the main destination state for Ukrainian migrants in the EU.
Currently there is no statistical or qualitative evidence to determine whether the growth in migration from Ukraine is stimulated by war-related factors.
Migra on pa erns
There are two significantly different types of migration pa�erns represented by Ukrai-nians in Poland. The first one is short-term circular labour migration, governed by the liberal rules of short-term access to the Polish labour market. The bulk of Ukrainian mi-grants who come to Poland are in from this group and usually have no intention to stay in Poland. The other group, smaller but constantly growing, are long-term migrants who look for permanent jobs in Poland, study there or are married to Polish citizens. A notable feature of Ukraine’s migration in Poland is the predominance of women (around 60%).
² M. Jaroszewicz, M. Lesińska (eds.) (2014): Forecasting Migration Between the EU, V4 and Eastern Europe. Impact of Visa Abolition. Warsaw: Centre for Eastern Studies.

44 POLAND
NOVEMBER
Main figures
The migration dynamics in Poland are still characterized by a significant increase in the number of residence applications of different types issued to Ukrainian citizens, albeit this growth slowed down in the second half of this year.
In January–November 2015, more than 63,000 Ukrainian citizens applied for resi-dence permits in Poland (63% of all residence applications submi�ed in Poland). 54,208 Ukrainians asked for temporary stay and 8,050 asked for permanent residence. In general, in January–November 2015, foreign citizens submi�ed more than 100,000 applications for different kinds of residence permits in Poland. In comparison to a similar period in January–November 2014, the observed growth in the number of residence permit applica-tions lodged by Ukrainian citizens rose by 153% in the case of temporary stay and 88% in the case of permanent stay.
However, the biggest increase can be observed in the case of short-term migration for labour purposes. In the first six months of this year (2015), Ukrainian citizens received 402,000 so-called “employer’s declarations” for short-term employment (a complemen-tary scheme for work permits). For comparison, in the whole of 2014, Ukrainians received 372,000 declarations. Unfortunately monthly data related to “employer’s declarations” are not yet available.
As far as asylum applications are concerned, in 2015 (till December 1st) 2,179 Ukrai-nian citizens submi�ed applications for international protection (in the whole of 2014 it was 2,318). While there was a considerable growth in asylum applications in the first half of the year, currently we can observe a decrease. Currently the main nationality whose representatives ask for asylum or other forms of protection in Poland are Russians (mainly inhabitants of the Northern Caucasus). In November 2015, 34 Ukrainians submit-ted asylum claims (while the number for Russians was 193). Ukrainians accounted for 19% of asylum claims lodged in January–November 2015. The newest trend with regard to Ukrainian asylum seekers in Poland is the growing number of Ukrainians who received refugee status or subsidiary protection aer an appeal.
Irregular migra on
There are no estimations related to the possible stock of irregular migrants. Since the outbreak of armed conflict in Eastern Ukraine no research on that subject has been con-ducted in Poland. However the irregular migration of Ukrainians to Poland may be grow-ing as suggested by an increasing number of illegal stay detections and refusals of entry.
POLAND 45
Main determinants
As 2013–2014 Forecasting migration… research has shown (2014)³, the main pull factors a�racting Ukrainian migrants to Poland are language and cultural proximity, low costs of travel and liberal migration and visa policies. Poland is currently the main destination state for Ukrainian migrants in the EU.
Currently there is no statistical or qualitative evidence to determine whether the growth of migration from Ukraine is stimulated by war-related factors.
Migra on pa erns
There are two significantly different types of migration pa�erns represented by Ukrai-nians in Poland. The first one is short-term circular labour migration, governed by the liberal rules of short-term access to the Polish labour market. The bulk of Ukrainian migrants who come to Poland fall into from this group and usually have no intention to stay in Poland. The other group, smaller but constantly growing, are long-term migrants who look for permanent jobs in Poland, study there or are married to Polish citizens. A particular feature of Ukraine’s migration in Poland is the predominance of women (around 60%).
³ M. Jaroszewicz, M. Lesińska (eds.) (2014): Forecasting Migration Between the EU, V4 and Eastern Europe. Impact of Visa Abolition. Warsaw: Centre for Eastern Studies.
46 POLAND
DECEMBER
Main figures
The Polish Office for Foreigners has just published its report for 2015. According to its data, Ukrainians were the second most frequent nationality that asked for asylum in Poland (aer Russian citizens) in 2015. However, the gap between asylum claims submit-ted by Russians and those by Ukrainian citizens was high – 7,922 Russians asked for asylum compared with only 2,295 Ukrainians. Also interesting is that the majority of the applications by Russian citizens were submi�ed in the second half of the year, while in the case of Ukrainian citizens they were in the first half of a year. With regard to newly submi�ed applications in 2015, 1,594 Ukrainians asked for asylum in Poland for the first time. Around 50% of all asylum seekers in Poland were women and 46% were children. No Ukrainian citizen received refugee status on their first application. Six Ukrainians received so-called “tolerated stay” status. At the same time, the Ukrainian citizens were the largest group when it comes to the number of residence permit applications submit-ted – in 2015 they submi�ed 68,000 applications for temporary and permanent stay.
It is possible that refugee status or other forms of international or national protection will be issued to more Ukrainian citizens in the future. This is not related to the number of Ukrainians applying for citizenship (that is decreasing as indicated above). There are two other reasons for that. First of all, Ukrainian citizens have started more oen to appeal against negative asylum decisions issued in the first instance and in a few cases they have been successful. The second reason is that in 2015, the Polish government organized two campaigns of organized relocation of Ukrainian citizens of Polish origin. The family members of those relocated people who did not have a “Polish Card” asked for political asylum in Poland. Altogether 119 persons asked for political asylum, and out of them, 56 persons received it.
However, the biggest increase in numbers can be observed in the case of short-term migration for labour purposes. In the first six months of this year Ukrainian citizens received 402,000 so-called “employer’s declarations” for short-term employment (a complementary scheme for work permits). For comparison, in the entire 2014, Ukrai-nians received 372,000 declarations. Unfortunately monthly data related to “employer’s declarations” are not yet available. The data for entire 2015 are expected to be available at the end of January 2016.
POLAND 47
Irregular migra on
There are no estimations related to the possible stock of irregular migrants. Since the outbreak of armed conflict in Eastern Ukraine no research on that subject has been conducted in Poland. However the irregular migration of Ukrainians to Poland may be growing as there are an increasing number of illegal stay detections and refusals of entry.
Main determinants
As 2013–2014 Forecasting migration… research showed (2014)⁴, the main pull factors at-tracting Ukrainian migrants in Poland are language and cultural proximity, low costs of travel, liberal migration and visa policies. Poland is currently the main destination state for Ukrainian migrants in the EU.
Currently there is no statistical or qualitative evidence to determine whether the growth in migration from Ukraine is stimulated by war-related factors. However, the large number of asylum applications submi�ed by Ukrainian citizens in 2014 and 2015 as well as the small, albeit increasing, number of Ukrainians who receive refugee status, could suggest that this is the case.
Migra on pa erns
There are two significantly different types of migration pa�erns represented by Ukrai-nians in Poland. The first one is short-term circular labour migration, governed by the liberal rules of short-term access to the Polish labour market. The bulk of the Ukrainian migrants who come to Poland fall into this group and usually have no intention to stay in Poland. The other group, smaller but constantly growing, are long-term migrants who look for permanent jobs in Poland, study there or are married to Polish citizen. A par-ticular feature of Ukrainian migration in Poland is the predominance of women (around 60%).
⁴ M. Jaroszewicz, M. Lesińska (eds.) (2014): Forecasting Migration Between the EU, V4 and Eastern Europe. Impact of Visa Abolition. Warsaw: Centre for Eastern Studies.
48 POLAND
JANUARY
Main figures
The Polish Ministry for Family, Labour and Social Policy has just published its report for 2015 (i.e. January till November 2015) on the number of labour permits issued and on the number of so-called “employer’s declarations” for short-term labour migrants issued in 2015. This is the most important source of information on the number of Ukrainian migrants living in Poland, as most of them stay in Poland within the framework of the facilitated labour migration scheme (that allows citizens of Armenia, Belarus, Georgia, Moldova, Russia and Ukraine to work without work permits for up to 6 months in a year, holding only a national visa “D”, not a residence permit). According to that data, in January–October 2015, 665,956 declarations allowing short-term employment of foreign-ers were issued (a growth of 101% in comparison to data registered in the same period the previous year, i.e. 2014). It should however be emphasized that the biggest increase was recorded at the beginning of 2015, and then it was gradually decreasing in the fol-lowing months. According to the prognosis available for 2015 as a whole, fewer than 800,000 “employer’s declarations” were issued in 2015. 97.7% of all declarations issued in January–October 2015 were for Ukrainian citizens. Altogether 650,590 declarations were issued to Ukrainian citizens. Agriculture remains the main sphere of employment for which declarations were granted (38% of all declarations, although a huge increase has been noticed in other sectors including industry manufacturing, scientific and technical activities and administrative services. What is very interesting is the fact that the number of women who obtained an “employer’s declaration” has decreased. This fact requires further investigation to see whether it is a starting point for new migration pa�erns.
The Polish Office for Foreigners has just published its report for 2015. According to its data, Ukrainians were the second most frequent nation requesting asylum in Poland (aer Russian citizens) in 2015. However, the gap between asylum claims submi�ed by Russians and by Ukrainian citizens was high – 7,922 Russians asked for asylum compared with only 2,295 Ukrainians. What is also interesting is that the majority of the applications by Russian citizens were submi�ed in the second half of the year, while for Ukrainian citizens it was in the first half of the year. With regard to newly submi�ed applications in 2015, 1,594 Ukrainians asked for asylum in Poland for the first time. Around 50% of all asylum seekers in Poland were women. 46% of all applicants were children. As for the positive asylum decisions issued in the first instance, no Ukrainian citizen received refugee status. Six Ukrainians received so-called “tolerated stay” status. At the same time, Ukrainian citizens were the largest group when it comes to the number of residence per-mit applications submi�ed – in 2015 they submi�ed 68,000 applications for temporary and permanent residence.

POLAND 49
It is possible that refugee status or other forms of international or national protec-tion will be issued to more Ukrainian citizens in the future. This is not related to the number of Ukrainians applying for citizenship (that is decreasing as indicated above). There are two other reasons for this. First of all, Ukrainian citizens have started more oen to appeal against negative asylum decisions issued in the first instance and in a few cases they were successful. The second reason is that in 2015, the Polish government has organized two campaigns of organized relocation of Ukrainian citizens of Polish origin. The family members of those relocated people who did not have a “Polish Card” asked for political asylum in Poland. Altogether 119 persons asked for political asylum, and of them, 56 persons received that status.
When it comes to the visas issued by Polish consulates to Ukrainian citizens in 2015, altogether 924,000 visas were issued, of which there were 457,000 single visas (so-called Schengen visas) and 466,000 national visas (only those visas entitle the holder to short-term work in Poland).
Irregular migra on
There are no estimations related to the possible stock of irregular migrants. Since the outbreak of armed conflict in Eastern Ukraine no research on that subject has been con-ducted in Poland. However the irregular migration of Ukrainians to Poland is possibly growing, as can be seen from the increasing number of illegal stay detections and refusals of entry.
Main determinants
As 2013–2014 Forecasting migration… research has shown (2014)⁵, the main pull factors a�racting Ukrainian migrants to Poland are language and cultural proximity, low costs of travel and liberal migration and visa policies. Poland is currently the main destination state for Ukrainian migrants in the EU.
Currently there is no statistical or qualitative evidence to determine whether the growth of migration from Ukraine is stimulated by war-related factors.
However the high number of asylum applications submi�ed by Ukrainian citizens in 2014 and 2015 as well as the small, albeit increasing, number of Ukrainians who receive the refugee status could suggest so.
The European migration crisis has accelerated the tense migration debate both in society and among the political elite. In general, anti-immigrant sentiments have grown as well as the level of xenophobia. Anti-refugee slogans have become one of the main subjects raised at public demonstrations. This has led also to an increase in a�acks on a
⁵ M. Jaroszewicz, M. Lesińska (eds.) (2014): Forecasting Migration Between the EU, V4 and Eastern Europe. Impact of Visa Abolition. Warsaw: Centre for Eastern Studies.
50 POLAND
racial/ethnic basis, which were previously virtually absent in Polish society. The growing number of Ukrainians a�empting to enter the Polish labour market has also raised fears among local workers over available jobs. In January in Kutno local inhabitants a�acked a shelter occupied by Ukrainian labour migrants. At the same time Ukrainian migrants started to be more oen presented in public debate as being much closer to Poles in terms of cultural, language and ethnic composition than Muslim refugees from Syria or other conflict zones in the Middle East and Africa, who Poland has agreed to accept under EU-wide refugee re-se�lement schemes.
Migra on pa erns
There are two significantly different types of migration pa�erns represented by Ukrai-nians in Poland. The first one is short-term circular labour migration, governed by the liberal rules of short-term access to the Polish labour market. The bulk of the Ukrainian migrants who come to Poland are in this group and usually have no intention to stay in Poland. The other group, smaller but constantly growing, are the long-term migrants who look for permanent jobs in Poland, study there or are married to Polish citizen. A particular feature of Ukrainian migration in Poland is the predominance of women (around 60%). However, in 2015, for the very first time in many years, male immigrants predominated.
POLAND 51
FEBRUARY
Main figures
The Polish Ministry for Family, Labour and Social Policy has finally published its report for 2015 on the number of labour permits and the number of “employer’s declarations” for short-term labour migrants issued in 2015. This is the most important source of informa-tion on the number of Ukrainian migrants living in Poland as most of them stay in Poland within the framework of the facilitated labour migration scheme (that allows citizens of Armenia, Belarus, Georgia, Moldova, Russia and Ukraine to work without work permits for up to 6 months in a year, holding only a national visa “D”, not a residence permit). Ac-cording to that data, in January–December 2015 782,222 declarations allowing short-term employment of foreigners were issued (a growth of more than 100% in comparison to data registered in the same period of the previous year). 98% of all declarations issued in 2015 were for Ukrainian citizens, with a total of 762,700 declarations issued to Ukrainians. It should be however emphasized that the greatest growth was recorded at the beginning of 2015 and it was gradually decreasing in the following months. The highest number of declarations were registered in February and March, then it decreased but stayed at a stable range of around 60,000 declarations per month for the rest of 2015. Most of the declarations were issued in the Mazovian district, followed by the Lower Silesia and Upper Silesia Districts. Agriculture remains the main sphere of employment for which declarations were concerned (38% of all declarations), although a big increase has been noticed in other sectors including industry manufacturing, scientific and technical activi-ties, and administrative services. What is very interesting is the fact that the number of women who obtained “employer’s declarations” has decreased. This fact requires further investigation to see whether it is a starting point for new migration pa�erns.
When it comes to work permits that Ukrainian citizens need to obtain in order to work legally in Poland for a period longer than 6 months in a year, 55,731 work permits were issued in 2015 to Ukrainian citizens.
The Polish Office for Foreigners has just published its report for 2015. According to its data, Ukrainians were the second most frequent nation that asked for asylum in Poland (aer Russian citizens) in 2015. However, the gap between asylum claims submi�ed by Russians and by Ukrainian citizens was high – 7,922 Russians requested asylum compared with only 2,295 Ukrainians. What is also interesting is that the majority of the applications by Russian citizens were submi�ed in the second half of the year, while in the case of Ukrainian citizens it was in the first half of the year. With regard to newly submi�ed claims in 2015, 1,594 Ukrainians asked for asylum in Poland for the first time. Around 50% of all asylum seekers in Poland were women and 46% were children. When it comes to the positive asylum decisions issued in the first instance, no Ukrainian citizen received refugee
52 POLAND
status. Six Ukrainians received so-called “tolerated stay” status. At the same time, Ukrainian citizens were leading when it comes to the number of residence permit applications submit-ted – in 2015 they submi�ed 68,000 applications for temporary and permanent residence.
It is possible that refugee status or other forms of international or national protection will be issued to more Ukrainian citizens in the future. This is not related to the number of Ukrainians applying for citizenship (that is decreasing as indicated above). There are two other reasons for that. First of all, Ukrainian citizens have started more oen to appeal against negative asylum decisions issued in the first instance and in a few cases they were successful. The second reason is that in 2015, the Polish government has organized two campaigns of organized relocation of Ukrainian citizens of Polish origin. The members of families of those relocated people who did not have a Polish Card asked for political asylum in Poland. Altogether 119 persons asked for political asylum, and of them, 56 persons received that status.
When it comes to the visas issued by Polish consulates to Ukrainian citizens in 2015, altogether 924,000 visas were issued, including 457,000 single visas (so-called Schengen visas) and 466,000 national visas (only those visas entitle the holder to short-term work in Poland). In the first two months of 2016, 133 Ukrainian citizens submi�ed first time asylum claims, while second claims were submi�ed by 104 Ukrainians. In comparison to the equivalent time period of the previous year, the number of asylum claims made by Ukrainian citizens decreased by 55%. Moreover, in January–February 2014 four Ukrai-nians received subsidiary protection status.
In terms of residence permit applications, in January–February 2016, Ukrainian citizens submi�ed 11,252 applications for temporary stay and 1,181 applications for per-manent residence.
Irregular migra on
There are no estimations related to the possible stock of irregular migrants. Since the out-break of armed conflict in Eastern Ukraine no research on that subject has been conducted in Poland. However the irregular migration of Ukrainians to Poland is possibly growing as can be seen from the increasing number of illegal stay detections and refusals of entry.
Main determinants
As 2013–2014 Forecasting migration… research showed (2014)⁶ the main pull factors at-tracting Ukrainian migrants in Poland are language and cultural proximity, low costs of travel, liberal migration and visa policies. Poland is currently the main destination state for Ukrainian migrants in the EU.
⁶ M. Jaroszewicz, M. Lesińska (eds.) (2014): Forecasting Migration Between the EU, V4 and Eastern Europe. Impact of Visa Abolition. Warsaw: Centre for Eastern Studies.
POLAND 53
Currently there is no statistical or qualitative evidence to determine whether the growth in migration from Ukraine is stimulated by war-related factors. However the considerable number of asylum applications submi�ed by Ukrainian citizens in 2014 and 2015 as well as the small, albeit increasing, number of Ukrainians who received refugee status could suggest that this is the case.
The European migration crisis has accelerated the tense migration debate both in the society and among the political elite. In general, anti-immigrant sentiments have grown as well as level of xenophobia. Anti-refugee slogans have become one of the main subjects raised at public demonstrations. This has led also to an increase in a�acks on a racial/ethnic basis, which had previously been virtually absent in Polish society. The growing number of Ukrainians a�empting to enter the Polish labour market has also raised fears among local workers over available jobs. In January in Kutno local inhabitants a�acked a shelter occupied by Ukrainian labour migrants. At the same time Ukrainian migrants started to be more oen presented in public debate as being much closer to Poles in terms of cultural, language and ethnic composition than Muslim refugees from Syria or other conflict zones in Middle East and Africa, who Poland has agreed to accept under EU-wide refugee re-se�lement schemes.
Migra on pa erns
There are two significantly different types of migration pa�erns represented by Ukrainians in Poland. The first one is short-term circular labour migration, governed by the liberal rules of short-term access to the Polish labour market. The bulk of the Ukrainian migrants who come to Poland fall into this group and usually have no intention to stay in Poland. The other group, smaller but constantly growing, are the long-term migrants who look for permanent jobs in Poland, study there or are married to Polish citizens. One notable feature of Ukrainian migration in Poland is the predominance of women (around 60%). However, in 2015, for the very first time in many years, the wave was predominated by male immigrants.
The first examination of in-depth migrant interviews, conducted within the framework of our current research project with 20 Ukrainian migrants, has shown the existence of two different migration models in use by Ukrainian citizens. The first model, more common for migrants from Western Ukraine who have contacts with Poland on a daily basis, is characterized by regular circular migration with more independent a�empts to find a job, and by only very loose links to the conflict in eastern Ukraine (understood as a general feel-ing – a decreased level of security and stability). The second model is more common among migrants from Eastern Ukraine, who came to Poland with the intention of staying there for a couple of years. They usually rely on migration networks, do not use job advertisements available in Polish and their link to conflict in Eastern Ukraine is more straightforward – usually they are not the direct victims of armed conflict, but have social contacts with those openly affected. This hypothesis is preliminary and requires further confirmation.
54 POLAND
MARCH
Main figures
The Polish Ministry for Family, Labour and Social Policy has finally published its report for 2015 on the number of labour permits and the number of so-called “employer’s declarations” for short-term labour migrants issued in 2015. This is the most important source of information on the number of Ukrainian migrants living in Poland as most of them stay in Poland within the framework of the facilitated labour migration scheme (that allows citizens of Armenia, Belarus, Georgia, Moldova, Russia and Ukraine to work without work permits for up to 6 months in a year, holding only a national visa “D”, not a residence permit). According to that data, in January–December 2015 782,222 declarations allowing short-term employment of foreigners were issued (a growth of more than 100% in comparison to data registered in the same period the previous year). 98% of all dec-larations issued in 2015 fall to Ukrainian citizens. Altogether 762,700 declarations were issued to Ukrainian citizens. It should be however emphasized that the greatest growth was recorded at the beginning of 2015, and it was gradually decreasing in the following months. When it comes to work permits that Ukrainian citizens need to obtain in order to work legally in Poland for a period longer than 6 months in a year, in 2015 55,731 work permits were issued to Ukrainian citizens. There is no data for the first three months of 2016. Data are published every six months.
Expert interviews conducted in January–March 2016 within the framework of the cur-rent project confirmed, however, that the simplified legal migration scheme remains the main legal channel used by Ukrainian labour migrants. Moreover, according to experts’ knowledge, the number of Ukrainian citizens originating from Eastern Ukraine who use that scheme has probably increased. However, there is no statistical confirmation of this, as the Ministry for Family, Labour and Social Policy does not gather data broken down by the detailed place of origin. As far as the demographic characteristics of migrants applying for short-term labour visa are concerned, their main features have remained stable since 2012. The majority of applicants are in the 25–34 age range, a small number in the 34–45 range and only around 15% are in the 45–54 range.
When it comes to applications for temporary residence permits, in the reporting period 18,213 Ukrainians submi�ed such requests while 1,859 applied for permanent residence permits.
The Polish Office for Foreigners has also published data for the first three months of 2016. In January–March 2016 (till 7th April) 194 Ukrainian citizens requested asylum for the first time (altogether total of 123 asylum claims were submi�ed). When it comes to second (renewed) applications, 144 Ukrainian citizens applied (81 applications altogether). When comparing this with the same period in the previous year, we can observe a drop of
POLAND 55
58% in the number of asylum claims submi�ed by Ukrainian citizens. In January–March 2016, six Ukrainians received subsidiary protection status.
It is possible that refugee status or other forms of international or national protection will be issued to more Ukrainian citizens in the future. In 2015 the Polish government has organized two campaigns of organized relocation of Ukrainian citizens of Polish origin. The members of families of those relocated people who did not have a “Polish Card” requested political asylum in Poland. Altogether 119 persons asked for political asylum, and of them, 56 persons were successful.
When it comes to the visas issued by Polish consulates to Ukrainian citizens in 2015, 924,000 visas were issued, and of these, 457,000 were single visas (so-called Schengen visas) and 466,000 national visas (only those visas entitle the holder to short-term work in Poland). In the first two months of 2016 133 Ukrainian citizens submi�ed first time asylum claims, while repeat claims were submi�ed by 104 Ukrainians. In comparison to the equivalent time period of last year the number of asylum claims made by Ukrainian citizens decreased by 55%. Moreover, in January–February 2016 four Ukrainians received subsidiary protection status.
In terms of residence permit applications, in January–February 2016 Ukrainian citizens submi�ed 11,252 applications for temporary residence and 1,181 applications for permanent residence.
The Polish Ministry of Foreign Affairs publishes its consular report annually. The report for 2015 was delayed and will be published in mid-April. However, more regular information available concerns local border-traffic permits. In January–March 2016 (till 7th April 2016) the Polish consulate in Lviv issued 9,121 permits and the Polish consulate in Luck only 5,369 permits.
Irregular migra on
There are no estimations related to the possible stock of irregular migrants. Since the out-break of armed conflict in Eastern Ukraine no research on that subject has been conducted in Poland. However the irregular migration of Ukrainians to Poland may be growing, as can be seen from the increasing number of illegal stay detections and refusals of entry.
Main determinants
As 2013–2014 Forecasting migration… research has shown (2014)⁷, the main pull factors a�racting Ukrainian migrants to Poland are language and cultural proximity, low costs of travel and liberal migration and visa policies. Poland is currently the main destination state for Ukrainian migrants in the EU.
⁷ M. Jaroszewicz, M. Lesińska (eds.) (2014): Forecasting Migration Between the EU, V4 and Eastern Europe. Impact of Visa Abolition. Warsaw: Centre for Eastern Studies.
56 POLAND
Currently there is no statistical or qualitative evidence to determine whether the growth of migration from Ukraine is stimulated by war-related factors.
However, the substantial number of asylum applications submi�ed by Ukrainian citizens in 2014 and 2015 as well as the small, albeit increasing, number of Ukrainians who receive refugee status could suggest that this is the case.
The European migration crisis has accelerated a heated migration debate both in the society as well as among the political elite. In general, anti-immigrant sentiments have risen as well as the level of xenophobia. Anti-refugee slogans have become one of the main subjects raised at public demonstrations. This has also led to an increase in a�acks on a racial/ethnic basis, which were previously virtually absent in Polish society. The growing number of Ukrainians a�empting to enter the Polish labour market has also raised fears among local workers over available jobs. In January in Kutno local inhabitants a�acked a shelter occupied by Ukrainian labour migrants. At the same time Ukrainian migrants started to be more oen presented in public debate as being much closer to Poles in terms of cultural, language and ethnic composition, in comparison to Muslim refugees from Syria or other conflict zones in Middle East and Africa Poland has agreed to accept under EU-wide refugee re-se�lement schemes.
Migra on pa erns
There are two significantly different types of migration pa�erns represented by Ukrai-nians in Poland. The first one is short-term circular labour migration, governed by the liberal rules of short-term access to the Polish labour market. The bulk of the Ukrainian migrants who come to Poland come from this group and usually have no intention to stay in Poland. The other group, smaller but steadily growing, are the long-term migrants who look for permanent jobs in Poland, study there or are married to Polish citizens. One notable feature of Ukrainian migration in Poland is the predominance of women (around 60%). However, 2015 brought, for the very first time in many years, a wave predominated by male immigrants.
The first examination of in-depth migrant interviews, conducted within the framework of our current research project with 20 Ukrainian migrants, has shown the existence of two different migration models in use by Ukrainian citizens. The first model, more common for migrants from Western Ukraine who have contacts with Poland on a daily basis, is characterized by regular circular migration with more independent a�empts to find work, and by only very loose links to the conflict in eastern Ukraine (understood as a general feel-ing – a decreased level of security and stability). The second model is more common among migrants from Eastern Ukraine, who came to Poland with the intention to stay there for a couple of years. They usually rely on migration networks, do not use job advertisements available in Polish and their link to the conflict in Eastern Ukraine is more straightforward – usually they are not the direct victims of armed conflict, but have social contacts with those openly affected. This hypothesis is preliminary and requires further confirmation.
POLAND 57
APRIL
Main figures
Simplified labour scheme and labour permitsThe Polish Ministry for Family, Labour and Social Policy has finally published its
report for 2015 on the number of labour permits and of so-called “employer’s declara-tions” for short-term labour migrants issued in 2015. This is the most important source of information on the number of Ukrainian migrants living in Poland as most of them stay in Poland within the framework of the facilitated labour migration scheme (that allows citizens of Armenia, Belarus, Georgia, Moldova, Russia and Ukraine to work without work permits for up to 6 months in a year, holding only a national visa “D”, not a resi-dence permit). According to that data, in January–December 2015 782,222 declarations allowing short-term employment of foreigners were issued (a growth of more than 100% in comparison to data registered in the same period last year). 98% of all declarations issued in 2015 were for Ukrainian citizens. Altogether 762,700 declarations were issued to Ukrainian citizens. There is no data for the first three months of 2016. Data are published every six months.
Expert interviews conducted in January–March 2016 within the framework of the cur-rent project confirmed, however, that the simplified legal migration scheme remains the main legal channel used by Ukrainian labour migrants. Moreover, experts suggest that the number of Ukrainian citizens originating from Eastern Ukraine who use that scheme has probably increased. However, there is no statistical confirmation, as the Ministry for Family, Labour and Social Policy does not gather data broken down by the detailed place of origin. The demographic characteristics of migrants applying for short-term labour visas have remained largely stable since 2012. The majority of applicants are in the 25–34 age range, a small number in the 34–45 range and only around 15% are in the 45–54 range.
Residence permits and asylumThe Polish Office for Foreigners has also published its asylum data. In January–April
2016 (till 5th May) 244 Ukrainian citizens asked for asylum for the first time (altogether 160 asylum claims were submi�ed). As to second (renewed) applications, 231 Ukrainian citizens applied (a total of 121 applications). In comparison to the equivalent time period of the last year the number of asylum claims made by Ukrainian citizens decreased by 50%. In January–March 2016 nine Ukrainians received subsidiary protection status.
It is possible that refugee status or other forms of international or national protection will be issued to more Ukrainian citizens in the future. In 2015 the Polish government organized two campaigns of organized relocation of Ukrainian citizens of Polish origin. The members of families of those relocated people who did not have a “Polish Card” asked
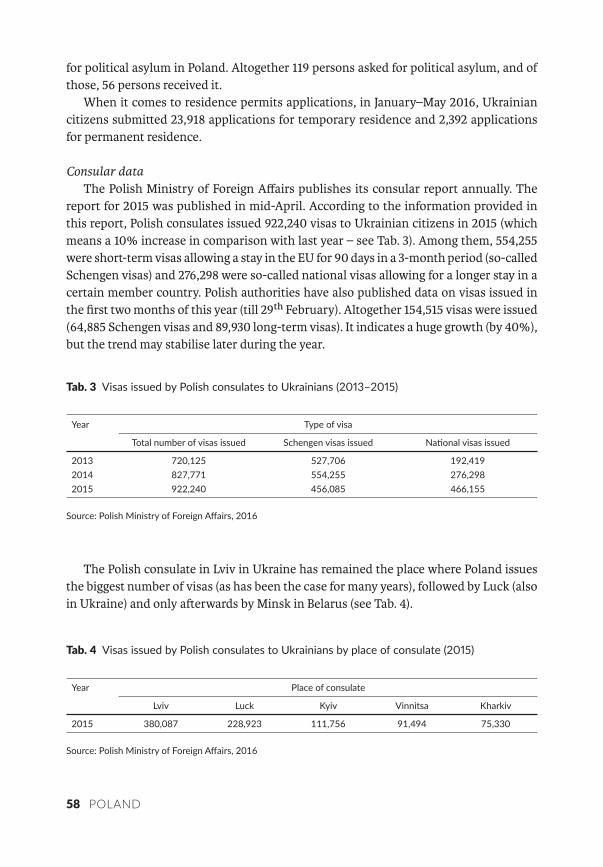
58 POLAND
for political asylum in Poland. Altogether 119 persons asked for political asylum, and of those, 56 persons received it.
When it comes to residence permits applications, in January–May 2016, Ukrainian citizens submi�ed 23,918 applications for temporary residence and 2,392 applications for permanent residence.
Consular dataThe Polish Ministry of Foreign Affairs publishes its consular report annually. The
report for 2015 was published in mid-April. According to the information provided in this report, Polish consulates issued 922,240 visas to Ukrainian citizens in 2015 (which means a 10% increase in comparison with last year – see Tab. 3). Among them, 554,255 were short-term visas allowing a stay in the EU for 90 days in a 3-month period (so-called Schengen visas) and 276,298 were so-called national visas allowing for a longer stay in a certain member country. Polish authorities have also published data on visas issued in the first two months of this year (till 29th February). Altogether 154,515 visas were issued (64,885 Schengen visas and 89,930 long-term visas). It indicates a huge growth (by 40%), but the trend may stabilise later during the year.
Tab. Visas issued by Polish consulates to Ukrainians ( – )
Year Type of visa
Total number of visas issued Schengen visas issued Na onal visas issued
2013 720,125 527,706 192,4192014 827,771 554,255 276,2982015 922,240 456,085 466,155
Source: Polish Ministry of Foreign Affairs, 2016
The Polish consulate in Lviv in Ukraine has remained the place where Poland issues the biggest number of visas (as has been the case for many years), followed by Luck (also in Ukraine) and only aerwards by Minsk in Belarus (see Tab. 4).
Tab. Visas issued by Polish consulates to Ukrainians by place of consulate ( )
Year Place of consulate
Lviv Luck Kyiv Vinnitsa Kharkiv
2015 380,087 228,923 111,756 91,494 75,330
Source: Polish Ministry of Foreign Affairs, 2016
POLAND 59
Since 2008 the Polish consular offices have been issuing a so-called “Polish Card”, which is granted to persons of Polish origin (understood widely, mostly as being able to prove that her/his ancestors had Polish citizenship and that he/she is rooted in Polish culture). The holders of this card are eligible to receive a long-term national visa free of charge and do not need to obtain a work permit to be legally employed in Poland. 9,647 persons applied for this card in Ukraine in 2015.
Irregular migra on
There are no estimations related to the possible stock of irregular migrants. Since the outbreak of armed conflict in Eastern Ukraine no research on that subject has been conducted in Poland. However the irregular migration of Ukrainians to Poland may be growing, as can be seen from the increasing number of illegal stay detections and refusals of entry.
Main determinants
As 2013–2014 Forecasting migration… research showed (2014)⁸ the main pull factors at-tracting Ukrainian migrants in Poland are language and cultural proximity, low costs of travel, liberal migration and visa policies. Poland is currently the main destination state for Ukrainian migrants in the EU.
Currently there is no statistical or qualitative evidence to determine whether the growth in migration from Ukraine is stimulated by war-related factors. However the substantial number of asylum applications submi�ed by Ukrainian citizens in 2014 and 2015 as well, as the small, albeit increasing, number of Ukrainians who receive refugee status could suggest.
The European migration crisis has aroused heated migration debates both in the soci-ety as well as among the political elite. In general, anti-immigrant sentiments have grown as well as the level of xenophobia. Anti-refugee slogans have become one of the main subjects raised at public demonstrations. This has also led to an increase in a�acks on a racial/ethnic basis, which were previously virtually absent in Polish society. The growing number of Ukrainians a�empting to enter the Polish labour market has also raised fears among local workers over available jobs. In January in Kutno local inhabitants a�acked a shelter occupied by Ukrainian labour migrants. At the same time in public debate Ukrai-nian migrants have started to be more oen presented as being much closer in terms of cultural, language and ethnic composition, in comparison to Muslim refugees from Syria or other conflict zone in Middle East and Africa that Poland has agreed to accept under EU-wide refugee re-se�lement schemes.
⁸ M. Jaroszewicz, M. Lesińska (eds.) (2014): Forecasting Migration Between the EU, V4 and Eastern Europe. Impact of Visa Abolition. Warsaw: Centre for Eastern Studies.
60 POLAND
Migra on pa erns
There are two significantly different types of migration pa�erns represented by Ukrai-nians in Poland. The first one is short-term circular labour migration, governed by the liberal rules of short-term access to the Polish labour market. The bulk of Ukrainian migrants who come to Poland are in this group and usually have no intention to stay in Poland. The other group, smaller but constantly growing, are the long-term migrants who look for permanent jobs in Poland, study there or are married to Polish citizens. A notable feature of Ukrainian migration in Poland is the predominance of women (around 60%). However, the year 2015 brought, for the very first time in many years, a wave predomi-nated by male immigrants.
The first examination of in-depth migrant interviews, conducted with 20 Ukrainian migrants within the framework of our current research project, has shown the existence of two different migration models in use by Ukrainian citizens. The first model, more common for migrants from Western Ukraine who have contacts with Poland on a daily basis, is characterized by regular circular migration with more independent a�empts to find a job, and by only very loose links to the conflict in eastern Ukraine (understood as a general feeling – a decreased level of security and stability). The second model is more common among migrants from Eastern Ukraine, who came to Poland with the intention to stay there for a couple of years. They usually rely on migration networks, do not use job advertisements available in Polish and their link to the conflict in Eastern Ukraine is more straightforward – usually they are not the direct victims of armed conflict, but have social contacts with those openly affected. This hypothesis is preliminary and requires further confirmation.
POLAND 61
MAY
Main figures
Simplified labour scheme and labour permitsThe most important source of information on the number of Ukrainian migrants in
Poland are so-called “employer’s declarations” as most Ukrainians stay in Poland within the framework of the facilitated labour migration scheme (that allows citizens of Armenia, Belarus, Georgia, Moldova, Russia and Ukraine to work without work permits for up to 6 months in a year, holding only a national visa “D”, not a residence permit). Data related to the number of Ukrainians who obtained an “employer’s declaration” in the first half of 2016 are not yet available, so the last available report is still the one for 2015. According to that data, in January–December 2015 782,222 declarations allowing short-term em-ployment of foreigners were issued (a growth of more than 100% in comparison to data registered in the same period the previous year). 98% of all declarations issued in 2015 fall to Ukrainian citizens. Altogether 762,700 declarations were issued to Ukrainian citizens.
Expert interviews conducted in January–March 2016 within the framework of the current project confirmed, however, that the simplified legal migration scheme remains the main legal channel used by Ukrainian labour migrants. Moreover, experts suggest that the number of Ukrainian citizens originating from Eastern Ukraine who use that scheme has probably increased. However, there is no statistical confirmation of this, as the Ministry for Family, Labour and Social Policy does not gather data broken down by the detailed place of origin. With respect to the demographic characteristics of migrants applying for short-term labour visas, their main features have remained stable since 2012. The majority of applicants are in the 25–34 age range, a small number in the 34–45 range and only around 15% are in the 45–54 range.
Residence permits and asylumThe Polish Office for Foreigners has also published its asylum data. In January–May
2016 (till 31st May) 285 Ukrainian citizens asked for asylum for the first time (altogether 190 asylum claims were submi�ed). When it comes to second (renewed) applications 282 Ukrainian citizens applied (a total of 141 applications). In comparison to the equivalent time period of the previous year the number of asylum claims made by Ukrainian citizens decreased by 30%. In January–May 2016, 8 Ukrainians received asylum status and four subsidiary protection status.
It is possible that refugee status or other forms of international or national protection will be issued to more Ukrainian citizens in the future. In 2015 the Polish government has organized two campaigns of organized relocation of Ukrainian citizens of Polish origin. The members of families of those relocated people who did not have a “Polish Card” asked
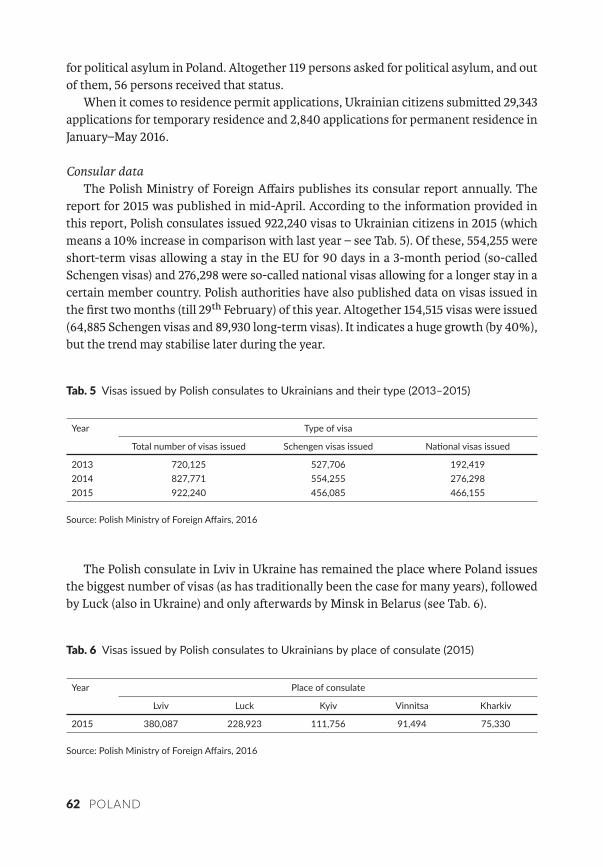
62 POLAND
for political asylum in Poland. Altogether 119 persons asked for political asylum, and out of them, 56 persons received that status.
When it comes to residence permit applications, Ukrainian citizens submi�ed 29,343 applications for temporary residence and 2,840 applications for permanent residence in January–May 2016.
Consular dataThe Polish Ministry of Foreign Affairs publishes its consular report annually. The
report for 2015 was published in mid-April. According to the information provided in this report, Polish consulates issued 922,240 visas to Ukrainian citizens in 2015 (which means a 10% increase in comparison with last year – see Tab. 5). Of these, 554,255 were short-term visas allowing a stay in the EU for 90 days in a 3-month period (so-called Schengen visas) and 276,298 were so-called national visas allowing for a longer stay in a certain member country. Polish authorities have also published data on visas issued in the first two months (till 29th February) of this year. Altogether 154,515 visas were issued (64,885 Schengen visas and 89,930 long-term visas). It indicates a huge growth (by 40%), but the trend may stabilise later during the year.
Tab. Visas issued by Polish consulates to Ukrainians and their type ( – )
Year Type of visa
Total number of visas issued Schengen visas issued Na onal visas issued
2013 720,125 527,706 192,4192014 827,771 554,255 276,2982015 922,240 456,085 466,155
Source: Polish Ministry of Foreign Affairs, 2016
The Polish consulate in Lviv in Ukraine has remained the place where Poland issues the biggest number of visas (as has traditionally been the case for many years), followed by Luck (also in Ukraine) and only aerwards by Minsk in Belarus (see Tab. 6).
Tab. Visas issued by Polish consulates to Ukrainians by place of consulate ( )
Year Place of consulate
Lviv Luck Kyiv Vinnitsa Kharkiv
2015 380,087 228,923 111,756 91,494 75,330
Source: Polish Ministry of Foreign Affairs, 2016
POLAND 63
Since 2008, Polish consular offices have been issuing so-called “Polish Cards”, which are granted to persons of Polish origin (understood widely, mostly as being able to prove that her/his ancestors had Polish citizenship and that he/she is rooted in Polish culture). The holders of these cards are eligible to receive a long-term national visa free of charge and do not need to obtain a work permit to be legally employed in Poland. 9,647 persons applied for this card in the territory of Ukraine in 2015.
Irregular migra on
There are no estimations related to the possible stock of irregular migrants. Since the outbreak of armed conflict in Eastern Ukraine no research on that subject has been conducted in Poland. However the irregular migration of Ukrainians to Poland may be growing, as can be seen from the increasing number of illegal stay detections and refusals of entry.
Main determinants
As 2013–2014 Forecasting migration… research has shown (2014)⁹, the main pull factors a�racting Ukrainian migrants to Poland are language and cultural proximity, low costs of travel and liberal migration and visa policies. Poland is currently the main destination state for Ukrainian migrants in the EU.
Currently there is no statistical or qualitative evidence to determine whether the growth of migration from Ukraine is stimulated by war-related factors.
However, the substantial number of asylum applications submi�ed by Ukrainian citizens in 2014 and 2015 as well as the small, albeit increasing, number of Ukrainians who receive refugee status could suggest this is so.
The European migration crisis has aroused a heated migration debate both in society and among the political elite. In general, anti-immigrant sentiments have risen as well as levels of xenophobia. Anti-refugee slogans have become one of the main subjects raised at public demonstrations. This has also led to an increase in of a�acks on a racial/ethnic basis, which were previously virtually absent in Polish society. The growing number of Ukrainians a�empting to enter the Polish labour market has also raised fears among local workers over available jobs. In January in Kutno local inhabitants a�acked a shelter occupied by Ukrainian labour migrants. At the same time Ukrainian migrants started to be more oen presented in public debate as much closer in terms of cultural, language and ethnic composition, in comparison to Muslim refugees from Syria or other conflict zone in Middle East and Africa Poland has agreed to accept under EU-wide refugee re-se�lement schemes.
⁹ M. Jaroszewicz, M. Lesińska (eds.) (2014): Forecasting Migration Between the EU, V4 and Eastern Europe. Impact of Visa Abolition. Warsaw: Centre for Eastern Studies.
64 POLAND
Migra on pa erns
There are two significantly different types of migration pa�erns represented by Ukrai-nians in Poland. The first one is short-term circular labour migration, governed by the liberal rules of short-term access to the Polish labour market. The bulk of the Ukrainian migrants who come to Poland come from this group and usually have no intention to stay in Poland. The other group, smaller but constantly growing, are long-term migrants who look for permanent jobs in Poland, study there or are married to Polish citizens. A notable feature of Ukrainian migration in Poland is the predominance of women (around 60%). However, 2015 brought, for the very first time in many years, a wave predominated by male immigrants.
The first examination of in-depth migrant interviews, conducted with 20 Ukrainian migrants within the framework of our current research project, has shown the existence of two different migration models in use by Ukrainian citizens. The first model, more common for migrants from Western Ukraine who have contacts with Poland on a daily basis, is characterized by regular circular migration with more independent a�empts to find a job, and by only very loose links to the conflict in eastern Ukraine (understood as a general feeling – a decreased level of security and stability). The second model is more common among migrants from Eastern Ukraine, who came to Poland with the intention to stay there for a couple of years. They usually rely on migration networks, do not use job advertisements available in Polish and their links to the conflict in Eastern Ukraine are more straightforward – usually they are not the direct victims of armed conflict, but have social contacts with those openly affected. This hypothesis is preliminary and requires further confirmation.
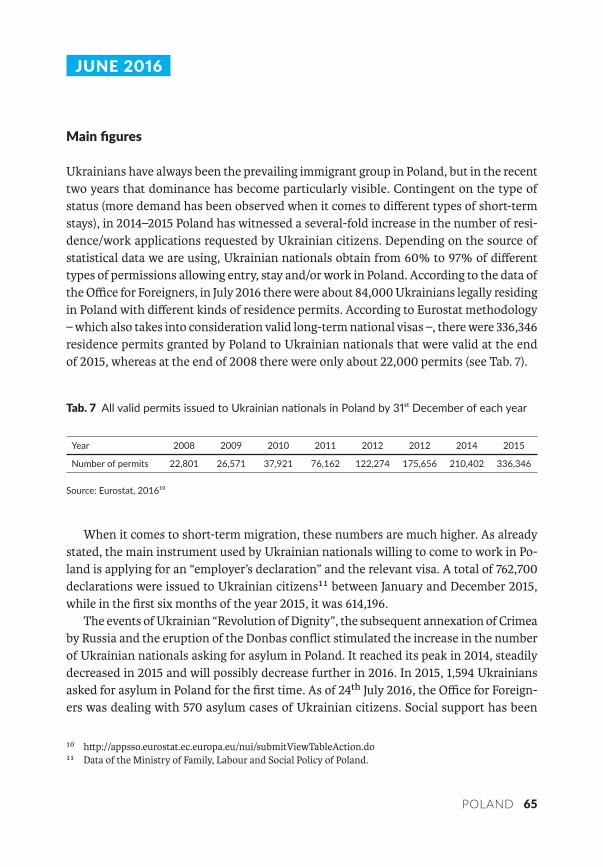
POLAND 65
JUNE
Main figures
Ukrainians have always been the prevailing immigrant group in Poland, but in the recent two years that dominance has become particularly visible. Contingent on the type of status (more demand has been observed when it comes to different types of short-term stays), in 2014–2015 Poland has witnessed a several-fold increase in the number of resi-dence/work applications requested by Ukrainian citizens. Depending on the source of statistical data we are using, Ukrainian nationals obtain from 60% to 97% of different types of permissions allowing entry, stay and/or work in Poland. According to the data of the Office for Foreigners, in July 2016 there were about 84,000 Ukrainians legally residing in Poland with different kinds of residence permits. According to Eurostat methodology – which also takes into consideration valid long-term national visas –, there were 336,346 residence permits granted by Poland to Ukrainian nationals that were valid at the end of 2015, whereas at the end of 2008 there were only about 22,000 permits (see Tab. 7).
Tab. All valid permits issued to Ukrainian na onals in Poland by December of each year
Year 2008 2009 2010 2011 2012 2012 2014 2015
Number of permits 22,801 26,571 37,921 76,162 122,274 175,656 210,402 336,346
Source: Eurostat, 2016¹⁰
When it comes to short-term migration, these numbers are much higher. As already stated, the main instrument used by Ukrainian nationals willing to come to work in Po-land is applying for an “employer’s declaration” and the relevant visa. A total of 762,700 declarations were issued to Ukrainian citizens¹¹ between January and December 2015, while in the first six months of the year 2015, it was 614,196.
The events of Ukrainian “Revolution of Dignity”, the subsequent annexation of Crimea by Russia and the eruption of the Donbas conflict stimulated the increase in the number of Ukrainian nationals asking for asylum in Poland. It reached its peak in 2014, steadily decreased in 2015 and will possibly decrease further in 2016. In 2015, 1,594 Ukrainians asked for asylum in Poland for the first time. As of 24th July 2016, the Office for Foreign-ers was dealing with 570 asylum cases of Ukrainian citizens. Social support has been
¹⁰ h�p://appsso.eurostat.ec.europa.eu/nui/submitViewTableAction.do ¹¹ Data of the Ministry of Family, Labour and Social Policy of Poland.
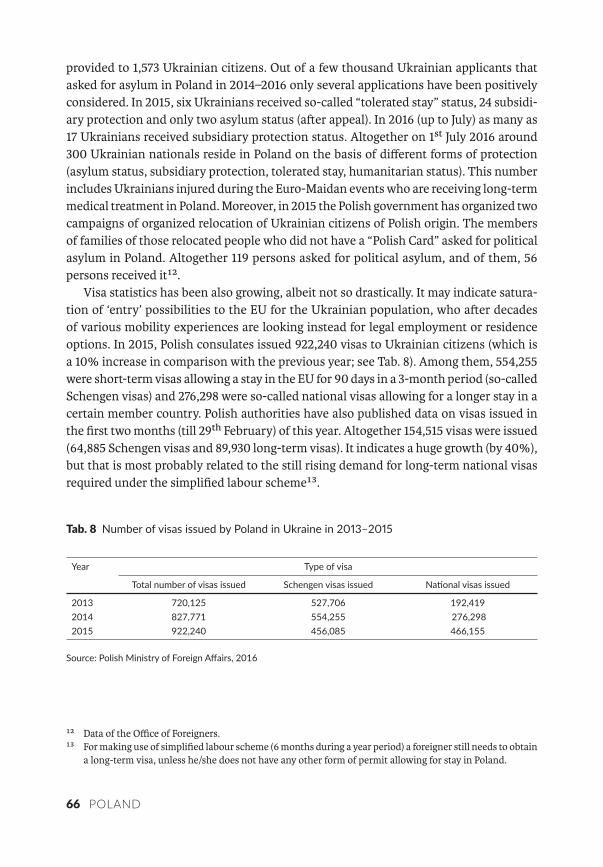
66 POLAND
provided to 1,573 Ukrainian citizens. Out of a few thousand Ukrainian applicants that asked for asylum in Poland in 2014–2016 only several applications have been positively considered. In 2015, six Ukrainians received so-called “tolerated stay” status, 24 subsidi-ary protection and only two asylum status (aer appeal). In 2016 (up to July) as many as 17 Ukrainians received subsidiary protection status. Altogether on 1st July 2016 around 300 Ukrainian nationals reside in Poland on the basis of different forms of protection (asylum status, subsidiary protection, tolerated stay, humanitarian status). This number includes Ukrainians injured during the Euro-Maidan events who are receiving long-term medical treatment in Poland. Moreover, in 2015 the Polish government has organized two campaigns of organized relocation of Ukrainian citizens of Polish origin. The members of families of those relocated people who did not have a “Polish Card” asked for political asylum in Poland. Altogether 119 persons asked for political asylum, and of them, 56 persons received it¹².
Visa statistics has been also growing, albeit not so drastically. It may indicate satura-tion of ‘entry’ possibilities to the EU for the Ukrainian population, who aer decades of various mobility experiences are looking instead for legal employment or residence options. In 2015, Polish consulates issued 922,240 visas to Ukrainian citizens (which is a 10% increase in comparison with the previous year; see Tab. 8). Among them, 554,255 were short-term visas allowing a stay in the EU for 90 days in a 3-month period (so-called Schengen visas) and 276,298 were so-called national visas allowing for a longer stay in a certain member country. Polish authorities have also published data on visas issued in the first two months (till 29th February) of this year. Altogether 154,515 visas were issued (64,885 Schengen visas and 89,930 long-term visas). It indicates a huge growth (by 40%), but that is most probably related to the still rising demand for long-term national visas required under the simplified labour scheme¹³.
Tab. Number of visas issued by Poland in Ukraine in –
Year Type of visa
Total number of visas issued Schengen visas issued Na onal visas issued
2013 720,125 527,706 192,4192014 827,771 554,255 276,2982015 922,240 456,085 466,155
Source: Polish Ministry of Foreign Affairs, 2016
¹² Data of the Office of Foreigners.¹³ For making use of simplified labour scheme (6 months during a year period) a foreigner still needs to obtain
a long-term visa, unless he/she does not have any other form of permit allowing for stay in Poland.
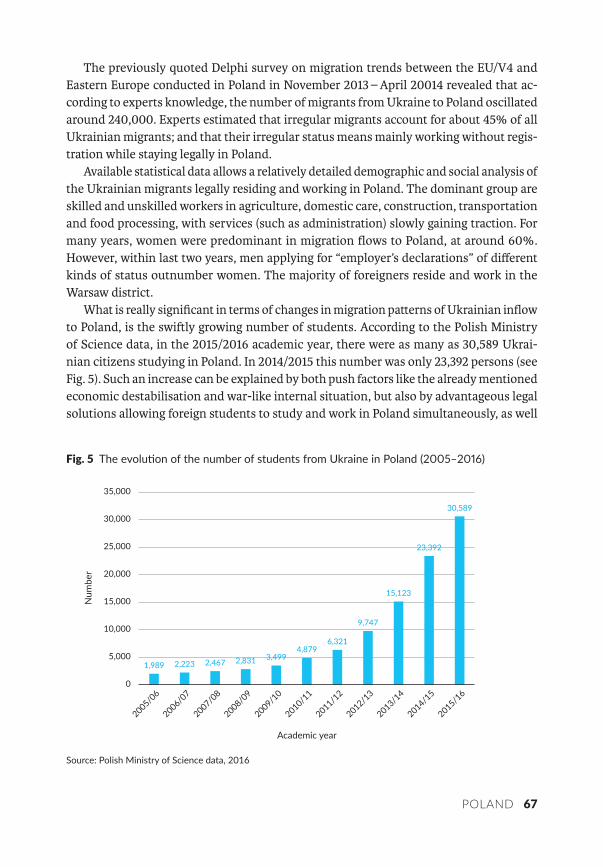
POLAND 67
The previously quoted Delphi survey on migration trends between the EU/V4 and Eastern Europe conducted in Poland in November 2013 – April 20014 revealed that ac-cording to experts knowledge, the number of migrants from Ukraine to Poland oscillated around 240,000. Experts estimated that irregular migrants account for about 45% of all Ukrainian migrants; and that their irregular status means mainly working without regis-tration while staying legally in Poland.
Available statistical data allows a relatively detailed demographic and social analysis of the Ukrainian migrants legally residing and working in Poland. The dominant group are skilled and unskilled workers in agriculture, domestic care, construction, transportation and food processing, with services (such as administration) slowly gaining traction. For many years, women were predominant in migration flows to Poland, at around 60%. However, within last two years, men applying for “employer’s declarations” of different kinds of status outnumber women. The majority of foreigners reside and work in the Warsaw district.
What is really significant in terms of changes in migration pa�erns of Ukrainian inflow to Poland, is the swily growing number of students. According to the Polish Ministry of Science data, in the 2015/2016 academic year, there were as many as 30,589 Ukrai-nian citizens studying in Poland. In 2014/2015 this number was only 23,392 persons (see Fig. 5). Such an increase can be explained by both push factors like the already mentioned economic destabilisation and war-like internal situation, but also by advantageous legal solutions allowing foreign students to study and work in Poland simultaneously, as well
Fig. The evolu on of the number of students from Ukraine in Poland ( – )
1,989 2,223 2,467 2,831 3,4994,879
6,321
9,747
15,123
23,392
30,589
0
5,000
10,000
15,000
20,000
25,000
30,000
35,000
2005/06
2006/07
2007/08
2008/09
2009/10
2010/11
2011/12
2012/13
2013/14
2014/15
2015/16
Academic year
Num
ber
Source: Polish Ministry of Science data, 2016
68 POLAND
as by very active campaigns by Polish universities targeting Ukrainian citizens. At some universities in the cities bordering Ukraine, Ukrainians have become the overwhelming majority and that has even caused intra-ethnic disputes with the Polish minority. This has forced Polish universities to start thinking more thoroughly about special integration programmes both for foreigners studying in Poland and for students from host society.
Main determinants
As 2013–2014 Forecasting migration… research has shown (2014)¹⁴, the main pull factors a�racting Ukrainian migrants to Poland are language and cultural proximity, low costs of travel and liberal migration and visa policies. Poland is currently the main destination state for Ukrainian migrants in the EU.
Currently there is no statistical or qualitative evidence to determine whether the growth of migration from Ukraine is stimulated by war-related factors.
However the substantial number of asylum applications submi�ed by Ukrainian citi-zens in 2014 and 2015 as well as the small, albeit increasing, number of Ukrainians who receive the refugee status could suggest that this is so.
The European migration crisis has aroused a heated migration debate in the society as well as among the political elite. In general, anti-immigrant sentiments have grown as well as levels of xenophobia. Anti-refugee slogans have become one of the main subjects raised at public demonstrations. This has also led to an increase in a�acks on a racial/eth-nic basis, which were previously virtually absent in Polish society. The growing number of Ukrainians a�empting to enter the Polish labour market has also raised fears among local workers over available jobs. In January in Kutno local inhabitants a�acked a shelter occupied by Ukrainian labour migrants. At the same time in public debate Ukrainian migrants started to be more oen presented as much closer in terms of cultural, language and ethnic composition, in comparison to Muslim refugees from Syria or other conflict zone in Middle East and Africa that Poland has agreed to accept under EU-wide refugee re-se�lement schemes.
Migra on pa erns
There are two significantly different types of migration pa�erns represented by Ukrai-nians in Poland. The first one is short-term circular labour migration, governed by the liberal rules of short-term access to the Polish labour market. The bulk of the Ukrainian migrants who come to Poland fall into from this group and usually have no intention to stay in Poland. The other group, smaller but constantly growing, are the long-term migrants who look for permanent jobs in Poland, study there or are married to Polish
¹⁴ M. Jaroszewicz, M. Lesińska (eds.) (2014): Forecasting Migration Between the EU, V4 and Eastern Europe. Impact of Visa Abolition. Warsaw: Centre for Eastern Studies.
POLAND 69
citizens. A notable feature of Ukrainian migration in Poland is the predominance of women (around 60%). However, 2015 brought, for the very first time in many years, a wave in which male immigrants predominated.
The first examination of in-depth migrant interviews, conducted with 20 Ukrainian migrants within the framework of our current research project, has shown the existence of two different migration models in use by Ukrainian citizens. The first model, more common for migrants from Western Ukraine who are have contacts with Poland on a daily basis, is characterized by regular circular migration with more independent a�empts to find a job, and by only very loose links to the conflict in eastern Ukraine (understood as a general feeling – a decreased level of security and stability). The second model is more common among the migrants from Eastern Ukraine, who came to Poland with the inten-tion to stay there for a couple of years. They usually rely on migration networks, do not use job advertisements available in Polish and their link to conflict in Eastern Ukraine is more straightforward – usually they are not the direct victims of armed conflict, but have social contacts with those openly affected. This hypothesis is preliminary and requires further confirmation.

CzechiaUKRAINIAN MIGRATION IN CZECHIA:FACTS AND FIGURES
Markéta Seidlová
72 CZECHIA
SEPTEMBER
As of 30th September 2015, the last available data from the Ministry of Interior of the Czech Republic about foreigners residing permanently or temporarily on the territory of Czechia were those of 31st July 2015.
At the end of July 2015, a total of 458,710 foreigners with permanent or temporary resi-dence lived in Czechia. Ukrainians made up the biggest group: 104,558 persons – 22.8%. The second and the third most numerous groups were Slovaks (99,338 persons; 21.7%) and Vietnamese (56,665 persons; 12.4%). These three groups of foreigners represented more than half of all foreigners (56.8%) residing in Czechia at that time.
Overall (or more precisely, since 2004), the number of Ukrainians reached its peak on 30th June 2009, when 134,456 Ukrainian citizens lived in Czechia. Since then, due to the economic crisis which hit Europe – the Czech economy included – the number of immigrants in Czechia has been slowly and continuously decreasing. The number of Ukrainians has oscillated around 104,000 for the last two years.
Most Ukrainian migrants came primarily for economic and work-related reasons. They are mostly employed in construction, some industrial sectors, services or agriculture, taking chiefly unskilled, manual, low paid, so-called “3D” (demanding, dirty and danger-ous) jobs.
To the group of economic immigrants with permanent or temporary stay permits, we have to add the ones claiming international protection (asylum or subsidiary protection). Between January and September 2015, a total of 990 persons claimed international pro-tection in Czechia. Of these, almost half were Ukrainian citizens (467 persons; 47.2%). The second and third largest group of claimants were citizens of Cuba (106 persons; 10.7%) and Syria (69 persons; 7.0%).
In the month of August 2015, a total of 106 persons claimed international protec-tion in Czechia. Of them, almost half were Ukrainians (46 persons – 43.4%). Among the Ukrainians, one third (32.6% – 15 persons) were women, 21.7% (10 persons) submi�ed repeated applications for international protection and 13.1% of claims (6 persons) came from minors.
The figures for the month of August 2015 were quite similar to those of July 2015: in July 2015, a total of 100 persons claimed international protection in Czechia. Of these, almost half were Ukrainians (41 persons – 41.0%). Among the Ukrainians, one third (36.6% – 15 persons) were women, 17.1% of claims (7 persons) came from minors and 12.2% (5 persons) submi�ed repeated applications for international protection.
The Ministry of Interior of the Czech Republic made a total of 92 decisions in this ma�er in August 2015. Due to the high percentage of Ukrainians among the claimants, Ukrainians also had the highest share among those who received the decision: 41 (44.6%) out of the 92. Two thirds of them received a negative decision, i.e. they were not awarded
CZECHIA 73
international protection (27 persons; 65.9%). Subsidiary protection was awarded only to 10 persons (24.4% of Ukrainians who received decisions in August 2015). For the rest of claimants (4 persons – 9.8%) the procedure was stopped.
The distribution of these decisions in August 2015 was quite similar to that in the pre-vious month: in July 2015, the Ministry of Interior of the Czech Republic made a total of 95 decisions in this ma�er. As Ukrainians had the highest share among the claimants, they had also the highest share among those who received a decision: 54 (56.8%) out of 95.
Most of the Ukrainians, two thirds (59.3% – 32 persons) received a negative decision, i.e. they were not awarded international protection. Only one fih of Ukrainian claimants (20.4% – 11 persons) received decisions in July 2015 received subsidiary protection. For the rest of the claimants (11 persons – 20.4%) the procedure was stopped.
74 CZECHIA
OCTOBER
As of 31st October 2015, the last available data from the Ministry of Interior of the Czech Republic about foreigners residing permanently or temporarily on the territory of Czechia were those of 30th September 2015.
At the end of September 2015, a total of 461,880 foreigners with permanent or tem-porary residence lived in Czechia, thus making an increase of 1,750 persons (0.38%) compared with the situation at the end of August 2015. Ukrainians made up the biggest group: 105,153 persons – 22.8%. The second and the third most numerous groups were Slovaks (100,241 persons; 21.7%) and Vietnamese (56,659 persons; 12.3%). These three groups of foreigners represented more than half of all foreigners (56.7%) residing in Czechia at that time.
Between the end of August 2015 and the end of September 2015, the number of Ukrainians increased by 287 (0.27%). At the end of September 2015, 72.9% of Ukrai-nians residing in Czechia had permanent residence permits (in other words, 27.1% had temporary residence permits). Among all Ukrainians, 47.0% were women (49.0% of those with permanent residence, 41.6% of those with temporary residence permits).
From the longer term point of view (or more precisely, since 2004), the number of Ukrainians reached its peak on 30th June 2009, when 134,456 Ukrainian citizens lived in Czechia. Since then, due to the economic crisis which hit Europe – the Czech economy included – the number of immigrants in Czechia has been slowly and continuously de-creasing. The number of Ukrainians has oscillated around 104,000 for the last two years.
Most Ukrainian migrants came primarily for economic and work-related reasons. They are mostly employed in construction, some industrial sectors, services or agriculture, taking chiefly unskilled, manual, low paid, so-called “3D” (demanding, dirty and danger-ous) jobs.
To the group of economic immigrants, with permanent or temporary stay permits, we have to add those claiming international protection (asylum or subsidiary protection). From January to September 2015, a total of 1,115 persons claimed international protection in Czechia. Of these, almost half were Ukrainian citizens (527 persons; 47.3%). The second and third largest group of claimants were citizens of Cuba (114 persons; 10.2%) and Syria (73 persons; 6.5%).
In September 2015, a total of 125 persons claimed international protection in Czechia. Of them, almost half were Ukrainians (60 persons – 48.0%). Among the Ukrainians, nearly half (40.0% – 24 persons) were women, 20.0% of claims (12 persons) came from minors and 18.3% (11 persons) submi�ed repeated requests for international protection.
The figures for September 2015 were quite similar to those for August 2015: in August 2015, a total of 106 persons claimed international protection in Czechia. Of these, almost half were Ukrainians (46 persons – 43.4%). Among the Ukrainians, one third (32.6% – 15
CZECHIA 75
persons) were women, 21.7% (10 persons) submi�ed repeated requests for international protection and 13.1% of claims (6 persons) came from minors.
The Ministry of Interior of the Czech Republic made a total of 110 decisions in this ma�er in September 2015. Due to the high percentage of Ukrainians among the claimants, Ukrainians were also the highest share of those who received decisions: 52 (47.3%) out of 110. Two thirds of them received a negative decision, i.e. they were not awarded interna-tional protection (29 persons; 55.8%). However, subsidiary protection was a�ributed to one fih of them (10 persons; 19.2% of Ukrainians decided in the month of September 2015). For one quarter of claimants (13 persons – 25.0%) the procedure was stopped.
The distribution of these decisions in September 2015 was quite similar to that of decisions undertaken in the previous month: in August 2015, the Ministry of Interior of the Czech Republic made a total of 92 decisions in this ma�er. As Ukrainians had highest share among the claimants, they also represented the highest share among the ones who received a decision: 41 (44.6%) out of 92. Most Ukrainians, two thirds (65.9% – 27 persons) received negative decisions, i.e. they were not awarded international protection. However, one quarter of Ukrainian claimants (24.4% – 10 persons) who received a decision in Au-gust 2015 received subsidiary protection. For the rest of claimants (4 persons – 9.8%) the procedure was stopped.
76 CZECHIA
NOVEMBER
As of 30th November 2015, the last available data from the Ministry of Interior of the Czech Republic about foreigners residing permanently or temporarily on the territory of Czechia were those of 31st October 2015.
At the end of October 2015, a total of 464,558 foreigners with permanent or temporary residence permits lived in Czechia, thus making an increase of 2,678 persons (0.58%) if compared with the situation at the end of September 2015. Ukrainians made up the biggest group: 105,597 persons – 22.7%. The second and the third most numerous groups were Slovaks (100,790 persons; 21.7%) and Vietnamese (56,781 persons; 12.2%). These three groups represented more than half of all foreigners (56.6%) residing in Czechia at that time.
Between the end of September 2015 and the end of October 2015, the number of Ukrainians increased by 444 (0.42%). At the end of October 2015, 72.9% of Ukrainians resided in Czechia based on permanent residence permits (in other words, 27.1% had permits for a temporary stay). Among all Ukrainians, 47.0% were women (49.0% among those with permanent residence, 41.6% among those with temporary permits).
From the overall point of view (or more precisely, since 2004), the number of Ukrai-nians reached its peak on 30th June 2009, when 134,456 Ukrainian citizens lived in Czechia. Since then, due to the economic crisis which hit Europe – the Czech economy included – the number of immigrants in Czechia has been slowly and continuously de-creasing. The number of Ukrainians has oscillated around 104,000 for the last two years.
Most Ukrainian migrants came primarily for economic and work-related reasons. They are mostly employed in construction, some industrial sectors, services or agriculture, taking chiefly unskilled, manual, low paid, so-called “3D” (demanding, dirty and danger-ous) jobs.
In terms of their spatial distribution, almost half of all Ukrainians in Czechia lived – at the end of October 2015 – in the capital city, Prague. More precisely, Prague was home for 45,878 Ukrainians (43.5% of all Ukrainians living in Czechia at that time). The second most popular county of residence was the second biggest town of Czechia, the city of Brno (6,263 persons; 5.9%) and third was a county neighbouring Prague, the county of Prague-East (3,682 persons; 3.5%). On the other hand, the least popular places of residence for Ukrainians were the counties of Jeseník (32 persons; 0.03%), Bruntál (52 persons; 0.05%) and Opava (104 persons; 0.10%). i.e. counties known for their mountainous character, with a high unemployment rate, a lack of industries, services and big cities. To the group of economic immigrants, with permanent or temporary stay permits, we have to add those claiming international protection (asylum or subsidiary protection). From Janu-ary to October 2015, a total of 1,245 persons have claimed international protection in Czechia. Of these, almost half were Ukrainian citizens (573 persons; 46.0%). The second
CZECHIA 77
and third largest groups of claimants were citizens of Cuba (120 persons; 9.6%) and Syria (111 persons; 8.9%).
In the month of October 2015, a total of 130 persons have claimed international pro-tection in Czechia. Of them, one third were Ukrainians (46 persons – 35.4%). Among the Ukrainians, one third (37.0% – 17 persons) were women, 17.4% of claims (8 persons) came from minors and one fih (19.6%; 9 persons) submi�ed repeat demands for international protection.
The figures for the month of October 2015 were quite similar to those of Septem-ber 2015: in September 2015, a total of 125 persons claimed international protection in Czechia, almost half of them Ukrainians (60 persons – 48.0%). Among the Ukrainians, nearly half (40.0% – 24 persons) were women, 20.0% of claims (12 persons) came from minors and 18.3% (11 persons) submi�ed repeat requests for international protection.
The Ministry of Interior of the Czech Republic made a total of 93 decisions in this ma�er in October 2015. Due to the high percentage of Ukrainians among the claimants, the Ukrainians also represented the highest share among the ones who received a deci-sion: 43 (46.2%) out of 93. Half of them received a negative decision, i.e. they were not awarded international protection (23 persons; 53.5%). However, subsidiary protection was awarded to about ten percent of them (5 persons; 11.6% of Ukrainians who received decisions in October 2015). For one third of claimants (15 persons – 34.9%) the procedure was stopped.
The distribution of these decisions in October 2015 was quite similar to that of the previous month: in the month of September 2015, the Ministry of Interior of the Czech Republic made 110 decisions in this ma�er. Due to the high percentage of Ukrainians among the claimants, Ukrainians had also the highest share of the decisions received: 52 (47.3%) of 110. Two thirds of them received a negative decision, i.e. they were not awarded international protection (29 persons; 55.8%). However, subsidiary protection was a�ributed to one fih of them (10 persons; 19.2% of Ukrainians decided in the month of September 2015). For one quarter of claimants (13 persons – 25.0%) the procedure was stopped.
78 CZECHIA
DECEMBER
As of 31st December 2015, the latest available data from the Ministry of Interior of the Czech Republic about foreigners residing permanently or temporarily on the territory of Czechia were those of 30th November 2015.
At the end of November 2015, a total of 466,299 foreigners with permanent or tempo-rary residence permits lived in Czechia, thus making an increase of 1,741 persons (0.37%) as compared with the situation at the end of October 2015. Ukrainians made up the big-gest group: 105,826 persons – 22.7%. The second and the third most numerous groups were Slovaks (101,286 persons; 21.7%) and Vietnamese (56,857 persons; 12.2%). These three groups of foreigners represented more than half of all foreigners (56.6%) residing in Czechia at that time.
Between the end of October 2015 and the end of November 2015, the number of Ukrainians increased by 229 (0.22%). At the end of November 2015, 73.1% of Ukrainians resided in Czechia based on permanent residence permits (in other words, 26.9% had permits for a temporary stay). Among all Ukrainians, 47.0% were women (48.9% among those with permanent residence, 41.8% among those ones with temporary stay permits).
Overall (or more precisely, since 2004), the number of Ukrainians reached its peak on 30th June 2009, when 134,456 Ukrainian citizens lived in Czechia. Since then, due to the economic crisis which hit Europe – the Czech economy included – the number of immigrants in Czechia has been slowly and continuously decreasing. The number of Ukrainians has oscillated around 104,000 for the last two years.
Most Ukrainian migrants came primarily for economic and work-related reasons. They are mostly employed in construction, some industrial sectors, services or agriculture, taking chiefly unskilled, manual, low paid, so-called “3D” (demanding, dirty and danger-ous) jobs.
In terms of their spatial distribution, almost half of all Ukrainians in Czechia lived – at the end of November 2015 – in the capital city, Prague. More precisely, Prague was home for 45,804 Ukrainians (43.3% of all Ukrainians living in Czechia at that time). The second most popular county of residence was the second biggest town of Czechia, the city of Brno (6,306 persons; 5.9%) and the third was a county neighbouring Prague, the county of Prague – East (3,693 persons; 3.5%). On the other hand, the least popular places of residence for Ukrainians were the counties of Jeseník (32 persons; 0.03%), Bruntál (52 persons; 0.05%) and Opava (103 persons; 0.10%). i.e. counties known for their mountain-ous character, with a high unemployment rate, a lack of industries, services and big cities.
To the group of economic immigrants, with allowed permanent or temporary stay permits, we have to add those claiming international protection (asylum or subsidiary protection). From January to November 2015, a total of 1,382 persons have claimed international protection in Czechia. Of them, almost half were Ukrainian citizens (636
CZECHIA 79
persons; 46.0%). The second and third largest groups of claimants were citizens of Cuba (124 persons; 9.0%) and Syria (122 persons; 8.8%).
In the month of November 2015, a total of 137 persons claimed international protec-tion in Czechia. Of these, one half were Ukrainians (63 persons – 46.0%). Among the Ukrainians, nearly one half (42.9% – 27 persons) were women, one third (27.0%) of claims (17 persons) came from minors and one tenth (9.5%; 6 persons) submi�ed repeat requests for international protection.
The figures for the month of November 2015 were quite similar to those of October 2015: in October 2015, a total of 130 persons claimed international protection in Czechia, of whom one third were Ukrainians (46 persons – 35.4%). Among the Ukrainians, one third (37.0% – 17 persons) were women, 17.4% of claims (8 persons) came from minors and one fih (19.6%; 9 persons) submi�ed repeat requests for international protection.
The Ministry of Interior of the Czech Republic made a total of 147 decisions in this ma�er in the month of November 2015. Due to the high percentage of Ukrainians among the claimants, Ukrainians had also the highest share of decisions received: 54 (36.7%) out of 147. Half of them received a negative decision, i.e. they were not awarded international protection (27 persons; 50.0%). However, subsidiary protection was awarded to about eight percent of them (4 persons; 7.4% of Ukrainians who received decisions in the month of November 2015). For nearly half of claimants (23 persons – 42.6%) the procedure was stopped.
The distribution of these decisions in November 2015 was also quite similar to that of decisions undertaken in the previous month: in October 2015, a total of 93 decisions were made. Due to the high percentage of Ukrainians among the claimants, Ukrainians had also the highest share among those who received a decision: 43 (46.2%) of 93. Half of them received a negative decision, i.e. they were not awarded international protection (23 persons; 53.5%). However, subsidiary protection was a�ributed to about ten percent of them (5 persons; 11.6% of Ukrainians whose cases were decided in October 2015). For one third of claimants (15 persons – 34.9%) the procedure was stopped.
80 CZECHIA
JANUARY
As of 31st January 2016, the last available data from the Ministry of Interior of the Czech Republic about foreigners residing permanently or temporarily on the territory of Czechia were those of 31st December 2015.
At the end of December 2015, a total of 467,562 foreigners with permanent or temporary stay permits lived in Czechia, thus making an increase of 1,263 persons (1.9%) if compared to the situation at the end of November 2015. Ukrainians made up the biggest group: 106,019 persons – 22.7%. The second and the third largest groups were Slovaks (101,589 persons; 21.7%) and Vietnamese (56,958 persons; 12.2%). These three groups of foreigners represented more than half of all foreigners (56.6%) residing in Czechia at that time.
Between the end of November 2015 and the end of December 2015, the number of Ukrainians increased by 193 (0.18%). At the end of December 2015, 73.2% of Ukrai nians lived in Czechia based on permanent residence permits (in other words, 26.8% had per-mits for a temporary stay). Among all Ukrainians, 47.0% were women (48.9% among those with permanent residence, 41.9% among those with a temporary stay permit).
Overall (or more precisely, since 2004), the number of Ukrainians reached its peak on 30th June 2009, when 134,456 Ukrainian citizens lived in Czechia. Since then, due to the economic crisis which hit Europe – the Czech economy included – the number of immigrants in Czechia has been slowly and continuously decreasing. The number of Ukrainians has oscillated around 104,000 for the last two years.
Most Ukrainian migrants came primarily for economic and work-related reasons. They are mostly employed in construction, some industrial sectors, services or agriculture, taking chiefly unskilled, manual, low paid, so-called ‘3D’ (demanding, dirty and danger-ous) jobs.
In terms of their spatial distribution, the largest concentration of Ukrainians was in the district of the capital, in Prague (3.64% of the total population; 45,843 persons), and then in the neighbouring district of Prague – East (2.24%; 3,681 persons) and in the 4th biggest city in the country, in Plzeň (district of Plzeň-město, 1.89%; 3,548 persons). On the other hand, their presence in both numbers and percentage of the total population was negligible in the districts of Bruntál (0.05%; 50 persons), Opava (0.06%; 104 persons) and Frýdek-Místek (0.06%; 134 persons). The situation throughout the territory can be seen from Figure 6.
To the group of economic immigrants, with permanent or temporary stay permits, we have to add those claiming international protection (asylum or subsidiary protection). From January to December 2015, a total of 1,525 persons claimed international protec-tion in Czechia. Of them, almost half were Ukrainian citizens (694 persons; 45.5%). The second and third largest groups of claimants were citizens of Cuba (128 persons; 8.4%) and Syria (134 persons; 8.8%).
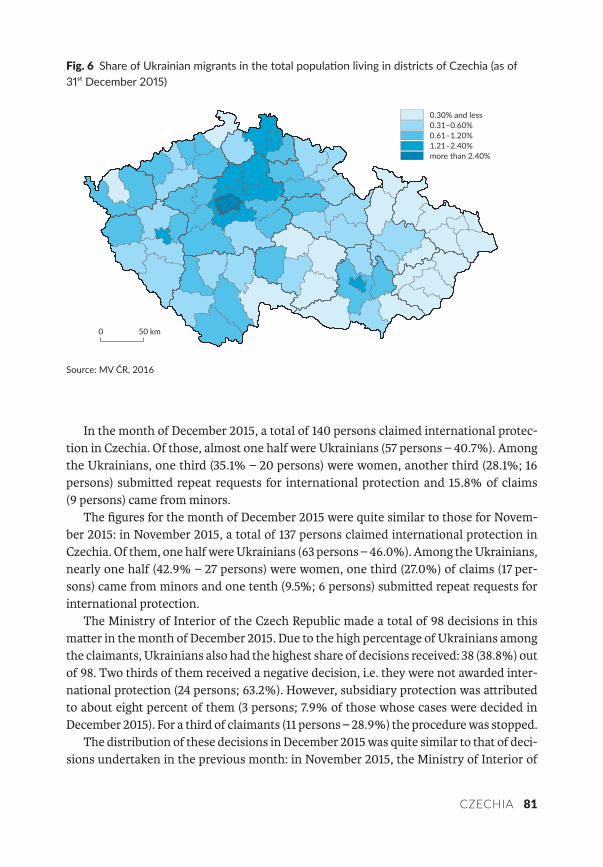
CZECHIA 81
In the month of December 2015, a total of 140 persons claimed international protec-tion in Czechia. Of those, almost one half were Ukrainians (57 persons – 40.7%). Among the Ukrainians, one third (35.1% – 20 persons) were women, another third (28.1%; 16 persons) submi�ed repeat requests for international protection and 15.8% of claims (9 persons) came from minors.
The figures for the month of December 2015 were quite similar to those for Novem-ber 2015: in November 2015, a total of 137 persons claimed international protection in Czechia. Of them, one half were Ukrainians (63 persons – 46.0%). Among the Ukrainians, nearly one half (42.9% – 27 persons) were women, one third (27.0%) of claims (17 per-sons) came from minors and one tenth (9.5%; 6 persons) submi�ed repeat requests for international protection.
The Ministry of Interior of the Czech Republic made a total of 98 decisions in this ma�er in the month of December 2015. Due to the high percentage of Ukrainians among the claimants, Ukrainians also had the highest share of decisions received: 38 (38.8%) out of 98. Two thirds of them received a negative decision, i.e. they were not awarded inter-national protection (24 persons; 63.2%). However, subsidiary protection was a�ributed to about eight percent of them (3 persons; 7.9% of those whose cases were decided in December 2015). For a third of claimants (11 persons – 28.9%) the procedure was stopped.
The distribution of these decisions in December 2015 was quite similar to that of deci-sions undertaken in the previous month: in November 2015, the Ministry of Interior of
Fig. Share of Ukrainian migrants in the total popula on living in districts of Czechia (as of December )
0 50 km
0.30% and less0.31–0.60%0.61–1.20%1.21–2.40%more than 2.40%
Source: MV ČR, 2016
82 CZECHIA
the Czech Republic made a total of 147 decisions in this ma�er. Due to the high percentage of Ukrainians among the claimants, Ukrainians also had the highest share of decisions received: 54 (36.7%) of 147. Half of them received a negative decision, i.e. they were not awarded international protection (27 persons; 50.0%). However, subsidiary protection was a�ributed to about eight percent of them (4 persons; 7.4% of Ukrainians whose cases were decided in November 2015). For nearly half of claimants (23 persons – 42.6%) the procedure was stopped.
CZECHIA 83
FEBRUARY
As of 29th February 2016, the last available data from the Ministry of Interior of the Czech Republic about foreigners residing permanently or temporarily on the territory of Czechia were those of 31st January 2016.
At the end of January 2016, a total of 469,197 foreigners with permanent or temporary stay permits lived in Czechia, thus making an increase of 1,635 persons (0.35%) if com-pared with the situation at the end of December 2015. Ukrainians made up the biggest group: 106,182 persons – 22.6%. The second and the third largest groups were Slovaks (101,999 persons; 21.7%) and Vietnamese (57,130 persons; 12.2%). These three groups of foreigners represented more than half of all foreigners (56.5%) residing in Czechia at that time.
Between the end of December 2015 and the end of January 2016, the number of Ukrainians increased by 163 (0.15%). At the end of January 2016, 73.4% of Ukrainians resided in Czechia based on permanent residence permits (in other words, 26.6% had permits for a temporary stay). Among all Ukrainians, 47.1% were women (48.9% among those with permanent residence, 42.0% among the ones with temporary stay permits).
Overall (or more precisely, since 2004), the number of Ukrainians reached its peak on 30th June 2009, when 134,456 Ukrainian citizens lived in Czechia. Since then, due to the economic crisis which hit Europe – the Czech economy included – the number of immigrants in Czechia has been slowly and continuously decreasing. The number of Ukrainians has oscillated around 104,000 for the last two years.
Most Ukrainian migrants came primarily for economic and work-related reasons. They are mostly employed in construction, some industrial sectors, services or agriculture, taking chiefly unskilled, manual, low paid, so-called ‘3D’ (demanding, dirty and danger-ous) jobs.
In terms of their spatial distribution, Ukrainians made up the biggest percentage of foreigners living in one district in the district of the Pelhřimov (38.4% of foreigners; 603 persons), then in Mělník (38.2%; 1,563 persons) and Strakonice (36.3%; 676 persons). On the other hand, their presence (as with all other foreigners) was negligible in the districts of Jeseník (4.4%; 36 persons), Frýdek-Místek (3.7%; 134 persons) and Karviná (2.7%; 175 persons). The situation throughout the territory can be seen from Figure 7.
To the group of economic immigrants, with allowed permanent or temporary stay, we have to add those claiming international protection (asylum or subsidiary protection).
In the month of January 2016, a total of 108 persons claimed international protection in Czechia. Of those, almost one half were Ukrainians (48 persons – 44.4%). Among the Ukrainians, one third (37.5% – 18 persons) were women, another third (27.1%; 13 persons) were minors and 12.5% of claims (6 persons) were submi�ed as repeated requests for international protection.
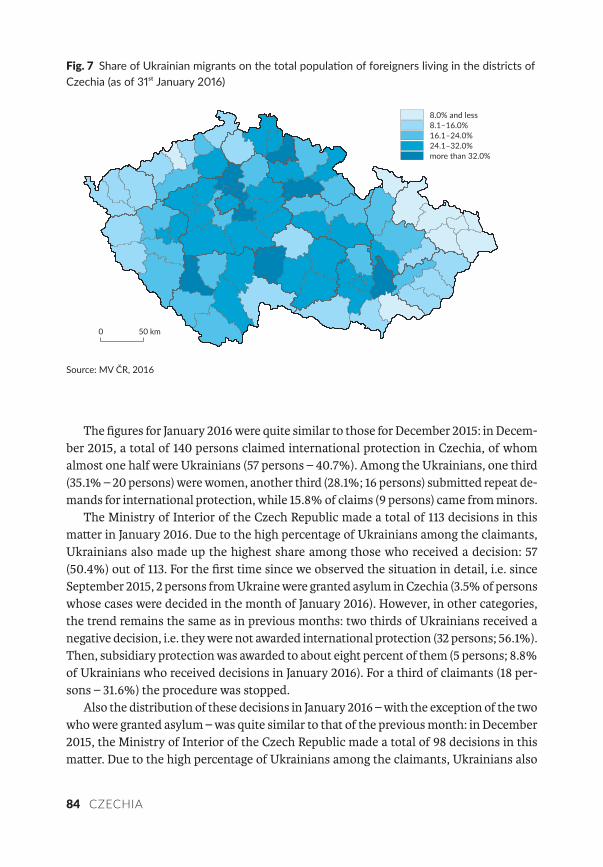
84 CZECHIA
The figures for January 2016 were quite similar to those for December 2015: in Decem-ber 2015, a total of 140 persons claimed international protection in Czechia, of whom almost one half were Ukrainians (57 persons – 40.7%). Among the Ukrainians, one third (35.1% – 20 persons) were women, another third (28.1%; 16 persons) submi�ed repeat de-mands for international protection, while 15.8% of claims (9 persons) came from minors.
The Ministry of Interior of the Czech Republic made a total of 113 decisions in this ma�er in January 2016. Due to the high percentage of Ukrainians among the claimants, Ukrainians also made up the highest share among those who received a decision: 57 (50.4%) out of 113. For the first time since we observed the situation in detail, i.e. since September 2015, 2 persons from Ukraine were granted asylum in Czechia (3.5% of persons whose cases were decided in the month of January 2016). However, in other categories, the trend remains the same as in previous months: two thirds of Ukrainians received a negative decision, i.e. they were not awarded international protection (32 persons; 56.1%). Then, subsidiary protection was awarded to about eight percent of them (5 persons; 8.8% of Ukrainians who received decisions in January 2016). For a third of claimants (18 per-sons – 31.6%) the procedure was stopped.
Also the distribution of these decisions in January 2016 – with the exception of the two who were granted asylum – was quite similar to that of the previous month: in December 2015, the Ministry of Interior of the Czech Republic made a total of 98 decisions in this ma�er. Due to the high percentage of Ukrainians among the claimants, Ukrainians also
Fig. Share of Ukrainian migrants on the total popula on of foreigners living in the districts of Czechia (as of January )
0 50 km
8.0% and less8.1–16.0%16.1–24.0%24.1–32.0%more than 32.0%
Source: MV ČR, 2016
CZECHIA 85
had the highest percentage of decisions received: 38 (38.8%) out of 98. Two thirds of them received a negative decision, i.e. they were not awarded international protection (24 persons; 63.2%). However, subsidiary protection was a�ributed to about eight percent of them (3 persons; 7.9% of Ukrainians whose cases were decided in the month of December 2015). For a third of claimants (11 persons – 28.9%) the procedure was stopped.
86 CZECHIA
MARCH
As of 31st March 2016, the last available data from the Ministry of Interior of the Czech Republic about foreigners residing permanently or temporarily on the territory of Czechia were still those of 31st January 2016, which we have covered already in the February 2016 report.
Consequently, for the largest group of foreigners, we can only repeat that at the end of January 2016, a total of 469,197 foreigners with permanent or temporary stay permits lived in Czechia. Ukrainians made up the biggest group: 106,182 persons – 22.6%. The second and the third most numerous groups were Slovaks (101,999 persons; 21.7%) and Vietnamese (57,130 persons; 12.2%). These three groups of foreigners represented more than half of all foreigners (56.5%) residing in Czechia at that time. More detailed charac-teristics on the life of Ukrainians at this time can be found in the February 2016 report.
The only available new data are those about persons claiming international protection (asylum or subsidiary protection) in Czechia in February 2016 who we always have to add to the group of economic immigrants.
In the month of February 2016, a total of 179 persons have claimed international protection in Czechia. Of those, only one quarter were Ukrainians (42 persons – 23.4%), compared with the situation in previous months, when Ukrainians always made up about half of claimants. Among the Ukrainians, one third (30.9% – 13 persons) were women, another third (35.7%; 15 persons) submi�ed repeated demands for international protec-tion, and 9.5% of claims (4 persons) came from minors.
The figures for February 2016 were quite similar to those for January 2016: in the month of January 2016, a total of 108 persons claimed international protection in Czechia. Of them, almost one half were Ukrainians (48 persons – 44.4%). Among the Ukrainians, one third (37.5% – 18 persons) were women, another third (27.1%; 13 persons) were minors and 12.5% of claims (6 persons) were submi�ed as repeat applications for international protection.
The Ministry of Interior of the Czech Republic made a total of 115 decisions in this ma�er in February 2016. Due to the high percentage of Ukrainians among the claimants, Ukrainians also had the second-highest share of decisions received: 37 (32.1%) out of 115. The largest number of decisions in February 2016 were given to citizens of Iraq – 40 per-sons (34.8%). Among Ukrainians, the trend remains the same as in previous months: half of Ukrainians received a negative decision, i.e. they were not awarded international pro-tection (19 persons; 51.3%). For almost all the remaining claimants (15 persons – 40.5%) the procedure was stopped. Only 3 persons (8.1%) were granted subsidiary protection.
In general, the distribution of these decisions in February 2016 was quite similar to that of decisions made in the previous month. The only exception was the two granted asylums in January 2016 (see below). Otherwise, the Ministry of Interior of the Czech
CZECHIA 87
Republic made a total of 113 decisions in this ma�er in January 2016. Due to the high percentage of Ukrainians among the claimants, Ukrainians also had the highest share of people who received a decision: 57 (50.4%) out of 113. For the first time since we have observed the situation in detail, i.e. since September 2015, 2 persons from Ukraine were granted asylum in Czechia (3.5% of persons whose case was decided in January 2016). However, in other categories, the trend remains the same as in previous months: two thirds of Ukrainians (32 persons; 56.1%) received a negative decision, i.e. they were not awarded international protection. Subsidiary protection was a�ributed to about eight percent of them (5 persons; 8.8% of Ukrainians whose cases were decided in January 2016). For a third of claimants (18 persons – 31.6%), the procedure was stopped.
88 CZECHIA
APRIL
As of 30th April 2016, the last available data from the Ministry of Interior of the Czech Republic about foreigners residing permanently or temporarily on the territory of Czechia were those of 31st March 2016.
At the end of March 2016, a total of 473,516 foreigners with permanent or temporary stay permits lived in Czechia, thus making an increase of 1,879 persons (0.40%) if com-pared with the situation at the end of February 2016. Ukrainians made up the biggest group: 106,788 persons – 22.6%. The second and the third largest groups were Slovaks (103,072 persons; 21.8%) and Vietnamese (57,389 persons; 12.1%). These three groups of foreigners represented more than half of all foreigners (56.4%) residing in Czechia at that time.
Between the end of February 2016 and the end of March 2016, the number of Ukrain-ians increased by 151 (0.14%). At the end of March 2016, 73.7% of Ukrainians living in Czechia had permanent residence permits (in other words, 26.3% had permits for a temporary stay). Among all Ukrainians, 47.2% were women (48.9% among those with permanent residence, 42.3% among those with a temporary stay permit).
Overall (or more precisely, since 2004), the number of Ukrainians reached its peak on 30th June 2009, when 134,456 Ukrainian citizens lived in Czechia. Since then, due to the economic crisis which hit Europe – the Czech economy included – the number of immigrants in Czechia has been slowly and continuously decreasing. The number of Ukrainians has oscillated around 105,000 for the last two years.
Most Ukrainian migrants came primarily for economic and work-related reasons. They are mostly employed in construction, some industrial sectors, services or agriculture, taking chiefly unskilled, manual, low paid, so-called ‘3D’ (demanding, dirty and danger-ous) jobs.
In terms of their spatial distribution, Ukrainians made up the biggest share of foreign-ers living in one district in the district of the Pelhřimov (38.6% of foreigners; 614 persons), then in Mělník (38.3%; 1,591 persons) and Strakonice (36.1%; 670 persons). On the other hand, their presence (as with all other foreigners) was negligible in the districts of Jeseník (4.5%; 37 persons), Frýdek-Místek (3.7%; 135 persons) and Karviná (2.8%; 176 persons). The situation for the whole territory can be seen from Figure 8.
To the group of economic immigrants, with permanent or temporary stay permits, we have to add those claiming international protection (asylum or subsidiary protection).
In the month of March 2016, a total of 128 persons have claimed international protec-tion in Czechia. Of those, one third were Ukrainians (35 persons – 27.3%), which repre-sents a small increase in their share if compared with February 2016, but still a decrease if compared with the situation in 2015, when Ukrainians always made up about half of claimants. Among the Ukrainians, one third of claimants (34.3% – 12 persons) submi�ed
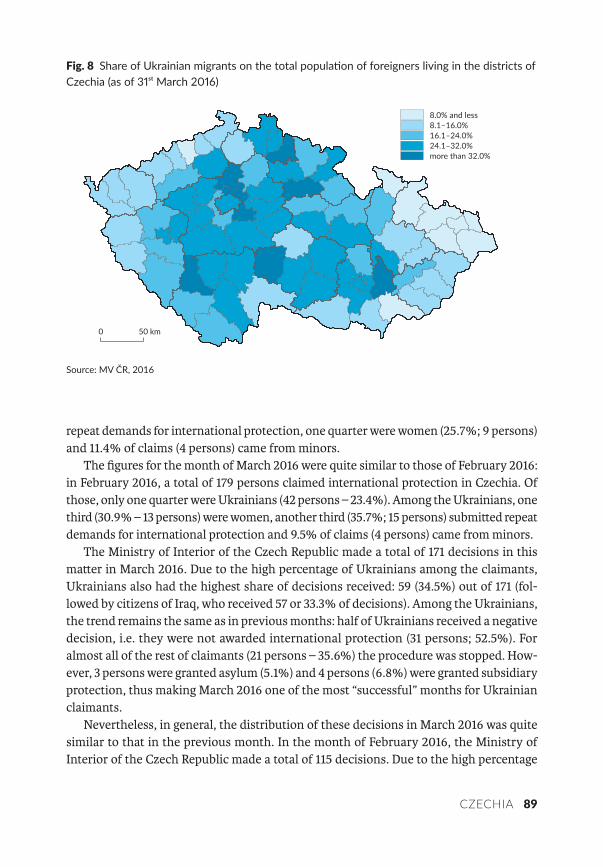
CZECHIA 89
repeat demands for international protection, one quarter were women (25.7%; 9 persons) and 11.4% of claims (4 persons) came from minors.
The figures for the month of March 2016 were quite similar to those of February 2016: in February 2016, a total of 179 persons claimed international protection in Czechia. Of those, only one quarter were Ukrainians (42 persons – 23.4%). Among the Ukrainians, one third (30.9% – 13 persons) were women, another third (35.7%; 15 persons) submi�ed repeat demands for international protection and 9.5% of claims (4 persons) came from minors.
The Ministry of Interior of the Czech Republic made a total of 171 decisions in this ma�er in March 2016. Due to the high percentage of Ukrainians among the claimants, Ukrainians also had the highest share of decisions received: 59 (34.5%) out of 171 (fol-lowed by citizens of Iraq, who received 57 or 33.3% of decisions). Among the Ukrainians, the trend remains the same as in previous months: half of Ukrainians received a negative decision, i.e. they were not awarded international protection (31 persons; 52.5%). For almost all of the rest of claimants (21 persons – 35.6%) the procedure was stopped. How-ever, 3 persons were granted asylum (5.1%) and 4 persons (6.8%) were granted subsidiary protection, thus making March 2016 one of the most “successful” months for Ukrainian claimants.
Nevertheless, in general, the distribution of these decisions in March 2016 was quite similar to that in the previous month. In the month of February 2016, the Ministry of Interior of the Czech Republic made a total of 115 decisions. Due to the high percentage
Fig. Share of Ukrainian migrants on the total popula on of foreigners living in the districts of Czechia (as of March )
0 50 km
8.0% and less8.1–16.0%16.1–24.0%24.1–32.0%more than 32.0%
Source: MV ČR, 2016
90 CZECHIA
of Ukrainians among the claimants, Ukrainians also had the second-highest share of those who received a decision: 37 (32.1%) out of 115. The largest number of decisions in February 2016 were made for citizens of Iraq – 40 persons (34.8%). Among the Ukrai-nians, the trend remains the same as in previous months: half of Ukrainians received a negative decision, i.e. they were not awarded international protection (19 persons; 51.3%). For almost all of the rest of claimants (15 persons – 40.5%) the procedure was stopped. Only 3 persons (8.1%) were granted subsidiary protection.
CZECHIA 91
MAY
As of 31st May 2016, the last available data from the Ministry of Interior of the Czech Repub-lic about foreigners residing permanently or temporarily on the territory of Czechia were still those of 31st March 2016, which we have covered already in the report of April 2016.
Consequently, for the largest group of foreigners, we can only repeat that at the end of March 2016, 106,788 Ukrainians were living in Czechia, thus making up 22.6% of foreign-ers with permanent or temporary stay permits. The second and the third largest groups among the total of 473,516 foreigners with permanent or temporary stay permits were Slovaks (103,072 persons; 21.8%) and Vietnamese (57,389 persons; 12.1%). These three groups of foreigners together represented more than half of all foreigners (56.4%) residing in Czechia at that time.
The only available new data are those about persons claiming international protection (asylum or subsidiary protection) in Czechia in April 2016 who we always have to add to the group of economic immigrants.
In the month of April 2016, a total of 151 persons have claimed international protection in Czechia. Of those, one third were Ukrainians (48 persons – 31.8%), which means a small increase in their share if compared with March 2016, but still a decrease if compared with the situation in 2015, when Ukrainians always made up about half of claimants. Among the Ukrainians, one quarter of claimants (25.0% – 12 persons) submi�ed repeat requests for international protection, one fih were women (20.8%; 10 persons) and another fih of claims (18.8%; 9 persons) came from minors.
The figures for the month of April 2016 were quite similar to those of March 2016: in March 2016, a total of 128 persons claimed international protection in Czechia. Of those, one third were Ukrainians (35 persons – 27.3%), which represents a small increase of their share if compared with February 2016, but still a decrease if compared with the situation in 2015, when Ukrainians always made up about half of claimants. Among the Ukrainians, one third of claimants (34.3% – 12 persons) submi�ed repeat requests for international protection, one quarter were women (25.7%; 9 persons) and 11.4% of claims (4 persons) came from minors.
The Ministry of Interior of the Czech Republic made a total of 140 decisions in this ma�er in April 2016. Due to the high percentage of Ukrainians among the claimants, Ukrainians also had the highest share among people who received a decision: 46 (32.9%) out of 140 (followed by citizens of Iraq, who received 44 or 31.4% of decisions). Among the Ukrainians, the trend remains the same as in previous months: half of Ukrainians received negative decisions, i.e. they were not awarded international protection (26 per-sons; 56.5%). For almost all of the rest of claimants (14 persons – 30.4%) the procedure was stopped. However, even if asylum itself was not granted to anybody from Ukraine, at least 6 persons (13.0%) were granted subsidiary protection.
92 CZECHIA
In general, the distribution of these decisions in April 2016 was quite similar if com-pared with that of the previous month. In the month of March 2016, Ukrainians also represented the highest share among those who received a decision due to the high per-centage of Ukrainians among the claimants: 59 (34.5%) out of 171 (followed by citizens of Iraq, who received 57 or 33.3% of decisions). Among the Ukrainians, the trend remains the same as in previous months: half of the Ukrainians received a negative decision, i.e. they were not awarded international protection (31 persons; 52.5%). For almost all of the rest of claimants (21 persons – 35.6%) the procedure was stopped. However, 3 persons were granted asylum (5.1%) and 4 persons (6.8%) were granted subsidiary protection, thus making March 2016 one of the most “successful” months for Ukrainian claimants.
CZECHIA 93
JUNE
As of 30th June 2016, the last available data from the Ministry of Interior of the Czech Republic about foreigners residing permanently or temporarily on the territory of Czechia were unfortunately still those of 31st March 2016, which we already covered in the April 2016 report. Finally, on 31st July 2016, the data concerning the changes in the number of foreigners residing permanently or temporarily on the territory of Czechia from April to June 2016 were released and cover the situation on 30th June 2016.
The overall number of foreigners residing in Czechia rose from 473,516 (on 31st March 2016) to 480,191 (on 30th June 2016), i.e. by 6,675 persons (1.4%). The largest group of foreigners with permanent or temporary stay permits were still Ukrainians: from 106,788 and thus making up 22.6% of all foreigners at the end of March 2016, their number rose to 107,614 and 22.4% at the end of June 2016. Even if their share among the foreigners has slightly decreased (by 0.2%), their number has in fact grown: there were 826 more persons at the end of June 2016 if compared with the end of March 2016. The second and third largest groups of foreigners were still Slovaks and Vietnamese: Slovaks at 104,627 and 21.8% of all foreigners at the end of June 2016, and Vietnamese at 57,680 and 12.0%. These three groups of foreigners represented more than half of all foreigners (56.2%) residing in Czechia at that time.
Overall (or more precisely, since 2004), the number of Ukrainians reached its peak on 30th June 2009, when 134,456 Ukrainian citizens lived in Czechia. Since then, due to the economic crisis which hit Europe – the Czech economy included – the number of immigrants in Czechia has been slowly and continuously decreasing. The number of Ukrainians has oscillated around 105,000 for the last two years.
Most Ukrainian migrants came primarily for economic and work-related reasons. They are mostly employed in construction, some industrial sectors, services or agriculture, taking chiefly unskilled, manual, low paid, so-called ‘3D’ (demanding, dirty and danger-ous) jobs.
To the group of economic immigrants, with permanent or temporary stay permits, we have to add those claiming international protection (asylum or subsidiary protection).
In the month of June 2016, a total of 103 persons claimed international protection in Czechia. Of the people seeking protection in Czechia in June 2016, more than one third were Ukrainians (41 persons – 39.8%). Among the Ukrainians, one fih of claimants (19.5% – 8 persons) submi�ed repeat requests for international protection, another fih were women (21.9%; 9 persons) and less than 7% of claims (7.3%; 3 persons) came from minors.
The figures for the month of June 2016 were quite similar in composition to those for May 2016: in May 2016, a total of 96 persons claimed international protection in Czechia. One third of them were Ukrainians (33 persons – 34.4%). Among the Ukrainians, one third
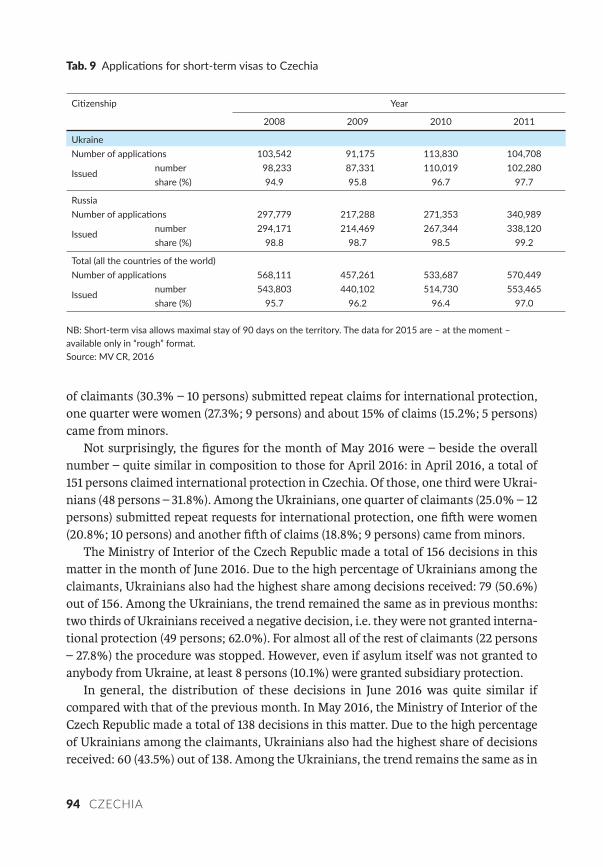
94 CZECHIA
of claimants (30.3% – 10 persons) submi�ed repeat claims for international protection, one quarter were women (27.3%; 9 persons) and about 15% of claims (15.2%; 5 persons) came from minors.
Not surprisingly, the figures for the month of May 2016 were – beside the overall number – quite similar in composition to those for April 2016: in April 2016, a total of 151 persons claimed international protection in Czechia. Of those, one third were Ukrai-nians (48 persons – 31.8%). Among the Ukrainians, one quarter of claimants (25.0% – 12 persons) submi�ed repeat requests for international protection, one fih were women (20.8%; 10 persons) and another fih of claims (18.8%; 9 persons) came from minors.
The Ministry of Interior of the Czech Republic made a total of 156 decisions in this ma�er in the month of June 2016. Due to the high percentage of Ukrainians among the claimants, Ukrainians also had the highest share among decisions received: 79 (50.6%) out of 156. Among the Ukrainians, the trend remained the same as in previous months: two thirds of Ukrainians received a negative decision, i.e. they were not granted interna-tional protection (49 persons; 62.0%). For almost all of the rest of claimants (22 persons – 27.8%) the procedure was stopped. However, even if asylum itself was not granted to anybody from Ukraine, at least 8 persons (10.1%) were granted subsidiary protection.
In general, the distribution of these decisions in June 2016 was quite similar if compared with that of the previous month. In May 2016, the Ministry of Interior of the Czech Republic made a total of 138 decisions in this ma�er. Due to the high percentage of Ukrainians among the claimants, Ukrainians also had the highest share of decisions received: 60 (43.5%) out of 138. Among the Ukrainians, the trend remains the same as in
Tab. Applica ons for short-term visas to Czechia
Ci zenship Year
2008 2009 2010 2011
UkraineNumber of applica ons 103,542 91,175 113,830 104,708
Issued number 98,233 87,331 110,019 102,280share (%) 94.9 95.8 96.7 97.7
RussiaNumber of applica ons 297,779 217,288 271,353 340,989
Issued number 294,171 214,469 267,344 338,120share (%) 98.8 98.7 98.5 99.2
Total (all the countries of the world)Number of applica ons 568,111 457,261 533,687 570,449
Issued number 543,803 440,102 514,730 553,465share (%) 95.7 96.2 96.4 97.0
NB: Short-term visa allows maximal stay of 90 days on the territory. The data for 2015 are – at the moment –available only in “rough” format.Source: MV CR, 2016
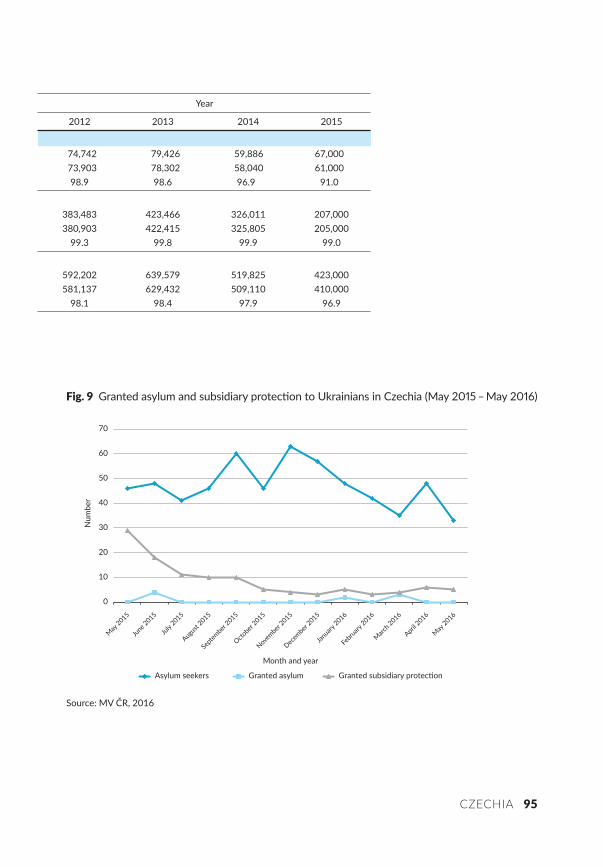
CZECHIA 95
Fig. Granted asylum and subsidiary protec on to Ukrainians in Czechia (May – May )
0
10
20
30
40
50
60
70
Num
ber
Asylum seekers Granted asylum
Month and year
May 2015
June 2
015
July
2015
August
2015
Septem
ber 2015
October
2015
November
2015
Decem
ber 2015
January
2016
February
2016
March 2016
April 2016
May 2016
Source: MV ČR, 2016
Year
2012 2013 2014 2015
74,742 79,426 59,886 67,000 73,903 78,302 58,040 61,000
98.9 98.6 96.9 91.0
383,483 423,466 326,011 207,000380,903 422,415 325,805 205,000
99.3 99.8 99.9 99.0
592,202 639,579 519,825 423,000581,137 629,432 509,110 410,000
98.1 98.4 97.9 96.9
96 CZECHIA
previous months: two thirds of Ukrainians received a negative decision, i.e. they were not awarded international protection (39 persons; 65.0%). For almost all of the rest of claim-ants (16 persons – 26.7%) the procedure was stopped. However, even if asylum itself was not granted to anybody from Ukraine, at least 5 persons (8.3%) were granted subsidiary protection.
As was the case already for the overall numbers, the distribution of the decisions of the Ministry of Interior of the Czech Republic in May 2016 was also quite similar to that in April 2016. In the month of April 2016, the Ministry of Interior of the Czech Republic made a total of 140 decisions in this ma�er. Due to the high percentage of Ukrainians among the claimants, Ukrainians also had the highest share of decisions received: 46 (32.9%) out of 40 (followed by citizens of Iraq, who received 44 or 31.4% of decisions). Among the Ukrainians, the trend remained the same as in previous months: half of Ukrainians received a negative decision, i.e. they were not granted international protec-tion (26 persons; 56.5%). For almost all of the rest of claimants (14 persons – 30.4%) the procedure was stopped. However, even if asylum itself was not granted to anybody from Ukraine, at least 6 persons (13.0%) were granted subsidiary protection.
The overall level of “success” of asylum seekers from Ukraine when applying for pro-tection in Czechia within last year can be seen clearly from Fig. 9.
To complete the picture of Ukrainians in Czechia, we can, this time, look also at a totally different group of Ukrainians in the country: those coming only for a visit, as the a�ractiveness of Czechia for citizens of other countries can also be seen in the number of applications for short term visas, i.e. for a visa which allows them to visit the country for a period of up to 90 days. Up to 2011, about 100, 000 Ukrainians applied for such a visa, whilst since then the numbers have been around 60,000–70,000 a year. For Russians, we are speaking about significantly different numbers: 200,000–400,000 applications in a year, i.e. 4 times more on average. So, it is obvious that for Ukrainians coming to Czechia is a question of a life choice, of se�ling down, building a new future, whilst for Russians it is more question of short visits for shopping, sightseeing etc. Russians represent half of all tourists who need visas for short term visits to Czechia, as the overall numbers (for all countries in the world) is usually around 600,000 (see Tab. 9).
SlovakiaUKRAINIAN CITIZENS IN SLOVAKIA:MIGRATION OVERVIEW
Vladimír Benč
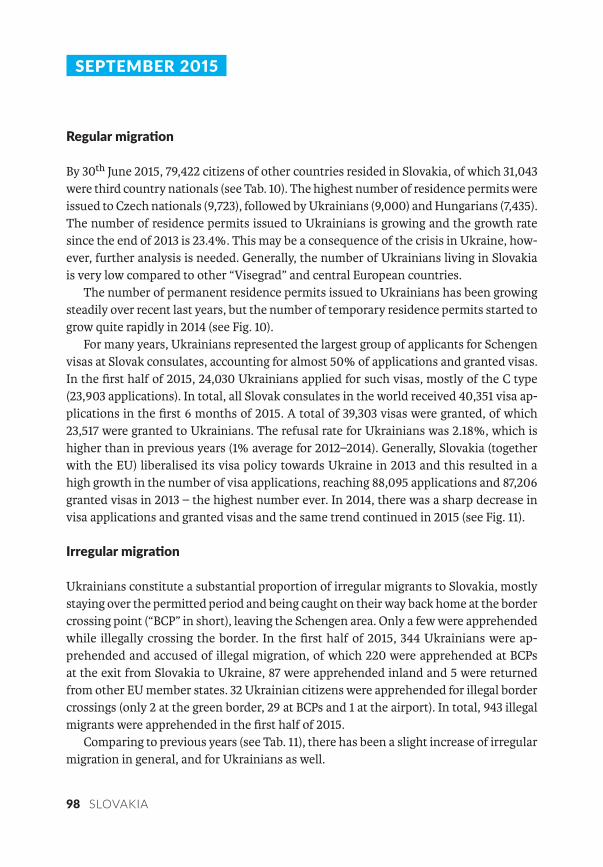
98 SLOVAKIA
SEPTEMBER
Regular migra on
By 30th June 2015, 79,422 citizens of other countries resided in Slovakia, of which 31,043 were third country nationals (see Tab. 10). The highest number of residence permits were issued to Czech nationals (9,723), followed by Ukrainians (9,000) and Hungarians (7,435). The number of residence permits issued to Ukrainians is growing and the growth rate since the end of 2013 is 23.4%. This may be a consequence of the crisis in Ukraine, how-ever, further analysis is needed. Generally, the number of Ukrainians living in Slovakia is very low compared to other “Visegrad” and central European countries.
The number of permanent residence permits issued to Ukrainians has been growing steadily over recent last years, but the number of temporary residence permits started to grow quite rapidly in 2014 (see Fig. 10).
For many years, Ukrainians represented the largest group of applicants for Schengen visas at Slovak consulates, accounting for almost 50% of applications and granted visas. In the first half of 2015, 24,030 Ukrainians applied for such visas, mostly of the C type (23,903 applications). In total, all Slovak consulates in the world received 40,351 visa ap-plications in the first 6 months of 2015. A total of 39,303 visas were granted, of which 23,517 were granted to Ukrainians. The refusal rate for Ukrainians was 2.18%, which is higher than in previous years (1% average for 2012–2014). Generally, Slovakia (together with the EU) liberalised its visa policy towards Ukraine in 2013 and this resulted in a high growth in the number of visa applications, reaching 88,095 applications and 87,206 granted visas in 2013 – the highest number ever. In 2014, there was a sharp decrease in visa applications and granted visas and the same trend continued in 2015 (see Fig. 11).
Irregular migra on
Ukrainians constitute a substantial proportion of irregular migrants to Slovakia, mostly staying over the permi�ed period and being caught on their way back home at the border crossing point (“BCP” in short), leaving the Schengen area. Only a few were apprehended while illegally crossing the border. In the first half of 2015, 344 Ukrainians were ap-prehended and accused of illegal migration, of which 220 were apprehended at BCPs at the exit from Slovakia to Ukraine, 87 were apprehended inland and 5 were returned from other EU member states. 32 Ukrainian citizens were apprehended for illegal border crossings (only 2 at the green border, 29 at BCPs and 1 at the airport). In total, 943 illegal migrants were apprehended in the first half of 2015.
Comparing to previous years (see Tab. 11), there has been a slight increase of irregular migration in general, and for Ukrainians as well.
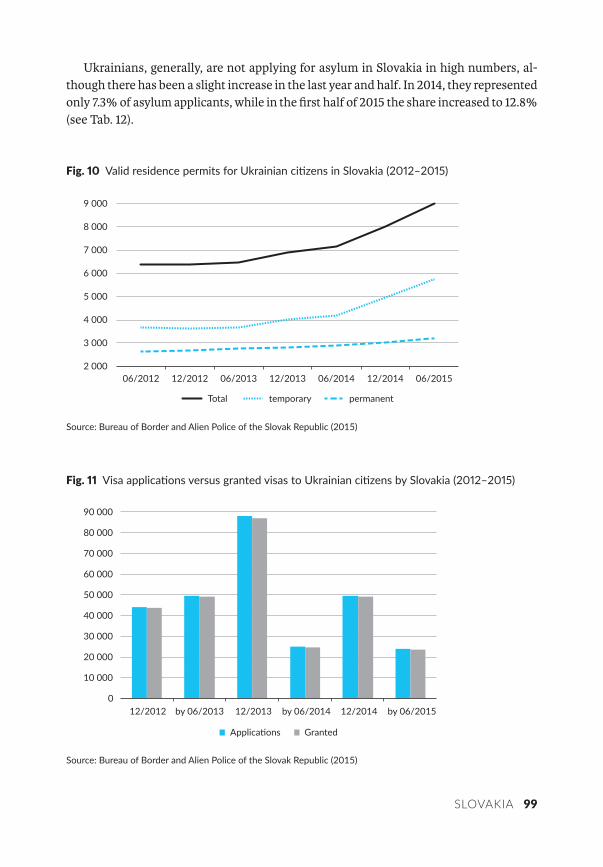
SLOVAKIA 99
Ukrainians, generally, are not applying for asylum in Slovakia in high numbers, al-though there has been a slight increase in the last year and half. In 2014, they represented only 7.3% of asylum applicants, while in the first half of 2015 the share increased to 12.8% (see Tab. 12).
Fig. Valid residence permits for Ukrainian ci zens in Slovakia ( – )
2 000
3 000
4 000
5 000
6 000
7 000
8 000
9 000
06/2012 12/2012 06/2013 12/2013 06/2014 12/2014 06/2015
Total temporary permanent
Source: Bureau of Border and Alien Police of the Slovak Republic (2015)
Fig. Visa applica ons versus granted visas to Ukrainian ci zens by Slovakia ( – )
0
10 000
20 000
30 000
40 000
50 000
60 000
70 000
80 000
90 000
12/2012 by 06/2013 12/2013 by 06/2014 12/2014 by 06/2015
Source: Bureau of Border and Alien Police of the Slovak Republic (2015)
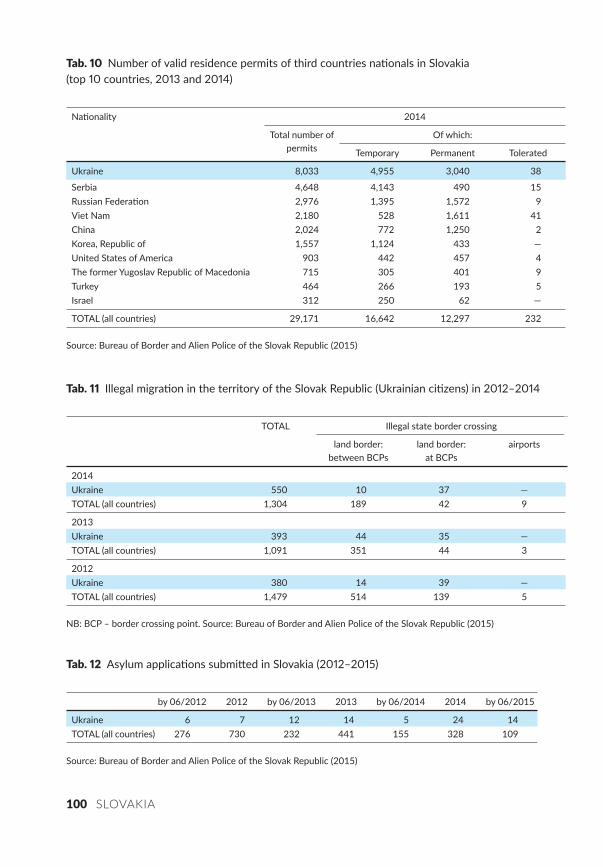
100 SLOVAKIA
Tab. Illegal migra on in the territory of the Slovak Republic (Ukrainian ci zens) in –
TOTAL Illegal state border crossing
land border: between BCPs
land border:at BCPs
airports
2014Ukraine 550 10 37 —TOTAL (all countries) 1,304 189 42 9
2013Ukraine 393 44 35 —TOTAL (all countries) 1,091 351 44 3
2012Ukraine 380 14 39 —TOTAL (all countries) 1,479 514 139 5
NB: BCP – border crossing point. Source: Bureau of Border and Alien Police of the Slovak Republic (2015)
Tab. Number of valid residence permits of third countries na onals in Slovakia(top countries, and )
Na onality
2014
Total number of permits
Of which:
Temporary Permanent Tolerated
Ukraine 8,033 4,955 3,040 38
Serbia 4,648 4,143 490 15Russian Federa on 2,976 1,395 1,572 9Viet Nam 2,180 528 1,611 41China 2,024 772 1,250 2Korea, Republic of 1,557 1,124 433 —United States of America 903 442 457 4The former Yugoslav Republic of Macedonia 715 305 401 9Turkey 464 266 193 5Israel 312 250 62 —
TOTAL (all countries) 29,171 16,642 12,297 232
Source: Bureau of Border and Alien Police of the Slovak Republic (2015)
Tab. Asylum applica ons submi ed in Slovakia ( – )
by 06/2012 2012 by 06/2013 2013 by 06/2014 2014 by 06/2015
Ukraine 6 7 12 14 5 24 14TOTAL (all countries) 276 730 232 441 155 328 109
Source: Bureau of Border and Alien Police of the Slovak Republic (2015)
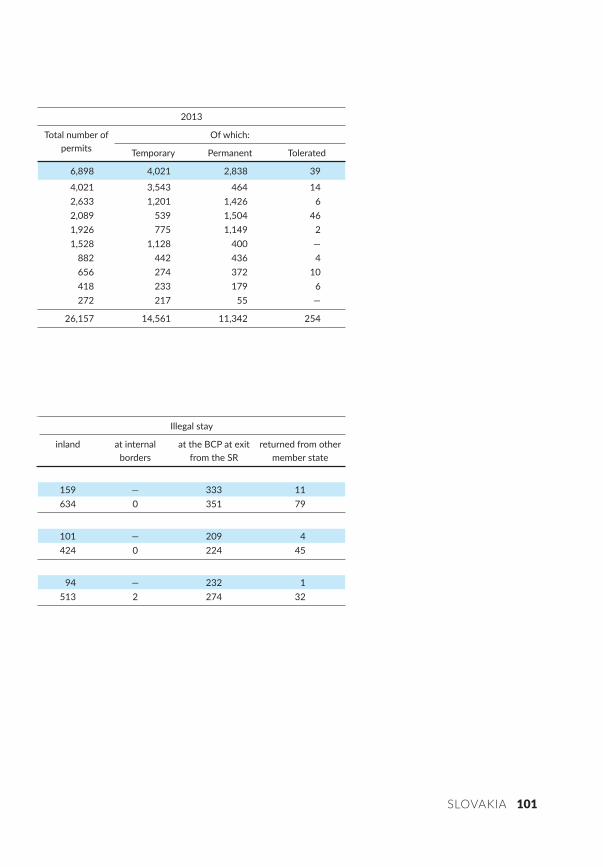
SLOVAKIA 101
Illegal stay
inland at internal borders
at the BCP at exit from the SR
returned from other member state
159 — 333 11634 0 351 79
101 — 209 4424 0 224 45
94 — 232 1513 2 274 32
2013
Total number of permits
Of which:
Temporary Permanent Tolerated
6,898 4,021 2,838 39
4,021 3,543 464 142,633 1,201 1,426 62,089 539 1,504 461,926 775 1,149 21,528 1,128 400 —
882 442 436 4656 274 372 10418 233 179 6272 217 55 —
26,157 14,561 11,342 254
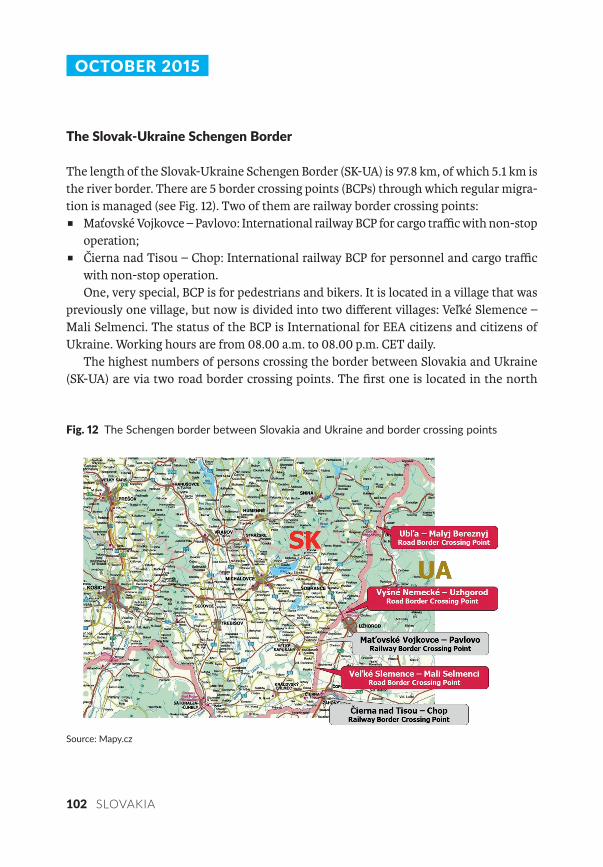
102 SLOVAKIA
OCTOBER
The Slovak-Ukraine Schengen Border
The length of the Slovak-Ukraine Schengen Border (SK-UA) is 97.8 km, of which 5.1 km is the river border. There are 5 border crossing points (BCPs) through which regular migra-tion is managed (see Fig. 12). Two of them are railway border crossing points:
� Maťovské Vojkovce – Pavlovo: International railway BCP for cargo traffic with non-stop operation;
� Čierna nad Tisou – Chop: International railway BCP for personnel and cargo traffic with non-stop operation.One, very special, BCP is for pedestrians and bikers. It is located in a village that was
previously one village, but now is divided into two different villages: Veľké Slemence – Mali Selmenci. The status of the BCP is International for EEA citizens and citizens of Ukraine. Working hours are from 08.00 a.m. to 08.00 p.m. CET daily.
The highest numbers of persons crossing the border between Slovakia and Ukraine (SK-UA) are via two road border crossing points. The first one is located in the north
Fig. The Schengen border between Slovakia and Ukraine and border crossing points
Source: Mapy.cz

SLOVAKIA 103
of the border near the villages of Ubľa – Malyj Bereznyj. It is an international BCP for road transport up to 3.5 tons of total weight and operates non-stop. The largest and the most important BCP is thus the one located in village Vyšné Nemecké – Užhorod. It is an international BCP for road transport, persons and cargo traffic (TIR) with non-stop operation. Phytosanitary and veterinary controls are also performed there.
Regular migra on
In 2014, more than 1.8 million passengers crossed the Slovak-Ukraine Schengen border via BCPs. The crisis in Ukraine had only a very limited impact on the flow of persons – regular migration – via the SK-UA border. The number of persons crossing the border fell by 126,000 in the period 2012–2014. However there is much longer decreasing trend of persons crossing the border, the main reason for this being a decline in the number of those who travel to go shopping on the other side of the border (reasons: equalisation of prices, custom procedures that limit the purchase of “sensitive” goods like cigare�es, alcohol etc.) (see Tab. 13).
Most persons cross the border via BCP in Vyšné Nemecké. “Shopping” activities were done mainly through the pedestrian BCP in Slemence, where the decrease in the number of persons crossing the border year on year is evident (see Tab. 14).
Fig. Illegal crossing of the state border of the Slovak Republic (number of persons per month, – )
0
20
40
60
80
100
120
JAN FEB MAR APR MAY JUN JUL AUG SEP OCT NOV DEC
2012 2013 2014 2015
Source: Bureau of Border and Alien Police of the Slovak Republic (2015)
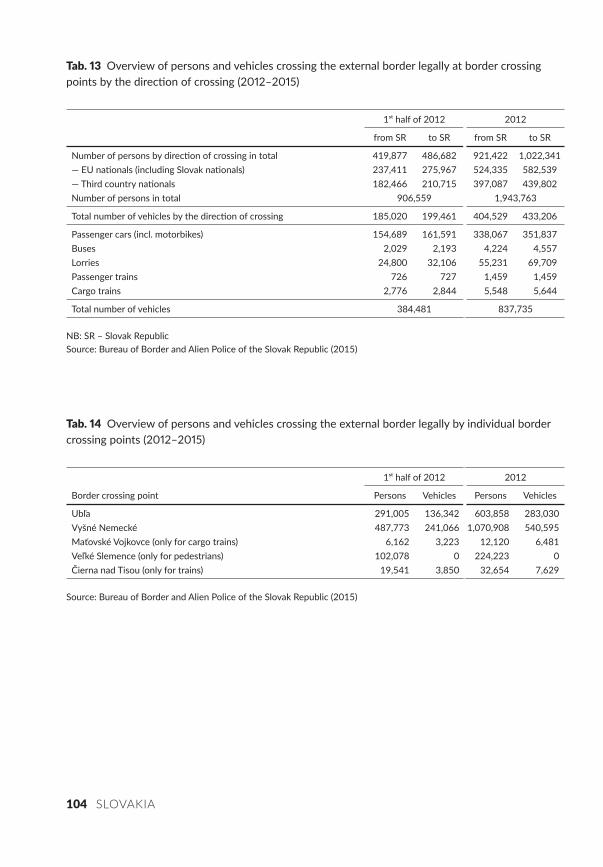
104 SLOVAKIA
Tab. Overview of persons and vehicles crossing the external border legally by individual bordercrossing points ( – )
1 half of 2012 2012
Border crossing point Persons Vehicles Persons Vehicles
Ubľa 291,005 136,342 603,858 283,030Vyšné Nemecké 487,773 241,066 1,070,908 540,595Maťovské Vojkovce (only for cargo trains) 6,162 3,223 12,120 6,481Veľké Slemence (only for pedestrians) 102,078 0 224,223 0Čierna nad Tisou (only for trains) 19,541 3,850 32,654 7,629
Source: Bureau of Border and Alien Police of the Slovak Republic (2015)
Tab. Overview of persons and vehicles crossing the external border legally at border crossingpoints by the direc on of crossing ( – )
1 half of 2012 2012
from SR to SR from SR to SR
Number of persons by direc on of crossing in total 419,877 486,682 921,422 1,022,341— EU na onals (including Slovak na onals) 237,411 275,967 524,335 582,539— Third country na onals 182,466 210,715 397,087 439,802Number of persons in total 906,559 1,943,763
Total number of vehicles by the direc on of crossing 185,020 199,461 404,529 433,206
Passenger cars (incl. motorbikes) 154,689 161,591 338,067 351,837Buses 2,029 2,193 4,224 4,557Lorries 24,800 32,106 55,231 69,709Passenger trains 726 727 1,459 1,459Cargo trains 2,776 2,844 5,548 5,644
Total number of vehicles 384,481 837,735
NB: SR – Slovak RepublicSource: Bureau of Border and Alien Police of the Slovak Republic (2015)
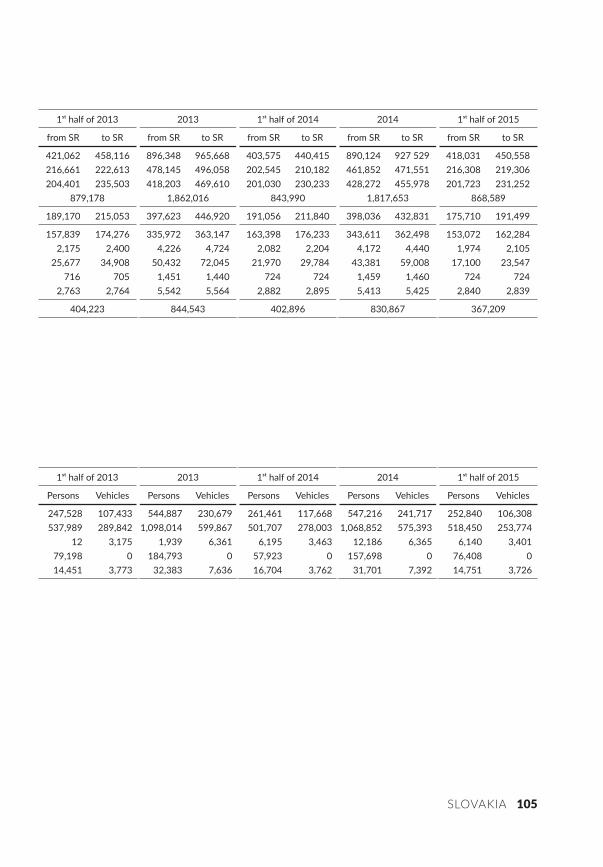
SLOVAKIA 105
1 half of 2013 2013 1 half of 2014 2014 1 half of 2015
Persons Vehicles Persons Vehicles Persons Vehicles Persons Vehicles Persons Vehicles
247,528 107,433 544,887 230,679 261,461 117,668 547,216 241,717 252,840 106,308537,989 289,842 1,098,014 599,867 501,707 278,003 1,068,852 575,393 518,450 253,774
12 3,175 1,939 6,361 6,195 3,463 12,186 6,365 6,140 3,40179,198 0 184,793 0 57,923 0 157,698 0 76,408 014,451 3,773 32,383 7,636 16,704 3,762 31,701 7,392 14,751 3,726
1 half of 2013 2013 1 half of 2014 2014 1 half of 2015
from SR to SR from SR to SR from SR to SR from SR to SR from SR to SR
421,062 458,116 896,348 965,668 403,575 440,415 890,124 927 529 418,031 450,558216,661 222,613 478,145 496,058 202,545 210,182 461,852 471,551 216,308 219,306204,401 235,503 418,203 469,610 201,030 230,233 428,272 455,978 201,723 231,252
879,178 1,862,016 843,990 1,817,653 868,589
189,170 215,053 397,623 446,920 191,056 211,840 398,036 432,831 175,710 191,499
157,839 174,276 335,972 363,147 163,398 176,233 343,611 362,498 153,072 162,284 2,175 2,400 4,226 4,724 2,082 2,204 4,172 4,440 1,974 2,105 25,677 34,908 50,432 72,045 21,970 29,784 43,381 59,008 17,100 23,547 716 705 1,451 1,440 724 724 1,459 1,460 724 724 2,763 2,764 5,542 5,564 2,882 2,895 5,413 5,425 2,840 2,839
404,223 844,543 402,896 830,867 367,209
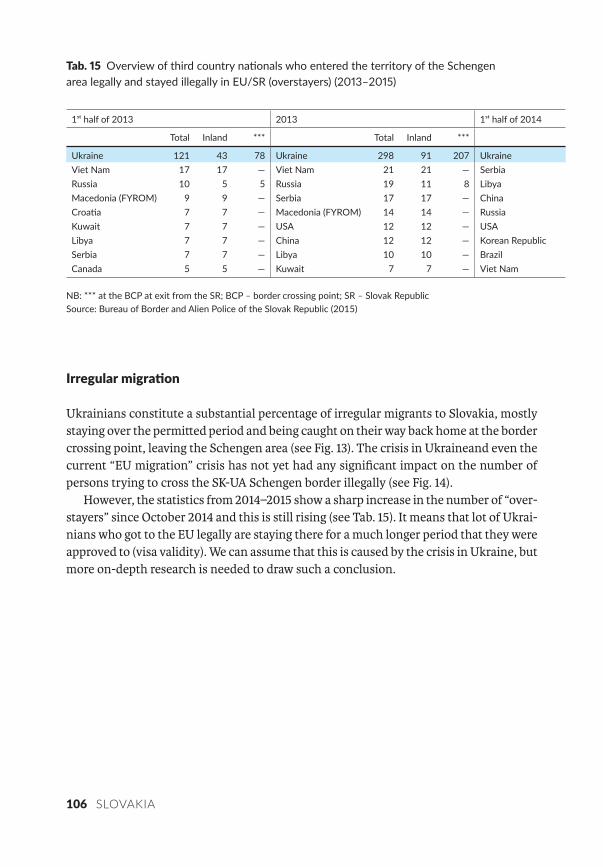
106 SLOVAKIA
Irregular migra on
Ukrainians constitute a substantial percentage of irregular migrants to Slovakia, mostly staying over the permi�ed period and being caught on their way back home at the border crossing point, leaving the Schengen area (see Fig. 13). The crisis in Ukraineand even the current “EU migration” crisis has not yet had any significant impact on the number of persons trying to cross the SK-UA Schengen border illegally (see Fig. 14).
However, the statistics from 2014–2015 show a sharp increase in the number of “over-stayers” since October 2014 and this is still rising (see Tab. 15). It means that lot of Ukrai-nians who got to the EU legally are staying there for a much longer period that they were approved to (visa validity). We can assume that this is caused by the crisis in Ukraine, but more on-depth research is needed to draw such a conclusion.
Tab. Overview of third country na onals who entered the territory of the Schengenarea legally and stayed illegally in EU/SR (overstayers) ( – )
1 half of 2013 2013 1 half of 2014
Total Inland *** Total Inland ***
Ukraine 121 43 78 Ukraine 298 91 207 Ukraine Viet Nam 17 17 — Viet Nam 21 21 — Serbia Russia 10 5 5 Russia 19 11 8 Libya Macedonia (FYROM) 9 9 — Serbia 17 17 — China Croa a 7 7 — Macedonia (FYROM) 14 14 — Russia Kuwait 7 7 — USA 12 12 — USA Libya 7 7 — China 12 12 — Korean Republic Serbia 7 7 — Libya 10 10 — Brazil Canada 5 5 — Kuwait 7 7 — Viet Nam
NB: *** at the BCP at exit from the SR; BCP – border crossing point; SR – Slovak RepublicSource: Bureau of Border and Alien Police of the Slovak Republic (2015)
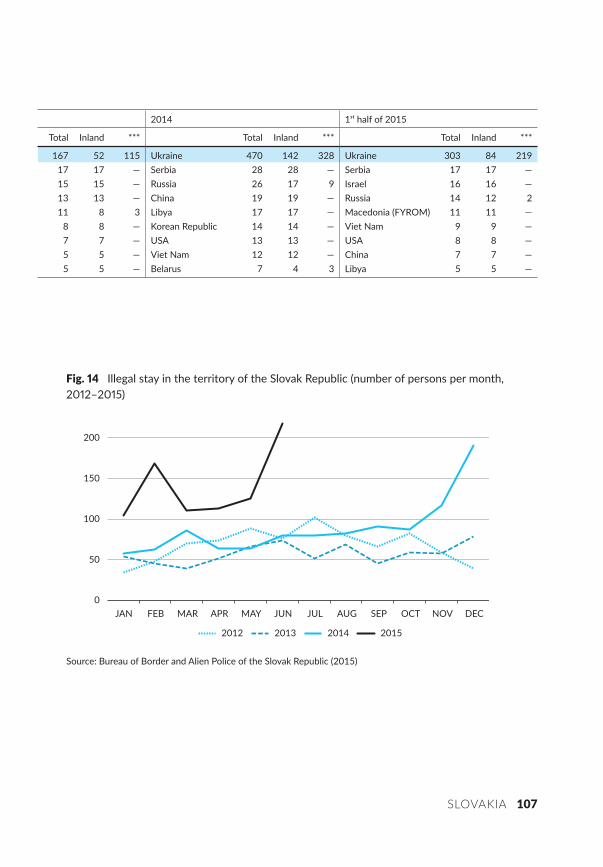
SLOVAKIA 107
Fig. Illegal stay in the territory of the Slovak Republic (number of persons per month, – )
0
50
100
150
200
JAN FEB MAR APR MAY JUN JUL AUG SEP OCT NOV DEC
2012 2013 2014 2015
Source: Bureau of Border and Alien Police of the Slovak Republic (2015)
2014 1 half of 2015
Total Inland *** Total Inland *** Total Inland ***
167 52 115 Ukraine 470 142 328 Ukraine 303 84 21917 17 — Serbia 28 28 — Serbia 17 17 —15 15 — Russia 26 17 9 Israel 16 16 —13 13 — China 19 19 — Russia 14 12 211 8 3 Libya 17 17 — Macedonia (FYROM) 11 11 —
8 8 — Korean Republic 14 14 — Viet Nam 9 9 —7 7 — USA 13 13 — USA 8 8 —5 5 — Viet Nam 12 12 — China 7 7 —5 5 — Belarus 7 4 3 Libya 5 5 —
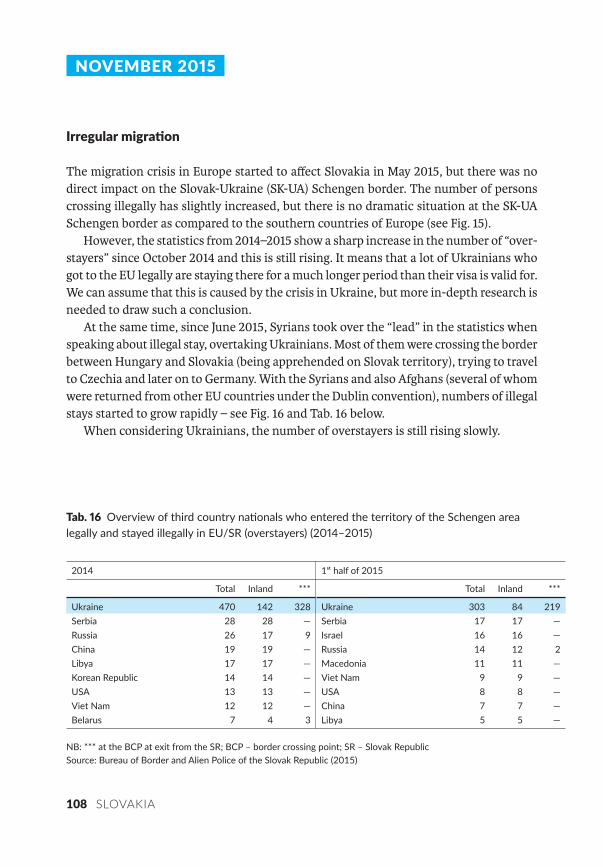
108 SLOVAKIA
NOVEMBER
Irregular migra on
The migration crisis in Europe started to affect Slovakia in May 2015, but there was no direct impact on the Slovak-Ukraine (SK-UA) Schengen border. The number of persons crossing illegally has slightly increased, but there is no dramatic situation at the SK-UA Schengen border as compared to the southern countries of Europe (see Fig. 15).
However, the statistics from 2014–2015 show a sharp increase in the number of “over-stayers” since October 2014 and this is still rising. It means that a lot of Ukrainians who got to the EU legally are staying there for a much longer period than their visa is valid for. We can assume that this is caused by the crisis in Ukraine, but more in-depth research is needed to draw such a conclusion.
At the same time, since June 2015, Syrians took over the “lead” in the statistics when speaking about illegal stay, overtaking Ukrainians. Most of them were crossing the border between Hungary and Slovakia (being apprehended on Slovak territory), trying to travel to Czechia and later on to Germany. With the Syrians and also Afghans (several of whom were returned from other EU countries under the Dublin convention), numbers of illegal stays started to grow rapidly – see Fig. 16 and Tab. 16 below.
When considering Ukrainians, the number of overstayers is still rising slowly.
Tab. Overview of third country na onals who entered the territory of the Schengen arealegally and stayed illegally in EU/SR (overstayers) ( – )
2014 1 half of 2015
Total Inland *** Total Inland ***
Ukraine 470 142 328 Ukraine 303 84 219Serbia 28 28 — Serbia 17 17 —Russia 26 17 9 Israel 16 16 —China 19 19 — Russia 14 12 2Libya 17 17 — Macedonia 11 11 —Korean Republic 14 14 — Viet Nam 9 9 —USA 13 13 — USA 8 8 —Viet Nam 12 12 — China 7 7 —Belarus 7 4 3 Libya 5 5 —
NB: *** at the BCP at exit from the SR; BCP – border crossing point; SR – Slovak RepublicSource: Bureau of Border and Alien Police of the Slovak Republic (2015)
SLOVAKIA 109
July–September 2015
Total Inland ***
Syria 407 407 0Ukraine 223 32 191Afghanistan 178 178 0Iraq 81 80 1Pakistan 46 46 0Without iden fied na onality 27 27 0Serbia 18 18 0Bangladesh 13 13 0Iran 13 13 0
Fig. Illegal crossing of the state border of the Slovak Republic in (number of persons per month)
0
5
10
15
20
25
30
35
40
45
50
JAN FEB MAR APR MAY JUN JUL AUG SEP
Source: Bureau of Border and Alien Police of the Slovak Republic (2015)
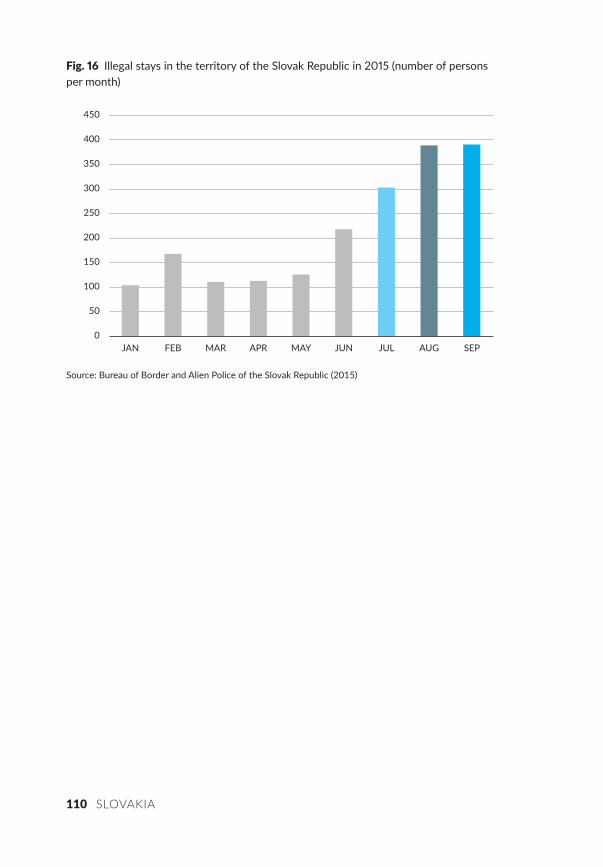
110 SLOVAKIA
Fig. Illegal stays in the territory of the Slovak Republic in (number of persons per month)
0
50
100
150
200
250
300
350
400
450
JAN FEB MAR APR MAY JUN JUL AUG SEP
Source: Bureau of Border and Alien Police of the Slovak Republic (2015)
SLOVAKIA 111
DECEMBER
Regular migra on
In 2014, more than 1.8 million passengers crossed the Slovak-Ukraine (SK-UA) Schengen border via border crossing points (BCPs). The crisis in Ukraine had only a very limited impact on the flow of persons – regular migration – via the SK-UA border. The number of persons crossing the border fell by 126,000 in the period 2012–2014. The situation didn’t change in the first 9 months of 2015 and there was even a slight increase in the number of travellers in the summer months of the year. In total, 1.36 million passengers crossed the SK-UA border during January–September 2015 (see Tab. 17).
Most of the persons and vehicles cross the border via BCP in Vyšné Nemecké (see Tab. 18).
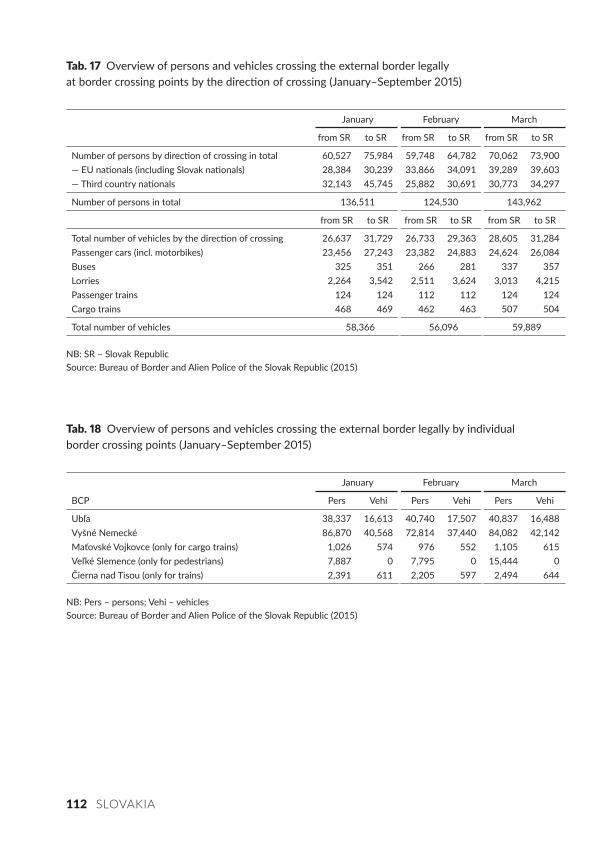
112 SLOVAKIA
Tab. Overview of persons and vehicles crossing the external border legallyat border crossing points by the direc on of crossing (January–September )
January February March
from SR to SR from SR to SR from SR to SR
Number of persons by direc on of crossing in total 60,527 75,984 59,748 64,782 70,062 73,900— EU na onals (including Slovak na onals) 28,384 30,239 33,866 34,091 39,289 39,603— Third country na onals 32,143 45,745 25,882 30,691 30,773 34,297
Number of persons in total 136,511 124,530 143,962
from SR to SR from SR to SR from SR to SR
Total number of vehicles by the direc on of crossing 26,637 31,729 26,733 29,363 28,605 31,284Passenger cars (incl. motorbikes) 23,456 27,243 23,382 24,883 24,624 26,084Buses 325 351 266 281 337 357Lorries 2,264 3,542 2,511 3,624 3,013 4,215Passenger trains 124 124 112 112 124 124Cargo trains 468 469 462 463 507 504
Total number of vehicles 58,366 56,096 59,889
NB: SR – Slovak RepublicSource: Bureau of Border and Alien Police of the Slovak Republic (2015)
Tab. Overview of persons and vehicles crossing the external border legally by individualborder crossing points (January–September )
January February March
BCP Pers Vehi Pers Vehi Pers Vehi
Ubľa 38,337 16,613 40,740 17,507 40,837 16,488Vyšné Nemecké 86,870 40,568 72,814 37,440 84,082 42,142Maťovské Vojkovce (only for cargo trains) 1,026 574 976 552 1,105 615Veľké Slemence (only for pedestrians) 7,887 0 7,795 0 15,444 0Čierna nad Tisou (only for trains) 2,391 611 2,205 597 2,494 644
NB: Pers – persons; Vehi – vehiclesSource: Bureau of Border and Alien Police of the Slovak Republic (2015)
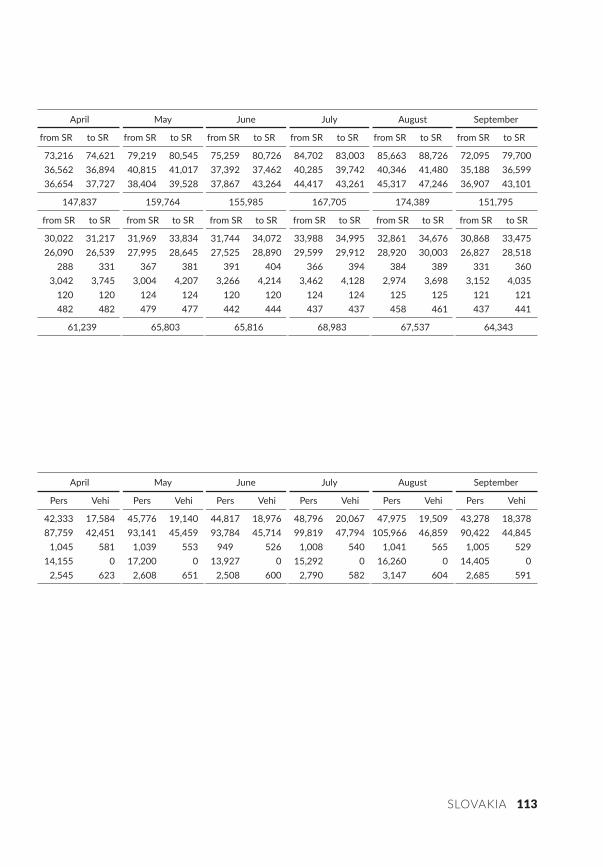
SLOVAKIA 113
April May June July August September
from SR to SR from SR to SR from SR to SR from SR to SR from SR to SR from SR to SR
73,216 74,621 79,219 80,545 75,259 80,726 84,702 83,003 85,663 88,726 72,095 79,70036,562 36,894 40,815 41,017 37,392 37,462 40,285 39,742 40,346 41,480 35,188 36,59936,654 37,727 38,404 39,528 37,867 43,264 44,417 43,261 45,317 47,246 36,907 43,101
147,837 159,764 155,985 167,705 174,389 151,795
from SR to SR from SR to SR from SR to SR from SR to SR from SR to SR from SR to SR
30,022 31,217 31,969 33,834 31,744 34,072 33,988 34,995 32,861 34,676 30,868 33,47526,090 26,539 27,995 28,645 27,525 28,890 29,599 29,912 28,920 30,003 26,827 28,518 288 331 367 381 391 404 366 394 384 389 331 360 3,042 3,745 3,004 4,207 3,266 4,214 3,462 4,128 2,974 3,698 3,152 4,035 120 120 124 124 120 120 124 124 125 125 121 121 482 482 479 477 442 444 437 437 458 461 437 441
61,239 65,803 65,816 68,983 67,537 64,343
April May June July August September
Pers Vehi Pers Vehi Pers Vehi Pers Vehi Pers Vehi Pers Vehi
42,333 17,584 45,776 19,140 44,817 18,976 48,796 20,067 47,975 19,509 43,278 18,37887,759 42,451 93,141 45,459 93,784 45,714 99,819 47,794 105,966 46,859 90,422 44,845 1,045 581 1,039 553 949 526 1,008 540 1,041 565 1,005 52914,155 0 17,200 0 13,927 0 15,292 0 16,260 0 14,405 0 2,545 623 2,608 651 2,508 600 2,790 582 3,147 604 2,685 591
114 SLOVAKIA
JANUARY
Decisions on Expulsion
This monthly report contains information on how many foreigners were issued with a decision on expulsion from Slovakia in 2013, 2014 and 2015, regardless of when they were detained. The statistics provided include irregular migrants – foreigners to whom the decision on administrative or judicial expulsion (AR, JR) was issued for reasons related to illegal migration (illegal state border crossing and illegal stay), focusing on the top nationalities and Ukrainian citizens. It also includes statistics related to other cases, e.g. foreigners who have been issued decisions on administrative or judicial expulsion for reasons which do not relate to illegal migration (breach of or failure to fulfil general legal conditions with no connections to illegal migration). The nationality of each foreigner in the table below is that one he/she reported during the expulsion procedure on Slovak territory.
Two main outputs are evident from the statistics in the last 3 years: Ukrainians domi-nate the numbers of migrants to whom a decision on expulsion was issued; and secondly that the number of Ukrainians is growing rapidly, almost tripling within these 3 years (see Tab. 20).
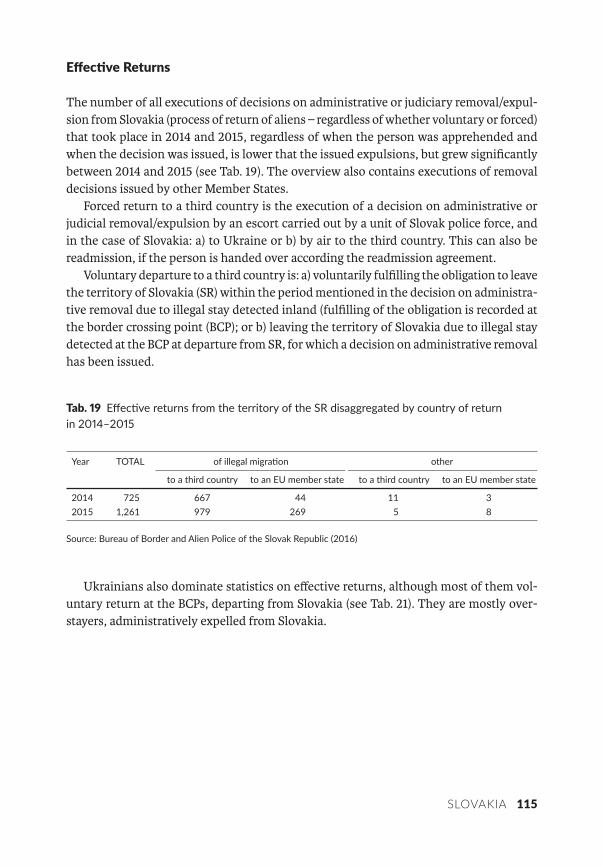
SLOVAKIA 115
Effec ve Returns
The number of all executions of decisions on administrative or judiciary removal/expul-sion from Slovakia (process of return of aliens – regardless of whether voluntary or forced) that took place in 2014 and 2015, regardless of when the person was apprehended and when the decision was issued, is lower that the issued expulsions, but grew significantly between 2014 and 2015 (see Tab. 19). The overview also contains executions of removal decisions issued by other Member States.
Forced return to a third country is the execution of a decision on administrative or judicial removal/expulsion by an escort carried out by a unit of Slovak police force, and in the case of Slovakia: a) to Ukraine or b) by air to the third country. This can also be readmission, if the person is handed over according the readmission agreement.
Voluntary departure to a third country is: a) voluntarily fulfilling the obligation to leave the territory of Slovakia (SR) within the period mentioned in the decision on administra-tive removal due to illegal stay detected inland (fulfilling of the obligation is recorded at the border crossing point (BCP); or b) leaving the territory of Slovakia due to illegal stay detected at the BCP at departure from SR, for which a decision on administrative removal has been issued.
Tab. Effec ve returns from the territory of the SR disaggregated by country of return in –
Year TOTAL of illegal migra on other
to a third country to an EU member state to a third country to an EU member state
2014 725 667 44 11 32015 1,261 979 269 5 8
Source: Bureau of Border and Alien Police of the Slovak Republic (2016)
Ukrainians also dominate statistics on effective returns, although most of them vol-untary return at the BCPs, departing from Slovakia (see Tab. 21). They are mostly over-stayers, administratively expelled from Slovakia.
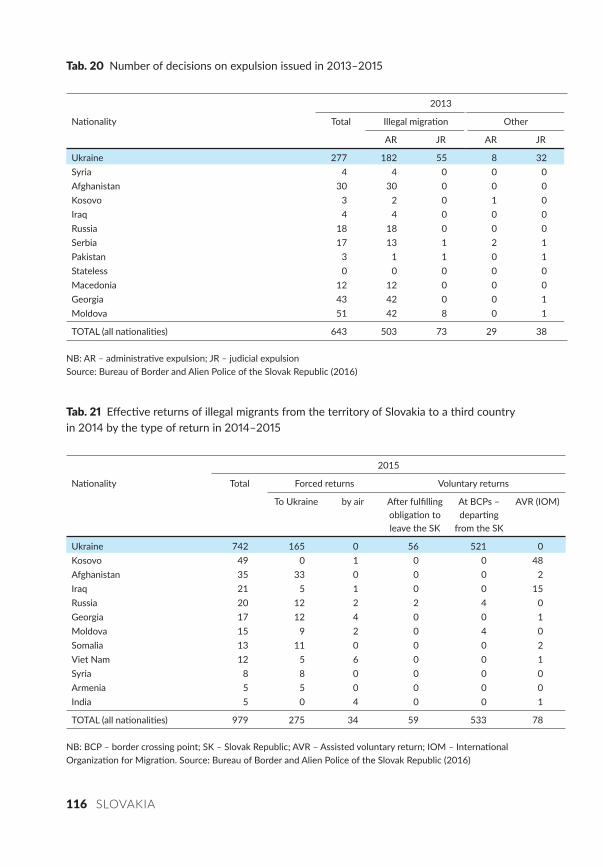
116 SLOVAKIA
Tab. Effec ve returns of illegal migrants from the territory of Slovakia to a third countryin by the type of return in –
2015
Na onality Total Forced returns Voluntary returns
To Ukraine by air A er fulfilling obliga on to leave the SK
At BCPs – depar ng
from the SK
AVR (IOM)
Ukraine 742 165 0 56 521 0Kosovo 49 0 1 0 0 48Afghanistan 35 33 0 0 0 2Iraq 21 5 1 0 0 15Russia 20 12 2 2 4 0Georgia 17 12 4 0 0 1Moldova 15 9 2 0 4 0Somalia 13 11 0 0 0 2Viet Nam 12 5 6 0 0 1Syria 8 8 0 0 0 0Armenia 5 5 0 0 0 0India 5 0 4 0 0 1
TOTAL (all na onali es) 979 275 34 59 533 78
NB: BCP – border crossing point; SK – Slovak Republic; AVR – Assisted voluntary return; IOM – Interna onalOrganiza on for Migra on. Source: Bureau of Border and Alien Police of the Slovak Republic (2016)
Tab. Number of decisions on expulsion issued in –
2013
Na onality Total Illegal migra on Other
AR JR AR JR
Ukraine 277 182 55 8 32Syria 4 4 0 0 0Afghanistan 30 30 0 0 0Kosovo 3 2 0 1 0Iraq 4 4 0 0 0Russia 18 18 0 0 0Serbia 17 13 1 2 1Pakistan 3 1 1 0 1Stateless 0 0 0 0 0Macedonia 12 12 0 0 0Georgia 43 42 0 0 1Moldova 51 42 8 0 1
TOTAL (all na onali es) 643 503 73 29 38
NB: AR – administra ve expulsion; JR – judicial expulsionSource: Bureau of Border and Alien Police of the Slovak Republic (2016)
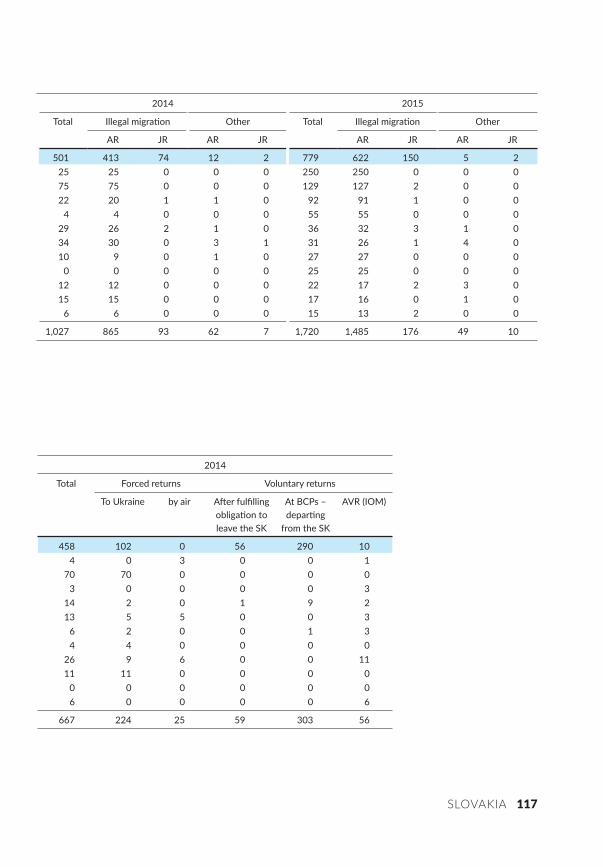
SLOVAKIA 117
2014
Total Forced returns Voluntary returns
To Ukraine by air A er fulfilling obliga on to leave the SK
At BCPs – depar ng
from the SK
AVR (IOM)
458 102 0 56 290 104 0 3 0 0 1
70 70 0 0 0 03 0 0 0 0 3
14 2 0 1 9 213 5 5 0 0 3
6 2 0 0 1 34 4 0 0 0 0
26 9 6 0 0 1111 11 0 0 0 0
0 0 0 0 0 06 0 0 0 0 6
667 224 25 59 303 56
2014 2015
Total Illegal migra on Other Total Illegal migra on Other
AR JR AR JR AR JR AR JR
501 413 74 12 2 779 622 150 5 225 25 0 0 0 250 250 0 0 075 75 0 0 0 129 127 2 0 022 20 1 1 0 92 91 1 0 0
4 4 0 0 0 55 55 0 0 029 26 2 1 0 36 32 3 1 034 30 0 3 1 31 26 1 4 010 9 0 1 0 27 27 0 0 0
0 0 0 0 0 25 25 0 0 012 12 0 0 0 22 17 2 3 015 15 0 0 0 17 16 0 1 0
6 6 0 0 0 15 13 2 0 0
1,027 865 93 62 7 1,720 1,485 176 49 10
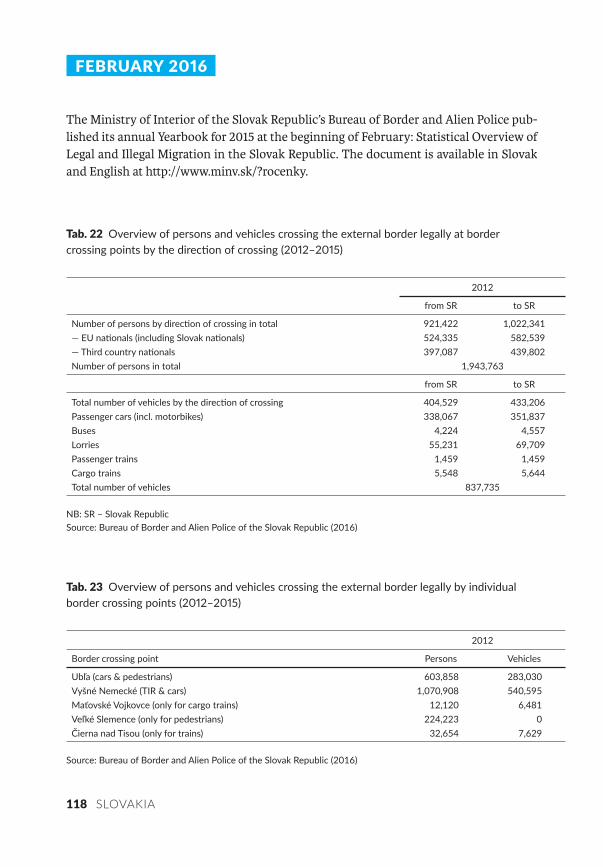
118 SLOVAKIA
FEBRUARY
The Ministry of Interior of the Slovak Republic’s Bureau of Border and Alien Police pub-lished its annual Yearbook for 2015 at the beginning of February: Statistical Overview of Legal and Illegal Migration in the Slovak Republic. The document is available in Slovak and English at h�p://www.minv.sk/?rocenky.
Tab. Overview of persons and vehicles crossing the external border legally at bordercrossing points by the direc on of crossing ( – )
2012
from SR to SR
Number of persons by direc on of crossing in total 921,422 1,022,341— EU na onals (including Slovak na onals) 524,335 582,539— Third country na onals 397,087 439,802Number of persons in total 1,943,763
from SR to SR
Total number of vehicles by the direc on of crossing 404,529 433,206Passenger cars (incl. motorbikes) 338,067 351,837Buses 4,224 4,557Lorries 55,231 69,709Passenger trains 1,459 1,459Cargo trains 5,548 5,644Total number of vehicles 837,735
NB: SR – Slovak Republic Source: Bureau of Border and Alien Police of the Slovak Republic (2016)
Tab. Overview of persons and vehicles crossing the external border legally by individualborder crossing points ( – )
2012
Border crossing point Persons Vehicles
Ubľa (cars & pedestrians) 603,858 283,030Vyšné Nemecké (TIR & cars) 1,070,908 540,595Maťovské Vojkovce (only for cargo trains) 12,120 6,481Veľké Slemence (only for pedestrians) 224,223 0Čierna nad Tisou (only for trains) 32,654 7,629
Source: Bureau of Border and Alien Police of the Slovak Republic (2016)
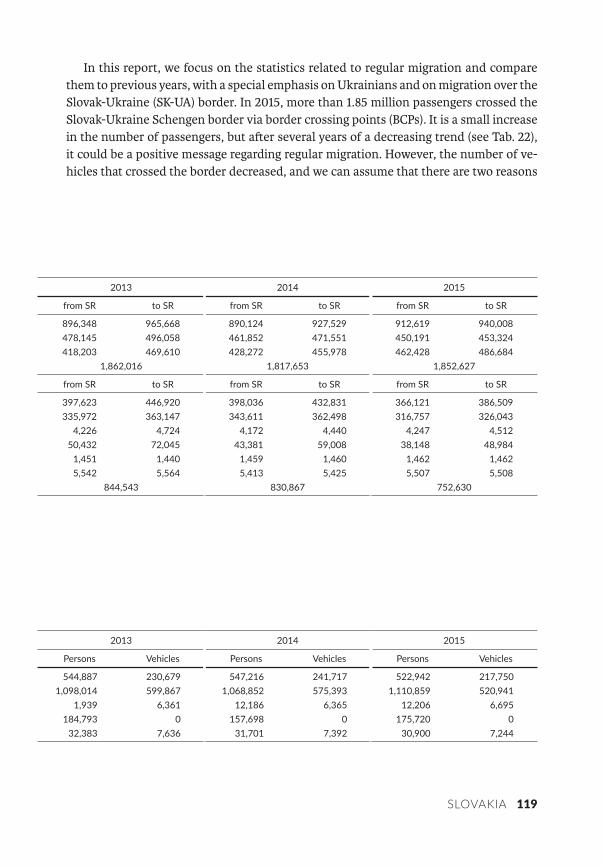
SLOVAKIA 119
In this report, we focus on the statistics related to regular migration and compare them to previous years, with a special emphasis on Ukrainians and on migration over the Slovak-Ukraine (SK-UA) border. In 2015, more than 1.85 million passengers crossed the Slovak-Ukraine Schengen border via border crossing points (BCPs). It is a small increase in the number of passengers, but aer several years of a decreasing trend (see Tab. 22), it could be a positive message regarding regular migration. However, the number of ve-hicles that crossed the border decreased, and we can assume that there are two reasons
2013 2014 2015
from SR to SR from SR to SR from SR to SR
896,348 965,668 890,124 927,529 912,619 940,008478,145 496,058 461,852 471,551 450,191 453,324418,203 469,610 428,272 455,978 462,428 486,684
1,862,016 1,817,653 1,852,627
from SR to SR from SR to SR from SR to SR
397,623 446,920 398,036 432,831 366,121 386,509335,972 363,147 343,611 362,498 316,757 326,043 4,226 4,724 4,172 4,440 4,247 4,512 50,432 72,045 43,381 59,008 38,148 48,984 1,451 1,440 1,459 1,460 1,462 1,462 5,542 5,564 5,413 5,425 5,507 5,508
844,543 830,867 752,630
2013 2014 2015
Persons Vehicles Persons Vehicles Persons Vehicles
544,887 230,679 547,216 241,717 522,942 217,7501,098,014 599,867 1,068,852 575,393 1,110,859 520,941
1,939 6,361 12,186 6,365 12,206 6,695184,793 0 157,698 0 175,720 0
32,383 7,636 31,701 7,392 30,900 7,244
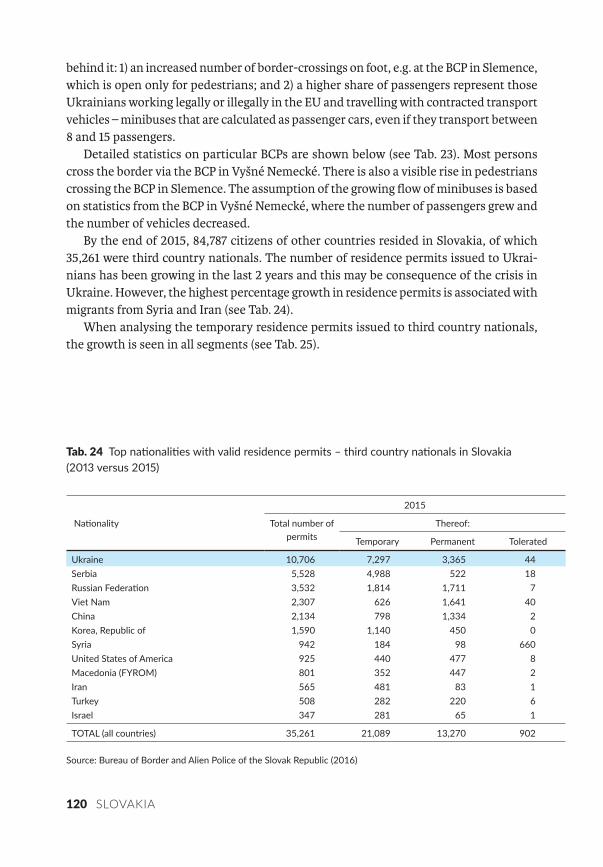
120 SLOVAKIA
behind it: 1) an increased number of border-crossings on foot, e.g. at the BCP in Slemence, which is open only for pedestrians; and 2) a higher share of passengers represent those Ukrainians working legally or illegally in the EU and travelling with contracted transport vehicles – minibuses that are calculated as passenger cars, even if they transport between 8 and 15 passengers.
Detailed statistics on particular BCPs are shown below (see Tab. 23). Most persons cross the border via the BCP in Vyšné Nemecké. There is also a visible rise in pedestrians crossing the BCP in Slemence. The assumption of the growing flow of minibuses is based on statistics from the BCP in Vyšné Nemecké, where the number of passengers grew and the number of vehicles decreased.
By the end of 2015, 84,787 citizens of other countries resided in Slovakia, of which 35,261 were third country nationals. The number of residence permits issued to Ukrai-nians has been growing in the last 2 years and this may be consequence of the crisis in Ukraine. However, the highest percentage growth in residence permits is associated with migrants from Syria and Iran (see Tab. 24).
When analysing the temporary residence permits issued to third country nationals, the growth is seen in all segments (see Tab. 25).
Tab. Top na onali es with valid residence permits – third country na onals in Slovakia( versus )
2015
Na onality Total number of permits
Thereof:
Temporary Permanent Tolerated
Ukraine 10,706 7,297 3,365 44Serbia 5,528 4,988 522 18Russian Federa on 3,532 1,814 1,711 7Viet Nam 2,307 626 1,641 40China 2,134 798 1,334 2Korea, Republic of 1,590 1,140 450 0Syria 942 184 98 660United States of America 925 440 477 8Macedonia (FYROM) 801 352 447 2Iran 565 481 83 1Turkey 508 282 220 6Israel 347 281 65 1
TOTAL (all countries) 35,261 21,089 13,270 902
Source: Bureau of Border and Alien Police of the Slovak Republic (2016)
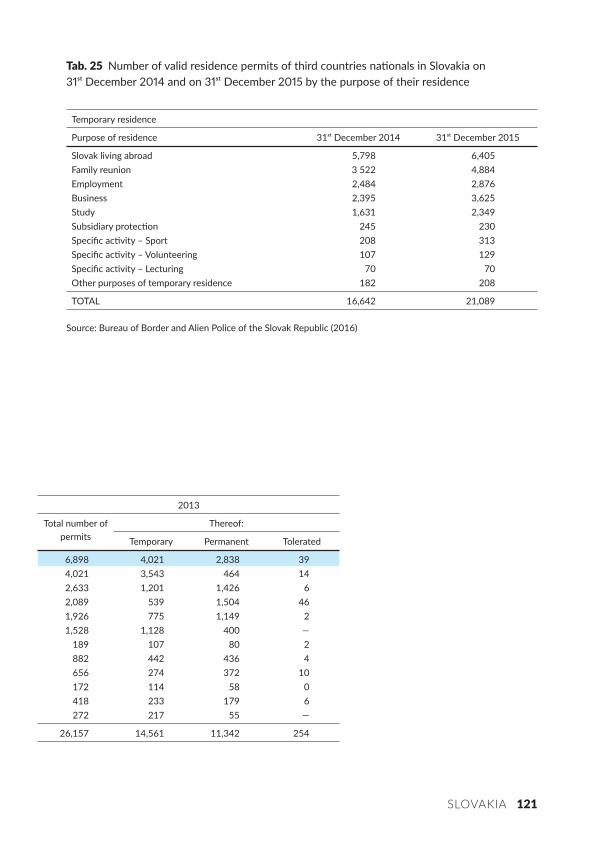
SLOVAKIA 121
2013
Total number of permits
Thereof:
Temporary Permanent Tolerated
6,898 4,021 2,838 394,021 3,543 464 142,633 1,201 1,426 62,089 539 1,504 461,926 775 1,149 21,528 1,128 400 —
189 107 80 2882 442 436 4656 274 372 10172 114 58 0418 233 179 6272 217 55 —
26,157 14,561 11,342 254
Tab. Number of valid residence permits of third countries na onals in Slovakia on December and on December by the purpose of their residence
Temporary residence
Purpose of residence 31 December 2014 31 December 2015
Slovak living abroad 5,798 6,405Family reunion 3 522 4,884Employment 2,484 2,876Business 2,395 3,625Study 1,631 2,349Subsidiary protec on 245 230Specific ac vity – Sport 208 313Specific ac vity – Volunteering 107 129Specific ac vity – Lecturing 70 70Other purposes of temporary residence 182 208
TOTAL 16,642 21,089
Source: Bureau of Border and Alien Police of the Slovak Republic (2016)
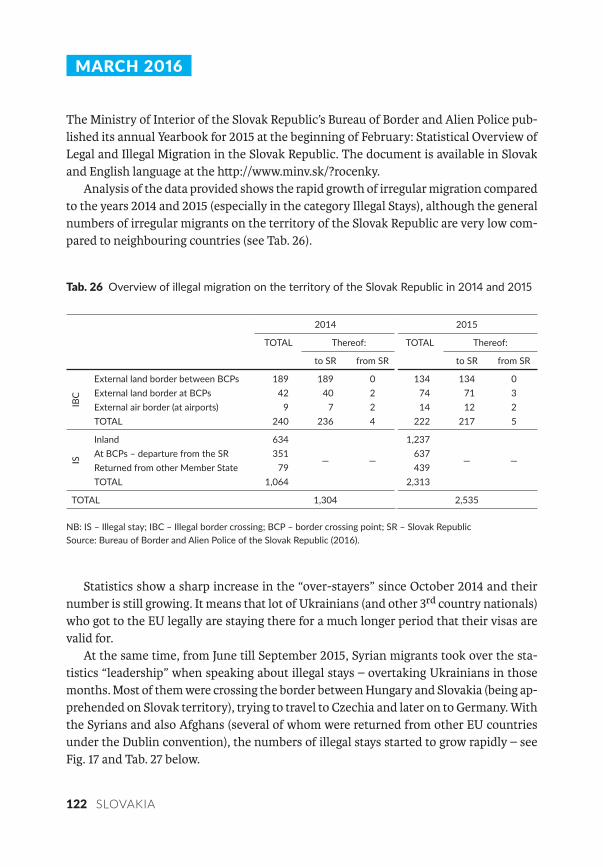
122 SLOVAKIA
MARCH
The Ministry of Interior of the Slovak Republic’s Bureau of Border and Alien Police pub-lished its annual Yearbook for 2015 at the beginning of February: Statistical Overview of Legal and Illegal Migration in the Slovak Republic. The document is available in Slovak and English language at the h�p://www.minv.sk/?rocenky.
Analysis of the data provided shows the rapid growth of irregular migration compared to the years 2014 and 2015 (especially in the category Illegal Stays), although the general numbers of irregular migrants on the territory of the Slovak Republic are very low com-pared to neighbouring countries (see Tab. 26).
Tab. Overview of illegal migra on on the territory of the Slovak Republic in and
2014 2015
TOTAL Thereof: TOTAL Thereof:
to SR from SR to SR from SR
IBC
External land border between BCPs 189 189 0 134 134 0External land border at BCPs 42 40 2 74 71 3External air border (at airports) 9 7 2 14 12 2TOTAL 240 236 4 222 217 5
IS
Inland 634
— —
1,237
— —At BCPs – departure from the SR 351 637Returned from other Member State 79 439TOTAL 1,064 2,313
TOTAL 1,304 2,535
NB: IS – Illegal stay; IBC – Illegal border crossing; BCP – border crossing point; SR – Slovak RepublicSource: Bureau of Border and Alien Police of the Slovak Republic (2016).
Statistics show a sharp increase in the “over-stayers” since October 2014 and their number is still growing. It means that lot of Ukrainians (and other 3rd country nationals) who got to the EU legally are staying there for a much longer period that their visas are valid for.
At the same time, from June till September 2015, Syrian migrants took over the sta-tistics “leadership” when speaking about illegal stays – overtaking Ukrainians in those months. Most of them were crossing the border between Hungary and Slovakia (being ap-prehended on Slovak territory), trying to travel to Czechia and later on to Germany. With the Syrians and also Afghans (several of whom were returned from other EU countries under the Dublin convention), the numbers of illegal stays started to grow rapidly – see Fig. 17 and Tab. 27 below.
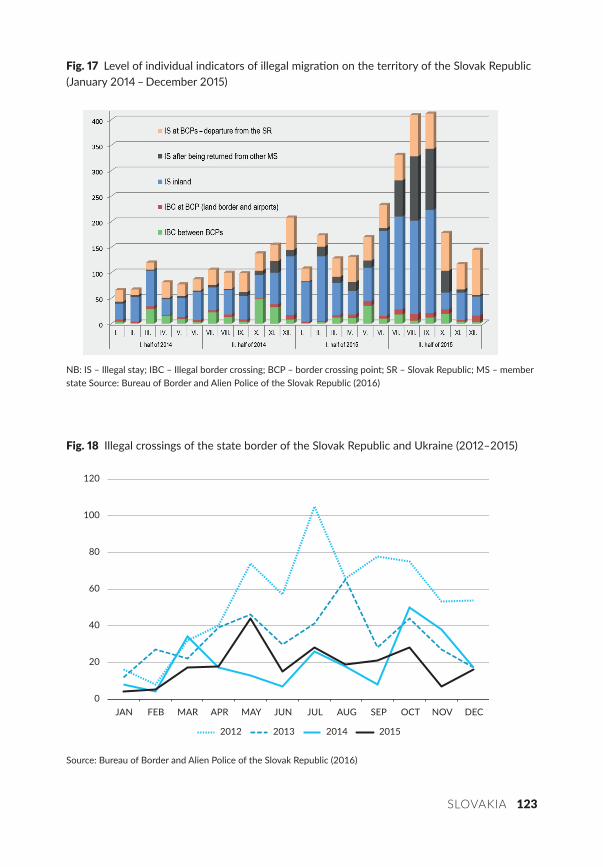
SLOVAKIA 123
Fig. Level of individual indicators of illegal migra on on the territory of the Slovak Republic (January – December )
NB: IS – Illegal stay; IBC – Illegal border crossing; BCP – border crossing point; SR – Slovak Republic; MS – member state Source: Bureau of Border and Alien Police of the Slovak Republic (2016)
Fig. Illegal crossings of the state border of the Slovak Republic and Ukraine ( – )
0
20
40
60
80
100
120
JAN FEB MAR APR MAY JUN JUL AUG SEP OCT NOV DEC
2012 2013 2014 2015
Source: Bureau of Border and Alien Police of the Slovak Republic (2016)
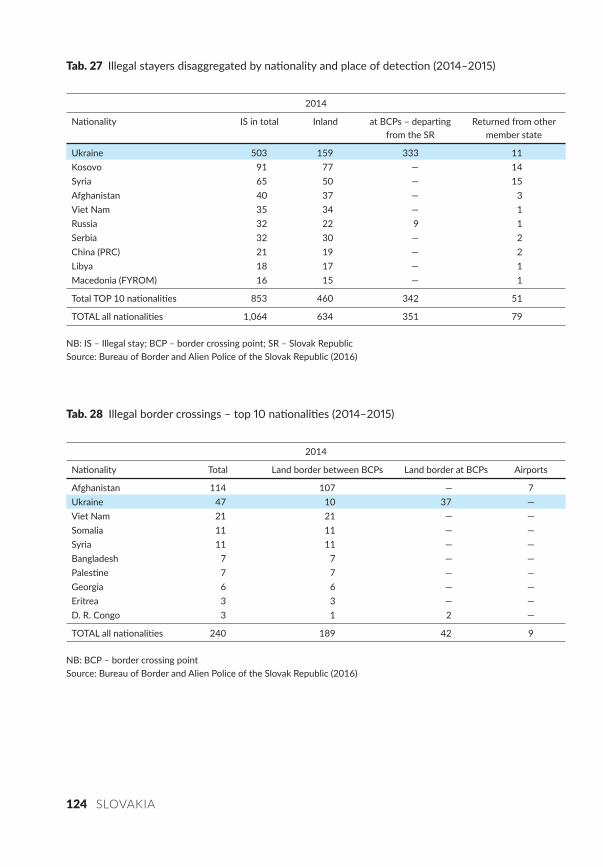
124 SLOVAKIA
Tab. Illegal stayers disaggregated by na onality and place of detec on ( – )
2014
Na onality IS in total Inland at BCPs – depar ng from the SR
Returned from other member state
Ukraine 503 159 333 11Kosovo 91 77 — 14Syria 65 50 — 15Afghanistan 40 37 — 3Viet Nam 35 34 — 1Russia 32 22 9 1Serbia 32 30 — 2China (PRC) 21 19 — 2Libya 18 17 — 1Macedonia (FYROM) 16 15 — 1
Total TOP 10 na onali es 853 460 342 51
TOTAL all na onali es 1,064 634 351 79
NB: IS – Illegal stay; BCP – border crossing point; SR – Slovak RepublicSource: Bureau of Border and Alien Police of the Slovak Republic (2016)
Tab. Illegal border crossings – top na onali es ( – )
2014
Na onality Total Land border between BCPs Land border at BCPs Airports
Afghanistan 114 107 — 7Ukraine 47 10 37 —Viet Nam 21 21 — —Somalia 11 11 — —Syria 11 11 — —Bangladesh 7 7 — —Pales ne 7 7 — —Georgia 6 6 — —Eritrea 3 3 — —D. R. Congo 3 1 2 —
TOTAL all na onali es 240 189 42 9
NB: BCP – border crossing point Source: Bureau of Border and Alien Police of the Slovak Republic (2016)
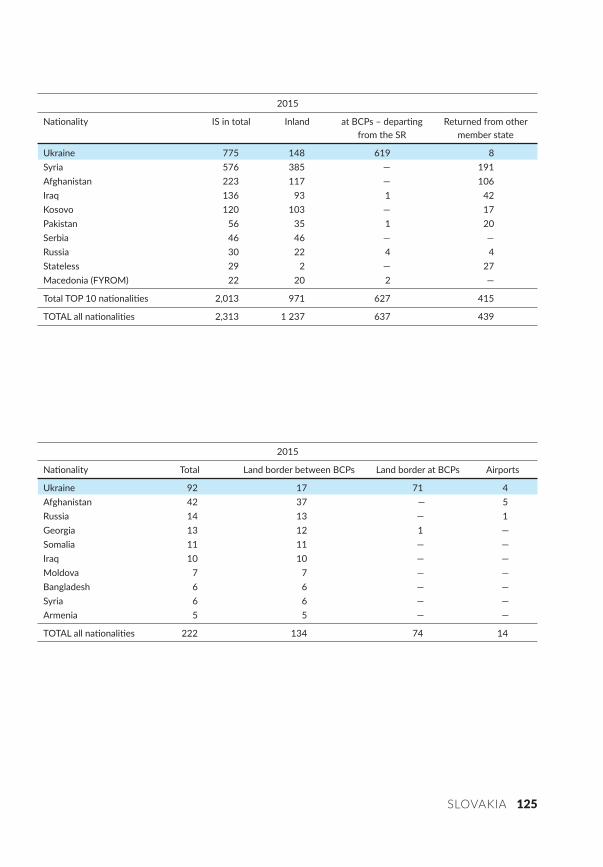
SLOVAKIA 125
2015
Na onality IS in total Inland at BCPs – depar ng from the SR
Returned from other member state
Ukraine 775 148 619 8Syria 576 385 — 191Afghanistan 223 117 — 106Iraq 136 93 1 42Kosovo 120 103 — 17Pakistan 56 35 1 20Serbia 46 46 — —Russia 30 22 4 4Stateless 29 2 — 27Macedonia (FYROM) 22 20 2 —
Total TOP 10 na onali es 2,013 971 627 415
TOTAL all na onali es 2,313 1 237 637 439
2015
Na onality Total Land border between BCPs Land border at BCPs Airports
Ukraine 92 17 71 4Afghanistan 42 37 — 5Russia 14 13 — 1Georgia 13 12 1 —Somalia 11 11 — —Iraq 10 10 — —Moldova 7 7 — —Bangladesh 6 6 — —Syria 6 6 — —Armenia 5 5 — —
TOTAL all na onali es 222 134 74 14
126 SLOVAKIA
However, Ukrainians still dominate the statistics of irregular migration for 2015. The number of Ukrainians apprehended because of their illegal stay grew by 54% annually. Most of them were identified as illegal stayers at border crossing points (BCPs) – departing from Slovakia to Ukraine.
The number of illegal crossings of the state border of the Slovak Republic with Ukraine (joint Schengen border) has decreased from 240 to 222 cases in 2014–2015 (see Fig. 18), which is an indicator that the Slovak-Ukraine border is well protected and that organised groups are using other parts of the external land Schengen border.
However, Ukrainians (and Afghans) dominate the statistics of illegal border cross-ings. Most cases of illegal border crossings by Ukrainians are connected to counterfeit or forged travel documents, identified at the BCPs during the document control. Cases of counterfeit/forged visas or residence permits are very rare (only 5 cases in 2015 and 9 cases in 2014). The number of persons on whom an alert has been issued in the national registry for purposes of entry refusal is also rare: 3 cases in 2015, 2 cases in 2014. Most of the migrants apprehended at “the green border” (between the BCPs) are on foot without their own travel document (108 cases in 2015, 185 cases in 2014) (see Tab. 28).
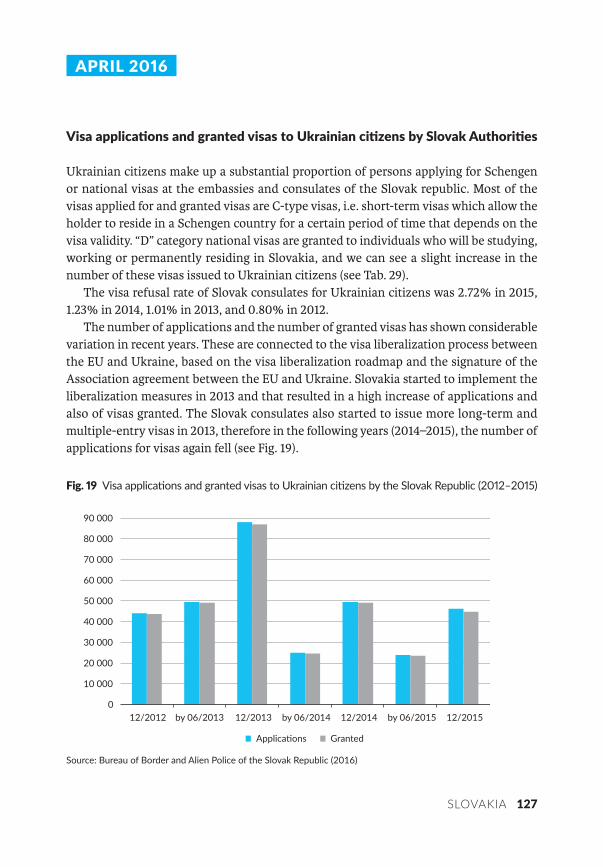
SLOVAKIA 127
APRIL
Visa applica ons and granted visas to Ukrainian ci zens by Slovak Authori es
Ukrainian citizens make up a substantial proportion of persons applying for Schengen or national visas at the embassies and consulates of the Slovak republic. Most of the visas applied for and granted visas are C-type visas, i.e. short-term visas which allow the holder to reside in a Schengen country for a certain period of time that depends on the visa validity. “D” category national visas are granted to individuals who will be studying, working or permanently residing in Slovakia, and we can see a slight increase in the number of these visas issued to Ukrainian citizens (see Tab. 29).
The visa refusal rate of Slovak consulates for Ukrainian citizens was 2.72% in 2015, 1.23% in 2014, 1.01% in 2013, and 0.80% in 2012.
The number of applications and the number of granted visas has shown considerable variation in recent years. These are connected to the visa liberalization process between the EU and Ukraine, based on the visa liberalization roadmap and the signature of the Association agreement between the EU and Ukraine. Slovakia started to implement the liberalization measures in 2013 and that resulted in a high increase of applications and also of visas granted. The Slovak consulates also started to issue more long-term and multiple-entry visas in 2013, therefore in the following years (2014–2015), the number of applications for visas again fell (see Fig. 19).
Fig. Visa applica ons and granted visas to Ukrainian ci zens by the Slovak Republic ( – )
0
10 000
20 000
30 000
40 000
50 000
60 000
70 000
80 000
90 000
12/2012 by 06/2013 12/2013 by 06/2014 12/2014 by 06/2015 12/2015
Source: Bureau of Border and Alien Police of the Slovak Republic (2016)
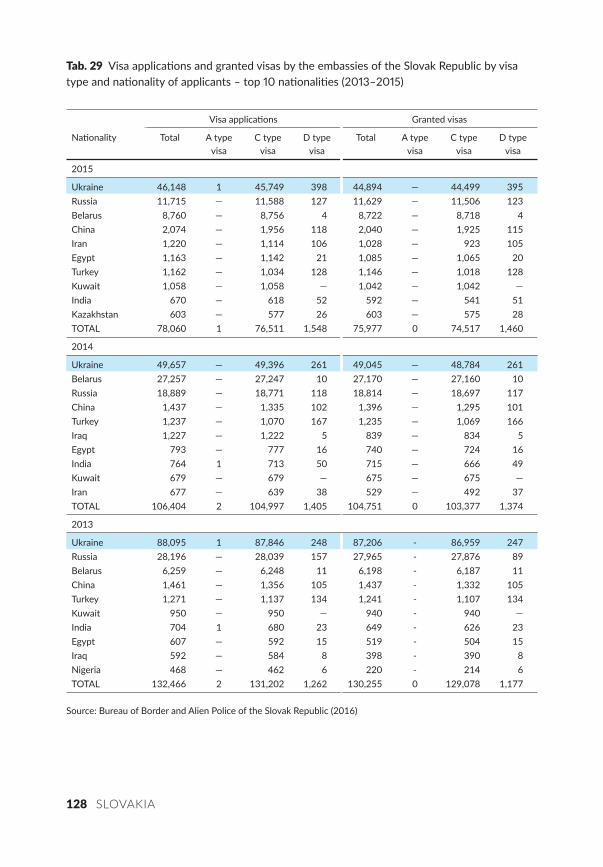
128 SLOVAKIA
Tab. Visa applica ons and granted visas by the embassies of the Slovak Republic by visa type and na onality of applicants – top na onali es ( – )
Visa applica ons Granted visas
Na onality Total A type visa
C type visa
D type visa
Total A type visa
C type visa
D type visa
2015
Ukraine 46,148 1 45,749 398 44,894 — 44,499 395Russia 11,715 — 11,588 127 11,629 — 11,506 123Belarus 8,760 — 8,756 4 8,722 — 8,718 4China 2,074 — 1,956 118 2,040 — 1,925 115Iran 1,220 — 1,114 106 1,028 — 923 105Egypt 1,163 — 1,142 21 1,085 — 1,065 20Turkey 1,162 — 1,034 128 1,146 — 1,018 128Kuwait 1,058 — 1,058 — 1,042 — 1,042 —India 670 — 618 52 592 — 541 51Kazakhstan 603 — 577 26 603 — 575 28TOTAL 78,060 1 76,511 1,548 75,977 0 74,517 1,460
2014
Ukraine 49,657 — 49,396 261 49,045 — 48,784 261Belarus 27,257 — 27,247 10 27,170 — 27,160 10Russia 18,889 — 18,771 118 18,814 — 18,697 117China 1,437 — 1,335 102 1,396 — 1,295 101Turkey 1,237 — 1,070 167 1,235 — 1,069 166Iraq 1,227 — 1,222 5 839 — 834 5Egypt 793 — 777 16 740 — 724 16India 764 1 713 50 715 — 666 49Kuwait 679 — 679 — 675 — 675 —Iran 677 — 639 38 529 — 492 37TOTAL 106,404 2 104,997 1,405 104,751 0 103,377 1,374
2013
Ukraine 88,095 1 87,846 248 87,206 - 86,959 247Russia 28,196 — 28,039 157 27,965 - 27,876 89Belarus 6,259 — 6,248 11 6,198 - 6,187 11China 1,461 — 1,356 105 1,437 - 1,332 105Turkey 1,271 — 1,137 134 1,241 - 1,107 134Kuwait 950 — 950 — 940 - 940 —India 704 1 680 23 649 - 626 23Egypt 607 — 592 15 519 - 504 15Iraq 592 — 584 8 398 - 390 8Nigeria 468 — 462 6 220 - 214 6TOTAL 132,466 2 131,202 1,262 130,255 0 129,078 1,177
Source: Bureau of Border and Alien Police of the Slovak Republic (2016)
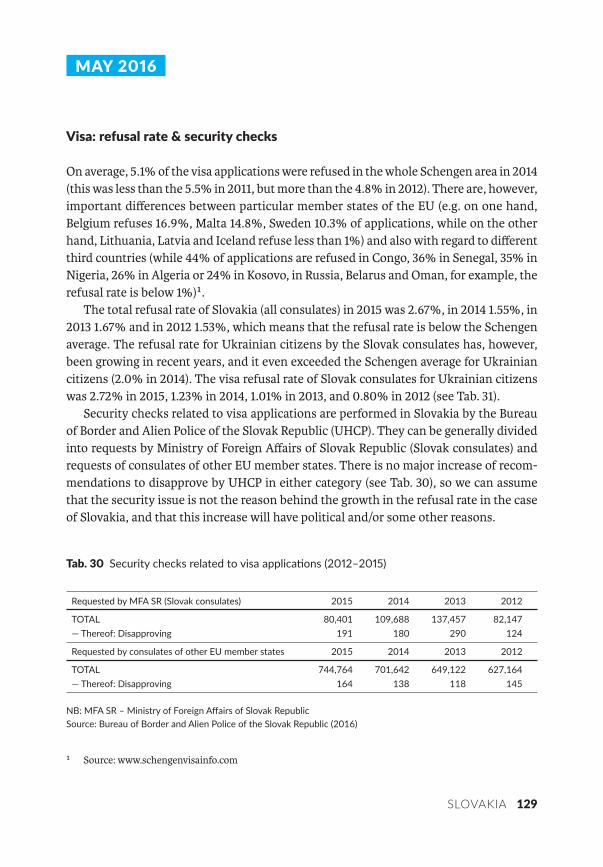
SLOVAKIA 129
MAY
Visa: refusal rate & security checks
On average, 5.1% of the visa applications were refused in the whole Schengen area in 2014 (this was less than the 5.5% in 2011, but more than the 4.8% in 2012). There are, however, important differences between particular member states of the EU (e.g. on one hand, Belgium refuses 16.9%, Malta 14.8%, Sweden 10.3% of applications, while on the other hand, Lithuania, Latvia and Iceland refuse less than 1%) and also with regard to different third countries (while 44% of applications are refused in Congo, 36% in Senegal, 35% in Nigeria, 26% in Algeria or 24% in Kosovo, in Russia, Belarus and Oman, for example, the refusal rate is below 1%)¹.
The total refusal rate of Slovakia (all consulates) in 2015 was 2.67%, in 2014 1.55%, in 2013 1.67% and in 2012 1.53%, which means that the refusal rate is below the Schengen average. The refusal rate for Ukrainian citizens by the Slovak consulates has, however, been growing in recent years, and it even exceeded the Schengen average for Ukrainian citizens (2.0% in 2014). The visa refusal rate of Slovak consulates for Ukrainian citizens was 2.72% in 2015, 1.23% in 2014, 1.01% in 2013, and 0.80% in 2012 (see Tab. 31).
Security checks related to visa applications are performed in Slovakia by the Bureau of Border and Alien Police of the Slovak Republic (UHCP). They can be generally divided into requests by Ministry of Foreign Affairs of Slovak Republic (Slovak consulates) and requests of consulates of other EU member states. There is no major increase of recom-mendations to disapprove by UHCP in either category (see Tab. 30), so we can assume that the security issue is not the reason behind the growth in the refusal rate in the case of Slovakia, and that this increase will have political and/or some other reasons.
Tab. Security checks related to visa applica ons ( – )
Requested by MFA SR (Slovak consulates) 2015 2014 2013 2012
TOTAL 80,401 109,688 137,457 82,147— Thereof: Disapproving 191 180 290 124
Requested by consulates of other EU member states 2015 2014 2013 2012
TOTAL 744,764 701,642 649,122 627,164— Thereof: Disapproving 164 138 118 145
NB: MFA SR – Ministry of Foreign Affairs of Slovak RepublicSource: Bureau of Border and Alien Police of the Slovak Republic (2016)
¹ Source: www.schengenvisainfo.com
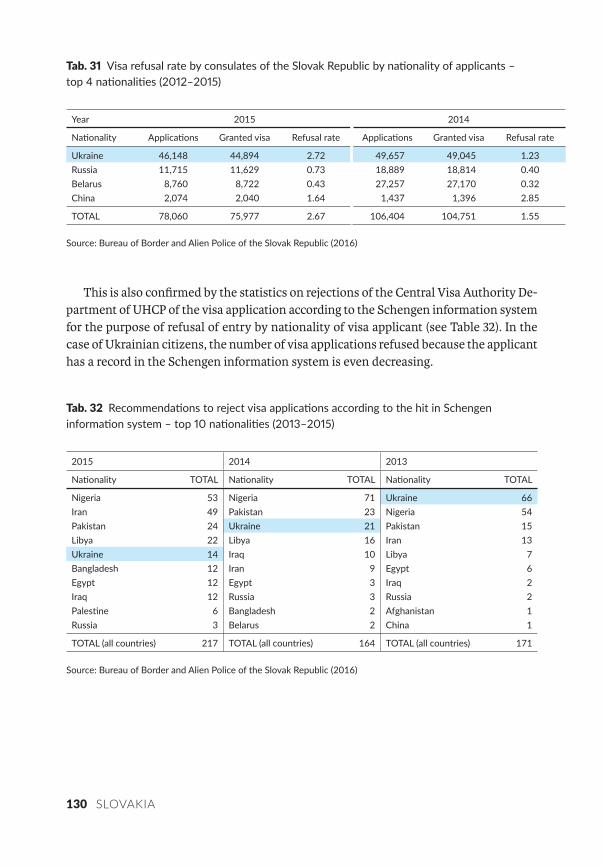
130 SLOVAKIA
This is also confirmed by the statistics on rejections of the Central Visa Authority De-partment of UHCP of the visa application according to the Schengen information system for the purpose of refusal of entry by nationality of visa applicant (see Table 32). In the case of Ukrainian citizens, the number of visa applications refused because the applicant has a record in the Schengen information system is even decreasing.
Tab. Recommenda ons to reject visa applica ons according to the hit in Schengen informa on system – top na onali es ( – )
2015 2014 2013
Na onality TOTAL Na onality TOTAL Na onality TOTAL
Nigeria 53 Nigeria 71 Ukraine 66Iran 49 Pakistan 23 Nigeria 54Pakistan 24 Ukraine 21 Pakistan 15Libya 22 Libya 16 Iran 13Ukraine 14 Iraq 10 Libya 7Bangladesh 12 Iran 9 Egypt 6Egypt 12 Egypt 3 Iraq 2Iraq 12 Russia 3 Russia 2Pales ne 6 Bangladesh 2 Afghanistan 1Russia 3 Belarus 2 China 1
TOTAL (all countries) 217 TOTAL (all countries) 164 TOTAL (all countries) 171
Source: Bureau of Border and Alien Police of the Slovak Republic (2016)
Tab. Visa refusal rate by consulates of the Slovak Republic by na onality of applicants –top na onali es ( – )
Year 2015 2014
Na onality Applica ons Granted visa Refusal rate Applica ons Granted visa Refusal rate
Ukraine 46,148 44,894 2.72 49,657 49,045 1.23Russia 11,715 11,629 0.73 18,889 18,814 0.40Belarus 8,760 8,722 0.43 27,257 27,170 0.32China 2,074 2,040 1.64 1,437 1,396 2.85
TOTAL 78,060 75,977 2.67 106,404 104,751 1.55
Source: Bureau of Border and Alien Police of the Slovak Republic (2016)
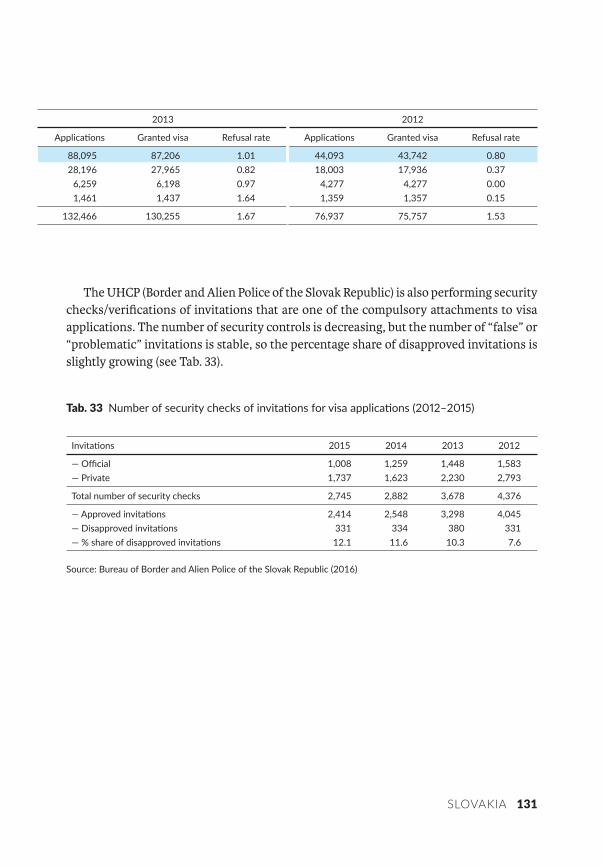
SLOVAKIA 131
The UHCP (Border and Alien Police of the Slovak Republic) is also performing security checks/verifications of invitations that are one of the compulsory a�achments to visa applications. The number of security controls is decreasing, but the number of “false” or “problematic” invitations is stable, so the percentage share of disapproved invitations is slightly growing (see Tab. 33).
Tab. Number of security checks of invita ons for visa applica ons ( – )
Invita ons 2015 2014 2013 2012
— Official 1,008 1,259 1,448 1,583— Private 1,737 1,623 2,230 2,793
Total number of security checks 2,745 2,882 3,678 4,376
— Approved invita ons 2,414 2,548 3,298 4,045— Disapproved invita ons 331 334 380 331— % share of disapproved invita ons 12.1 11.6 10.3 7.6
Source: Bureau of Border and Alien Police of the Slovak Republic (2016)
2013 2012
Applica ons Granted visa Refusal rate Applica ons Granted visa Refusal rate
88,095 87,206 1.01 44,093 43,742 0.80 28,196 27,965 0.82 18,003 17,936 0.37 6,259 6,198 0.97 4,277 4,277 0.00 1,461 1,437 1.64 1,359 1,357 0.15
132,466 130,255 1.67 76,937 75,757 1.53
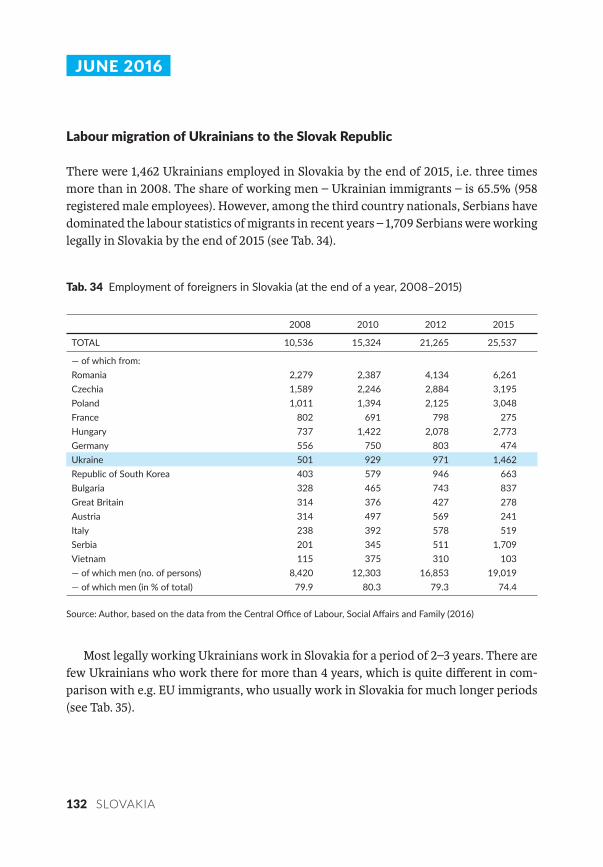
132 SLOVAKIA
JUNE
Labour migra on of Ukrainians to the Slovak Republic
There were 1,462 Ukrainians employed in Slovakia by the end of 2015, i.e. three times more than in 2008. The share of working men – Ukrainian immigrants – is 65.5% (958 registered male employees). However, among the third country nationals, Serbians have dominated the labour statistics of migrants in recent years – 1,709 Serbians were working legally in Slovakia by the end of 2015 (see Tab. 34).
Tab. Employment of foreigners in Slovakia (at the end of a year, – )
2008 2010 2012 2015
TOTAL 10,536 15,324 21,265 25,537
— of which from:Romania 2,279 2,387 4,134 6,261Czechia 1,589 2,246 2,884 3,195Poland 1,011 1,394 2,125 3,048France 802 691 798 275Hungary 737 1,422 2,078 2,773Germany 556 750 803 474Ukraine 501 929 971 1,462Republic of South Korea 403 579 946 663Bulgaria 328 465 743 837Great Britain 314 376 427 278Austria 314 497 569 241Italy 238 392 578 519Serbia 201 345 511 1,709Vietnam 115 375 310 103— of which men (no. of persons) 8,420 12,303 16,853 19,019— of which men (in % of total) 79.9 80.3 79.3 74.4
Source: Author, based on the data from the Central Office of Labour, Social Affairs and Family (2016)
Most legally working Ukrainians work in Slovakia for a period of 2–3 years. There are few Ukrainians who work there for more than 4 years, which is quite different in com-parison with e.g. EU immigrants, who usually work in Slovakia for much longer periods (see Tab. 35).
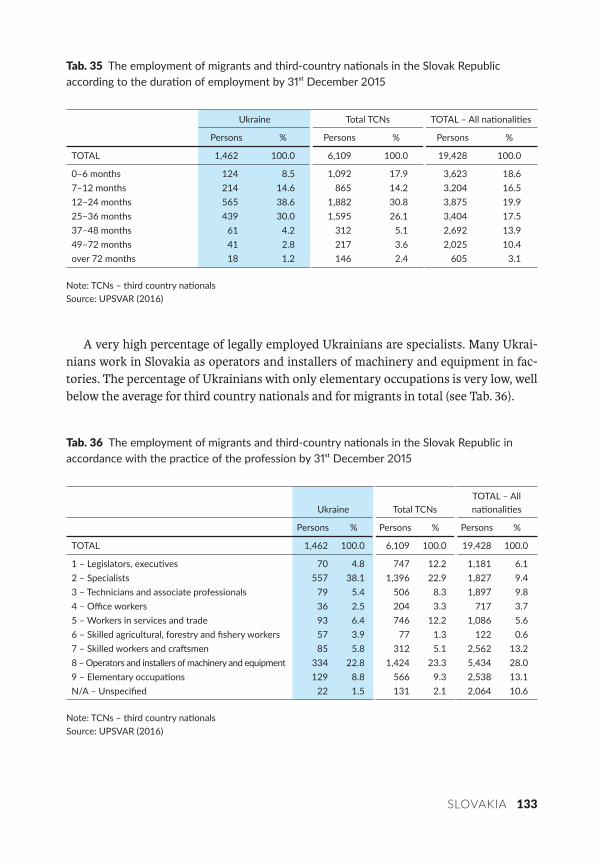
SLOVAKIA 133
Tab. The employment of migrants and third-country na onals in the Slovak Republic according to the dura on of employment by December
Ukraine Total TCNs TOTAL – All na onali es
Persons % Persons % Persons %
TOTAL 1,462 100.0 6,109 100.0 19,428 100.0
0–6 months 124 8.5 1,092 17.9 3,623 18.67–12 months 214 14.6 865 14.2 3,204 16.512–24 months 565 38.6 1,882 30.8 3,875 19.925–36 months 439 30.0 1,595 26.1 3,404 17.537–48 months 61 4.2 312 5.1 2,692 13.949–72 months 41 2.8 217 3.6 2,025 10.4over 72 months 18 1.2 146 2.4 605 3.1
Note: TCNs – third country na onalsSource: UPSVAR (2016)
A very high percentage of legally employed Ukrainians are specialists. Many Ukrai-nians work in Slovakia as operators and installers of machinery and equipment in fac-tories. The percentage of Ukrainians with only elementary occupations is very low, well below the average for third country nationals and for migrants in total (see Tab. 36).
Tab. The employment of migrants and third-country na onals in the Slovak Republic in accordance with the prac ce of the profession by December
Ukraine Total TCNsTOTAL – All na onali es
Persons % Persons % Persons %
TOTAL 1,462 100.0 6,109 100.0 19,428 100.0
1 – Legislators, execu ves 70 4.8 747 12.2 1,181 6.12 – Specialists 557 38.1 1,396 22.9 1,827 9.43 – Technicians and associate professionals 79 5.4 506 8.3 1,897 9.84 – Office workers 36 2.5 204 3.3 717 3.75 – Workers in services and trade 93 6.4 746 12.2 1,086 5.66 – Skilled agricultural, forestry and fishery workers 57 3.9 77 1.3 122 0.67 – Skilled workers and cra smen 85 5.8 312 5.1 2,562 13.28 – Operators and installers of machinery and equipment 334 22.8 1,424 23.3 5,434 28.09 – Elementary occupa ons 129 8.8 566 9.3 2,538 13.1N/A – Unspecified 22 1.5 131 2.1 2,064 10.6
Note: TCNs – third country na onalsSource: UPSVAR (2016)
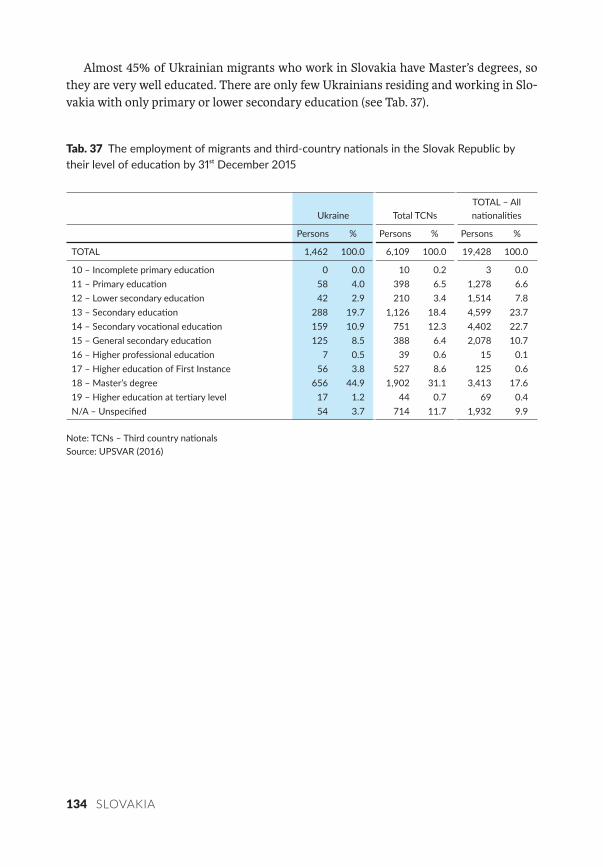
134 SLOVAKIA
Almost 45% of Ukrainian migrants who work in Slovakia have Master’s degrees, so they are very well educated. There are only few Ukrainians residing and working in Slo-vakia with only primary or lower secondary education (see Tab. 37).
Tab. The employment of migrants and third-country na onals in the Slovak Republic by their level of educa on by December
Ukraine Total TCNsTOTAL – All na onali es
Persons % Persons % Persons %
TOTAL 1,462 100.0 6,109 100.0 19,428 100.0
10 – Incomplete primary educa on 0 0.0 10 0.2 3 0.011 – Primary educa on 58 4.0 398 6.5 1,278 6.612 – Lower secondary educa on 42 2.9 210 3.4 1,514 7.813 – Secondary educa on 288 19.7 1,126 18.4 4,599 23.714 – Secondary voca onal educa on 159 10.9 751 12.3 4,402 22.715 – General secondary educa on 125 8.5 388 6.4 2,078 10.716 – Higher professional educa on 7 0.5 39 0.6 15 0.117 – Higher educa on of First Instance 56 3.8 527 8.6 125 0.618 – Master’s degree 656 44.9 1,902 31.1 3,413 17.619 – Higher educa on at ter ary level 17 1.2 44 0.7 69 0.4N/A – Unspecified 54 3.7 714 11.7 1,932 9.9
Note: TCNs – Third country na onalsSource: UPSVAR (2016)

Monitoring of Migra on Dataand Policy Changes Conductedin Ukraine, Poland, Czechia and Slovakia(September 2015 — June 2016)
Dušan Drbohlav, Marta Jaroszewicz,Markéta Seidlová, Dita Čermáková(editors)
Published in Prague by Charles University, Faculty of Science,Department of Social Geography and Regional Development,Albertov 6, Prague 2, [email protected] published in 2016136 pages, 450 copies
Layout and typese ng Karel Kupka (www.p3k.cz)Printed by Carter\reproplus s. r. o.Not for sale.
ISBN 978-80-7444-047-2