Embed Size (px)
Citation preview


PALKANSAAJIEN TUTKIMUSLAITOS •TYÖPAPEREITA LABOUR INSTITUTE FOR ECONOMIC RESEARCH • DISCUSSION PAPERS
* Social Insurance Institution, Research Department, Helsinki Finland [email protected]
** Labour Institute for Economic Research, Helsinki, Finland and
The Institute for Labour Market Policy Evaluation, Uppsala Sweden [email protected]
Helsinki 2007
234
Signaling or human capital: Evidence from the Finnish polytechnic school reform
Ulla Hämäläinen* Roope Uusitalo**

ISBN 978−952−209−047−8 ISSN 1795−1801

1
Tiivistelmä
Tutkimuksessa käytetään aineistoa ammattikorkeakoulu-uudistuksesta koulutuksen sig-
nalointivaikutusten ja tuottavuutta lisäävän inhimillisen pääoman kasvun vaikutuksen
erottamiseen. Ammattikorkeakoulu-uudistus muutti 1990-luvun aikana asteittain aikai-
semmat ylioppilaspohjaiset opistotason tutkinnot ammattikorkeakoulututkinnoiksi. Kau-
pan alalla uudistus pidensi koulutuksen kestoa ja loi uuden tutkintonimikkeen, tradeno-
mi, joka erottaa amk-tutkinnon suorittaneet aikaisemmin samoista oppilaitoksista val-
mistuneista merkonomeista.
Sekä inhimillisen pääoman teoria että signalointimalli ennustaa, että uudistuksen pitäisi
kasvattaa tradenomien tuloja merkonomien tuloihin verrattuna. Sen sijaan mallit eroavat
sen suhteen, miten merkonomien palkoille käy kun tradenomeja alkaa ilmestyä työ-
markkinoille.
Tutkimuksen mukaan ammattikorkeakoulu-uudistus alensi merkonomien tuloja, kuten
signalointimalli ennustaa. Tulokset eivät kuitenkaan ole sopusoinnussa myöskään ”puh-
taan” signalointimallin kanssa vaan tukevat hypoteesia jonka mukaan koulutuksella on
sekä tuottavuus- että signalointivaikutusta.
Abstract
We use data from the Finnish polytechnic reform to distinguish between human capital
and signaling theories of the value of education. We find that the reform increased
earnings of the polytechnic graduates compared to those graduating from the same
schools before the reform, as predicted by both the human capital and the signaling
models. However, we also find that the relative earnings of vocational college graduates
decrease after polytechnic graduates start entering into the labor market. This finding is
inconsistent with the pure human capital model and can be interpreted as evidence
supporting the signaling model.

2
1. Background
One of the oldest controversies in economics of education literature is the debate
between human capital and signaling or screening theories of education. The former
claims that education affects wages because it increases productivity of the workers.
The latter explains the wage differences between those with different levels of education
by the correlation of education and unobserved ability. In this case education is only a
signal that identifies the high ability workers. The controversy is difficult to resolve
since both theories have in most cases identical predictions. In particular, both theories
predict that earnings rise with education. However, the policy conclusions are very
different. According to the human capital theory the increase in the education level has
had important effects on productivity and economic growth. According to the pure
signaling theory education has no effects on productivity and, even though investments
in education may be profitable for the individuals pursuing education, they are, in
general, not beneficial for the whole society.
A number of empirical studies under 1990s have proven that education has a causal
effect on earnings. Under the assumption that earnings differences reflect productivity
differences the debate would be solved. However, these studies make no claims whether
that the reason behind the effect of education on earnings is the effect of education on
productivity or only the effect of education on the employer perception of productivity.
Most 1990s estimates on returns to education are based on natural experiments that
lower the cost of schooling for a particular group (e.g. Card 1995), or induces a specific
small group to continue their education at a higher level. (e.g. Angrist and Krueger,
1991, 1992). These studies identify the local treatment effect i.e. the effect of education
on earnings among those who because of the instrument are induced to get more
education (Imbens and Angrist 1994). As long as the affected group is relatively small
this has only a small effect on the average innate productivity levels by the level of
education. Hence, the fact that some small group gets higher earnings as a result of an
exogenous change in their education level does not imply that the reason between the
earnings differentials is the effect of education on productivity. Signaling explanation
fits the facts equally well. If most individuals make their education choices based on the
expected costs and benefits that depend on their ability, the employers can still use
3
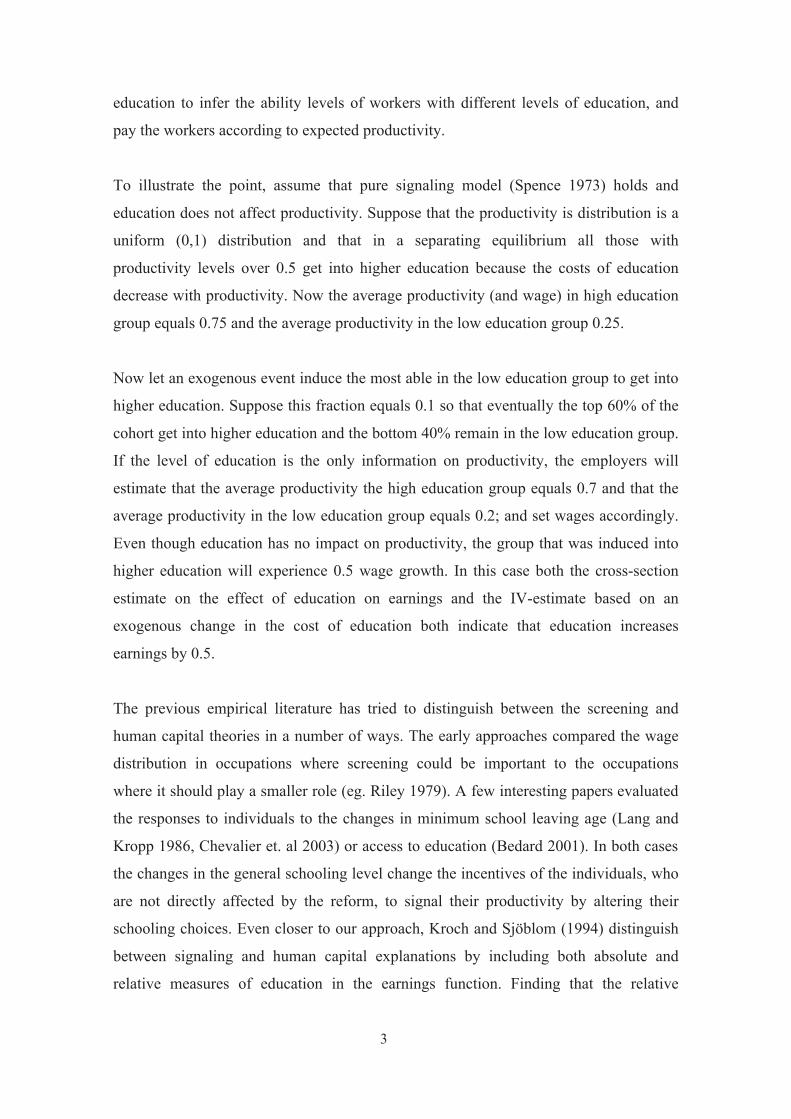
education to infer the ability levels of workers with different levels of education, and
pay the workers according to expected productivity.
To illustrate the point, assume that pure signaling model (Spence 1973) holds and
education does not affect productivity. Suppose that the productivity is distribution is a
uniform (0,1) distribution and that in a separating equilibrium all those with
productivity levels over 0.5 get into higher education because the costs of education
decrease with productivity. Now the average productivity (and wage) in high education
group equals 0.75 and the average productivity in the low education group 0.25.
Now let an exogenous event induce the most able in the low education group to get into
higher education. Suppose this fraction equals 0.1 so that eventually the top 60% of the
cohort get into higher education and the bottom 40% remain in the low education group.
If the level of education is the only information on productivity, the employers will
estimate that the average productivity the high education group equals 0.7 and that the
average productivity in the low education group equals 0.2; and set wages accordingly.
Even though education has no impact on productivity, the group that was induced into
higher education will experience 0.5 wage growth. In this case both the cross-section
estimate on the effect of education on earnings and the IV-estimate based on an
exogenous change in the cost of education both indicate that education increases
earnings by 0.5.
The previous empirical literature has tried to distinguish between the screening and
human capital theories in a number of ways. The early approaches compared the wage
distribution in occupations where screening could be important to the occupations
where it should play a smaller role (eg. Riley 1979). A few interesting papers evaluated
the responses to individuals to the changes in minimum school leaving age (Lang and
Kropp 1986, Chevalier et. al 2003) or access to education (Bedard 2001). In both cases
the changes in the general schooling level change the incentives of the individuals, who
are not directly affected by the reform, to signal their productivity by altering their
schooling choices. Even closer to our approach, Kroch and Sjöblom (1994) distinguish
between signaling and human capital explanations by including both absolute and
relative measures of education in the earnings function. Finding that the relative

4
position of an individual in the distribution of education for his cohort has an effect on
earnings would be evidence in favor of the screening hypothesis.
The balance of evidence from the previous studies supports the human capital theory.
Only Lang and Kropp (1986) and Bedard (2001) clearly reject the predictions of the
human capital theory by showing that reforms of the education system that affect only
some specific groups by extending compulsory education or by increasing university
access, also affect educational choices of groups not directly affected by the reform.
Such behavior is inconsistent with the pure human capital model but consistent with the
signaling story.
In this paper we use a large scale schooling reform that took place gradually between
1992 and 2000 in Finland as a natural experiment that can be used for distinguishing
between the human capital and signaling theories. This reform transformed a number of
schools from vocational colleges to polytechnics by upgrading the level and extending
the length of education in these schools. The changes in the content and duration
differed across different fields. In this study we focus on business programs where the
changes were most substantial. According to both signaling and human capital theories,
the reform should increase the earnings and employment prospects of polytechnics
graduates compared to the graduates from the same schools before the reform.
However, the theories differ in their predictions on what happens to the earnings of the
vocational college graduates when the new polytechnics graduates enter into the labor
market. We use these differences to test human capital and signaling models. We reject
both theories in their pure form, and conclude education has both signaling and human
capital value.
In the following we first describe the essential features of the Finnish school system and
the polytechnics reform in Section 2. We then specify our empirical strategy in Section
3 and describe our data sources in Section 4. The baseline empirical estimates are in
section 5. Section 6 concludes.

5
2. The Finnish education system and the polytechnics reform
2.1. The Finnish school system in brief1
Finnish students begin school at the age of seven. Compulsory comprehensive school
lasts for nine years. After comprehensive school about 55 percent of the students
continue in the upper secondary school that lasts for three years and ends with a
matriculation examination. The other 45 percent enter into various vocational schools
and vocational colleges that last for two to three years.
Vocational schools and colleges were a diverse group of schools in the beginning of
1990s. The length of education and the entry requirements varied between schools.
Some took most students directly from the comprehensive schools and provided them
with two or three years of vocational education. In some vocational colleges most
students had completed upper secondary school before entering vocational college. For
example, a business degree from a vocational college (merkonomi) typically required
three years of schooling after the comprehensive school or two years of schooling after
the upper secondary school. Engineering degree from technical college required that the
students had either a vocational school or an upper secondary school degree before
entering. Education at technical college typically took four years to complete. In the
nursing schools most students had completed upper secondary school before entering,
and vocational college lasted for three years.
Highest education in Finland is provided by state universities. The students are accepted
directly to a Master’s program that takes, on average, five to six years to complete. Vast
majority of students enter university after completing upper secondary school, but it is
also possible to apply with a vocational college degree.
Education is free at all levels. State financed student aid and subsidized loans make
possible to pursue education irrespective of financial circumstances of the family. Good
employment prospects for graduates and reasonably high monetary returns to education
(eg. Uusitalo 1999) have kept the demand for education high. The supply is controlled
by the Ministry of Education through its decisions on the number of students admitted
_______________ 1 An up to date English language overview of the Finnish education system can be found from the country background report for the OECD thematic review of tertiary education in Finland. (Ministry of Education, 2005)
6
to the universities and through its funding decisions to other schools. As a consequence
the number of applications to the universities and to the most popular vocational
colleges exceeds the number of places by a factor of 42. Entrance exams and/or previous
grades are used to select students to most schools at all levels.
2.2. The polytechnics reform
The goal of the polytechnics reform was to improve the quality of vocational education
and to respond to the growing demand for skilled workers. The aim was to channel the
increase in higher education provision to more practical education at polytechnics rather
than to more scientific education at universities.3 Other objectives included pooling
resources in vocational schooling to larger units and making the Finnish education
system more comparable to that of other EU-countries.
The first 22 polytechnics were established under a temporary license in 1991. These
polytechnics were created by merging several vocational colleges and vocational
schools, often operating at several sites. Seven new temporary licenses were granted
over the 1990s so that currently there are 29 polytechnics. The experimental phase was
judged to be successful and starting in 1996 the temporary polytechnics have gradually
become permanent.
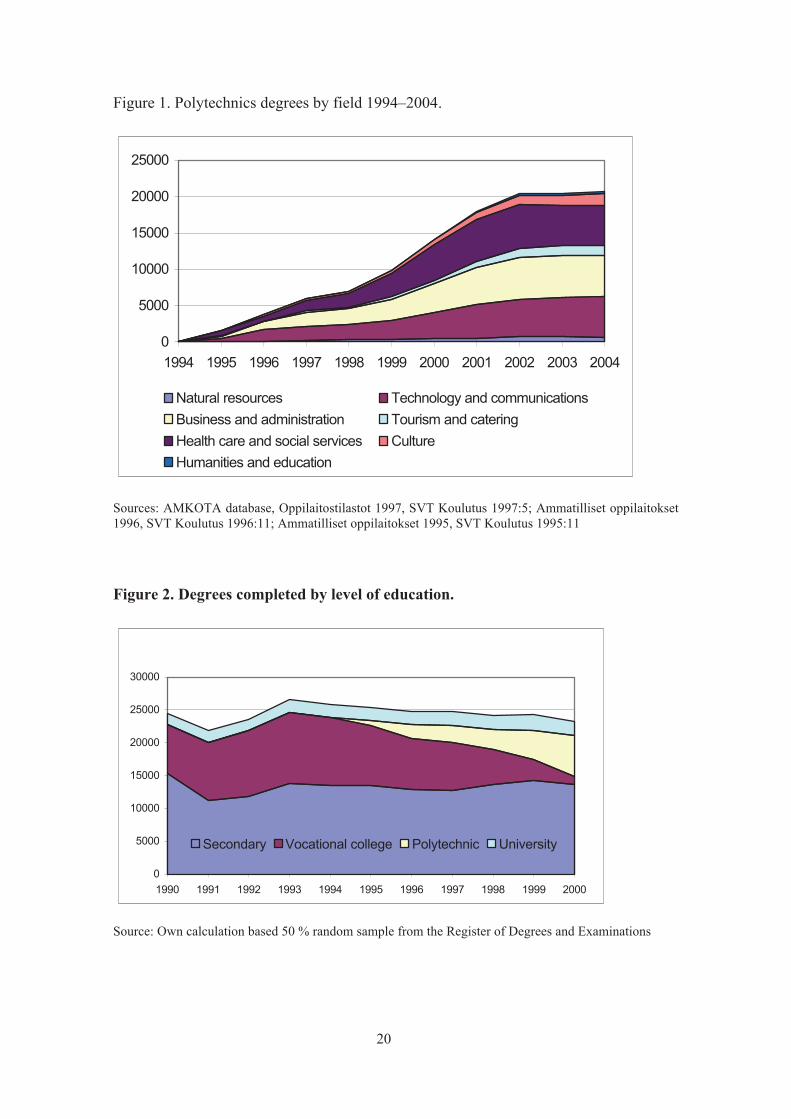
The first graduates from the new polytechnics entered into the labor market in 1994.
The number of graduates grew rapidly and by 2000 the number of new polytechnics
graduates exceeded the number of new university graduates. The three largest fields
were business and administration, social and health care (typically nursing), and
technical and transport (typically engineers). Each year, between eighty and ninety
percent of all polytechnics degrees were granted from these three fields.
(Figure 1)
_______________ 2 According to KOTA database by the Ministry of Education 108 615 applications were sent to the Finnish universities in 2003. Only 28 159 students were admitted. Even though many students applied to several universities, the excess demand for university education is substantial. 3 Despite of this some polytechnics have recently started calling themselves ”universities of applied sciences”.

7
In this study we compare the students who graduate from the vocational colleges before
and after the polytechnics reform. Since the timing of the reform differed across
schools, we can also control for other macroeconomic changes and general changes in
the return to education. We can also control for any permanent differences across
schools by adding school fixed effects to the equations that we estimate. Especially the
former point is important because the economic circumstances that affect the
employment prospects of the new graduates were very volatile in the 1990s. The
average polytechnics graduates entered the labor market under much better demand
conditions than those who graduated from the same schools in the early 1990s.
The reform changed the curriculum to different extent in different fields. Our
impression based on discussions with the school administrators and officials from the
Ministry of Education is that the changes in the engineering and nursing education were
relatively minor. Also the average length of studies in these fields was unchanged. In
our previous evaluation study (Böckerman, Hämäläinen & Uusitalo 2006) we compared
earnings of polytechnics graduates in these fields to the earnings of graduates from the
same schools before the reform and found that, after controlling for changes in student
composition, the reform had no effect on earnings in either engineering or nursing. With
almost unchanged content and duration this is hardly surprising.
In contrast, there were substantial changes in the business education. The average length
of studies increased from two years to three and a half years. The graduates received
new degree titles (tradenomi) that distinguished them from the earlier graduates from
these schools (merkonomi). In our earlier study we found that both employment rates
and earnings of post-reform graduates were significantly higher when compared to pre-
reform graduates from the same schools. This finding is naturally consistent with both
the human capital and the signaling model.
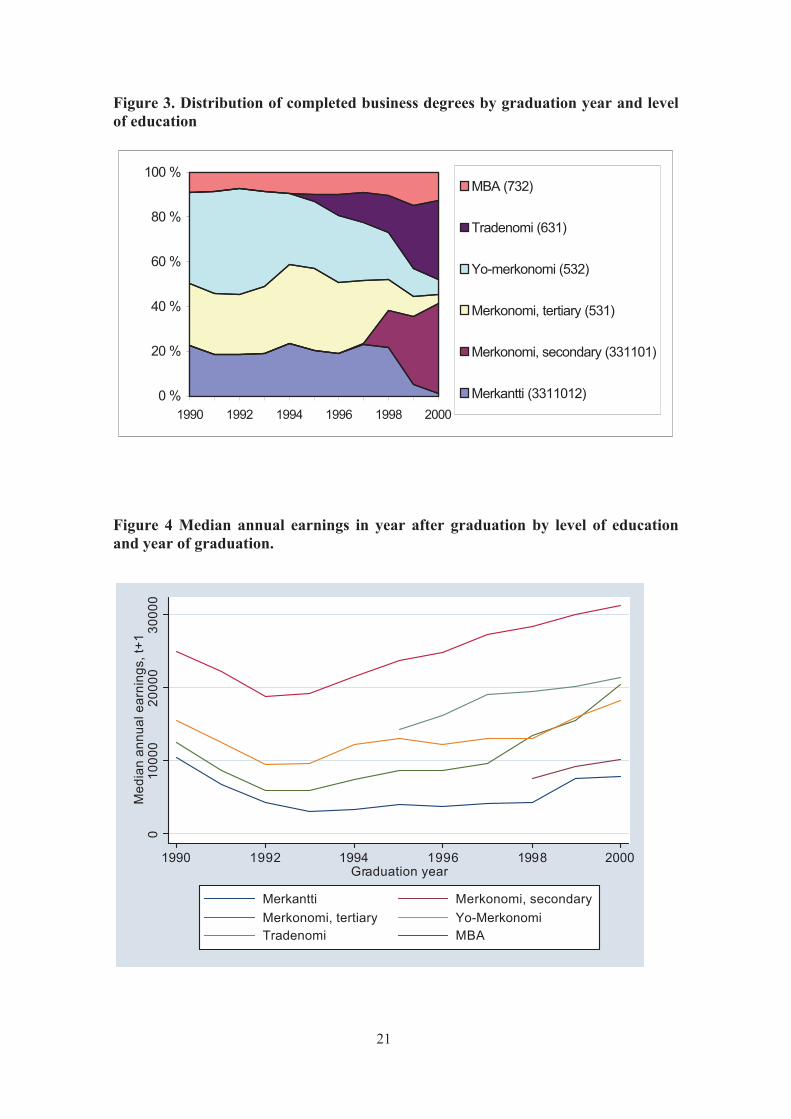
As mentioned earlier the polytechnics were created by upgrading vocational colleges
into polytechnics. Universities continued their operation during the reform period
without major changes. Looking across all fields, also the number of graduates from
secondary-level vocational education remained rather stable. These changes are
reflected in Figure 2 that reports the number of degrees by the level of education
between 1990 and 2000. The share of university degrees has increased over time and the
8
share of vocational school degrees in the end of 1990s. However, the main change in the
distribution of the degrees is the gradual decrease in the number of vocational college
degrees and the corresponding increase in the polytechnics degrees.
(Figure 2)
The changes in the degree structure within the business education were a fair bit more
complicated. Also there the changes in the university-level education were small. The
main change that took place involved the transformation of vocational college education
(merkonomi) to polytechnic education (tradenomi). In most schools the programs,
where the entry requirement prior to the reform was completing senior secondary
school, were upgraded to the polytechnic level by extending the program length from
two to three and a half years. However, changes occurred also at the secondary-level.
Up to 1995 the basic vocational business degree (merkantti) took two years to complete
and required only comprehensive education as an entry requirement. Starting in 1995,
the basic vocational program was upgraded to a three-year program that confusingly
now granted degrees titled merkonomi. The first graduates from these programs entered
the labor market in 1998. After 1999 most graduates from basic vocational business
program had completed a three-year-course. In the official classification these degrees
were still classified to the secondary-level, but it is unclear whether these degrees
should be compared to earlier basic vocational programs or earlier vocational college
programs.
Finally, the total number of graduates was also affected. This was due to two factors.
First the extension of program length due to the polytechnic reform temporarily reduced
the number of graduates. Secondly, the financial resources were limited and the increase
in teaching resources required by the extension of the program length was partly
financed by reducing the student intake. However, also the number of potential
applicants was reduced as the small age cohorts born in the early 1970s came to typical
college entry ages. For example, the number of 20 – 24 year-olds decreased by about 10
percent between 1990 and 1995.
In Table 1 we report the changes in the distribution of business degrees during the
1990s. As can be read from the table the number of polytechnic graduates increased
9
rapidly from 1995 onwards. This increase was accompanied with a decrease of degrees
from the lower tertiary level, mainly from programs where entry requirement was
completing upper secondary school.
(Table 1)
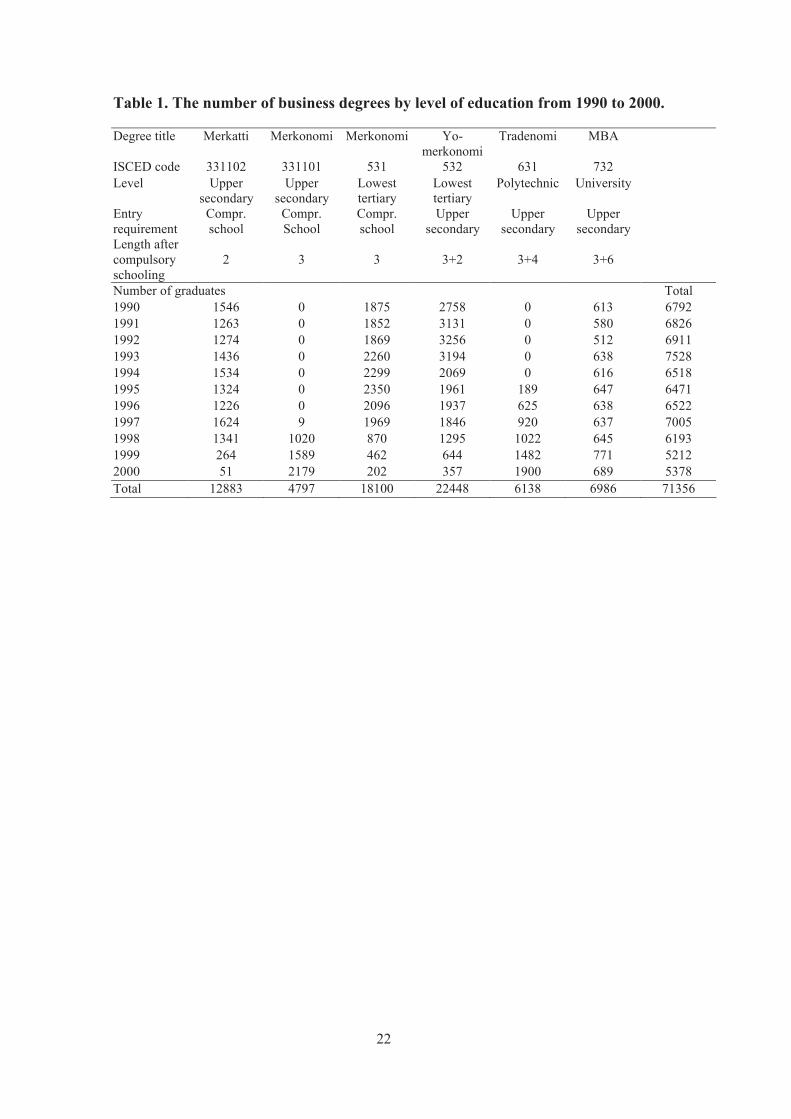
Figure 3 clarifies the change in the degree structure. The main changes that took place
in the second half of 1990s were the transformation upper secondary school based two-
year merkonomi programs to the polytechnic programs lasting 3.5 years, and the
creation of a new three-year secondary-level business program. The latter was formed
from two-year secondary-level programs and from three-year programs in vocational
colleges.
(Figure 3)
3. How the Finnish polytechnics reform can be used to sort out the
sorting vs. human capital controversy
Both the human capital and signaling models would predict that the graduates from the
polytechnics would receive higher earnings than graduates from the same schools
before the reform. According to the human capital explanation this increase is due to the
higher productivity resulting from an extension in the length, and perhaps an
improvement in the quality, of education compared to that in the vocational colleges.
According to the signaling model the employers use the polytechnic degree as a signal
that distinguishes the best workers from the applicant pool.
The crucial difference between human capital and signaling models is their prediction
on what happens to those who graduate from the vocational colleges after some schools
have went through the reform, but before their own college is upgraded to a polytechnic.
According to the human capital theory their earnings are not affected because they get
exactly similar education as before. Also their relative position compared to university
graduates and the graduates from the secondary level vocational schools should not be
changed.
10
In contrast, the signaling hypothesis predicts that those who graduate from the
vocational colleges after the reform suffer earnings losses. If the most able of those who
before the reform would have graduated from the vocational colleges now enter
polytechnics, the average ability of those who remain in vocational colleges after the
reform decreases. If this is how the employers perceive the sorting process, also the
average earnings of the vocational college graduates decrease. In fact, a pure signaling
model would predict that if one combines polytechnics and vocational college
graduates, the earnings losses of vocational college graduates would be as large as the
earnings gains of polytechnics graduates, so that the average earnings of the combined
group would not be affected by the reform.
Another way to describe the predictions of the two competing theories is to use the
concepts from Kroch and Sjöblom (1994) and note that the reform increased education
level of polytechnics graduates - compared to the graduates from the same schools
before the reform - in both absolute terms, and relative to the other graduates of the
same cohort. The reform had no effect on absolute education level of those graduating
from vocational colleges after the reform, but it decreased their relative education level.
To sum up, the pure human capital model predicts that the earnings of the polytechnics
graduates increase as a result of the reform but the earnings of the vocational college
graduates remain unchanged. The pure signaling model implies that the earnings of the
polytechnics graduates increase and the earnings of the vocational college graduates
decrease so that the average earnings of these two groups remain unchanged.
3.1. Formal test
A simple test to distinguish between human capital and signaling hypothesis follows the
logic described above. As the reform involves a gradual decrease in the number of
vocational college graduates and a gradual increase in the number of polytechnics
graduates, it is natural to measure the reform by the share of polytechnics graduates of
all graduates from vocational colleges and polytechnics. Under the null hypothesis that
the wage differentials are purely human capital, the emergence of polytechnics
graduates into the labor market will have no effect on the earnings of vocational college
graduates. Hence, the interaction effect of the share of polytechnics graduates and a
dummy variable identifying the vocational college graduates should be zero in a
11
regression where earnings are explained by the level of schooling and the year effects.
Under the alternative hypothesis that education has also signaling value, this interaction
effect would be negative.
Similarly, under the null hypothesis of that wage differentials arise from the pure
signaling model, the share of polytechnics graduates has no effect on the average
earnings of vocational college and polytechnics graduates combined. Hence the
interaction effect of the share of polytechnics graduates and a dummy variable that
indicates that student graduated from either polytechnic or vocational college, should be
zero in a similar regression model. Under an alternative that the increase in the share of
polytechnics graduates increases average productivity in this aggregated group, this
interaction effect should be positive.
4. Data
Our empirical work is based on a fifty percent sample of all individuals who received a
degree from any post-compulsory school in Finland between 1990 and 2000. The
primary source of data is the Register of Degrees and Examinations maintained by the
Statistics Finland. Schools report all degrees granted directly to Statistics Finland and
the register has universal coverage of all degrees from all schools in Finland.
Information in the register is stored at a student-level and include a person id, school
code, type of school and program, degree title and year granted. The register also
includes a history file that allows tracking schools when several schools are merged into
one. This allows creating a link that helps to identify which vocational colleges formed
each polytechnic. For confidentiality reasons the person id’s and the school id’s were re-
coded so that the individual students or individual schools can no longer be identified.
Still, the link between the pre-reform and the post-reform school codes was kept in data.
These data have been merged to Employment Statistics (ES) that is essentially a
register-based annual population census. ES contain information on all employment and
unemployment spells from the pension insurance funds and unemployment registers, as
well as, annual earnings from the tax records. The individuals can be followed over
time. Time-series data on individuals also allows calculating various employment
history measures at the individual-level. We use this to calculate work experience at the

12
time of graduation and to include information on all previous degrees in the data. Our
observation window includes years from 1987 to 2002.
Finally, we obtained data on the matriculation examination results for the persons who
graduated from upper secondary school between 1988 and 1997. The matriculation
examination is a national compulsory final exam taken by all students who graduate
from the upper secondary school. The exam takes place simultaneously in all schools.
The answers are first graded by teachers and then reviewed at the national level by the
associate members of the Matriculation Examination Board outside the schools. The
exam scores are standardized so that their distribution is the same every year. In early
1990s, the exam included four compulsory and two optional tests. In the data that is
provided by the Matriculation Examination Board all grades in all tests are reported. In
this paper we use the average of four compulsory tests as a measure of student ability.
We examine effects on outcomes in the year following the graduation year (t+1) in
order to avoid the need to adjust for the different graduation dates, but to observe the
students as soon as possible after graduation. As the main outcome measure we use the
annual earnings in year t+1. We include in the regression models all graduates after
1994 when the first polytechnics graduates enter the labor market. We exclude students
who are still enrolled in some educational institution in the year after graduation.
We focus on business education which is one the three largest fields in the polytechnics
and where the changes in the content of education were the largest. When comparing
the polytechnic and the vocational college graduates to other education levels, we select
comparable fields from universities and vocational schools. Hence, we compare
business degrees from polytechnics to MBA degrees from universities. We also create
similar comparison groups by field from secondary level vocational education. This is
slightly more complicated since the degree structure in the secondary level has also
changed. Last graduates from two-year secondary level business programs (merkantti)
entered the labor market in 1999.
13
5. Results
Figure 4 provides a first glance to the post-graduation outcomes after a business degree.
The figure plots real median annual earnings in the year after graduation by the
education level and the year of graduation. These median earnings reflect both
differences in the employment rates and hours of work, as well as, the differences in the
wage level.
The drop in the real earnings in the beginning of the decade reflects the effect of
recession on the employment rates and wages. After 1993 earnings in all education
levels start to increase. When measured in euros, the increase is largest in the higher
levels of education, but in relative terms the differences are smaller. Some rapid
changes in the figure are due to a small number of observations and changes in the
composition. For example, very few graduated with lowest business degree (merkantti)
or with comprehensive school-based merkonomi degree after 1998.
The most interesting developments occur in the earnings of vocational college and
polytechnincs graduates. The earnings of these two groups clearly diverge and the
earnings of the polytechnics graduates approach the earnings of university graduates (at
least in relative terms), as predicted by both human capital and signaling models. It also
seems that those who graduate from vocational colleges after the reform have suffered.
The growth rate of their earnings halts after the polytechnics graduates start entering the
market. This would be evidence of signaling effect, but could naturally also be caused
by other changes in the quality of students or the quality of schools. To control for these
differences we will proceed to regression analysis.
(Figure 4)
We first replicate the procedure used by Kroch & Sjöblom and explain the earnings of
the graduates with both relative and absolute measures of education. We allocate each
level of education the number of years of schooling as listed in Table 1. We then regress
earnings on both the absolute years of education and the relative rank of individual
within the graduating cohort. We include year dummies to account for the business
cycle effects. The basic empirical model is the following

14
ittitryit DXSSy εβββ +Ω+Φ+++= 210)ln( , (1)
where yit indicates earnings of individual i graduating in year t. Sy indicates years of
education and Sr individual’s rank in the distribution of education for his cohort. Xit is a
vector of other control variables and Dt a full set of year dummies. A pure signaling
model would imply that β1 = 0 and a pure human capital model that β2 = 0.
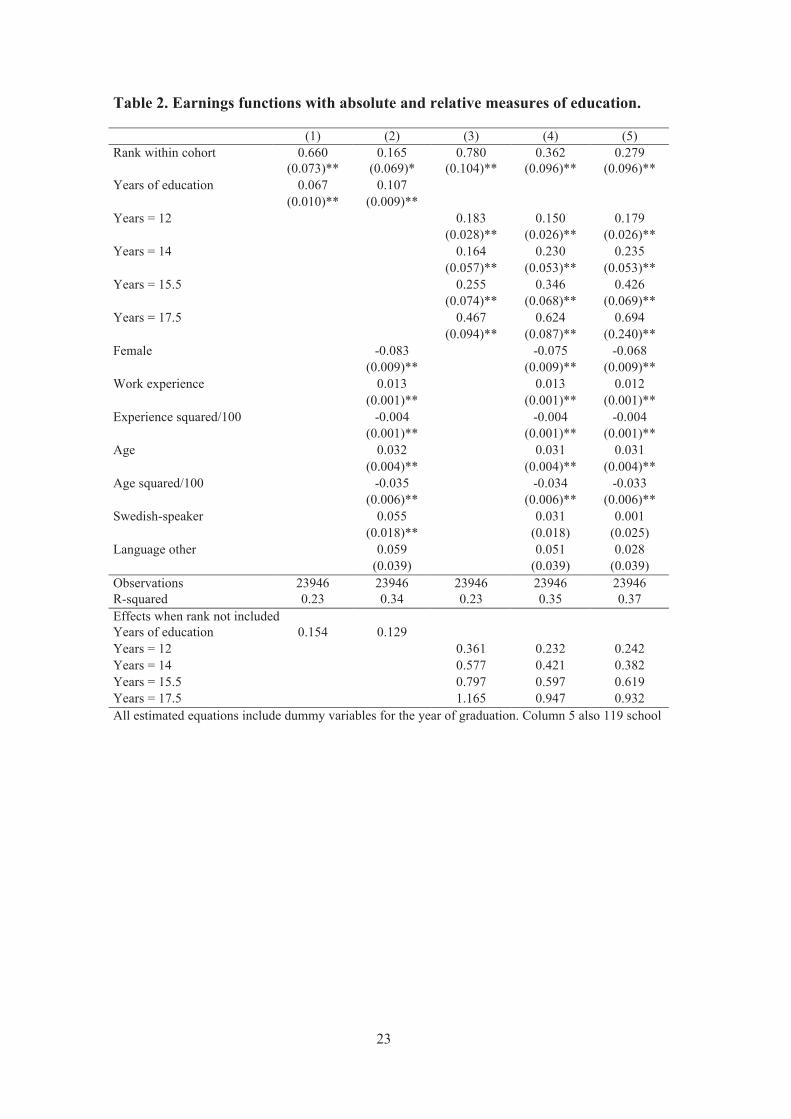
The results are reported in Columns 1 and 2 of Table 2. The dependent variable in all
equations is log annual earnings during the calendar year after graduating. We use data
from years 1994 to 2000. Students enrolled in some educational institution during the
fall term and those with very low earnings (less than 500 euros per year) are excluded.
In the first column only years of schooling, relative rank within graduating cohort and
year of observation are included as explanatory variables. In the second column also
controls for sex, age, work experience and native language are included. In the bottom
of each column we also report the coefficients of the schooling variables when the rank
is not included in the model.
According to the estimates both the years of education and the rank within cohort have
significant effects on earnings. The magnitude of the estimates appears to be quite
sensitive to the inclusion of control variables. This is not very surprising given that
these control variables are highly correlated with the level of education. Including the
rank variable reduces the coefficient of schooling, though this reduction is barely
significant in column 2 where the control variables are included.
Equation (1) provides reliable estimates for the human capital and signaling effects if
the effects of years of education and rank in the education distribution are linear.
However, there is little reason to impose such restrictive assumptions on the effect of
education on earnings. If the effect of years of education is nonlinear, the rank variable
may pick some of these nonlinear effects even if no signaling effect exists. We therefore
estimate equation (1) also using dummy-variables for each level of education (omitting
the lowest category). Since the equation also includes year dummies, the coefficient of
the rank variable is identified from the changes in the relative number of individuals in
each level of education.

15
These estimates are reported in columns 3, 4 and 5. In Column 3, no control variables
are included. Column 4 includes the same set of controls as Column 2. Finally, Column
5 includes also 119 school dummies. The pattern of the results is not changed from
linear schooling specification. Also here the rank variable has a significant and positive
coefficient in all cases. Measures of schooling levels indicate significant returns to each
additional year of schooling. These estimates are substantially smaller than
corresponding estimates when rank is not included in the model.
(Table 2)
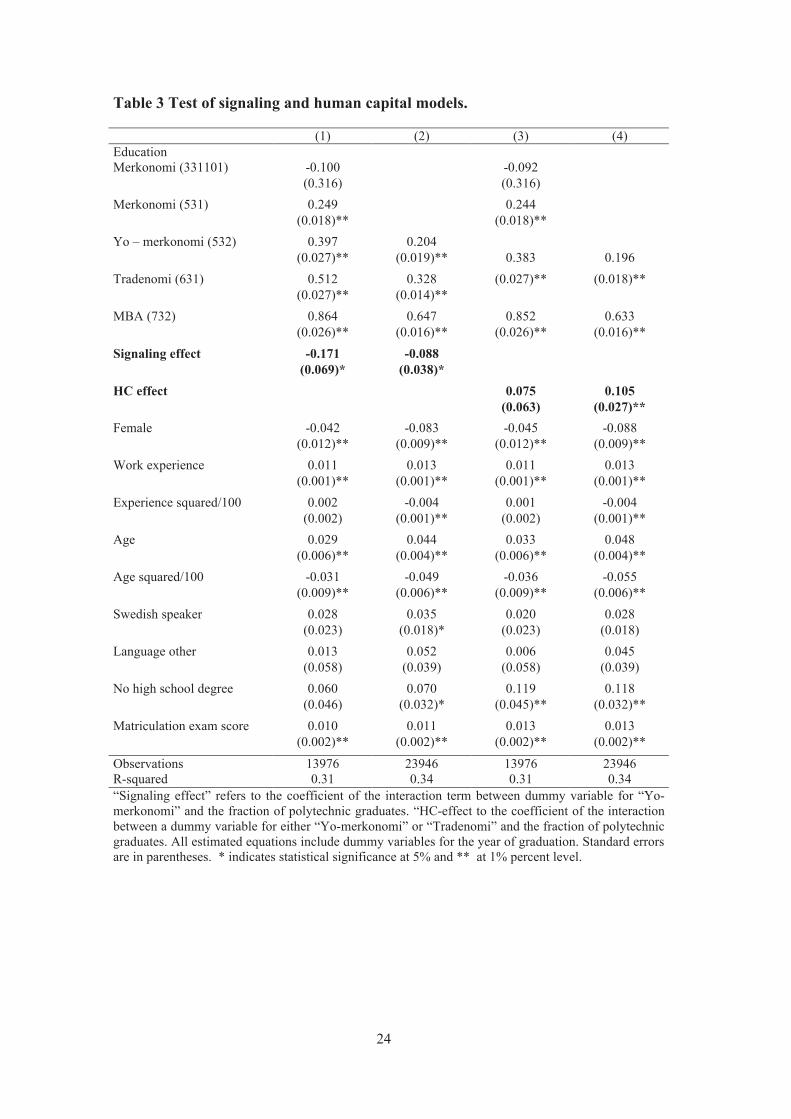
To focus on the effects of the polytechnic reform we continue to test whether the entry of
polytechnic graduates to the labor market reduces the earnings of graduates from
vocational colleges. In Table 3 we estimate equations where we explain the earnings in
the year after graduation with dummy variables for each level of schooling and an
interaction of the indicator for the vocational college graduates and the fraction of
polytechnic graduates. As noted before, we have a problem in choosing an appropriate
comparison group. Therefore, we first use the lowest business degrees (merkantti) as a
comparison group, but use data only for the first three years up to 1997 where the
distribution of lower business degrees remains roughly constant (See Figure 3). In
Column 2 we use all programs where the entry requirement is comprehensive school as a
comparison group by pooling data for education codes 331, 33101 and 531 (Detailed
description in Table 1). We include the same set of control variables as in the previous
table but also attempt to control for potential changes in student quality by including
matriculation examination scores and an indicator taking a value of one if the student has
not completed a high school and hence has no matriculation exam score to be included. In
Columns 3 and 4 we merge the vocational college graduates and the polytechnic
graduates and add an interaction term between this merged group and fraction of
polytechnics graduates. As before, the omitted comparison group is lowest business
degree in Column 3 and all comprehensive school-based programs in Column 4.
The most interesting results in Table 3 are the coefficients of interaction terms labeled
as “signaling effect” and “HC effect”. According to the estimates in Columns 1 and 2
the increase in the fraction of polytechnics graduates reduces the earnings of vocational
college graduates, hence rejecting the pure human capital model and providing support
16
for the signaling hypothesis. The size of the coefficient in the first column is rather large
(-0.171). In the second column that uses all years and perhaps better control group the
estimate is substantially lower (–0.088) but statistically significant due to a smaller
standard error. The point estimate would imply that a reform that transfers almost all
vocational colleges to polytechnics would reduce the earnings of the remaining
vocational college graduates by about 9 percent.
In columns 3 and 4 we test the pure signaling hypothesis by examining how the increase
of the fraction of polytechnic graduates affected the average earnings of vocational
college and polytechnic graduates merged together. The estimate is positive and of
roughly similar magnitude in both Columns 3 and 4 but only the estimate in Column 4
is statistically significant. The result implies that the reform increased the earnings of
the polytechnics graduates by more than it reduced the earnings of the vocational
college graduates. Since the average rank of these groups was not affected the result
rejects the pure signaling hypothesis and provides evidence of significant human capital
effects.
(Table 3)
According to the results education has both human capital and signaling value. One way
to quantify the relative magnitude of the effects is to compare the positive effects on the
polytechnics graduates to the negative effects of the remaining vocational college
graduates. A rough measure that indicates the fraction of the increase in the earnings of
the polytechnic graduates that can be attributed to the human capital effects, can be
computed using the following formula
( ) ( )( )0
00effectHCRelativeww
wwww
pol
vocpol
−
−+−= ,
where wpol indicates the post-reform earnings of polytechnic graduates, wvoc the post-
reform earnings of vocational college graduates and w0 earnings of both of these groups
before the reform. This measure equals one if the earnings of vocational college
graduates are not affected (wvoc - w0) = 0, and schooling has only human capital effects.
The measure equals zero if the earnings gain to polytechnic graduates is equals the loss
17
to the vocational college graduates so that the weighted average earnings of these two
groups is unchanged and schooling only provides a signal that helps employers to
distinguish the most able from this group. Using our preferred estimates from Column 2
and yields a value of 0,29 indicating that 29 percent of the increase in the earnings of
polytechnics graduates is due to an increase in human capital and the remaining 71
percent to the signaling value.
5.1. Robustness checks
The crucial question regarding the validity of the results reported above is whether the
decrease in earnings of vocational college graduates reflects a decrease in the signaling
value of education or a decrease in student quality. We tried to deal with this by
including matriculation exam scores to the equations that we estimated, but this may be
only a partial solution to the problem if the employers have other information on the
quality of recent graduates and if they use it in hiring decisions.
The options of performing more convincing tests of the signaling hypothesis using data
on the polytechnics reform are rather limited. One possibility is to examine the changes
in the fraction of the vocational college graduates that continue their studies after
graduation. We found that this fraction increases after the reform relative to those
graduating from lower schooling levels. Such a behavior would be consistent with a
decrease in the signaling value but might also be due to improved access to further
education, for example, in the new polytechnic schools. It would also be interesting to
examine the changes in the drop-out rates in the vocational colleges (as in Bedard 2001)
but in our data one can only observe graduation and not enrolment so we cannot identify
the drop-outs.
We also estimated the effect of the entry of the polytechnics graduates to the market on
those who graduated from the vocational colleges before the reform and who therefore
were not sorted. We used data on those who graduated from vocational colleges
between 1990 and 1994 and explained their earnings five years after graduation in 1995
– 1999 with the fraction of polytechnics graduates on the market. The estimates were
negative effects but insignificant when work experience was included as a control
variable. The test is naturally problematic also because those who have graduated five
years earlier are not necessarily competing for the entry-level jobs with more recent
graduates.
18
In our analysis we have implicitly assumed that workers with different qualifications are
perfect substitutes with each other. Under this assumption the relative number of
graduates at each level of education only affects return to different levels of education
because the employers use education as a signal for ability. An increase in fraction
proceeding to higher levels of education lowers the employer perception of ability of
those remaining at lower levels. If the workers with different levels of education are
imperfect substitutes in production, changes in relative shares will have also other
effects. In particular, one would expect that a decrease in supply of vocational college
graduates would drive up their wages. However, we find exactly the opposite. The
larger the fraction graduating from polytechnics and hence the smaller the fraction
graduating from vocational colleges, the lower is the wage of vocational college
graduates. Naturally, more complex patterns of relative substitutability could create
different outcomes, but it would be difficult to come up with a simple supply story that
could fully explain our findings.
6. Conclusion
A school reform that extends the length of education is likely to improve the
employment prospects and wages of those who graduate from these new programs. The
private return to individuals may be substantial. However, when evaluating the benefits
of the reform for the whole society one needs to also account for the external effects that
the increase in the education level has on graduates from other programs. If schooling is
only a signal of the quality of the graduates the negative external effects on other
graduates may be large. In assessing the benefits of the reform these negative external
effects should be weighted against the positive effects on the graduates from reformed
programs.
In this paper we have provided evidence that a large scale school reform decreases
earnings of the graduates from the schools that were not yet reformed. We attribute this
finding as evidence on the signaling role of education. However, the reform clearly
benefits those who graduate from the schools after reform and these benefits outweigh
the losses due to the external effects. The average earnings of graduates from both
19
reformed and not yet reformed schools increase. This increase is due to the increase in
the average level of schooling and implies that schooling also has productive value.
References
Angrist, J. and Krueger, A. (1991), “Does compulsory school attendance affect schooling and
earnings”, Quarterly Journal of Economics 106: 979 – 1014.
Angrist, J. and Krueger, A. (1992), “Estimating the payoff to schooling using the Vietnam era
draft lottery”, NBER Working Paper 4067.
Bedard, K. (2001), “Human capital vs. signaling models: university access and high school
dropouts” Journal of Political Economy 109, 749-775.
Böckerman, P.; Hämäläinen, U. and Uusitalo R. (2006), “Vastasiko ammattikorkeakoulu
työmarkkinoiden tarpeita”, Labour Institute for Economic Research, Research Reports 99.
Card, D. (1995), “Using geographic variation in college proximity to estimate the return to
schooling”, in Christofides, L.; Grant, K and Swidisky, R. (eds.) Aspects of labour market
behaviour: essays in honour of John Vanderkamp (University of Toronto Press), 201-222.
Card, D. (2000), “The causal effect of education on earnings”, in O. Ashenfelter and D. Card
(eds.) Handbook of Labor Economics 3a, North Holland.
Chevalier, A.; Harmon, C.; Walker, I and Zhu, Y (2004), “Does education raise productivity or
just reflect it?” The Economic Journal 114, F499-517.
Groot, W and Oosterbeek, H. (1994), “Earnings effects of different components of human
capital vs screening”, Review of Economics and Statistics 76, 317-321.
Imbens, G. and Angrist, J. (1994), “Identification and estimation of local average treatment
effects”, Econometrica 62(2): 467 – 475.
Kroch, E. and Sjoblom, K (1994), “Schooling as human capital or a signal”, Journal of Human
Resources 29, 156-180.
Lang, K and Kropp, D. (1986), “Human capital versus sorting: the effects of compulsory
attendance laws”, The Quarterly Journal of Economics 1010, 609 – 624.
Lazear, E (1977), “Academic achievement and job performance”, American Economic Review
67, 252-254.
Ministry of Education (2005). OECD thematic review of tertiary education, Country
background report for Finland, Publications of the Ministry of Education 2005:38.
Riley, J. (1979), “Testing the educational screening hypothesis”, Journal of Political Economy
87, 227-252.
Spence, M. (1973), “Job market signaling”, The Quarterly Journal of Economics, 87, 355-374.
Uusitalo, R. (1999), “Returns to Education in Finland”, Labour Economics 6, 569-580.
20
0
5000
10000
15000
20000
25000
1994 1995 1996 1997 1998 1999 2000 2001 2002 2003 2004
Natural resources Technology and communicationsBusiness and administration Tourism and cateringHealth care and social services CultureHumanities and education
0
5000
10000
15000
20000
25000
30000
1990 1991 1992 1993 1994 1995 1996 1997 1998 1999 2000
Secondary Vocational college Polytechnic University
Figure 1. Polytechnics degrees by field 1994–2004.
Sources: AMKOTA database, Oppilaitostilastot 1997, SVT Koulutus 1997:5; Ammatilliset oppilaitokset 1996, SVT Koulutus 1996:11; Ammatilliset oppilaitokset 1995, SVT Koulutus 1995:11 Figure 2. Degrees completed by level of education.
Source: Own calculation based 50 % random sample from the Register of Degrees and Examinations
21
0 %
20 %
40 %
60 %
80 %
100 %
1990 1992 1994 1996 1998 2000
MBA (732)
Tradenomi (631)
Yo-merkonomi (532)
Merkonomi, tertiary (531)
Merkonomi, secondary (331101)
Merkantti (3311012)
Figure 3. Distribution of completed business degrees by graduation year and level of education
Figure 4 Median annual earnings in year after graduation by level of education and year of graduation.
010
000
2000
030
000
Med
ian
annu
al e
arni
ngs,
t+1
1990 1992 1994 1996 1998 2000Graduation year
Merkantti Merkonomi, secondaryMerkonomi, tertiary Yo-MerkonomiTradenomi MBA
22
Table 1. The number of business degrees by level of education from 1990 to 2000.
Degree title Merkatti Merkonomi Merkonomi Yo- merkonomi
Tradenomi MBA
ISCED code 331102 331101 531 532 631 732 Level Upper
secondary Upper
secondary Lowest tertiary
Lowest tertiary
Polytechnic University
Entry requirement
Compr. school
Compr. School
Compr. school
Upper secondary
Upper secondary
Upper secondary
Length after compulsory schooling
2
3
3
3+2
3+4
3+6
Number of graduates Total 1990 1546 0 1875 2758 0 613 6792 1991 1263 0 1852 3131 0 580 6826 1992 1274 0 1869 3256 0 512 6911 1993 1436 0 2260 3194 0 638 7528 1994 1534 0 2299 2069 0 616 6518 1995 1324 0 2350 1961 189 647 6471 1996 1226 0 2096 1937 625 638 6522 1997 1624 9 1969 1846 920 637 7005 1998 1341 1020 870 1295 1022 645 6193 1999 264 1589 462 644 1482 771 5212 2000 51 2179 202 357 1900 689 5378 Total 12883 4797 18100 22448 6138 6986 71356
23
Table 2. Earnings functions with absolute and relative measures of education.
(1) (2) (3) (4) (5) Rank within cohort 0.660 0.165 0.780 0.362 0.279 (0.073)** (0.069)* (0.104)** (0.096)** (0.096)** Years of education 0.067 0.107 (0.010)** (0.009)** Years = 12 0.183 0.150 0.179 (0.028)** (0.026)** (0.026)** Years = 14 0.164 0.230 0.235 (0.057)** (0.053)** (0.053)** Years = 15.5 0.255 0.346 0.426 (0.074)** (0.068)** (0.069)** Years = 17.5 0.467 0.624 0.694 (0.094)** (0.087)** (0.240)** Female -0.083 -0.075 -0.068 (0.009)** (0.009)** (0.009)** Work experience 0.013 0.013 0.012 (0.001)** (0.001)** (0.001)** Experience squared/100 -0.004 -0.004 -0.004 (0.001)** (0.001)** (0.001)** Age 0.032 0.031 0.031 (0.004)** (0.004)** (0.004)** Age squared/100 -0.035 -0.034 -0.033 (0.006)** (0.006)** (0.006)** Swedish-speaker 0.055 0.031 0.001 (0.018)** (0.018) (0.025) Language other 0.059 0.051 0.028 (0.039) (0.039) (0.039) Observations 23946 23946 23946 23946 23946 R-squared 0.23 0.34 0.23 0.35 0.37 Effects when rank not included Years of education 0.154 0.129 Years = 12 0.361 0.232 0.242 Years = 14 0.577 0.421 0.382 Years = 15.5 0.797 0.597 0.619 Years = 17.5 1.165 0.947 0.932 All estimated equations include dummy variables for the year of graduation. Column 5 also 119 school
24
Table 3 Test of signaling and human capital models.
(1) (2) (3) (4) Education Merkonomi (331101) -0.100 -0.092 (0.316) (0.316) Merkonomi (531) 0.249 0.244 (0.018)** (0.018)** Yo – merkonomi (532) 0.397 0.204 (0.027)** (0.019)** 0.383 0.196 Tradenomi (631) 0.512 0.328 (0.027)** (0.018)** (0.027)** (0.014)** MBA (732) 0.864 0.647 0.852 0.633 (0.026)** (0.016)** (0.026)** (0.016)** Signaling effect -0.171 -0.088 (0.069)* (0.038)* HC effect 0.075 0.105 (0.063) (0.027)** Female -0.042 -0.083 -0.045 -0.088 (0.012)** (0.009)** (0.012)** (0.009)** Work experience 0.011 0.013 0.011 0.013 (0.001)** (0.001)** (0.001)** (0.001)** Experience squared/100 0.002 -0.004 0.001 -0.004 (0.002) (0.001)** (0.002) (0.001)** Age 0.029 0.044 0.033 0.048 (0.006)** (0.004)** (0.006)** (0.004)** Age squared/100 -0.031 -0.049 -0.036 -0.055 (0.009)** (0.006)** (0.009)** (0.006)** Swedish speaker 0.028 0.035 0.020 0.028 (0.023) (0.018)* (0.023) (0.018) Language other 0.013 0.052 0.006 0.045 (0.058) (0.039) (0.058) (0.039) No high school degree 0.060 0.070 0.119 0.118 (0.046) (0.032)* (0.045)** (0.032)** Matriculation exam score 0.010 0.011 0.013 0.013 (0.002)** (0.002)** (0.002)** (0.002)**
Observations 13976 23946 13976 23946 R-squared 0.31 0.34 0.31 0.34 “Signaling effect” refers to the coefficient of the interaction term between dummy variable for “Yo-merkonomi” and the fraction of polytechnic graduates. “HC-effect to the coefficient of the interaction between a dummy variable for either “Yo-merkonomi” or “Tradenomi” and the fraction of polytechnic graduates. All estimated equations include dummy variables for the year of graduation. Standard errors are in parentheses. * indicates statistical significance at 5% and ** at 1% percent level.