Embed Size (px)
Citation preview
Mar
ch 2
015
USAD Meso-level database coverageP Parthasarathy Rao, E Jagadeesh, MA Lagesh and V Surjit
DatabaseThe meso-level dataset under Village Dynamics in South Asia (VDSA) project contains data about the performance, structure and behavior of agricultural economy for India and Bangladesh at country level and its disaggregation at state, district, or province level.
The meso data is a link between country-level macro data and household level micro data that helps identify regions/districts for priority setting and targeted poverty alleviation programs (Figure 1).
Science with a human faceAbout ICRISAT: www.icrisat.orgICRISAT’s scientific information: http://EXPLOREit.icrisat.org
VILLAGE DYNAMICS IN SOUTH ASIA
Funding support:Bill & Melinda Gates Foundation
Variable and District CoverageThe database covers districts falling in 20 major states in India and includes core variables like area and production of key crops, land use, crop-wise irrigation, rainfall, input use, infrastructure, human and livestock population.
Figure 1. Linkages between meso and micro level database.
In addition, the dataset from 1990 onwards has been expanded to include soft infrastructure variables like banks, educational institutions, health centers, veterinary institutes etc. minimum and maximum temperature and gross domestic product. Since new districts are formed every year in different states, the dataset is divided into Apportioned and Un-apportioned database.
Apportioned data includes data for 1966 base district boundaries. Data on districts formed after 1966 has been apportioned back to their parent district and removed from the database. Thus, continuity of data over time is ensured for comparison of key trends at various points in time, enabling time series analysis.
At present data is available for 536 districts in un-apportioned and 305 in the apportioned dataset. For un-apportioned database, data for all districts are available from 1990-91
Figure 2. Geographic coverage of meso-data in India – 20 states.
onwards.
Sub-district level data: Sub-district level (taluka or mandal) data has been collected for districts where the VDSA villages are located in 8 states spread across 15 districts, 26 sub-districts and 30 villages.
Bangladesh Data: Database for Bangladesh includes district level data from 1951 onwards
Figure 4. Concept map of meso level data.
on agriculture and socioeconomic variables at the regional level (old district), at the district level (64 new districts) and the upazila (sub-district) level. The variables include area, production and yield of crops, irrigation data by source and by means, socio-economic, demographics and human capital indicators.
The Concept MapThe concept map was developed to provide structure of various levels of meso data being updated and organized under VDSA project. Detailed concept map of the meso dataset including levels of data and subject areas and variables are shown in Figure 4.
Figure 3. Flowchart depicting the organization of district level database, India.
Users of Meso-level DatabaseThe meso data set has been extensively used in ICRISAT strategic planning exercises and for the development of CGIAR CRPs and bilateral project proposals. It is widely used by researchers and institutions for testing hypothesis on various socio-economic issues related to agricultural production and growth.
The major users are
• Scientists within ICRISAT have used the database in framing CRP and identifying target regions and to understand trends, spatial distributions, yield variability, etc. of ICRISAT mandate legumes and cereals.
• Researchers and students for their Master’s and PhD theses • Donor organizations for their priority setting exercises (For example, the Bill and Melinda
Gates Foundation, ICAR)• The database has been shared with research scholars from Yale University (USA), World Bank,
IFPRI, IRRI, CIMMYT, Hitoba University (Japan), ISEC, Bangalore, CESS, Hyderabad, ICAR and its institutions (NCAP, CRIDA) and several other institutions both within and outside India.
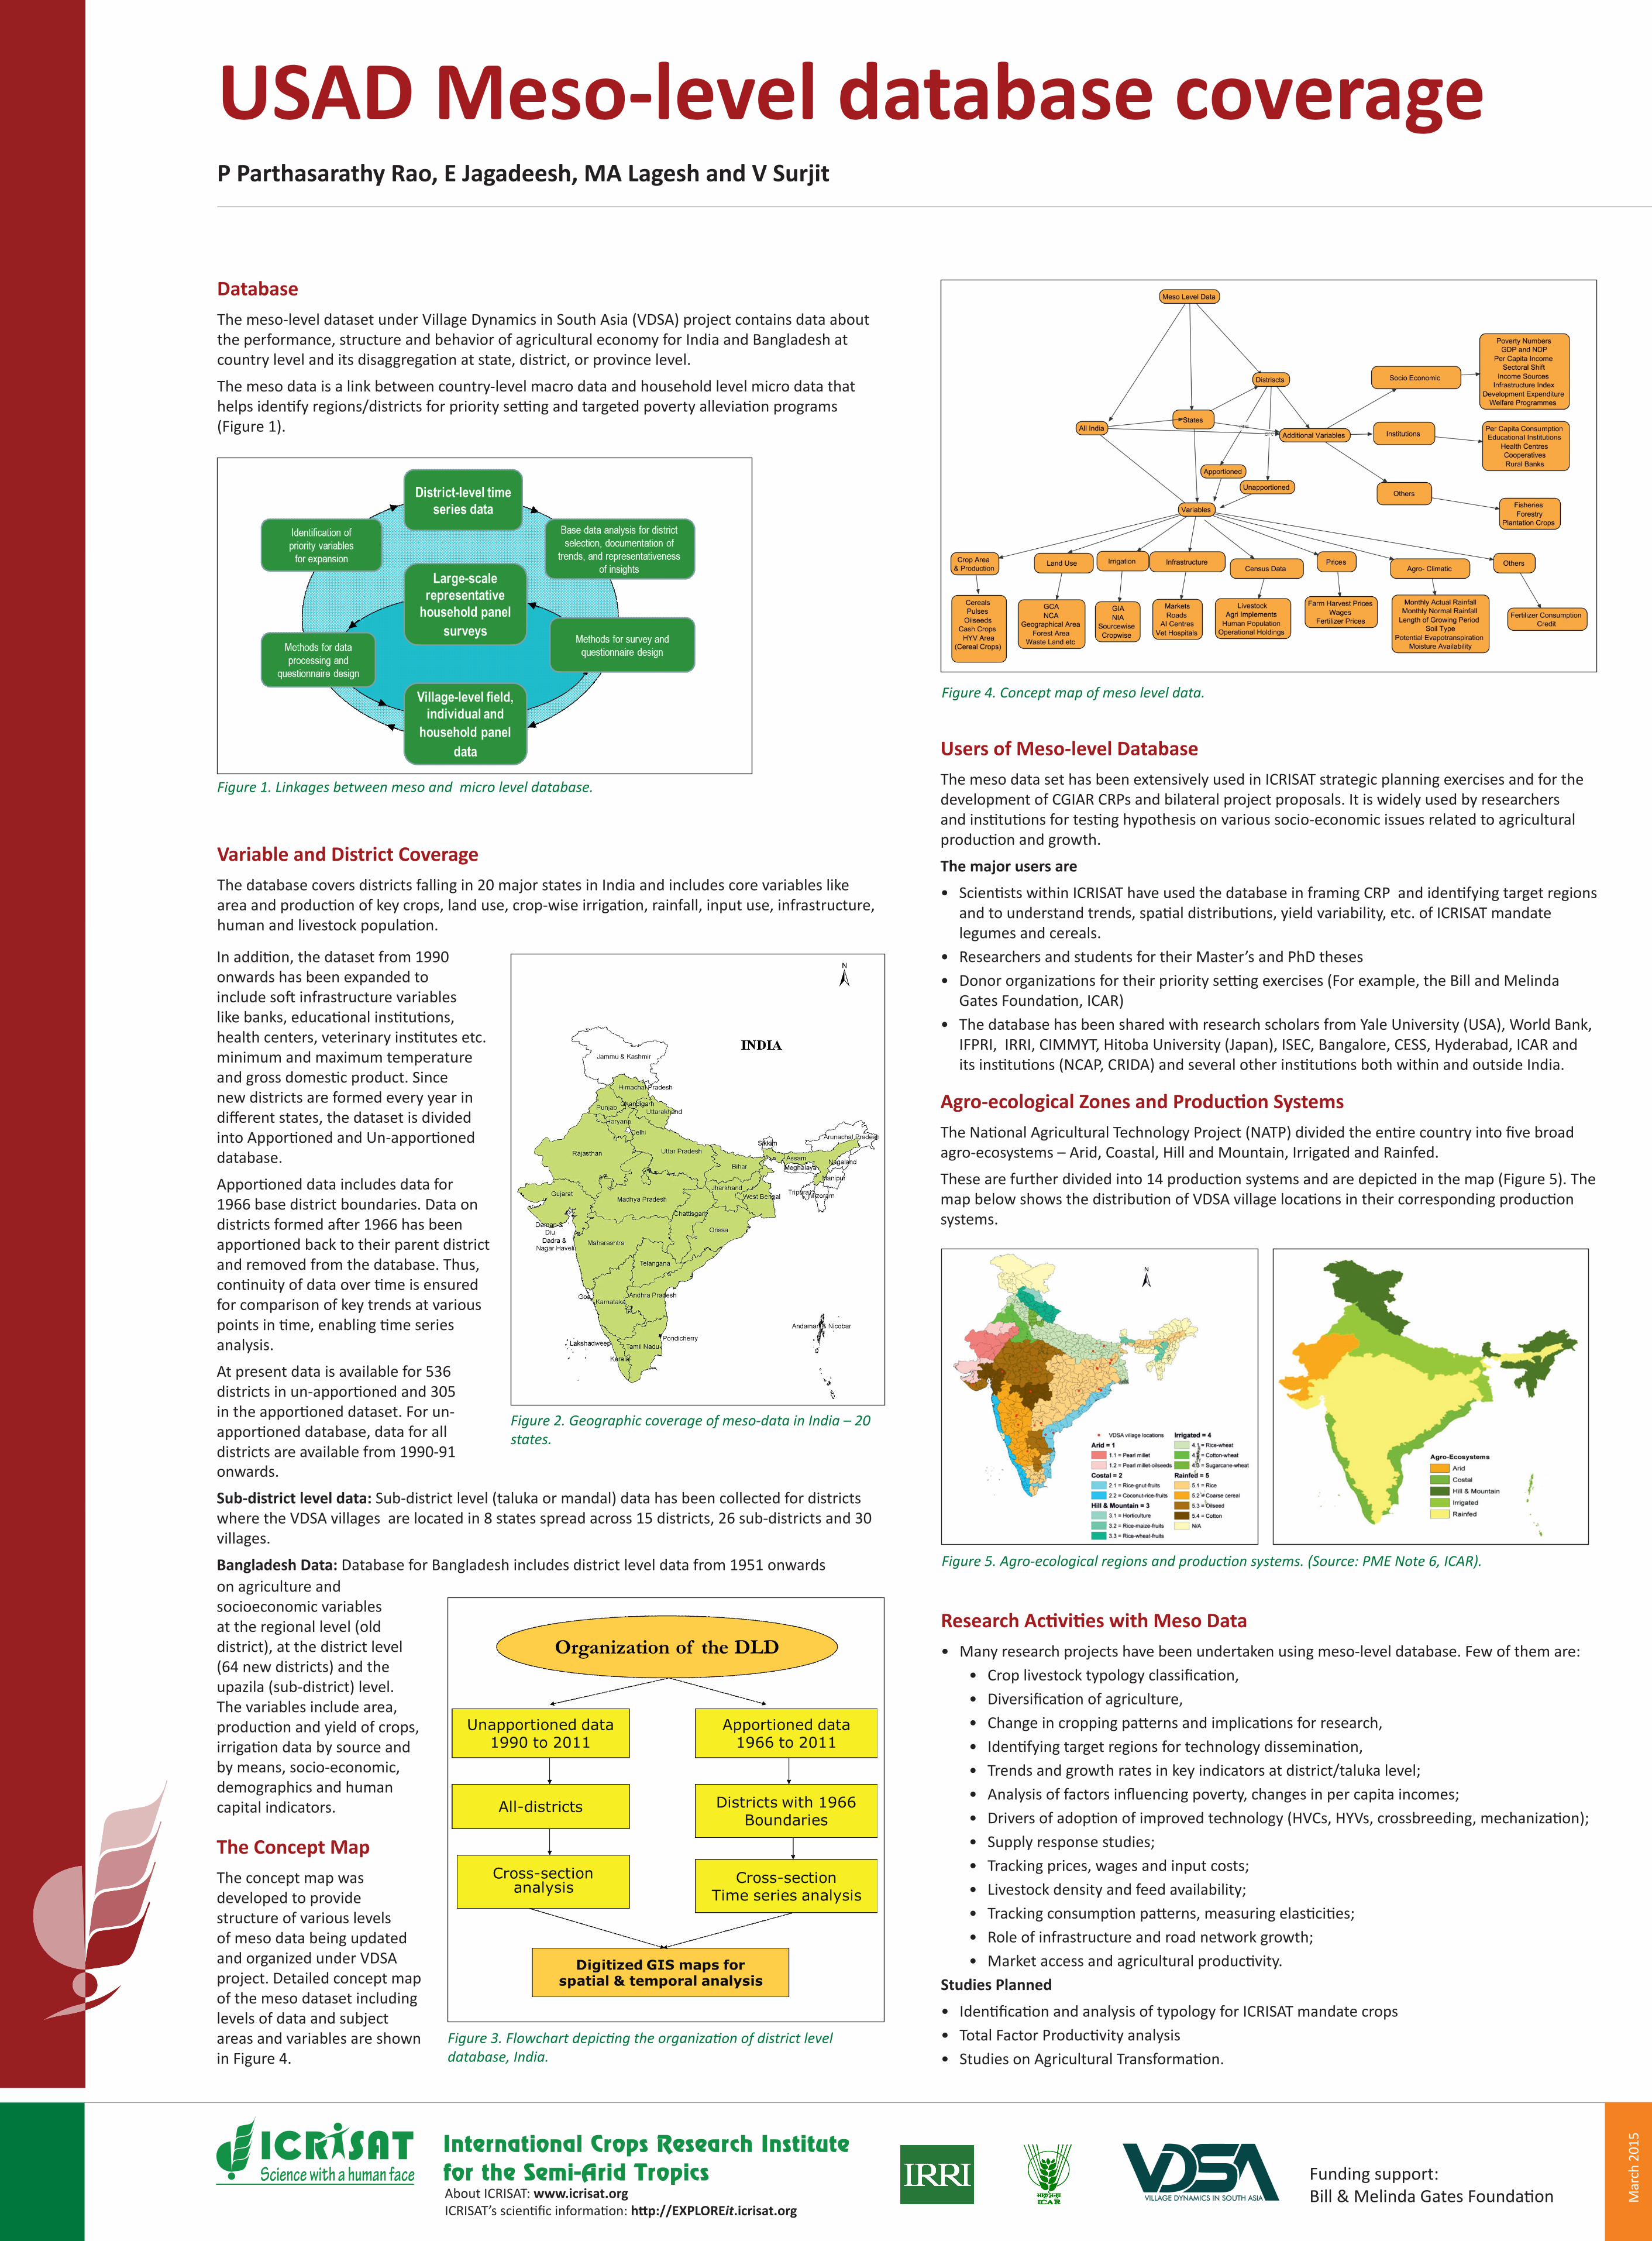
Agro-ecological Zones and Production SystemsThe National Agricultural Technology Project (NATP) divided the entire country into five broad agro-ecosystems – Arid, Coastal, Hill and Mountain, Irrigated and Rainfed.
These are further divided into 14 production systems and are depicted in the map (Figure 5). The map below shows the distribution of VDSA village locations in their corresponding production systems.
Research Activities with Meso Data• Many research projects have been undertaken using meso-level database. Few of them are:
• Crop livestock typology classification, • Diversification of agriculture, • Change in cropping patterns and implications for research, • Identifying target regions for technology dissemination, • Trends and growth rates in key indicators at district/taluka level; • Analysis of factors influencing poverty, changes in per capita incomes; • Drivers of adoption of improved technology (HVCs, HYVs, crossbreeding, mechanization); • Supply response studies; • Tracking prices, wages and input costs; • Livestock density and feed availability; • Tracking consumption patterns, measuring elasticities; • Role of infrastructure and road network growth; • Market access and agricultural productivity.
Studies Planned
• Identification and analysis of typology for ICRISAT mandate crops• Total Factor Productivity analysis • Studies on Agricultural Transformation.
Figure 5. Agro-ecological regions and production systems. (Source: PME Note 6, ICAR).