Embed Size (px)
DESCRIPTION
A scientific paper about the research about how students can be motivated through gamification to live healthier.
Citation preview
Healthify: Motivating students to live healthier
Gert VanwijnMaster Computer Science - Human-Computer InteractionDepartment of Computer Science, KU Leuven, Belgium
Abstract—In this paper the design, implementation and evalu-ation of a mobile application, called Healthify, is explained. Thisapplication is created to do research on if and how studentsbetween 18 and 29 years old, who are the main contenders tobecome overweight, can be motivated to live healthier by usinggamification-elements like badges, leaderboards and sharing onsocial media. Throughout the evaluation of the different proto-types it became clear that the input of data should be very easy forthe end user. Afterwards the motivational value of the differentgamification-elements in the design as well as the motivationalvalue of the design in general is evaluated by two experimentswith groups of students.
I. INTRODUCTION
Some of the leading causes of death in the United States areobesity, diabetes and strokes [1], which are caused by poor dietand no or not enough physical activity. The same trend existsin Europe where obesity is reaching epidemic proportions [2].Strokes are even the second leading cause of death worldwide[3].
Deliens et al. [4] indicate that the steepest rise in obesity,the period in which the most people get overweight, is situatedbetween the age of 18 and 29 and mainly with people inhigher education, meaning students. Not only the fact thatobesity is linked to many diseases, like cardiovascular diseases,strokes and even some cancers [5], but also the existingpositive correlation between health and academic results [6],are reasons for students to consciously engage with theirpersonal health. Together with rising medical costs and theaging of society [7], this argues for a more preventive approachto public health.
Such a preventive approach can be obtained by peoplekeeping an eye on and maintaining personal health themselves,by using something that is called Health 2.0 [8], which iscomparable to Web 2.0, where users can also upload theirown data, instead of only downloading content [9]. This meanspreventing diseases by preventing obesity consists of two parts.On one hand, people have to keep track of data about theirhealth, but they also have to engage in improving their healthwhen the data indicates their not living healthy enough toprevent getting overweight.
This research studies how people, and specifically students,can be motivated to keep track of and possibly improve theirpersonal health by using a design, called Healthify, that letspeople quantify themselves. Quantified Self1, as the movementis called, has many advantages. For example, people that arekeeping track of data about certain aspects of their life, in thiscase about their personal health, can gain insights about that
1http://quantifiedself.com
part of their life, by analyzing the data afterwards. What theytrack may vary from calorie intake to number of cigarettessmoked to blood pressure or heart rate.
II. GOAL
The goal of Healthify is to motivate students to livehealthier. These students are between 18 and 29 years old andstudy and live in a student city, like for example the Belgiancity of Leuven. Living healthy is defined as eating more fruitand less food with a high amount of fat and being active atleast 30 minutes a day for most days in the week [10]. Tokeep track of how healthy a student is living, data about foodintake and activities is needed.
Every application that needs to motivate its users hasto integrate elements in its user interface that increase theengagement with the user [11]. One way to do this, is to presentthe information in an intuitive and meaningful way, whichmakes it obvious which action(s) the user has to undertaketo make progress or at least to not deteriorate. On the otherhand, the user can also be motivated through social mediaand gamification-elements [12], like badges and competitionsbetween friends [13].
III. RELATED WORK
A lot of applications, which help users keep track of theircalories, already exist. By comparing them, strong points aswell as flaws can be identified and can be respectively used oravoided when designing Healthify. The applications that werecompared are MyFitnessPal2, LiveStrong’s MyPlate3, CalorieCount4 and Fitbit5. These applications were chosen becausethey are amongst the most used applications in the domain ofpersonal health.
By first drafting some criteria for comparison of the chosenapplications, it is easier to identify the strong and weak pointsof each application individually as well as to see what allapplications do and don’t have in common. Examples of theused criteria are methods of getting the data, use of goalsand gamification, the posibillity to add and communicate withfriends and the integration of social media.
The main strong points of these applications are all ap-plications, except LiveStrong’s Myplate, track burned caloriesautomatically and give users the possibility to add friends[14],[15] and that all applications give some advice aboutliving healthy. Negative points are that the applications don’t or
2http://www.myfitnesspal.com3http://www.livestrong.com/myplate/4http://caloriecount.about.com5http://www.fitbit.com
barely use motivational elements that try to stimulate users toreach their goals [16] and only the Fitbit-application providesa connection to social media [17].
IV. DESIGN
The first step of the quantified self-process is capturingthe data, which should have a minimal impact on the userexperience with the application. There are two extremes fordoing this. On one hand there is the complete manual input ofdata, which means the user is fully responsible for inputtingall relevant data. On the other hand all data could be collectedautomatically, so the user is relieved of this task [18]. However,a combination of both extremes is needed, because not allburned calories can be tracked automatically and data aboutcalorie intake are even harder to collect without help from theuser. While it is obvious the user’s help is needed in loggingthe necessary data, the user should be relieved as much as ispossible, by making the input proces easy and fast [19].
By 2017 there will be more than three billion smartphonesin the world [20] and according to a study of Dey et al. [21]these smartphones are 53% of the time within the reach ofthe owner and 88% of the time in the same room. This makesthe smartphone the ideal medium to collect data about theeveryday activities of their owners, because it can track somedata automatically and it is within reach when the user needsto do the input manually.
To simplify the task of the user for logging burned caloriesHealthify provides to possibility to connect with a pedometer,which is an application that logs the amount of steps the usertakes and the calories that are burned by doing this. If usersare carrying their smartphone with them, it will automaticallylog how much calories they are burning without interruptingthe users’ day-to-day activities. The input of calorie intake canalso be made easier by updating the user’s location when heor she is moving around and checking if a restaurant or bar isin the neighborhood, so the user can be notified with a list ofpossible dishes and doesn’t forget to log if he or she has eatensomething. By connecting this automatic tracking of burnedcalories and using location info to make input of calorie intakefaster and easier, the user is to a large extent relieved of theburden of pure manual input.
A. Motivational elements
The research that is done, is mainly about how students canbe motivated to live healthier. Lee & Hammer [22] indicate thatgamification-elements in videogames are motivating becauseof their impact on the cognitive, emotional and social areaof the players. If gamification is used in other fields thanvideogames, it should also focus on these three areas. Thedesign, that is created for this research, tries to get motivationfrom two different sources. First of all, the design itself triesto motivate its users by providing a system of badges, that canfor example be earned by eating fruit or doing exercise severaldays in a row. By awarding these badges immediately aftera task is completed, the user is stimulated in the emotionalarea [23]. To motivate the user in the cognitive area, it isimportant to make sure users know what they have to doto earn a badge [24]. The social cognitive theory [25] andthe transtheoretical model [26] indicate that the user needs
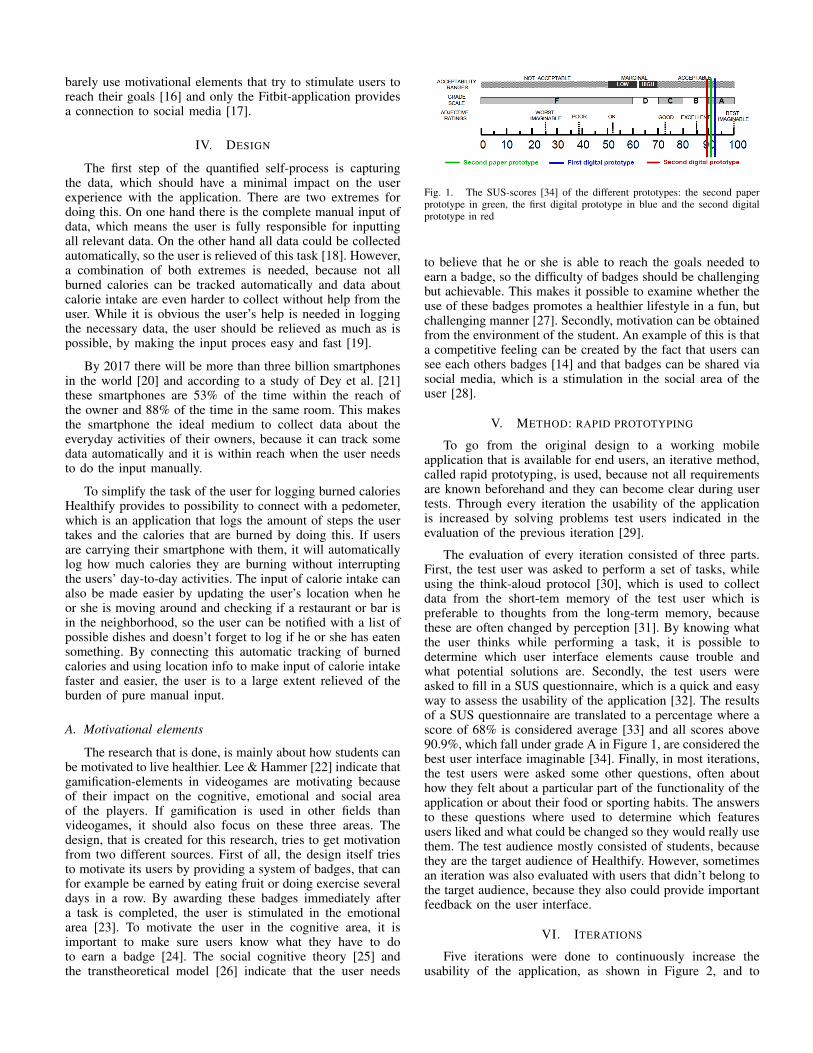
Fig. 1. The SUS-scores [34] of the different prototypes: the second paperprototype in green, the first digital prototype in blue and the second digitalprototype in red
to believe that he or she is able to reach the goals needed toearn a badge, so the difficulty of badges should be challengingbut achievable. This makes it possible to examine whether theuse of these badges promotes a healthier lifestyle in a fun, butchallenging manner [27]. Secondly, motivation can be obtainedfrom the environment of the student. An example of this is thata competitive feeling can be created by the fact that users cansee each others badges [14] and that badges can be shared viasocial media, which is a stimulation in the social area of theuser [28].
V. METHOD: RAPID PROTOTYPING
To go from the original design to a working mobileapplication that is available for end users, an iterative method,called rapid prototyping, is used, because not all requirementsare known beforehand and they can become clear during usertests. Through every iteration the usability of the applicationis increased by solving problems test users indicated in theevaluation of the previous iteration [29].
The evaluation of every iteration consisted of three parts.First, the test user was asked to perform a set of tasks, whileusing the think-aloud protocol [30], which is used to collectdata from the short-tem memory of the test user which ispreferable to thoughts from the long-term memory, becausethese are often changed by perception [31]. By knowing whatthe user thinks while performing a task, it is possible todetermine which user interface elements cause trouble andwhat potential solutions are. Secondly, the test users wereasked to fill in a SUS questionnaire, which is a quick and easyway to assess the usability of the application [32]. The resultsof a SUS questionnaire are translated to a percentage where ascore of 68% is considered average [33] and all scores above90.9%, which fall under grade A in Figure 1, are considered thebest user interface imaginable [34]. Finally, in most iterations,the test users were asked some other questions, often abouthow they felt about a particular part of the functionality of theapplication or about their food or sporting habits. The answersto these questions where used to determine which featuresusers liked and what could be changed so they would really usethem. The test audience mostly consisted of students, becausethey are the target audience of Healthify. However, sometimesan iteration was also evaluated with users that didn’t belong tothe target audience, because they also could provide importantfeedback on the user interface.
VI. ITERATIONS
Five iterations were done to continuously increase theusability of the application, as shown in Figure 2, and to
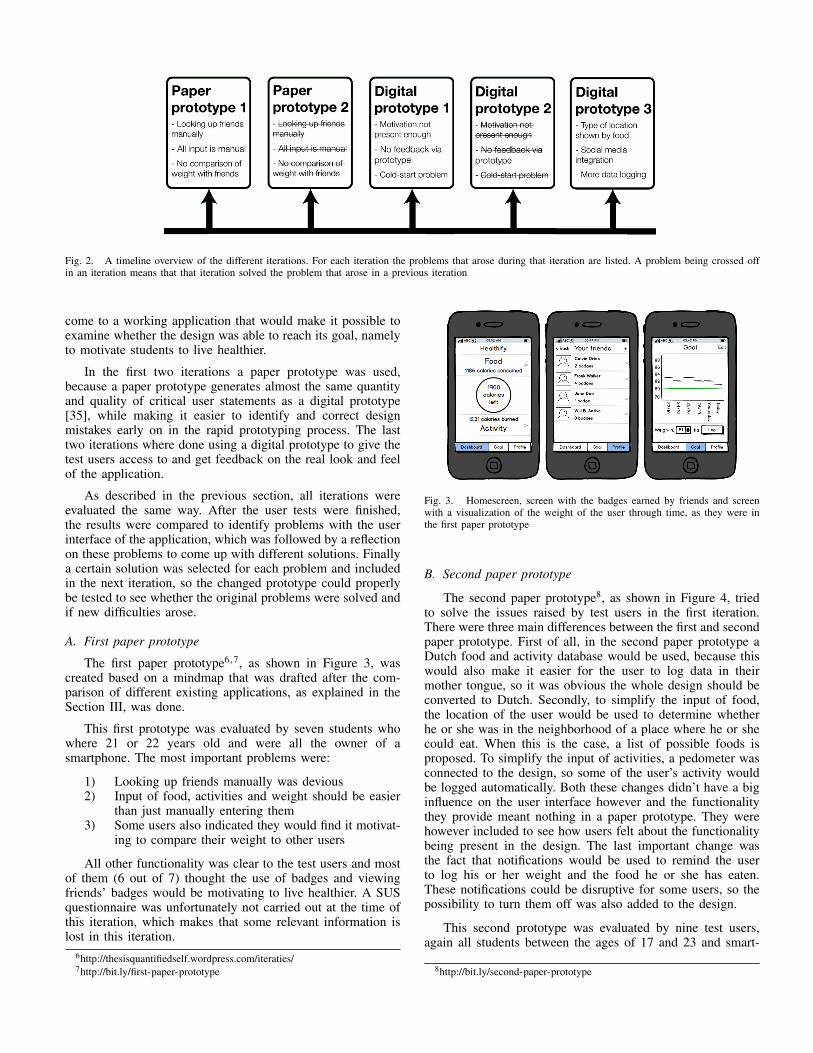
Fig. 2. A timeline overview of the different iterations. For each iteration the problems that arose during that iteration are listed. A problem being crossed offin an iteration means that that iteration solved the problem that arose in a previous iteration
come to a working application that would make it possible toexamine whether the design was able to reach its goal, namelyto motivate students to live healthier.
In the first two iterations a paper prototype was used,because a paper prototype generates almost the same quantityand quality of critical user statements as a digital prototype[35], while making it easier to identify and correct designmistakes early on in the rapid prototyping process. The lasttwo iterations where done using a digital prototype to give thetest users access to and get feedback on the real look and feelof the application.
As described in the previous section, all iterations wereevaluated the same way. After the user tests were finished,the results were compared to identify problems with the userinterface of the application, which was followed by a reflectionon these problems to come up with different solutions. Finallya certain solution was selected for each problem and includedin the next iteration, so the changed prototype could properlybe tested to see whether the original problems were solved andif new difficulties arose.
A. First paper prototype
The first paper prototype6,7, as shown in Figure 3, wascreated based on a mindmap that was drafted after the com-parison of different existing applications, as explained in theSection III, was done.
This first prototype was evaluated by seven students whowhere 21 or 22 years old and were all the owner of asmartphone. The most important problems were:
1) Looking up friends manually was devious2) Input of food, activities and weight should be easier
than just manually entering them3) Some users also indicated they would find it motivat-
ing to compare their weight to other users
All other functionality was clear to the test users and mostof them (6 out of 7) thought the use of badges and viewingfriends’ badges would be motivating to live healthier. A SUSquestionnaire was unfortunately not carried out at the time ofthis iteration, which makes that some relevant information islost in this iteration.
6http://thesisquantifiedself.wordpress.com/iteraties/7http://bit.ly/first-paper-prototype
Fig. 3. Homescreen, screen with the badges earned by friends and screenwith a visualization of the weight of the user through time, as they were inthe first paper prototype
B. Second paper prototype
The second paper prototype8, as shown in Figure 4, triedto solve the issues raised by test users in the first iteration.There were three main differences between the first and secondpaper prototype. First of all, in the second paper prototype aDutch food and activity database would be used, because thiswould also make it easier for the user to log data in theirmother tongue, so it was obvious the whole design should beconverted to Dutch. Secondly, to simplify the input of food,the location of the user would be used to determine whetherhe or she was in the neighborhood of a place where he or shecould eat. When this is the case, a list of possible foods isproposed. To simplify the input of activities, a pedometer wasconnected to the design, so some of the user’s activity wouldbe logged automatically. Both these changes didn’t have a biginfluence on the user interface however and the functionalitythey provide meant nothing in a paper prototype. They werehowever included to see how users felt about the functionalitybeing present in the design. The last important change wasthe fact that notifications would be used to remind the userto log his or her weight and the food he or she has eaten.These notifications could be disruptive for some users, so thepossibility to turn them off was also added to the design.
This second prototype was evaluated by nine test users,again all students between the ages of 17 and 23 and smart-
8http://bit.ly/second-paper-prototype
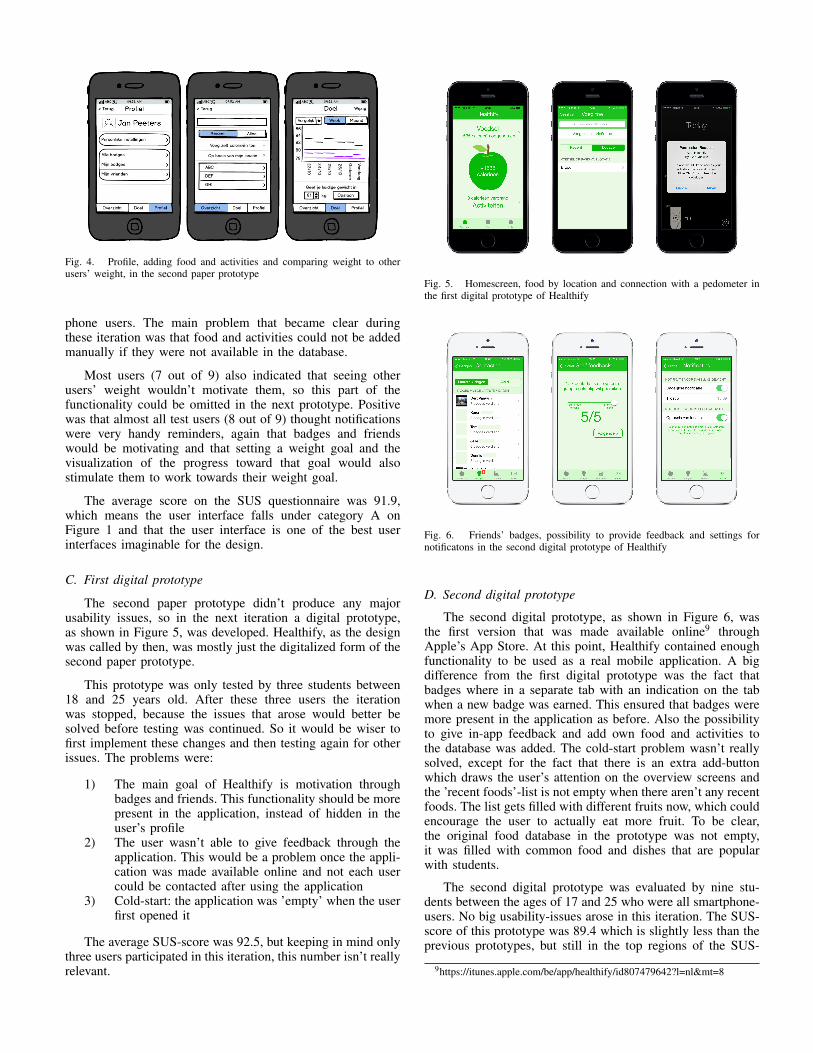
Fig. 4. Profile, adding food and activities and comparing weight to otherusers’ weight, in the second paper prototype
phone users. The main problem that became clear duringthese iteration was that food and activities could not be addedmanually if they were not available in the database.
Most users (7 out of 9) also indicated that seeing otherusers’ weight wouldn’t motivate them, so this part of thefunctionality could be omitted in the next prototype. Positivewas that almost all test users (8 out of 9) thought notificationswere very handy reminders, again that badges and friendswould be motivating and that setting a weight goal and thevisualization of the progress toward that goal would alsostimulate them to work towards their weight goal.
The average score on the SUS questionnaire was 91.9,which means the user interface falls under category A onFigure 1 and that the user interface is one of the best userinterfaces imaginable for the design.
C. First digital prototype
The second paper prototype didn’t produce any majorusability issues, so in the next iteration a digital prototype,as shown in Figure 5, was developed. Healthify, as the designwas called by then, was mostly just the digitalized form of thesecond paper prototype.
This prototype was only tested by three students between18 and 25 years old. After these three users the iterationwas stopped, because the issues that arose would better besolved before testing was continued. So it would be wiser tofirst implement these changes and then testing again for otherissues. The problems were:
1) The main goal of Healthify is motivation throughbadges and friends. This functionality should be morepresent in the application, instead of hidden in theuser’s profile
2) The user wasn’t able to give feedback through theapplication. This would be a problem once the appli-cation was made available online and not each usercould be contacted after using the application
3) Cold-start: the application was ’empty’ when the userfirst opened it
The average SUS-score was 92.5, but keeping in mind onlythree users participated in this iteration, this number isn’t reallyrelevant.
Fig. 5. Homescreen, food by location and connection with a pedometer inthe first digital prototype of Healthify
Fig. 6. Friends’ badges, possibility to provide feedback and settings fornotificatons in the second digital prototype of Healthify
D. Second digital prototype
The second digital prototype, as shown in Figure 6, wasthe first version that was made available online9 throughApple’s App Store. At this point, Healthify contained enoughfunctionality to be used as a real mobile application. A bigdifference from the first digital prototype was the fact thatbadges where in a separate tab with an indication on the tabwhen a new badge was earned. This ensured that badges weremore present in the application as before. Also the possibilityto give in-app feedback and add own food and activities tothe database was added. The cold-start problem wasn’t reallysolved, except for the fact that there is an extra add-buttonwhich draws the user’s attention on the overview screens andthe ’recent foods’-list is not empty when there aren’t any recentfoods. The list gets filled with different fruits now, which couldencourage the user to actually eat more fruit. To be clear,the original food database in the prototype was not empty,it was filled with common food and dishes that are popularwith students.
The second digital prototype was evaluated by nine stu-dents between the ages of 17 and 25 who were all smartphone-users. No big usability-issues arose in this iteration. The SUS-score of this prototype was 89.4 which is slightly less than theprevious prototypes, but still in the top regions of the SUS-
9https://itunes.apple.com/be/app/healthify/id807479642?l=nl&mt=8
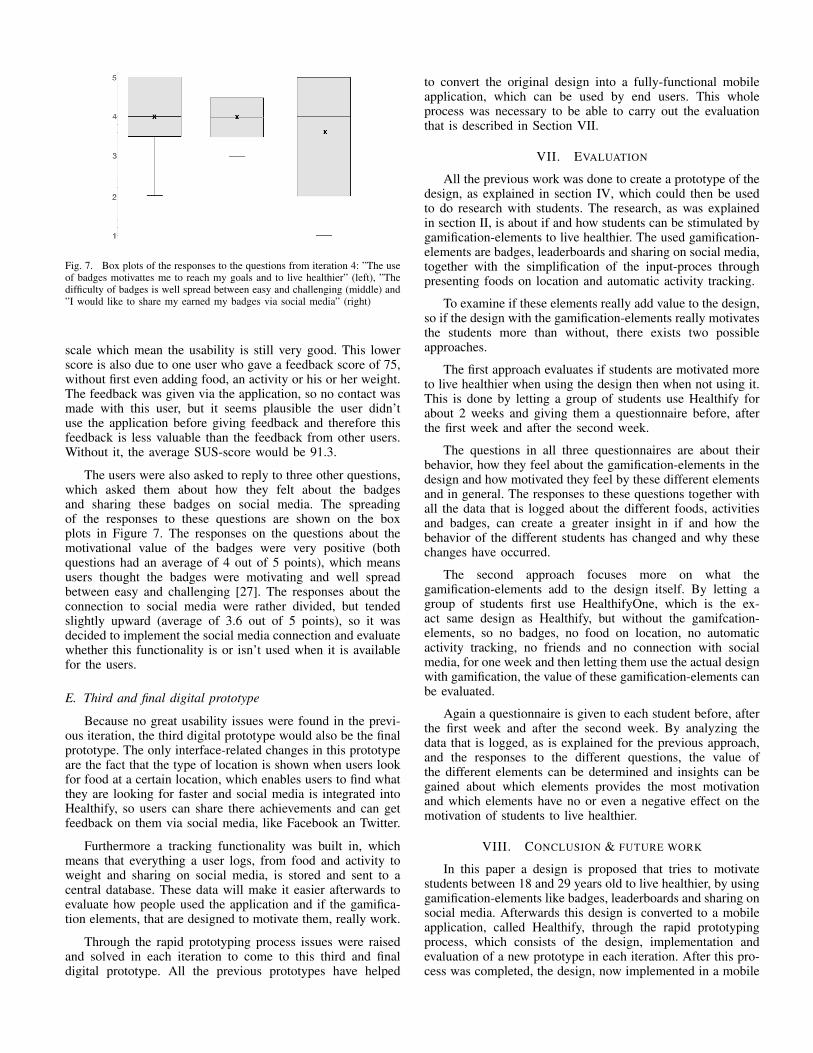
Fig. 7. Box plots of the responses to the questions from iteration 4: ”The useof badges motivattes me to reach my goals and to live healthier” (left), ”Thedifficulty of badges is well spread between easy and challenging (middle) and”I would like to share my earned my badges via social media” (right)
scale which mean the usability is still very good. This lowerscore is also due to one user who gave a feedback score of 75,without first even adding food, an activity or his or her weight.The feedback was given via the application, so no contact wasmade with this user, but it seems plausible the user didn’tuse the application before giving feedback and therefore thisfeedback is less valuable than the feedback from other users.Without it, the average SUS-score would be 91.3.
The users were also asked to reply to three other questions,which asked them about how they felt about the badgesand sharing these badges on social media. The spreadingof the responses to these questions are shown on the boxplots in Figure 7. The responses on the questions about themotivational value of the badges were very positive (bothquestions had an average of 4 out of 5 points), which meansusers thought the badges were motivating and well spreadbetween easy and challenging [27]. The responses about theconnection to social media were rather divided, but tendedslightly upward (average of 3.6 out of 5 points), so it wasdecided to implement the social media connection and evaluatewhether this functionality is or isn’t used when it is availablefor the users.
E. Third and final digital prototype
Because no great usability issues were found in the previ-ous iteration, the third digital prototype would also be the finalprototype. The only interface-related changes in this prototypeare the fact that the type of location is shown when users lookfor food at a certain location, which enables users to find whatthey are looking for faster and social media is integrated intoHealthify, so users can share there achievements and can getfeedback on them via social media, like Facebook an Twitter.
Furthermore a tracking functionality was built in, whichmeans that everything a user logs, from food and activity toweight and sharing on social media, is stored and sent to acentral database. These data will make it easier afterwards toevaluate how people used the application and if the gamifica-tion elements, that are designed to motivate them, really work.
Through the rapid prototyping process issues were raisedand solved in each iteration to come to this third and finaldigital prototype. All the previous prototypes have helped
to convert the original design into a fully-functional mobileapplication, which can be used by end users. This wholeprocess was necessary to be able to carry out the evaluationthat is described in Section VII.
VII. EVALUATION
All the previous work was done to create a prototype of thedesign, as explained in section IV, which could then be usedto do research with students. The research, as was explainedin section II, is about if and how students can be stimulated bygamification-elements to live healthier. The used gamification-elements are badges, leaderboards and sharing on social media,together with the simplification of the input-proces throughpresenting foods on location and automatic activity tracking.
To examine if these elements really add value to the design,so if the design with the gamification-elements really motivatesthe students more than without, there exists two possibleapproaches.
The first approach evaluates if students are motivated moreto live healthier when using the design then when not using it.This is done by letting a group of students use Healthify forabout 2 weeks and giving them a questionnaire before, afterthe first week and after the second week.
The questions in all three questionnaires are about theirbehavior, how they feel about the gamification-elements in thedesign and how motivated they feel by these different elementsand in general. The responses to these questions together withall the data that is logged about the different foods, activitiesand badges, can create a greater insight in if and how thebehavior of the different students has changed and why thesechanges have occurred.
The second approach focuses more on what thegamification-elements add to the design itself. By letting agroup of students first use HealthifyOne, which is the ex-act same design as Healthify, but without the gamifcation-elements, so no badges, no food on location, no automaticactivity tracking, no friends and no connection with socialmedia, for one week and then letting them use the actual designwith gamification, the value of these gamification-elements canbe evaluated.
Again a questionnaire is given to each student before, afterthe first week and after the second week. By analyzing thedata that is logged, as is explained for the previous approach,and the responses to the different questions, the value ofthe different elements can be determined and insights can begained about which elements provides the most motivationand which elements have no or even a negative effect on themotivation of students to live healthier.
VIII. CONCLUSION & FUTURE WORK
In this paper a design is proposed that tries to motivatestudents between 18 and 29 years old to live healthier, by usinggamification-elements like badges, leaderboards and sharing onsocial media. Afterwards this design is converted to a mobileapplication, called Healthify, through the rapid prototypingprocess, which consists of the design, implementation andevaluation of a new prototype in each iteration. After this pro-cess was completed, the design, now implemented in a mobile
application, was ready to be used by the target audience, beingstudents.
This whole process needed to be done to be able toevaluatie whether the integrated gamification elements wereable to actually motivate students to change their lifestyle orto keep up their healthy lifestyle. Using the resulting mobileapplication two types of examinations are done to evaluate themotivational value of the individual gamification elements andthe design in general.
At the time of writing the rapid prototyping proces, asexplained in section V and VI, is finished and the evaluation,as described in Section VII, is underway.
REFERENCES
[1] Ali H. Mokdad, James S. Marks, Donna F. Stroup, and Julie L.Gerberding. Actual causes of death in the united states. Journal ofthe American Medical Association, 291(10):1238–1245, 2004.
[2] Anne Berghofer, Tobias Pischon, Thomas Reinhold, Caroline M. Apo-vian, Arya M. Sharma, and Stefan N. Willich. Obesity prevalencefrom a european perspective: a systematic review. BMC Public Health,8(1):200, 2008.
[3] Amytis Towfighi and Jeffrey L. Saver. Stroke declines from third tofourth leading cause of death in the united states: Historical perspectiveand challenges ahead. Stroke, 42(8):2351–2355, 2011.
[4] Tom Deliens, Peter Clarys, Linde Van Hecke, Ilse De Bourdeaudhuij,and Benedicte Deforche. Changes in weight and body compositionduring the first semester at university. a prospective explanatory study.Appetite, 65(1):111–116, 2013.
[5] Carey N. Lumeng and Alan R. Saltiel. Inflammatory links betweenobesity and metabolic disease. The Journal Of Clinical Investigation,121(6):2111–211e, 2011.
[6] Cynthia Wolford Symons, Bethann Cinelli, Tammy C. James, and PattiGroff. Bridging student health risks and academic achievement throughcomprehensive school health programs. Journal of School Health,67(6):220–227, 1997.
[7] Y Claire Wang, Klim McPherson, Tim Marsh, Steven L. Gortmaker, andMartin Brown. Health and economic burden of the projected obesitytrends in the usa and the uk. Journal of the National Cancer Institute,103(2):117–128, 2011.
[8] Gunther Eysenbach. Medicine 2.0: Social networking, collaboration,participation, apomediation, and openness. Journal of Medical InternetResearch, 10(3), 2008.
[9] Tim O’Reilly. What is web 2.0: Design patterns and business modelsfor the next generation of software. Communications & strategies, 65,2007.
[10] Richard Lowry, Deborah A. Galuska, Janet E. Fulton, Howell Wechsler,Laura Kann, and Janet L. Collins. Physical activity, food choice, andweight management goals and practices among u.s. college students.American Journal of Preventive Medicine, 8(1):18–27, 2000.
[11] Edwin A. Locke and Gary P. Latham. New directions in goal-settingtheory. Current Directions in Psychological Science, 15(5):265–268,2006.
[12] Adrian Domınguez, Joseba Saenz de Navarrete, Luis de Marcos,Luis Fernandez-Sanz, Carmen Pages, and Jose-Javier Martınez-Herraiz.Gamifying learning experiences: Practical implications and outcomes.Computers & Education, 63:380–392, 2013.
[13] Sebastian Deterding, Miguel Sicart, Lennart Nacke, Kenton O’Hara,and Dan Dixon. Gamification: Using game design elements in non-gaming contexts. CHI ’11 Extended Abstracts on Human Factors inComputing Systems, pages 2425–2428, 2011.
[14] Louise Barkhuus, Julie Maitland, Ian Anderson, Scott Sherwood, Mal-colm Hall, and Matthew Chalmers. Shakra: Sharing and motivatingawareness of everyday activity. In Ubicomp 2006, ACM Press, 2006.
[15] Noreen Kamal, Sidney Fels, and Kendall Ho. Online social networksfor personal informatics to promote positive health behavior. WSM ’10Proceedings of second ACM SIGMM workshop on Social media, pages47–52, 2010.
[16] Amon Rapp. Beyond gamification: Enhancing user engagement throughmeaningful game elements.
[17] Sunny Consolvo, Katherine Everitt, Ian Smith, and James A. Landay.Design requirements for technologies that encourage physical activity.CHI ’06 Proceedings of the SIGCHI Conference on Human Factors inComputing Systems, pages 457–466, 2006.
[18] Nicholas D. Lane, Emiliano Miluzzo, Hong Lu, Daniel Peebles,Tanzeem Choudhury, and Andrew T. Campbell. A survey of mobilephone sensing. Communications Magazine, IEEE, 48(9):140–150, 2010.
[19] Jody Hausmann, Katarzyna Wac, and Julien Bonjour. Phone in thepocket: Pervasive self-tracking of physical activity levels. 2012 AAAISpring Symposium Series, 2012.
[20] Joshua Pramis. By 2017 there will almost be as many smart-phones as literate adults. http://www.digitaltrends.com/mobile/2017-literate-adults-smartphones/, May 2013, visited on 22-02-2014.
[21] Anind K. Dey, Katarzyna Wac, Denzil Ferreira, Kevin Tassini, Jin-HyukHong, and Julian Rojas. Getting closer: An empirical investigation ofthe proximity of user to their smart phones. UbiComp Proceedingsof the 13th international conference on Ubiquitous computing, pages163–172, 2011.
[22] Joey J. Lee and Jessica Hammer. Gamification in education: What,how, why bother? Exchange Organizational Behavior Teaching Journal,15(2):1–5, 2011.
[23] M. Csikszentmihalyi and Isabella Selega. Optimal experience: Psycho-logical studies of flow in consciousness. Cambridge University Press,1992.
[24] J.P. Gee. What video games have to teach us about learning and literacy.Computers in Entertainment, 1(1):20, 20 2003.
[25] Phillip B. Sparling, Neville Owen, Estelle V. Lambert, and William L.Haskell. Promoting physical activity: the new imperative for publichealth. Health Education Research, 15(3):367–376, 2000.
[26] Sunny Consolvo, David W. Mcdonald, and James A. Landay. Theory-driven design strategies for technologies that support behavior changein everyday life. CHI ’09: Proceedings of the 27th InternationalConference on Human Factors in Computing Systems, pages 405–414,2009.
[27] Thomas G. Power, Ruth C. Bindler, Summer Goetz, and Kenneth B.Daratha. Obesity prevention in early adolescence: Student, parent, andteacher views. Journal of School Health, 80(1):13–19, 2010.
[28] Joey J. Lee and Chris Hoadley. Leveraging identity to make learningfun: Possible selves and experiential learning in massively multiplayeronline games (mmogs). Innovate: Journal of Online Education, 3(6),2007.
[29] Nielsen J. Iterative user-interface design. Computer, 26(11):32–41,1993.
[30] Riita Jaaskelainen. Handbook of Translation Studies, chapter Think-aloud protocol. John Benjamins Publishing Company, 2010.
[31] Christopher J. Johnstone, Nicole A. Bottsford-Miller, and Sandra J.Thompson. Using the think aloud method (cognitive labs) to evaluatetest design for students with disabilities and english language learn-ers. http://www.cehd.umn.edu/nceo/OnlinePubs/Tech44/, August 2006,visited on 24-02-2014.
[32] Aaron Bangor, Philip T. Kortum, and James T. Miller. An empiricalevaluation of the system usability scale. International Journal ofHuman-Computer Interaction, 24(6):574–594, 2008.
[33] Jeff Sauro. Measuring usability with the system usability scale (sus).http://www.measuringusability.com/sus.php, February 2011, visited on24-02-2014.
[34] Aaron Bangor, Philip Kortum, and James Miller. Determining whatindividual sus scores mean: Adding an adjective rating scale. Journalof Usability Studies, 4(3):114–123, 2009.
[35] Sefelin Reinhard, Tscheligi Manfred, and Giller Verena. Paper proto-typing - what is it good for?: a comparison of paper- and computer-based low-fidelity prototyping. CHI ’03 Extended Abstracts on HumanFactors in Computing Systems, pages 778–779, 2003.