Embed Size (px)
DESCRIPTION
The UDOH PANO Program and partners statewide aim to address barriers through changes in policies and environments where healthy foods and opportunities for physical activity are offered.
Citation preview
Choice
Hea
lthy
The Easy Choice
Utah Nutrition and Physical Activity Plan 2010 to 2020
The Utah Nutrition and Physical Activity Plan is a result of numerous individuals who devoted their time
and effort to the creation of this plan. This endeavor could not have happened without the hard work
and commitment that was displayed from public and private partners who worked through work groups
representing a variety of settings.
Special thanks goes to Karen Nellist for serving as the primary author of the plan.
Additional thanks to the Physical Activity, Nutrition, and Obesity (PANO) program staff:
Lynda Blades, Program Manager
Tania Charette, Media Coordinator
Patrice Isabella, Nutrition Coordinator
Brett McIff, Physical Activity Coordinator
Karen Nellist, Epidemiologist/Evaluator
Janet Scarlet, Administrative Assistant
All contributors (listed on pages 6 to 9) are owed a huge debt of gratitute for providing their time,
suggestions, and insights on addressing obesity in Utah and for providing feedback on drafts of this plan.
This plan was prepared by the Utah Department of Health with funding provided through a Cooperative Agreement with the Centers for Disease Control and Prevention, Division of Nutrition and Physical Activity (U58/DP001386).
This state plan may be reproduced and distributed without permission.
SuggeSted citation: Utah Nutrition and Physical Activity Plan 2010 to 2020. (2010) Salt Lake City, Utah: Utah Department of Health. Available for download at http://www.health.utah.gov/obesity.
RepoRt publiShed apRil 2010.
Some images in this document are the copyright property of Jupiter Images and are being used with permission under license. These images and/or photos may not be copied or downloaded without permission from Jupiter Images.
Cover design and report layout by Spatafore and Associates, Salt Lake City, Utah.
Citation and Acknowledgements
Utah Nutrition and Physical Activity Plan
2010 to 2020
Making the healthy choice
the easy choice.
Utah Nutrition and Physical Activity Plan 2010-2020
Making the Healthy Choice the Easy Choice
Utah Nutrition and Physical Activity Plan 2010-2020
Listing of Individuals who Contributed to the Development of the State Plan:The Utah Physical Activity, Nutrition, and Obesity Program would like to thank the f ollowing individuals for their time and energy in preparing this document.
Lynda Blades, MPH, CHESPANO Program Manager Physical Activity, Nutrition & Obesity (PANO) Program Utah Department of Health (UDOH)
Lisa Blanck, BS, CHES Obesity Prevention Specialist Salt Lake Valley Health Department
Heather Borski, MPH, CHES Bureau Director Bureau of Health Promotion (UDOH)
Sharon Briggs Bicycle Pedestrian Coordinator Utah Department of Transportation
Scott Brown, MS State Health Alliance Director American Heart Association
Richard Bullough, PhD Diabetes Program Manager Diabetes Prevention Program (UDOH)
Shaunna Burbidge, PhD Professor College of Health Health Promotion and Education University of Utah
Emily Carlson Clinical Quality Coordinator Association for Utah Community Health
Cathy Chambless, PhD, MPA, CRC Disability Policy Consultant Center for Public Policy and Administration University of Utah
Tania Charette, MPH, CHES Public Information Specialist Heart Disease & Stroke Prevention Program & PANO (UDOH)
Lauren Clark, RN, PhD, FAAN Professor and PhD Program Director College of Nursing University of Utah
Gina Cornia Director Utahns Against Hunger/Utah Food Policy Council
Emma Crandall Regence Wellness Consultant LBS Benefits
Rochelle Creager, BS Community Health Education Specialist Weber-Morgan Health Department
Megan Crowley Administrative Program Coordinator Technology and Government Research Center for Public Policy and Administration University of Utah
Julia Currey Sales Manager Utah Valley Convention & Visitors Bureau
Julie Day, MD Medical Director Redwood Health Center University of Utah Clinics
Sandra DeBry, MBA Quality Improvement Specialist U of U Division of General Pediatrics-UPIQ
Listing of Individuals who Contributed to the Development of the State Plan:The Utah Physical Activity, Nutrition, and Obesity Program would like to thank the f ollowing individuals for their time and energy in preparing this document.
Utah Nutrition and Physical Activity Plan 2010-2020
Making the Healthy Choice the Easy Choice
Jessica DeMill, BS Policy Coordinator Gold Medal Schools Program (UDOH)
Kay Denton, PhD Fund Raising Manager The Leonardo at the Utah Science Center
Eric Edwards, MPA, CHES Health Promotion Director Utah County Health Department
Ken Embley, MS Organizational Consultant Center for Public Policy & Administration University of Utah
Jonelle Fitzgerald Health Education Supervisor Wasatch County Health Department
Janell Fluckiger Research Assistant University of Utah
Michael Friedrichs, MS Lead Epidemiologist Bureau of Health Promotion (UDOH)
Christina Gingras, RD, CD Child Nutrition Specialist WIC-Women, Infant & Children (UDOH)
Ken Golding President of GCW Golding Corporate Wellness, Inc
Marsha Greenberg Health and Wellness Coordinator Altius Health Care
Brian Hall Director of Training Utah League of Cities and Towns
Leon Hammond, MBA Executive Director Utah Partnership for Healthy Weight
Beverly Hyatt, PhD, MPH, RD Health Promotion Bureau Salt Lake Valley Health Department
Patrice Isabella, MS, RD, CD Nutrition Coordinator PANO (UDOH)
Tricia Jack, MPA Program Manager, Education and Training Center for Public Policy and Administration University of Utah
Elizabeth A. Joy, MD, MPH, FACSM Director, Utah Health Research Network Department of Family and Preventive Medicine University of Utah
Tamara Lewis, MD Preventive Medicine Specialist Intermountain Healthcare
Becky Low, RD, CD Director of Nutritional Education Utah Dairy Council
James O. Mason, MD, BA, PhD UPHW Board Member Utah Partnership for Healthy Weight
Nichole Mallory Marketing and Outreach Coordinator Utah State Parks & Recreation
Making the Healthy Choice the Easy Choice
Utah Nutrition and Physical Activity Plan 2010-2020
Sara McCormick, MPA Project Specialist–Policy Research Center for Public Policy and Administration University of Utah
Brett McIff, MSPH, CSCS Physical Activity Coordinator PANO (UDOH)
Julie Metos, MPH, RD, CD Coordinated Master’s Program in Nutrition College of Health University of Utah
Nikki Mihalopoulos, MD, MPH Assistant Professor School of Medicine Primary Children’s Medical Center University of Utah
Pam Mitchell Wellness Consultant Regence BlueCross BlueShield of Utah
Cara Munson, RD, CD Child Nutrition Specialist WIC Program (UDOH) State Nutrition Action Coalition
Karen Nellist, MPH Epidemiologist/Evaluator PANO (UDOH)
Steve Packham Scientist Utah Department of Environmental Quality
Glenna Padfield Professor and President of UAHPERD Department of Exercise Sciences Recreation & Dance Brigham Young University
Stan Parrish Co-Chair of UPHW CEO Mighty Distributing System of Southern Nevada
Todd Pennington, PhD, MS, BS Professor/Director Exercise and Sport Science Brigham Young University
Kathy Pope, RN Worksite Lactation Support Task Force Coordinator Utah Breast Feeding Coalition
Christy Porucznik, PhD, MSPH Assistant Professor Family and Preventive Medicine School of Medicine University of Utah Breastfeeding Coalition
Owen Quinonez, MD Program Manager Center for Multicultural Health (UDOH)
Glenn Richardson, PhD Professor and Department Chair Department of Health Promotion and Education University of Utah
Jennifer Robinson, MPA Associate Director Center for Public Policy and Administration University of Utah
Luann Shipley Director, Child Nutrition Programs Utah State Office of Education
Listing of Individuals who Contributed to the Development of the State Plan:The Utah Physical Activity, Nutrition, and Obesity Program would like to thank the f ollowing individuals for their time and energy in preparing this document.
Utah Nutrition and Physical Activity Plan 2010-2020
Making the Healthy Choice the Easy Choice
Jane Sims Project Coordinator KUTV Channel 2/UDOH
Elizabeth Smith, MPA, IBCLC Baby Friendly Hospital Initiative Coordinator 2009 President Utah Breastfeeding Coalition
Richard Sparks Marketing Division Deputy Director Utah Department of Agriculture
Shirley Stevens, RN President Utah School Nurse Association
Claudia Streuper, RN President-Elect for the USNA Board Utah School Nurse Association
Grant Sunada, MPH Health Information Specialist Diabetes Prevention Program (UDOH)
David Sundwall, MD Executive Director (UDOH)
Lisa Taylor, MS Public Information Officer Central Utah Public Health Department
Mark C. Templeman, MD Specialty Pediatric Nutrition Intermountain Medical Group
Raylene Thueson President / Director RST and Associates
Darren Tucker Media Expert
Jeramie Tubbs Public Information Officer TriCounty Health Department
Dot Verbrugge, MD Medical Director Altius Health Plans
Charlotte Vincent, PhD, RD, CD Program Manager Aging and Adult Services Utah Department of Human Services
Bucky Whitehouse Public Information Officer Tooele County Health Department
Pauline Williams Clinical Nutrition Manager Primary Children’s Medical Center
Frank Wojtech, MA Health/PE Specialist Utah State Office of Education
Paul Young, MD Co-Director, UPIQ Division of General Pediatrics University of Utah
Liz Zentner Health Commissioner Utah Parent Teacher Association
Utah Nutrition and Physical Activity Plan 2010-2020
E X E C U T I V E S U M M A RY . . . . . . . . . . . . . . . . . . . . . . . . . . . . . . . . . . . . . . . . . . . . . . . . . . . . . . . . . . . . . . . 13
I N T R O D U C T I O N : H O W TO U S E T H E P L A N . . . . . . . . . . . . . . . . . . . . . . . . . . . . . . . . . . . . . . . . . . 15
D E S C R I P T I O N O F T H E O B E S I T Y E P I D E M I C I N U TA H . . . . . . . . . . . . . . . . . . . . . . . . . . . . . . 19 The Obesity Epidemic . . . . . . . . . . . . . . . . . . . . . . . . . . . . . . . . . . . . . . . . . . . . . . . . . . . . . . . . . . . . . . . . . . . 20 BMI of Utah Children . . . . . . . . . . . . . . . . . . . . . . . . . . . . . . . . . . . . . . . . . . . . . . . . . . . . . . . . . . . . . . . 22 BMI of Utah Youth . . . . . . . . . . . . . . . . . . . . . . . . . . . . . . . . . . . . . . . . . . . . . . . . . . . . . . . . . . . . . . . . . . . 22 BMI of Utah Adults . . . . . . . . . . . . . . . . . . . . . . . . . . . . . . . . . . . . . . . . . . . . . . . . . . . . . . . . . . . . . . . . . . 22 Nutrition . . . . . . . . . . . . . . . . . . . . . . . . . . . . . . . . . . . . . . . . . . . . . . . . . . . . . . . . . . . . . . . . . . . . . . . . . . . . 23 Breastfeeding . . . . . . . . . . . . . . . . . . . . . . . . . . . . . . . . . . . . . . . . . . . . . . . . . . . . . . . . . . . . . . . . . . . . . . . . 23 Physical Activity . . . . . . . . . . . . . . . . . . . . . . . . . . . . . . . . . . . . . . . . . . . . . . . . . . . . . . . . . . . . . . . . . . . . . . 24 TV Screen Time . . . . . . . . . . . . . . . . . . . . . . . . . . . . . . . . . . . . . . . . . . . . . . . . . . . . . . . . . . . . . . . . . . . . . . 24 Obesity and Chronic Diseases . . . . . . . . . . . . . . . . . . . . . . . . . . . . . . . . . . . . . . . . . . . . . . . . . . . . . . . . . . . . 25 Arthritis . . . . . . . . . . . . . . . . . . . . . . . . . . . . . . . . . . . . . . . . . . . . . . . . . . . . . . . . . . . . . . . . . . . . . . . . . . . . . 25 Asthma . . . . . . . . . . . . . . . . . . . . . . . . . . . . . . . . . . . . . . . . . . . . . . . . . . . . . . . . . . . . . . . . . . . . . . . . . . . . . 26 Depression . . . . . . . . . . . . . . . . . . . . . . . . . . . . . . . . . . . . . . . . . . . . . . . . . . . . . . . . . . . . . . . . . . . . . . . . . . 26 Diabetes . . . . . . . . . . . . . . . . . . . . . . . . . . . . . . . . . . . . . . . . . . . . . . . . . . . . . . . . . . . . . . . . . . . . . . . . . . . . 26
Health Disparities . . . . . . . . . . . . . . . . . . . . . . . . . . . . . . . . . . . . . . . . . . . . . . . . . . . . . . . . . . . . . . . . . . . . 27
H I S TO RY O F O B E S I T Y P R E V E N T I O N I N U TA H . . . . . . . . . . . . . . . . . . . . . . . . . . . . . . . . . . . . . 29 History of Statewide Obesity Prevention . . . . . . . . . . . . . . . . . . . . . . . . . . . . . . . . . . . . . . . . . . . . . . . . . . . 30 The Utah Partnership for Healthy Weight (UPHW) . . . . . . . . . . . . . . . . . . . . . . . . . . . . . . . . . . . . . . . 31 The UDOH Physical Activity, Nutrition, and Obesity (PANO) Program . . . . . . . . . . . . . . . . . . 32
P L A N N I N G F O R C H A N G E . . . . . . . . . . . . . . . . . . . . . . . . . . . . . . . . . . . . . . . . . . . . . . . . . . . . . . . . . . . . 33 Theories of Change . . . . . . . . . . . . . . . . . . . . . . . . . . . . . . . . . . . . . . . . . . . . . . . . . . . . . . . . . . . . . . . . . . . . . . 34 Adapted Social-Ecological Model . . . . . . . . . . . . . . . . . . . . . . . . . . . . . . . . . . . . . . . . . . . . . . . . . . . . . . . . 34 Logic Model . . . . . . . . . . . . . . . . . . . . . . . . . . . . . . . . . . . . . . . . . . . . . . . . . . . . . . . . . . . . . . . . . . . . . . . . . 35 Six Target Areas and Priority Populations . . . . . . . . . . . . . . . . . . . . . . . . . . . . . . . . . . . . . . . . . . . . . . . . . . 36 Six Target Areas . . . . . . . . . . . . . . . . . . . . . . . . . . . . . . . . . . . . . . . . . . . . . . . . . . . . . . . . . . . . . . . . . . . . . . 36 Priority Populations . . . . . . . . . . . . . . . . . . . . . . . . . . . . . . . . . . . . . . . . . . . . . . . . . . . . . . . . . . . . . . . . . . 37 How to Select Interventions . . . . . . . . . . . . . . . . . . . . . . . . . . . . . . . . . . . . . . . . . . . . . . . . . . . . . . . . . . . . . . 38
P L A N N I N G T H R O U G H PA R T N E R S H I P S . . . . . . . . . . . . . . . . . . . . . . . . . . . . . . . . . . . . . . . . . . . . . 39 Statewide Structure and Organization . . . . . . . . . . . . . . . . . . . . . . . . . . . . . . . . . . . . . . . . . . . . . . . . . . . . . 40
G O A L S A N D S T R AT E G I E S . . . . . . . . . . . . . . . . . . . . . . . . . . . . . . . . . . . . . . . . . . . . . . . . . . . . . . . . . . . . 43 Overarching Goal . . . . . . . . . . . . . . . . . . . . . . . . . . . . . . . . . . . . . . . . . . . . . . . . . . . . . . . . . . . . . . . . . . . . . . . . . 44 Partnerships . . . . . . . . . . . . . . . . . . . . . . . . . . . . . . . . . . . . . . . . . . . . . . . . . . . . . . . . . . . . . . . . . . . . . . . . . . . . . 46 Government . . . . . . . . . . . . . . . . . . . . . . . . . . . . . . . . . . . . . . . . . . . . . . . . . . . . . . . . . . . . . . . . . . . . . . . . . . . . . . 50 Media . . . . . . . . . . . . . . . . . . . . . . . . . . . . . . . . . . . . . . . . . . . . . . . . . . . . . . . . . . . . . . . . . . . . . . . . . . . . . . . . . . 54 Community Setting . . . . . . . . . . . . . . . . . . . . . . . . . . . . . . . . . . . . . . . . . . . . . . . . . . . . . . . . . . . . . . . . . . . . . . . 56 Health Care Setting . . . . . . . . . . . . . . . . . . . . . . . . . . . . . . . . . . . . . . . . . . . . . . . . . . . . . . . . . . . . . . . . . . . . . . . 62
10 Table of Contents
Table of Contents
Tab
le o
f Con
tent
s
Utah Nutrition and Physical Activity Plan 2010-2020
Table of Contents
Table of Tables Table1: BMI Categories by Age Group . . . . . . . . . . . . . . . . . . . . . . . . . . . . . . . . . . . . . . . . . . . . . . . . . . . . . . 20 Table2: National Healthy People 2010 Goals and Utah Rates Over Time . . . . . . . . . . . . . . . . . . . . . . . . . . . 45
Table of Figures Figure1: Percentage of Obese Adults Over Time, Utah and US . . . . . . . . . . . . . . . . . . . . . . . . . . . . . . . . . . 21 Figure2: Percentage of Utah Children (3rd Graders) at an Unhealthy Weight, Over Time . . . . . . . . . . . . . 22 Figure3: Percentage of Utah Youth (High School Students) at an Unhealthy Weight, Over Time . . . . . . . 22 Figure4: Percentage of Utah Adults at an Unhealthy Weight, Over Time . . . . . . . . . . . . . . . . . . . . . . . . . 22 Figure5: Percentage of Utah Youth who Eat 5 or More Fruits or Vegetables Per Day, Over Time . . . . . . . . 23 Figure6: Percentage of Utah Adults who Eat 5 or More Fruits or Vegetables Per Day, Over Time . . . . . 23 Figure7: Percentage of Utah Children who Were Breastfed: Initiation, Duration, and Exclusivity . . . . . . . 23 Figure8: Percentage of Utah Youth who Get the Recommended Amount of Physical Activity, Over Time . . 24 Figure9: Percentage of Utah Adults at an Unhealthy Weight who Get the Recommended Amount of Physical Activity, Over Time . . . . . . . . . . . . . . . . . . . . . . . . . 24 Figure10: Percentage of Utah Children who Get 2 or More Hours of Combined Screen Time, 2007-2008 . . . . . . . . . . . . . . . . . . . . . . . . . . . . . . . . . . . . 24 Figure11: Percentage of Utah Adults with Doctor-Diagnosed Arthritis by BMI Weight Category, 2007 . . 25
School Setting . . . . . . . . . . . . . . . . . . . . . . . . . . . . . . . . . . . . . . . . . . . . . . . . . . . . . . . . . . . . . . . . . . . . . . . . . . . . 68 Worksite Setting . . . . . . . . . . . . . . . . . . . . . . . . . . . . . . . . . . . . . . . . . . . . . . . . . . . . . . . . . . . . . . . . . . . . . . . . . . 72 Health Equity . . . . . . . . . . . . . . . . . . . . . . . . . . . . . . . . . . . . . . . . . . . . . . . . . . . . . . . . . . . . . . . . . . . . . . . . . . . . 76
I M P L E M E N T I N G T H E P L A N . . . . . . . . . . . . . . . . . . . . . . . . . . . . . . . . . . . . . . . . . . . . . . . . . . . . . . . . . . 79 Resources . . . . . . . . . . . . . . . . . . . . . . . . . . . . . . . . . . . . . . . . . . . . . . . . . . . . . . . . . . . . . . . . . . . . . . . . . . . . . . . . 80 Collaboration Across Work Groups . . . . . . . . . . . . . . . . . . . . . . . . . . . . . . . . . . . . . . . . . . . . . . . . . . . . . . . . . . 81 What You Can Do . . . . . . . . . . . . . . . . . . . . . . . . . . . . . . . . . . . . . . . . . . . . . . . . . . . . . . . . . . . . . . . . . . . . 81 How to Become Involved . . . . . . . . . . . . . . . . . . . . . . . . . . . . . . . . . . . . . . . . . . . . . . . . . . . . . . . . . . . . . . . 81 Programs and Interventions . . . . . . . . . . . . . . . . . . . . . . . . . . . . . . . . . . . . . . . . . . . . . . . . . . . . . . . . . . . . . 81
C ALL TO AC TION . . . . . . . . . . . . . . . . . . . . . . . . . . . . . . . . . . . . . . . . . . . . . . . . . . . . . . . . . . . . . . . . . . . . . . 82M E A S U R I N G P R O G R E S S : S U R V E I L L A N C E A N D E VA LUAT I O N . . . . . . . . . . . . . . . . . . . . . 83 Surveillance . . . . . . . . . . . . . . . . . . . . . . . . . . . . . . . . . . . . . . . . . . . . . . . . . . . . . . . . . . . . . . . . . . . . . . . . . . . . . . 84 Evaluation . . . . . . . . . . . . . . . . . . . . . . . . . . . . . . . . . . . . . . . . . . . . . . . . . . . . . . . . . . . . . . . . . . . . . . . . . . . . . . . 84 CDC Framework for Program Evaluation . . . . . . . . . . . . . . . . . . . . . . . . . . . . . . . . . . . . . . . . . . . . . . . . . 85 The Evaluation Advisory Group . . . . . . . . . . . . . . . . . . . . . . . . . . . . . . . . . . . . . . . . . . . . . . . . . . . . . . . . . 85 Evaluation of State Plan Development Process . . . . . . . . . . . . . . . . . . . . . . . . . . . . . . . . . . . . . . . . . . . . . 86 Evaluation of Statewide Partnership . . . . . . . . . . . . . . . . . . . . . . . . . . . . . . . . . . . . . . . . . . . . . . . . . . . . . . 86 Evaluation of Annual Implementation Plans . . . . . . . . . . . . . . . . . . . . . . . . . . . . . . . . . . . . . . . . . . . . . . . 86 Evaluation of Interventions . . . . . . . . . . . . . . . . . . . . . . . . . . . . . . . . . . . . . . . . . . . . . . . . . . . . . . . . . . . . . 86 Training Needs . . . . . . . . . . . . . . . . . . . . . . . . . . . . . . . . . . . . . . . . . . . . . . . . . . . . . . . . . . . . . . . . . . . . . . . . . . . 86
A P P E N D I C E S . . . . . . . . . . . . . . . . . . . . . . . . . . . . . . . . . . . . . . . . . . . . . . . . . . . . . . . . . . . . . . . . . . . . . . . . . . 87
11
12
Utah Nutrition and Physical Activity Plan 2010-2020
Figure12: Percentage of Utah Adults with Current Doctor-Diagnosed Asthma by BMI Weight Category, 2008 . . . . . . . . . . . . . . . . . . . . . . . . . . . . . . . . . . 26 Figure13: Percentage of Utah Adults with Major Depression by BMI Weight Category, 2005-2008 Combined . . . . . . . . . . . . . . . . . . . . . . . . . . . . . . . . . 26 Figure14: Percentage of Utah Adults with Doctor-Diagnosed Diabetes by BMI Weight Category, 2006-2008 Combined . . . . . . . . . . . . . . . . . . . . . . . . . . . . . . . . . . . . . . . . . . . . . . . . . . . . . . . . . . . . . . . . . 26 Figure15: Percentage of Utah Adults at an Unhealthy Weight by Race, 2004-2008 Combined . . . . . . . . . 27 Figure16: Percentage of Utah Adults at an Unhealthy Weight by Ethnicity, 2008 . . . . . . . . . . . . . . . . . . . . 27 Figure17: Percentage of Utah Adults at an Unhealthy Weight by Age and Sex, 2008 . . . . . . . . . . . . . . . . . . 27 Figure18: Percentage of Obese Utah Adults by Small Area, 2004 to 2008 Combined . . . . . . . . . . . . . . . . . 28
Utah Nutrition and Physical Activity Plan 2010-2020
Table of Contents 12
Sum
mar
y
The Easy Choice
Executive Summary
Utah Nutrition and Physical Activity Plan 2010-2020
Executive Summary
In 2001, the Surgeon General issued a call to action to prevent and decrease overweight and obesity in the United States. That document established the “obesity epidemic” as the single greatest threat to the public’s health.
Currently an estimated 60.1% of Utah adults, or 1.1 million adults (2008 data) are overweight or obese, and 19.7% of Utah elementary school students are either overweight or obese.The Surgeon General’s Call to Action established that for most Americans, this epidemic is, in part, a result of unhealthy eating and sedentary behaviors. Overweight/obesity, physical inactivity and unhealthy eating are associated with increased risk for heart disease; type 2 diabetes; endometrial, colon, postmenopausal breast, and other cancers; stroke; hypertension; sleep apnea; gallbladder disease; osteoarthritis; depression; and psychological difficulties due to social stigmatization.
The Utah Nutrition and Physical Activity plan 2010 to 2020 was developed under the direction of the Utah Department of Health Physical Activity, Nutrition and Obesity (PANO) program and is a 10-year action plan to reduce the burden of chronic diseases, such as obesity, in Utah through nutrition and physical activity efforts. The purpose of the plan is to provide goals and strategies for government, media, communities, health care providers, schools, and worksites that will impact overweight and obesity in Utah. Partners representing many organizations, including local health departments, and other disciplines participated in creating the goals and strategies found in the plan. Public and private partners will utilize the plan for statewide planning, development, and implementation of physical activity and nutrition interventions.
This plan presents opportunities to develop policies and modify our environment to enable Utah residents to lead healthier lives. The plan provides Utahns with a range of opportunities for action. The development of this plan demonstrates that working together to address the burden of chronic disease and obesity are the first steps toward combating this problem in Utah.
Recommendations of this plan are focused on increasing healthy eating and physical activity and promoting healthy lifestyles for all Utah residents. Based on recommendations from the Centers for Disease Control and Prevention, the following target areas were identified:
• Increase physical activity• Increase consumption of fruits and vegetables• Decrease consumption of sugar-sweetened beverages • Increase breastfeeding initiation, exclusivity, and duration• Reduce the consumption of high-energy-dense foods• Decrease television viewing time
The goals and strategies in the plan will be accomplished through the joint efforts of state and local government agencies, nonprofit organizations, business leaders, health care providers and insurers, and education organizations. The PANO program will play a leadership role in implementing the goals and strategies and is committed to facilitating, supporting, and coordinating these efforts.
14
The Easy Choice
Introduction
Intr
oduc
tion
16
Utah Nutrition and Physical Activity Plan 2010-2020
The state plan is divided into seven chapters. Below is a list of all the sections with a short description. The intent is that the state plan be used as a reference document to help public and private partners understand the
issues, history, theories for change, the strength and use of partnerships, and specific goals and strategies that can be used to effect change.
Description of the Obesity Epidemic in UtahThis section describes the obesity epidemic in Utah using current surveillance data. Body Mass Index (BMI) is defined; surveillance data for nutrition and physical activity are included, and the interaction of obesity and chronic diseases is described. Health disparities are addressed by reviewing data on race/ethnicity, age/sex, and geography. This section serves as a snapshot to describe the obesity epidemic in Utah.
History of Obesity Prevention in Utah The history of obesity prevention in Utah is discussed in detail including the first obesity report issued by the Utah Department of Health, the publication of the Utah Blueprint, the establishment of the Utah Partnership for Healthy Weight and the Utah Physical Activity, Nutrition, and Obesity (PANO) program. This section describes how we got where we are today and the organization that will carry us into the future.
Planning for ChangeTheory and models describe how environmental and policy change result in decreased prevalence of obesity. The six target areas are described and priority populations are identified. A brief description on how physical activity and nutrition intervention will be selected is included. This section identifies how the theories and models will effect change.
Planning Through PartnershipsThis section identifies a Utah-specific plan on how to maximize partnerships to achieve broad reaching environmental and policy change. The statewide structure and organization is described, including the establishment of six work groups (government, media, health care, school, community, and worksite). Each of the work groups participated in the creation of the goals and strategies contained in the state plan, and they each have a detailed plan on how to implement the strategies in order to achieve the goals.
Introduction: How to Use The Plan
Utah Nutrition and Physical Activity Plan 2010-2020
Introduction: How to Use The Plan 17
Goals and StrategiesThis is the main part of the plan and includes goals and strategies created by each work group. The goals and strategies help work group members focus their efforts around environment and policy change. The section also includes the overarching goal, “To decrease childhood, youth, and adult overweight and obesity in Utah.” A summary of Healthy People 2010 goals relevant to physical activity, nutrition, and obesity are also listed along with Utah baseline and current rates.
Implementing the Plan This section includes a call to action, a description of how to become involved in this growing movement, and a plan on how to leverage human and financial resources to make lasting changes.
Measuring Progress Surveillance and evaluation are a key part of planning and this section describes how current and future surveillance systems will be incorporated into a surveillance plan.

This page intentionally left blank.
The Easy Choice
Description of the
Obesity Epidemic in Utah
Epid
emic
Description of the Obesity Epidemic in Utah20
Utah Nutrition and Physical Activity Plan 2010-2020
Obesity in the United States has reached epidemic proportions. Since the mid-1970s, the prevalence of overweight and obesity has increased sharply for both adults and children. Data from a national survey (NHANES) show that among adults aged 20-74 years, the prevalence of obesity increased 125% (from 15% in 1976-1980 to 33.8% in 2007-2008).1 This survey also shows an increase in obesity among children and teens. For children aged 2-5 years, the prevalence of obesity increased 108% (from 5.0% to 10.4%), for those aged 6-11 years the prevalence increased 201% (from 6.5% to19.6%), and for those aged 12-19 years the prevalence increased 262% (from 5.0% to 18.1%).2
This dramatic increase in obesity rates has serious implications for the health of Americans today and into the future. Being overweight or obese increases the risk of many diseases and chronic health conditions and the related cost to the health care system has been estimated to exceed $100 billion.3 Nutrition and physical activity are thought to play a critical role in reducing the rates of overweight and obesity.1. Flegal, KM, Carroll, MD, Ogden, CL, Curtin, LR (2010) Prevalence and trends in obesity among US Adults, 1999-2008. JAMA. .......... 2010;303(3):235-241. Published online January 13, 2010. Retrieved on March 1, 2010 from http://jama.ama-assn.org/cgi/content/full/303/3/235?ijkey=ijKHq6YbJn3Oo&keytype=ref&siteid=amajnls.
2. Ogden, CL, et al. (2010) Prevalence of High body mass index in US children and adolescents, 2007-2008. JAMA. 2010;303(3):242-249. . Published online January 13, 2010. Retreived on March 1, 2010 from http://jama.ama-assn.org/cgi/content/full/303/3/242?ijkey=ImvVL7s53 Zyps&keytype=ref&siteid=amajnls
3. DHHS. The Surgeon General’s Call to Action to Prevent and Decrease Overweight and Obesity. Washington, DC: US Government Printing Office, 2001:16. (On-line Access) http://surgeongeneral.gov/topics/obesity.
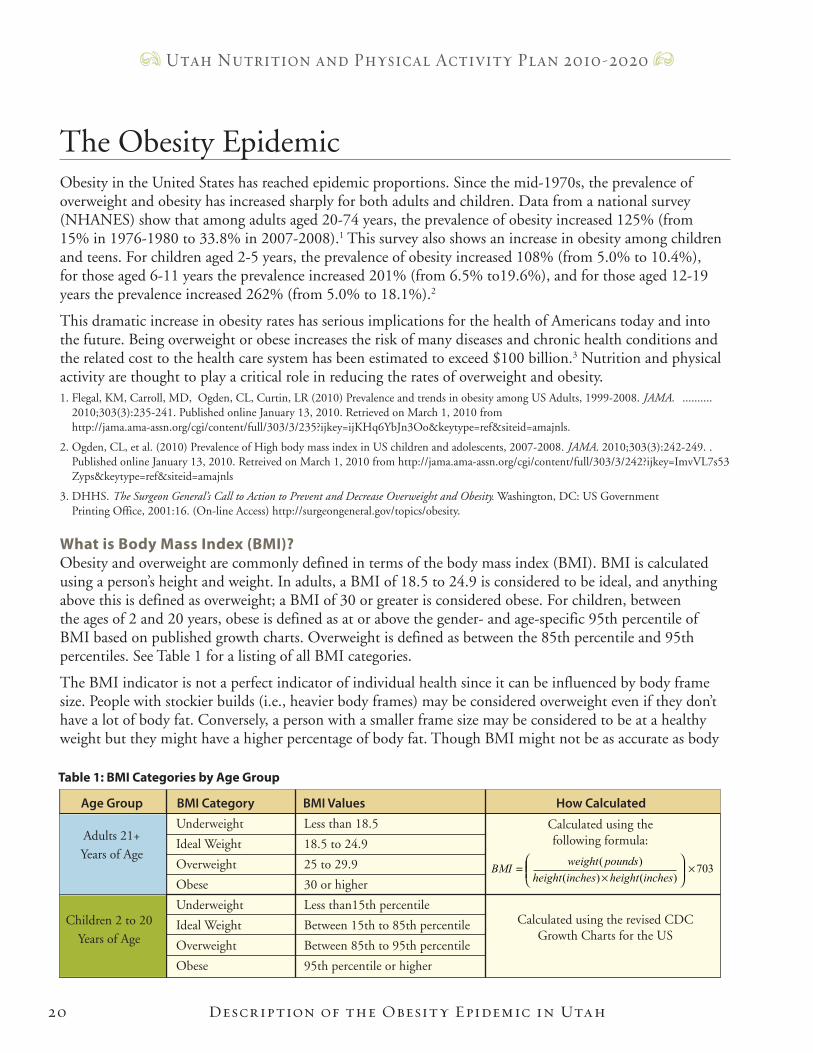
What is Body Mass Index (BMI)?Obesity and overweight are commonly defined in terms of the body mass index (BMI). BMI is calculated using a person’s height and weight. In adults, a BMI of 18.5 to 24.9 is considered to be ideal, and anything above this is defined as overweight; a BMI of 30 or greater is considered obese. For children, between the ages of 2 and 20 years, obese is defined as at or above the gender- and age-specific 95th percentile of BMI based on published growth charts. Overweight is defined as between the 85th percentile and 95th percentiles. See Table 1 for a listing of all BMI categories.
The BMI indicator is not a perfect indicator of individual health since it can be influenced by body frame size. People with stockier builds (i.e., heavier body frames) may be considered overweight even if they don’t have a lot of body fat. Conversely, a person with a smaller frame size may be considered to be at a healthy weight but they might have a higher percentage of body fat. Though BMI might not be as accurate as body
The Obesity Epidemic
703)()(
)( ×
×
=inchesheightinchesheight
poundsweightBMI
Table 1: BMI Categories by Age Group
Underweight
Ideal Weight
Overweight
Obese
Underweight
Ideal Weight
Overweight
Obese
Less than 18.5
18.5 to 24.9
25 to 29.9
30 or higher
Less than15th percentile
Between 15th to 85th percentile
Between 85th to 95th percentile
95th percentile or higher
Calculated using the revised CDCGrowth Charts for the US
Calculated using the following formula:Adults 21+
Years of Age
Children 2 to 20
Years of Age
Age Group BMI Category BMI Values How Calculated
Utah Nutrition and Physical Activity Plan 2010-2020
Description of the Obesity Epidemic in Utah 21
fat percentage at measuring individual health, BMI is used in this report because it is the best method to measure changes in body mass in populations over time.
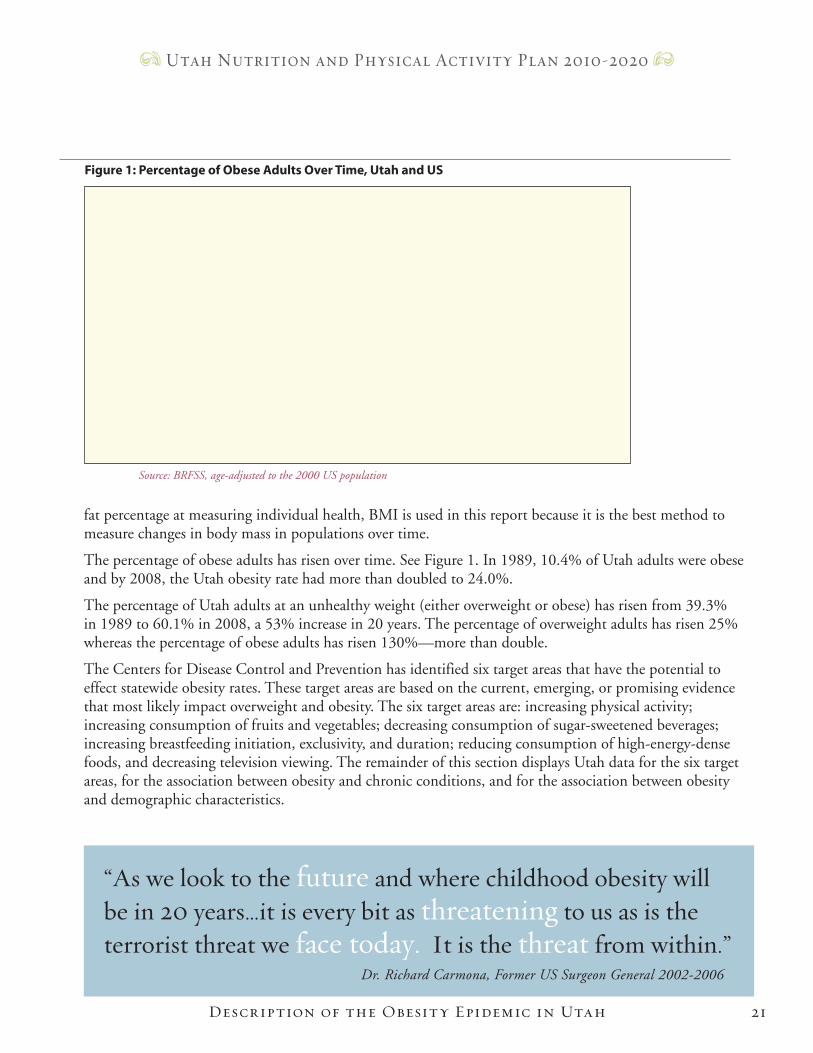
The percentage of obese adults has risen over time. See Figure 1. In 1989, 10.4% of Utah adults were obese and by 2008, the Utah obesity rate had more than doubled to 24.0%.
The percentage of Utah adults at an unhealthy weight (either overweight or obese) has risen from 39.3% in 1989 to 60.1% in 2008, a 53% increase in 20 years. The percentage of overweight adults has risen 25% whereas the percentage of obese adults has risen 130%—more than double.
The Centers for Disease Control and Prevention has identified six target areas that have the potential to effect statewide obesity rates. These target areas are based on the current, emerging, or promising evidence that most likely impact overweight and obesity. The six target areas are: increasing physical activity; increasing consumption of fruits and vegetables; decreasing consumption of sugar-sweetened beverages; increasing breastfeeding initiation, exclusivity, and duration; reducing consumption of high-energy-dense foods, and decreasing television viewing. The remainder of this section displays Utah data for the six target areas, for the association between obesity and chronic conditions, and for the association between obesity and demographic characteristics.
“As we look to the future and where childhood obesity will be in 20 years…it is every bit as threatening to us as is the terrorist threat we face today. It is the threat from within.” Dr. Richard Carmona, Former US Surgeon General 2002-2006
0
5
10
15
20
25
30
1989
1990
1991
1992
1993
1994
1995
1996
1997
1998
1999
2000
2001
2002
2003
2004
2005
2006
2007
2008
Year
Percentage
Utah US
Figure 1: Percentage of Obese Adults Over Time, Utah and US
Source: BRFSS, age-adjusted to the 2000 US population
Description of the Obesity Epidemic in Utah22
Utah Nutrition and Physical Activity Plan 2010-2020
BMI of Utah ChildrenThe percentage of Utah third graders who were at an unhealthy weight (overweight or obese) in 1994 was 16.7%. By 2008 that rate had increased to 19.7%, an 18% increase. However, the rate of obesity had risen from 5.9% in 1994 to 8.6%, a 46% increase; there was no statistical difference between the obesity rate for 2006 and 2008. It is unclear whether the rate of overweight and obesity in third graders is continuing to increase or is leveling-off.
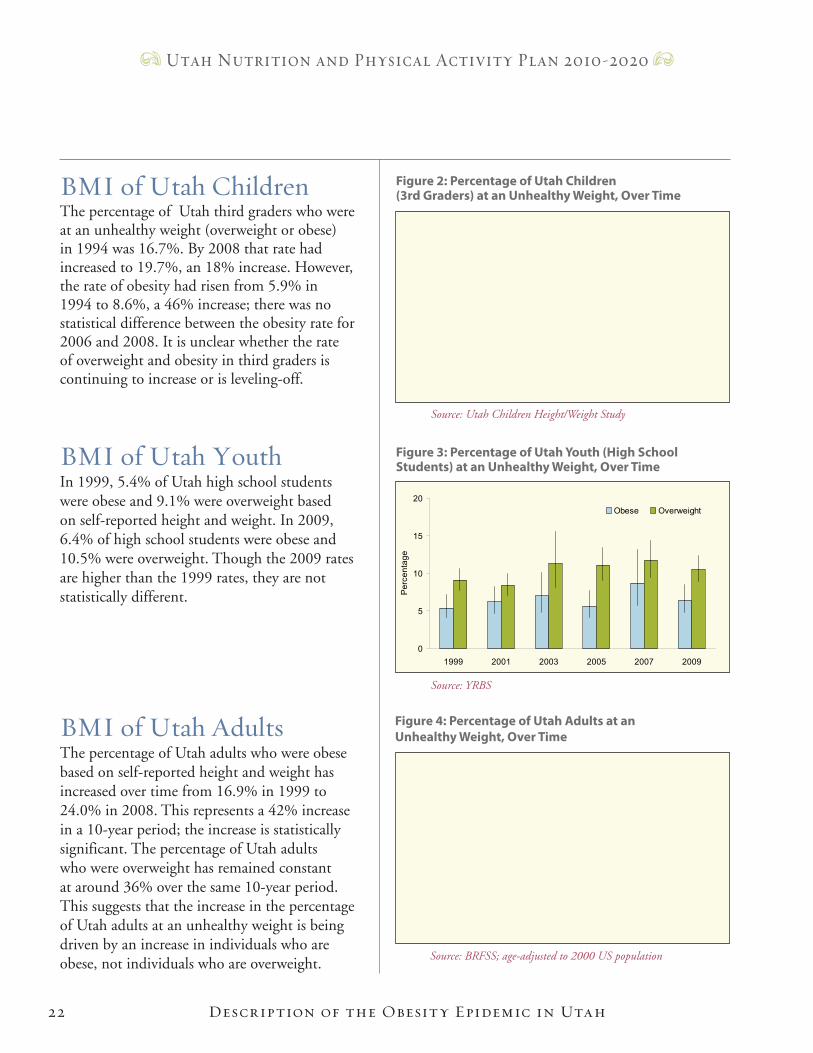
BMI of Utah YouthIn 1999, 5.4% of Utah high school students were obese and 9.1% were overweight based on self-reported height and weight. In 2009, 6.4% of high school students were obese and 10.5% were overweight. Though the 2009 rates are higher than the 1999 rates, they are not statistically different.
BMI of Utah AdultsThe percentage of Utah adults who were obese based on self-reported height and weight has increased over time from 16.9% in 1999 to 24.0% in 2008. This represents a 42% increase in a 10-year period; the increase is statistically significant. The percentage of Utah adults who were overweight has remained constant at around 36% over the same 10-year period. This suggests that the increase in the percentage of Utah adults at an unhealthy weight is being driven by an increase in individuals who are obese, not individuals who are overweight.
0
5
10
15
20
1994 2006 2008P
erce
ntag
e
Obese Overweight
Figure 2: Percentage of Utah Children (3rd Graders) at an Unhealthy Weight, Over Time
Source: Utah Children Height/Weight Study
0
5
10
15
20
1999 2001 2003 2005 2007 2009
Per
cent
age
Obese Overweight
Figure 3: Percentage of Utah Youth (High School Students) at an Unhealthy Weight, Over Time
Source: YRBS
Figure 4: Percentage of Utah Adults at an Unhealthy Weight, Over Time
Source: BRFSS; age-adjusted to 2000 US population
0
10
20
30
40
50
1999 2001 2003 2005 2007 2008
Per
cent
age
Obese Overweight
Description of the Obesity Epidemic in Utah
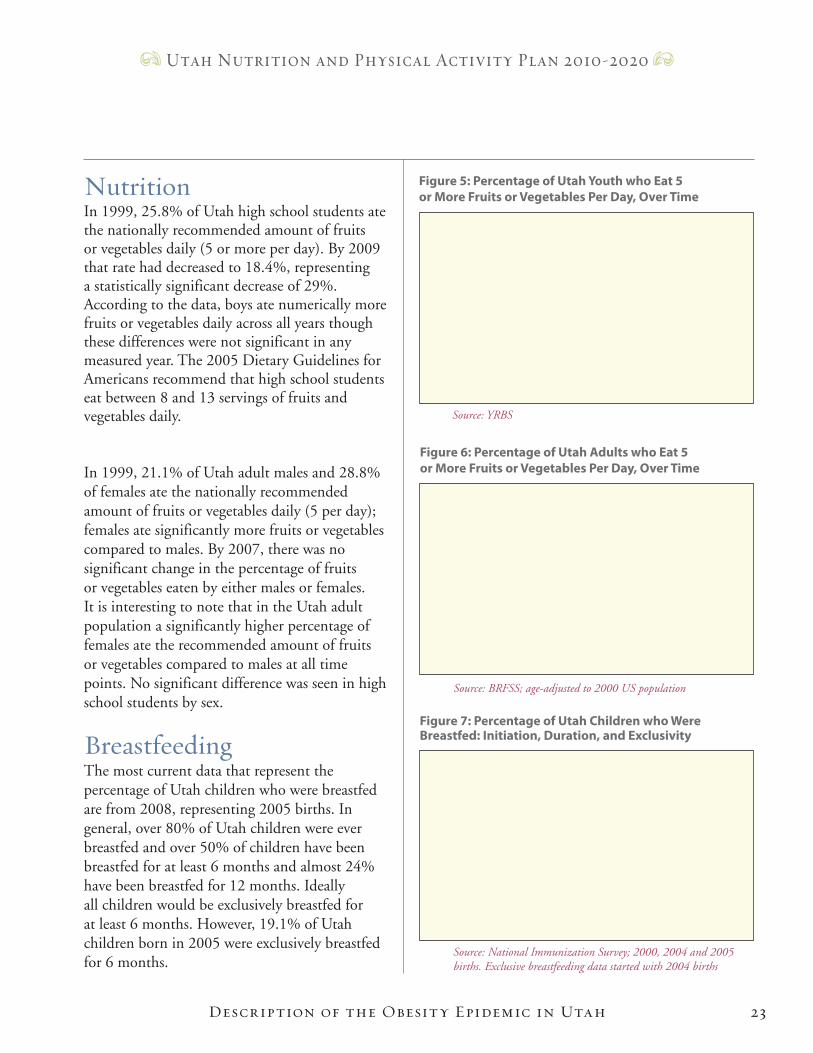
Figure 7: Percentage of Utah Children who Were Breastfed: Initiation, Duration, and Exclusivity
0
20
40
60
80
100
Ever Breastfed
Breastfed 6 Months
Breastfed 12 Months
Exclusive at 3 Months
Exclusive at 6 Months
Per
cent
age
Birth year=2000Birth year=2004Birth year=2005
Source: National Immunization Survey; 2000, 2004 and 2005 births. Exclusive breastfeeding data started with 2004 births
23
Utah Nutrition and Physical Activity Plan 2010-2020
NutritionIn 1999, 25.8% of Utah high school students ate the nationally recommended amount of fruits or vegetables daily (5 or more per day). By 2009 that rate had decreased to 18.4%, representing a statistically significant decrease of 29%. According to the data, boys ate numerically more fruits or vegetables daily across all years though these differences were not significant in any measured year. The 2005 Dietary Guidelines for Americans recommend that high school students eat between 8 and 13 servings of fruits and vegetables daily.
In 1999, 21.1% of Utah adult males and 28.8% of females ate the nationally recommended amount of fruits or vegetables daily (5 per day); females ate significantly more fruits or vegetables compared to males. By 2007, there was no significant change in the percentage of fruits or vegetables eaten by either males or females. It is interesting to note that in the Utah adult population a significantly higher percentage of females ate the recommended amount of fruits or vegetables compared to males at all time points. No significant difference was seen in high school students by sex.
BreastfeedingThe most current data that represent the percentage of Utah children who were breastfed are from 2008, representing 2005 births. In general, over 80% of Utah children were ever breastfed and over 50% of children have been breastfed for at least 6 months and almost 24% have been breastfed for 12 months. Ideally all children would be exclusively breastfed for at least 6 months. However, 19.1% of Utah children born in 2005 were exclusively breastfed for 6 months.
0
5
10
15
20
25
30
35
40
1999 2003 2005 2007
Per
cent
age
Males Females
Figure 6: Percentage of Utah Adults who Eat 5 or More Fruits or Vegetables Per Day, Over Time
Source: BRFSS; age-adjusted to 2000 US population
Figure 5: Percentage of Utah Youth who Eat 5 or More Fruits or Vegetables Per Day, Over Time
Source: YRBS
0
10
20
30
40
1999 2001 2003 2005 2007 2009
Per
cent
age
Boys Girls
Description of the Obesity Epidemic in Utah24
Utah Nutrition and Physical Activity Plan 2010-2020
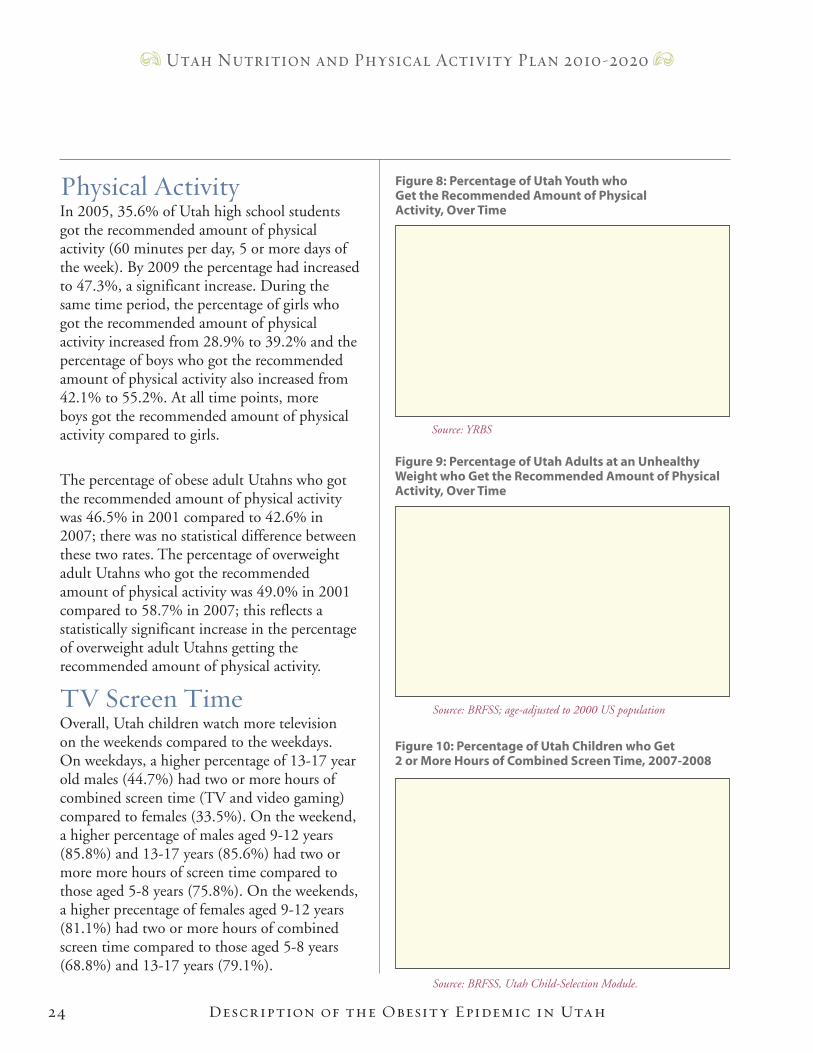
Physical ActivityIn 2005, 35.6% of Utah high school students got the recommended amount of physical activity (60 minutes per day, 5 or more days of the week). By 2009 the percentage had increased to 47.3%, a significant increase. During the same time period, the percentage of girls who got the recommended amount of physical activity increased from 28.9% to 39.2% and the percentage of boys who got the recommended amount of physical activity also increased from 42.1% to 55.2%. At all time points, more boys got the recommended amount of physical activity compared to girls.
The percentage of obese adult Utahns who got the recommended amount of physical activity was 46.5% in 2001 compared to 42.6% in 2007; there was no statistical difference between these two rates. The percentage of overweight adult Utahns who got the recommended amount of physical activity was 49.0% in 2001 compared to 58.7% in 2007; this reflects a statistically significant increase in the percentage of overweight adult Utahns getting the recommended amount of physical activity.
TV Screen TimeOverall, Utah children watch more television on the weekends compared to the weekdays. On weekdays, a higher percentage of 13-17 year old males (44.7%) had two or more hours of combined screen time (TV and video gaming) compared to females (33.5%). On the weekend, a higher percentage of males aged 9-12 years (85.8%) and 13-17 years (85.6%) had two or more more hours of screen time compared to those aged 5-8 years (75.8%). On the weekends, a higher precentage of females aged 9-12 years (81.1%) had two or more hours of combined screen time compared to those aged 5-8 years (68.8%) and 13-17 years (79.1%).
0
10
20
30
40
50
60
70
2005 2007 2009P
erce
ntag
e
Boys Girls
Figure 8: Percentage of Utah Youth who Get the Recommended Amount of Physical Activity, Over Time
Source: YRBS
0
10
20
30
40
50
60
70
2001 2003 2005 2007
Per
cent
age
Obese Overweight
Figure 9: Percentage of Utah Adults at an Unhealthy Weight who Get the Recommended Amount of Physical Activity, Over Time
Source: BRFSS; age-adjusted to 2000 US population
Source: BRFSS, Utah Child-Selection Module.
0
20
40
60
80
100
Weekday Weekend Weekday Weekend
Boys Girls
Per
cent
age
5-8 years 9-12 years 13-17 years
Figure 10: Percentage of Utah Children who Get 2 or More Hours of Combined Screen Time, 2007-2008
Description of the Obesity Epidemic in Utah 25
Utah Nutrition and Physical Activity Plan 2010-2020
Overweight and obesity are associated with chronic diseases such as diabetes, hypertension, stroke, heart disease, arthritis, asthma, and some cancers.
Obesity is a major risk factor for type 2 diabetes. Type 2 diabetes is often considered a lifestyle disease and is associated with overweight and obesity, physical inactivity, and poor dietary habits. The prevalence of diabetes is dramatically higher in overweight and obese people. Likewise, diabetes increases an individual’s risk of heart disease, stroke, and is a leading cause of blindness and lower-limb amputation. Type 2 diabetes, once considered an adult disease, is now also seen in children. It is estimated that almost one-half of all new childhood diabetes cases are classified as type 2.
Being overweight or obese increases an individual’s risk for high cholesterol, hypertension (high blood pressure), cardiovascular disease, angina, heart attack, and stroke. The prevalence of high cholesterol is greater in overweight and obese adults than those at ideal weight. This is also true of hypertension.
Being overweight or obese increases the risk for certain types of arthritis. Specifically, osteoarthritis, a slowly evolving degenerative disease, is prevalent in overweight and obese adults. The relationship between obesity and osteoarthritis is explained as follows: 1) a person who is overweight or obese has increased force exerted on their joints which may result in a breakdown of cartilage, and 2) an overweight or obese person may have increased bone mineral density which is a risk factor for osteoarthritis.
Asthma is more prevalent in obese adults compared to those at an ideal weight. It is unclear whether asthma leads to obesity due to of lack of exercise and subsequent weight gain, or vice versa.
Obesity is associated with cancers of the colon, breast, endometrium (lining of the uterus), kidney, and esophagus. Obesity is also associated with Hodgkin’s disease in males and non-Hodgkin’s lymphoma in females.
Obesity and Chronic Diseases
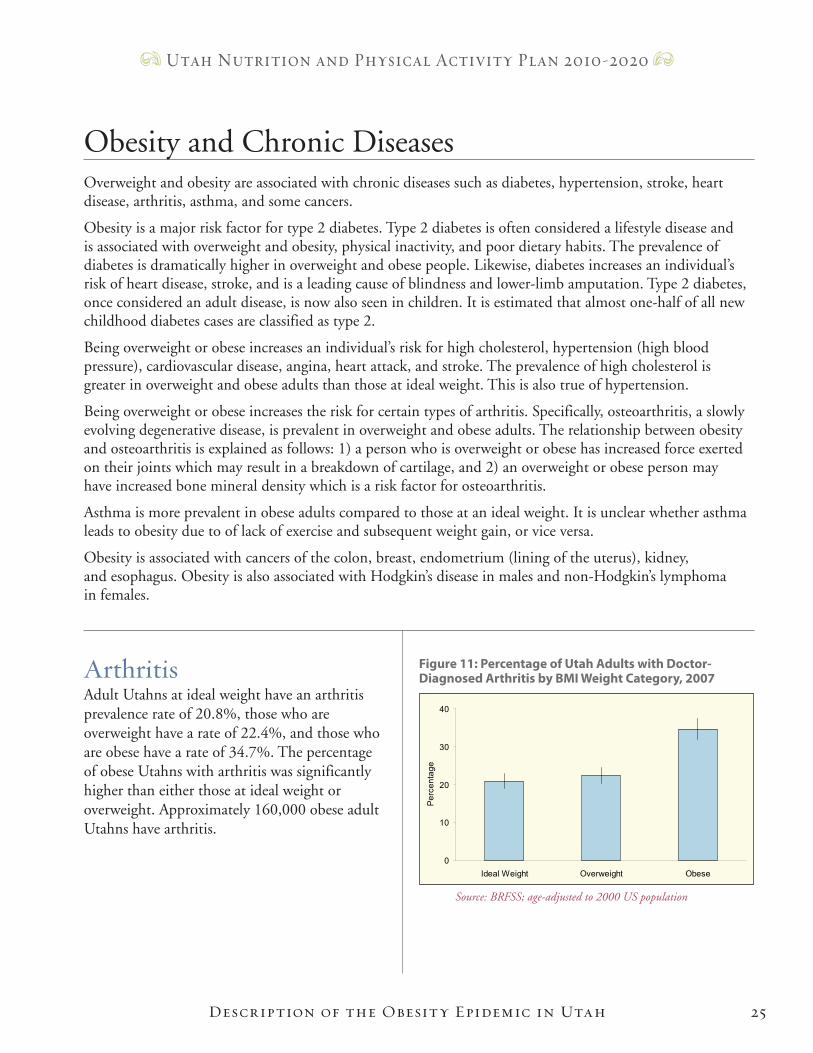
ArthritisAdult Utahns at ideal weight have an arthritis prevalence rate of 20.8%, those who are overweight have a rate of 22.4%, and those who are obese have a rate of 34.7%. The percentage of obese Utahns with arthritis was significantly higher than either those at ideal weight or overweight. Approximately 160,000 obese adult Utahns have arthritis.
0
10
20
30
40
Ideal Weight Overweight Obese
Per
cent
age
Figure 11: Percentage of Utah Adults with Doctor- Diagnosed Arthritis by BMI Weight Category, 2007
Source: BRFSS; age-adjusted to 2000 US population
Description of the Obesity Epidemic in Utah26
Utah Nutrition and Physical Activity Plan 2010-2020
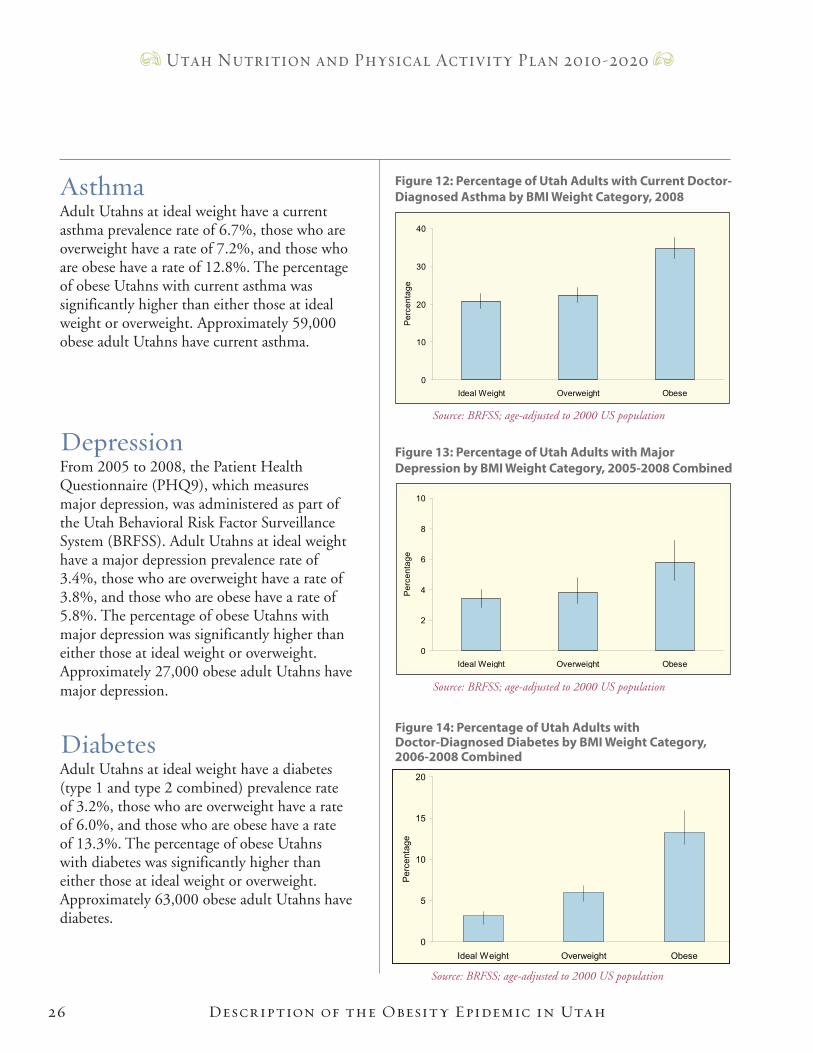
AsthmaAdult Utahns at ideal weight have a current asthma prevalence rate of 6.7%, those who are overweight have a rate of 7.2%, and those who are obese have a rate of 12.8%. The percentage of obese Utahns with current asthma was significantly higher than either those at ideal weight or overweight. Approximately 59,000 obese adult Utahns have current asthma.
DepressionFrom 2005 to 2008, the Patient Health Questionnaire (PHQ9), which measures major depression, was administered as part of the Utah Behavioral Risk Factor Surveillance System (BRFSS). Adult Utahns at ideal weight have a major depression prevalence rate of 3.4%, those who are overweight have a rate of 3.8%, and those who are obese have a rate of 5.8%. The percentage of obese Utahns with major depression was significantly higher than either those at ideal weight or overweight. Approximately 27,000 obese adult Utahns have major depression.
DiabetesAdult Utahns at ideal weight have a diabetes (type 1 and type 2 combined) prevalence rate of 3.2%, those who are overweight have a rate of 6.0%, and those who are obese have a rate of 13.3%. The percentage of obese Utahns with diabetes was significantly higher than either those at ideal weight or overweight. Approximately 63,000 obese adult Utahns have diabetes.
0
2
4
6
8
10
Ideal Weight Overweight Obese
Per
cent
age
Figure 13: Percentage of Utah Adults with Major Depression by BMI Weight Category, 2005-2008 Combined
Source: BRFSS; age-adjusted to 2000 US population
0
10
20
30
40
Ideal Weight Overweight ObeseP
erce
ntag
e
Figure 12: Percentage of Utah Adults with Current Doctor-Diagnosed Asthma by BMI Weight Category, 2008
Source: BRFSS; age-adjusted to 2000 US population
Source: BRFSS; age-adjusted to 2000 US population
Figure 14: Percentage of Utah Adults with Doctor-Diagnosed Diabetes by BMI Weight Category, 2006-2008 Combined
0
5
10
15
20
Ideal Weight Overweight Obese
Per
cent
age
27
Utah Nutrition and Physical Activity Plan 2010-2020
Description of the Obesity Epidemic in Utah
Health DisparitiesR a c e / e t h n i c i t y
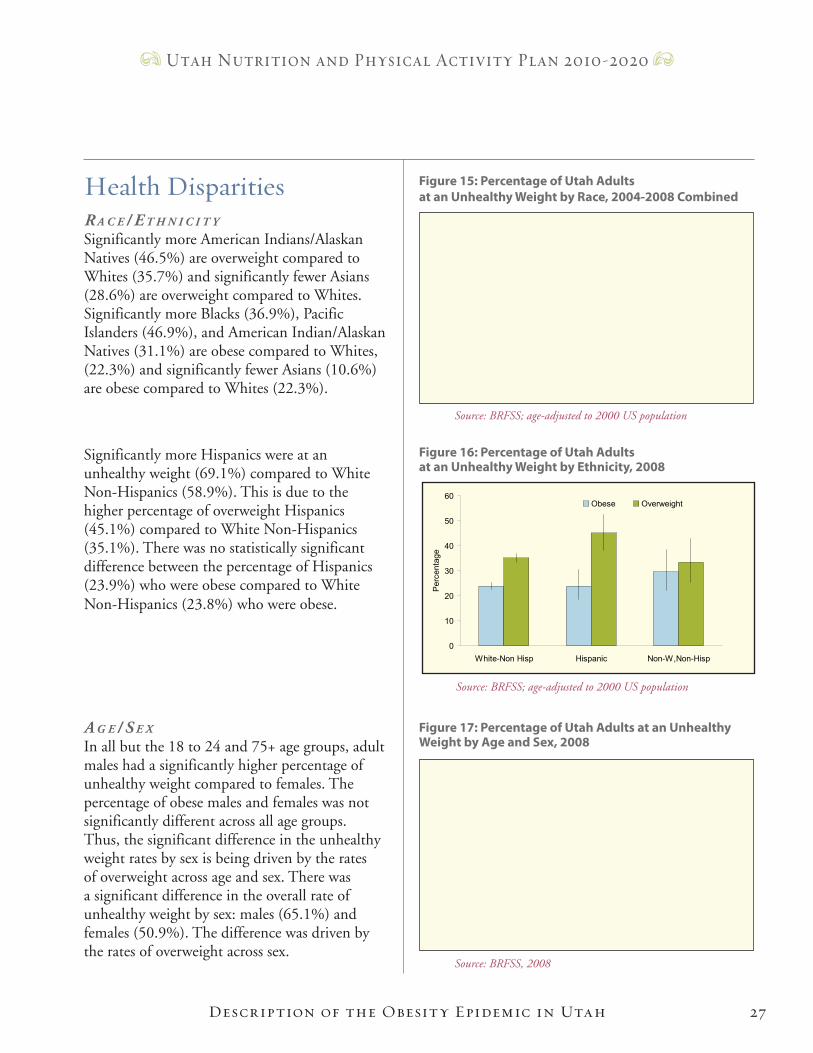
Significantly more American Indians/Alaskan Natives (46.5%) are overweight compared to Whites (35.7%) and significantly fewer Asians (28.6%) are overweight compared to Whites. Significantly more Blacks (36.9%), Pacific Islanders (46.9%), and American Indian/Alaskan Natives (31.1%) are obese compared to Whites, (22.3%) and significantly fewer Asians (10.6%) are obese compared to Whites (22.3%).
Significantly more Hispanics were at an unhealthy weight (69.1%) compared to White Non-Hispanics (58.9%). This is due to the higher percentage of overweight Hispanics (45.1%) compared to White Non-Hispanics (35.1%). There was no statistically significant difference between the percentage of Hispanics (23.9%) who were obese compared to White Non-Hispanics (23.8%) who were obese.
a g e / S e x
In all but the 18 to 24 and 75+ age groups, adult males had a significantly higher percentage of unhealthy weight compared to females. The percentage of obese males and females was not significantly different across all age groups. Thus, the significant difference in the unhealthy weight rates by sex is being driven by the rates of overweight across age and sex. There was a significant difference in the overall rate of unhealthy weight by sex: males (65.1%) and females (50.9%). The difference was driven by the rates of overweight across sex.
0
20
40
60
80
100
18-24 25-34 35-44 45-54 55-64 65-74 75+
Age in Years
Per
cent
age
Males Females
Figure 17: Percentage of Utah Adults at an Unhealthy Weight by Age and Sex, 2008
Source: BRFSS, 2008
0
10
20
30
40
50
60
White Black Asian PacificIslander
AmericanIndian/AK
Native
Other
Per
cent
age
Obese Overweight
Figure 15: Percentage of Utah Adults at an Unhealthy Weight by Race, 2004-2008 Combined
Source: BRFSS; age-adjusted to 2000 US population
Figure 16: Percentage of Utah Adults at an Unhealthy Weight by Ethnicity, 2008
Source: BRFSS; age-adjusted to 2000 US population
0
10
20
30
40
50
60
White-Non Hisp Hispanic Non-W,Non-Hisp
Per
cent
age
Obese Overweight
0 5 10 15 20 25 30 35 40 45
Ben Lomond (5)
Roy/Hooper (9)
Riverdale (10)
Downtown Ogden (7)
Morgan/East Weber Co. (6)
South Ogden (8)
Weber-Morgan HD
Wasatch County HD (52)
Provo South (48)
North Orem (44)
West Orem (45)
Lehi/Cedar Valley (41)
Utah Co. South (50)
East Orem (46)
Pleasant Grove/Lindon (43)
American Fork/Alpine (42)
Springville/Spanish Fork (49)
Provo/BYU (47)
Utah County HD
TriCounty HD (53)
Tooele County HD (40)
Summit County HD (51)
Other Washington County (59)
Cedar City (60)
Other Southwest District (61)
St. George (58)
Southwest Utah HD
Carbon/Emery Co. (56)
Grand/San Juan Co. (57)
Southeastern Utah HD
Midvale (32)
West Jordan North (33)
Glendale (21)
Rose Park (17)
Kearns (29)
South Salt Lake (25)
West Valley West (22)
West Valley East (23)
Magna (20)
West Jordan/Copperton (34)
Murray (31)
Taylorsville (30)
Sandy Center (36)
Riverton/Draper (39)
Millcreek (26)
Sandy, Southeast (38)
South Jordan (35)
Holladay (27)
Cottonwood (28)
Sandy, Northeast (37)
Downtown Salt Lake (24)
Foothill/U of U (19)
Avenues (18)
Salt Lake Valley HD
Clearfield/Hill AFB (11)
Syracuse/Kaysville (13)
Farmington/Centerville (14)
Layton (12)
Woods Cross/North SL (15)
Bountiful (16)
Davis County HD
Juab/Millard/Sanpete Co. (54)
Sevier/Piute/Wayne Co. (55)
Central Utah HD
Brigham City (1)
Other Box Elder Co. (2)
Other Cache/Rich Co. (4)
Logan (3)
Bear River HD
Percentage
28
Utah Nutrition and Physical Activity Plan 2010-2020
Description of the Obesity Epidemic in Utah
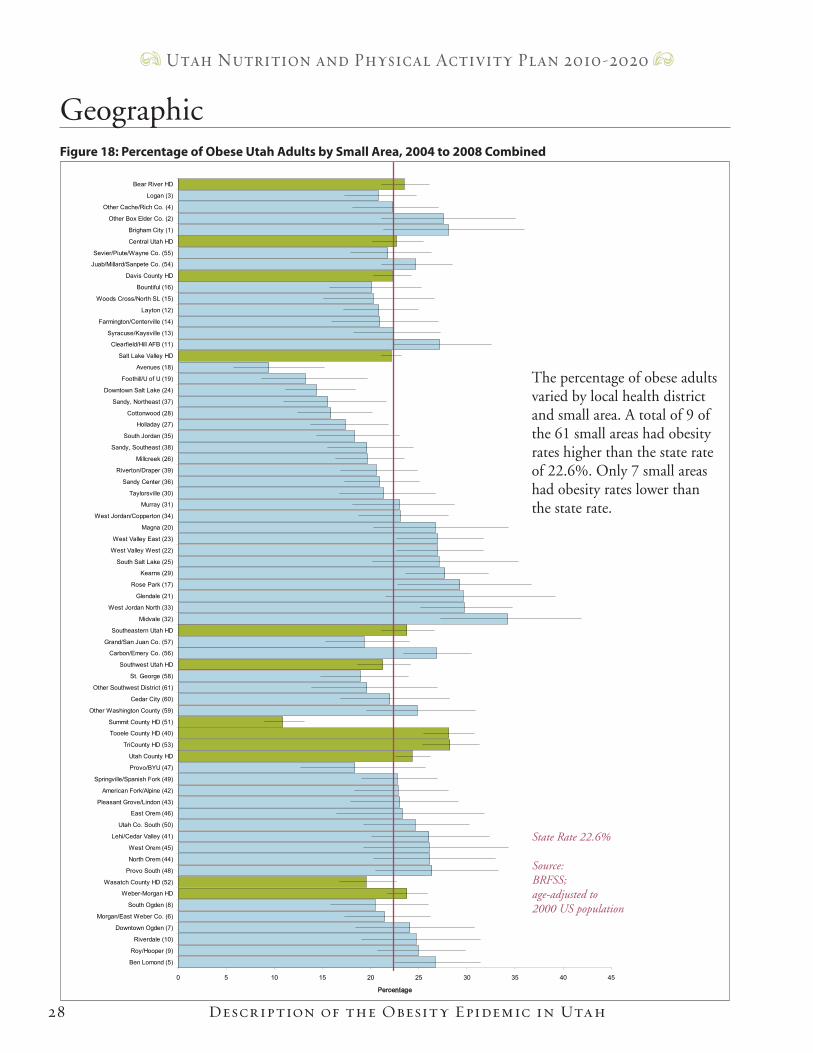
The percentage of obese adults varied by local health district and small area. A total of 9 of the 61 small areas had obesity rates higher than the state rate of 22.6%. Only 7 small areas had obesity rates lower than the state rate.
GeographicFigure 18: Percentage of Obese Utah Adults by Small Area, 2004 to 2008 Combined
State Rate 22.6%
Source: BRFSS; age-adjusted to 2000 US population
Hist
ory
The Easy Choice
History of
Obesity Prevention in Utah
History of Obesity Pr evention in Utah30
Utah Nutrition and Physical Activity Plan 2010-2020
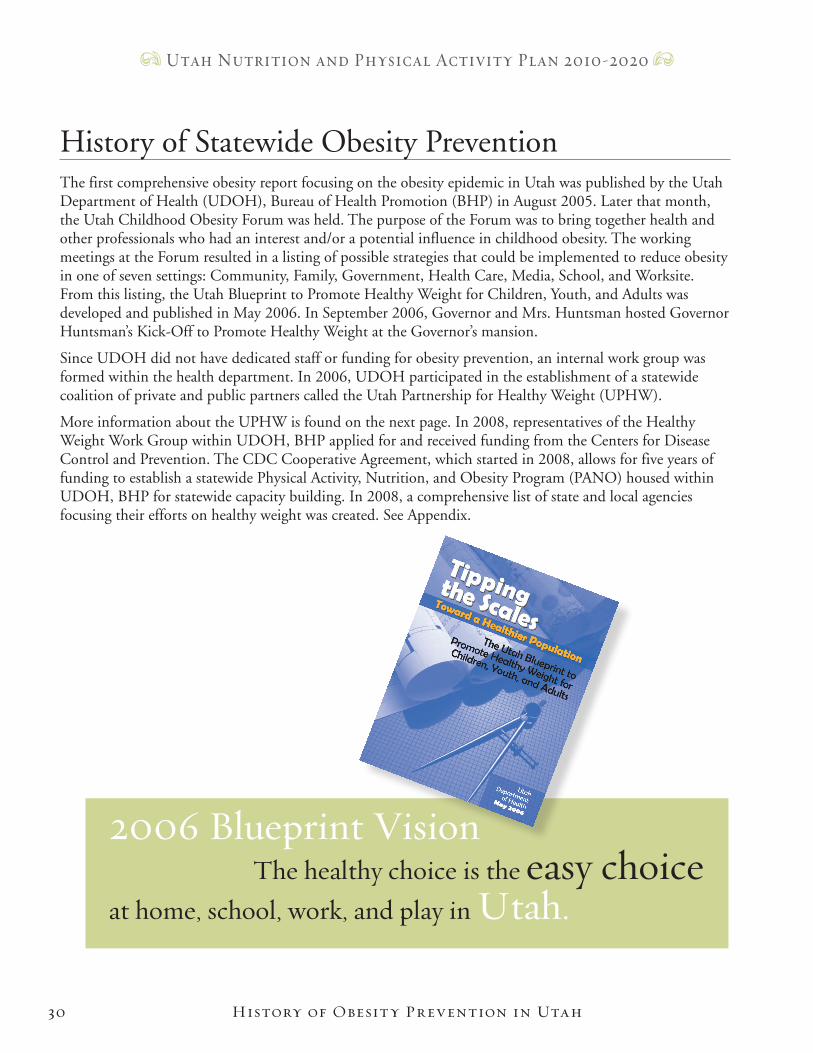
The first comprehensive obesity report focusing on the obesity epidemic in Utah was published by the Utah Department of Health (UDOH), Bureau of Health Promotion (BHP) in August 2005. Later that month, the Utah Childhood Obesity Forum was held. The purpose of the Forum was to bring together health and other professionals who had an interest and/or a potential influence in childhood obesity. The working meetings at the Forum resulted in a listing of possible strategies that could be implemented to reduce obesity in one of seven settings: Community, Family, Government, Health Care, Media, School, and Worksite. From this listing, the Utah Blueprint to Promote Healthy Weight for Children, Youth, and Adults was developed and published in May 2006. In September 2006, Governor and Mrs. Huntsman hosted Governor Huntsman’s Kick-Off to Promote Healthy Weight at the Governor’s mansion.
Since UDOH did not have dedicated staff or funding for obesity prevention, an internal work group was formed within the health department. In 2006, UDOH participated in the establishment of a statewide coalition of private and public partners called the Utah Partnership for Healthy Weight (UPHW).
More information about the UPHW is found on the next page. In 2008, representatives of the Healthy Weight Work Group within UDOH, BHP applied for and received funding from the Centers for Disease Control and Prevention. The CDC Cooperative Agreement, which started in 2008, allows for five years of funding to establish a statewide Physical Activity, Nutrition, and Obesity Program (PANO) housed within UDOH, BHP for statewide capacity building. In 2008, a comprehensive list of state and local agencies focusing their efforts on healthy weight was created. See Appendix.
History of Statewide Obesity Prevention
2006 Blueprint Vision The healthy choice is the easy choice at home, school, work, and play in Utah.
History of Obesity Pr evention in Utah
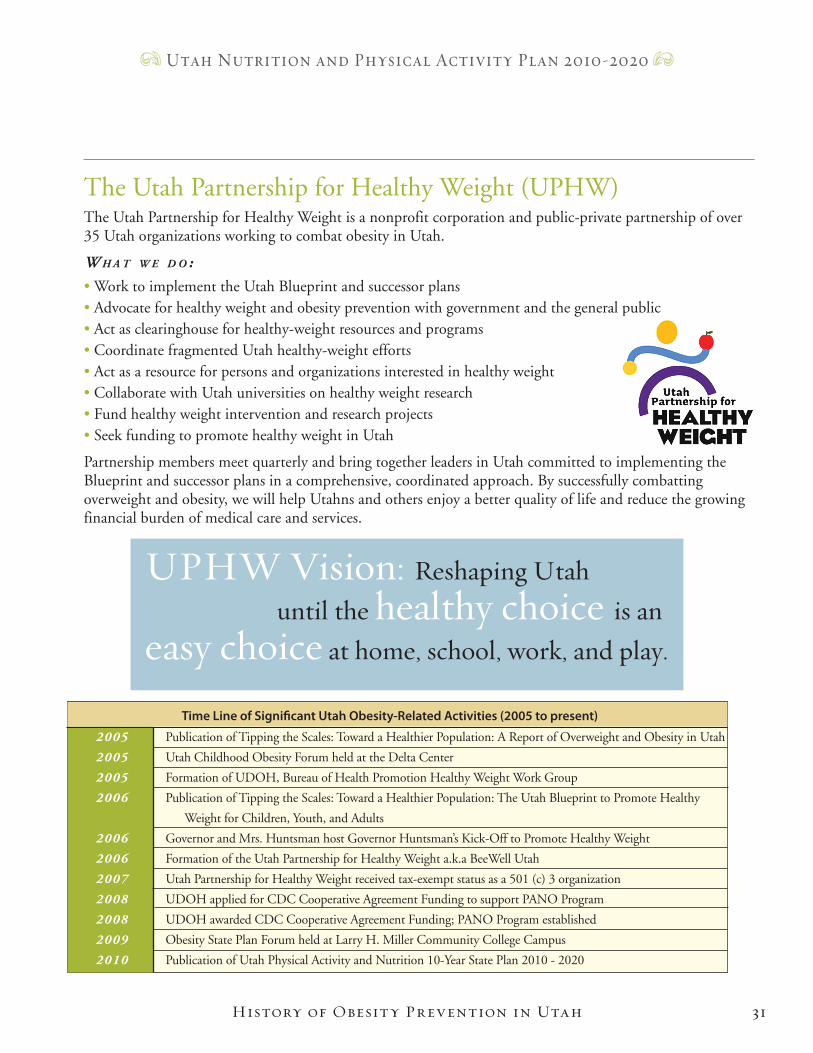
The Utah Partnership for Healthy Weight (UPHW) The Utah Partnership for Healthy Weight is a nonprofit corporation and public-private partnership of over 35 Utah organizations working to combat obesity in Utah.
W h a t W e d o :
• Work to implement the Utah Blueprint and successor plans• Advocate for healthy weight and obesity prevention with government and the general public• Act as clearinghouse for healthy-weight resources and programs • Coordinate fragmented Utah healthy-weight efforts• Act as a resource for persons and organizations interested in healthy weight• Collaborate with Utah universities on healthy weight research• Fund healthy weight intervention and research projects • Seek funding to promote healthy weight in Utah
Partnership members meet quarterly and bring together leaders in Utah committed to implementing the Blueprint and successor plans in a comprehensive, coordinated approach. By successfully combatting overweight and obesity, we will help Utahns and others enjoy a better quality of life and reduce the growing financial burden of medical care and services.
31
Utah Nutrition and Physical Activity Plan 2010-2020
UPHW Vision: Reshaping Utah until the healthy choice is an easy choice at home, school, work, and play.
Publication of Tipping the Scales: Toward a Healthier Population: A Report of Overweight and Obesity in Utah
Utah Childhood Obesity Forum held at the Delta Center
Formation of UDOH, Bureau of Health Promotion Healthy Weight Work Group
Publication of Tipping the Scales: Toward a Healthier Population: The Utah Blueprint to Promote Healthy
Weight for Children, Youth, and Adults
Governor and Mrs. Huntsman host Governor Huntsman’s Kick-Off to Promote Healthy Weight
Formation of the Utah Partnership for Healthy Weight a.k.a BeeWell Utah
Utah Partnership for Healthy Weight received tax-exempt status as a 501 (c) 3 organization
UDOH applied for CDC Cooperative Agreement Funding to support PANO Program
UDOH awarded CDC Cooperative Agreement Funding; PANO Program established
Obesity State Plan Forum held at Larry H. Miller Community College Campus
Publication of Utah Physical Activity and Nutrition 10-Year State Plan 2010 - 2020
2005
2005
2005
2006
2006
2006
2007
2008
2008
2009
2010
Time Line of Signi�cant Utah Obesity-Related Activities (2005 to present)
32
Utah Nutrition and Physical Activity Plan 2010-2020
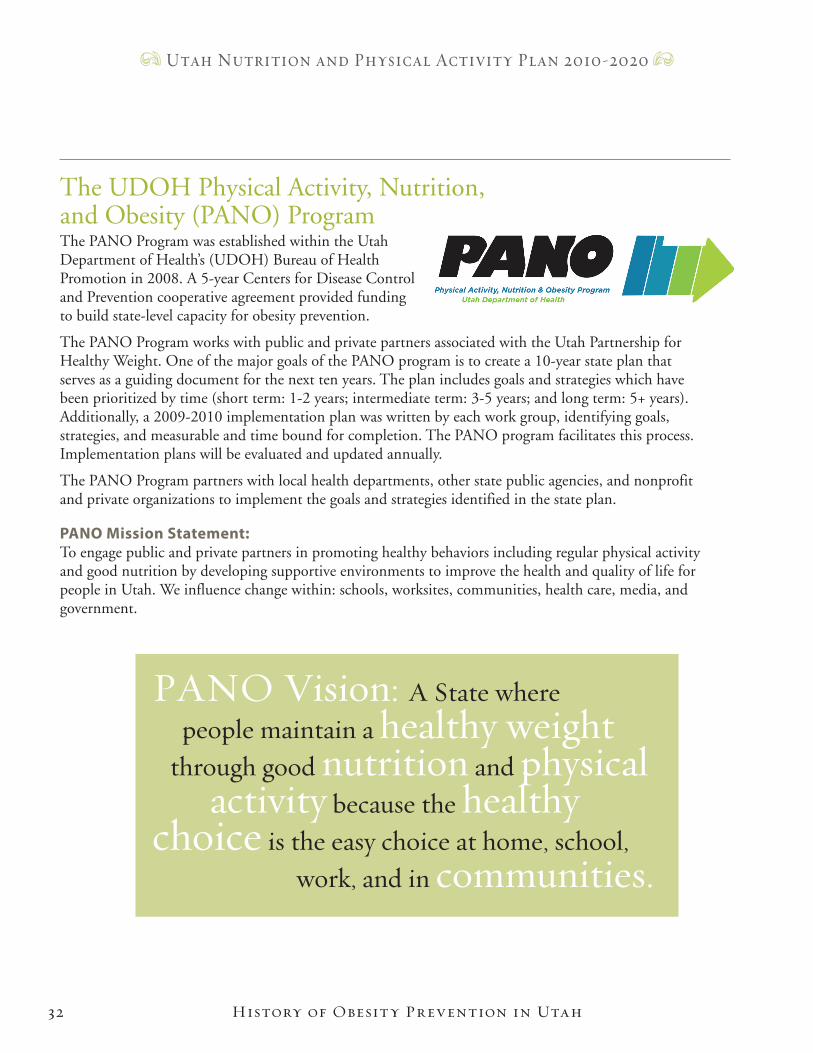
The UDOH Physical Activity, Nutrition, and Obesity (PANO) ProgramThe PANO Program was established within the Utah Department of Health’s (UDOH) Bureau of Health Promotion in 2008. A 5-year Centers for Disease Control and Prevention cooperative agreement provided funding to build state-level capacity for obesity prevention.
The PANO Program works with public and private partners associated with the Utah Partnership for Healthy Weight. One of the major goals of the PANO program is to create a 10-year state plan that serves as a guiding document for the next ten years. The plan includes goals and strategies which have been prioritized by time (short term: 1-2 years; intermediate term: 3-5 years; and long term: 5+ years). Additionally, a 2009-2010 implementation plan was written by each work group, identifying goals, strategies, and measurable and time bound for completion. The PANO program facilitates this process. Implementation plans will be evaluated and updated annually.
The PANO Program partners with local health departments, other state public agencies, and nonprofit and private organizations to implement the goals and strategies identified in the state plan.
PANO Mission Statement: To engage public and private partners in promoting healthy behaviors including regular physical activity and good nutrition by developing supportive environments to improve the health and quality of life for people in Utah. We influence change within: schools, worksites, communities, health care, media, and government.
PANO Vision: A State where people maintain a healthy weight through good nutrition and physical activity because the healthy choice is the easy choice at home, school, work, and in communities.
History of Obesity Pr evention in Utah
Cha
nge
The Easy Choice
Planning for Change
34
Utah Nutrition and Physical Activity Plan 2010-2020
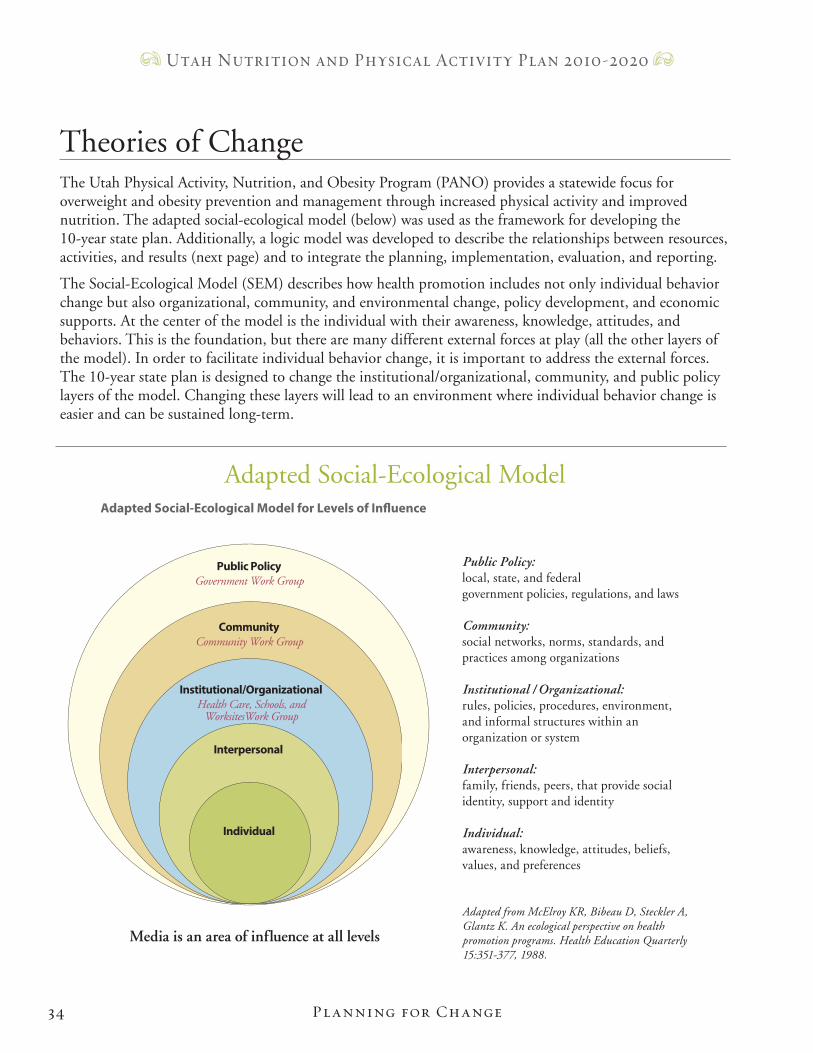
The Utah Physical Activity, Nutrition, and Obesity Program (PANO) provides a statewide focus for overweight and obesity prevention and management through increased physical activity and improved nutrition. The adapted social-ecological model (below) was used as the framework for developing the 10-year state plan. Additionally, a logic model was developed to describe the relationships between resources, activities, and results (next page) and to integrate the planning, implementation, evaluation, and reporting.
The Social-Ecological Model (SEM) describes how health promotion includes not only individual behavior change but also organizational, community, and environmental change, policy development, and economic supports. At the center of the model is the individual with their awareness, knowledge, attitudes, and behaviors. This is the foundation, but there are many different external forces at play (all the other layers of the model). In order to facilitate individual behavior change, it is important to address the external forces. The 10-year state plan is designed to change the institutional/organizational, community, and public policy layers of the model. Changing these layers will lead to an environment where individual behavior change is easier and can be sustained long-term.
Theories of Change
Planning for Change
Adapted Social-Ecological Model
Public PolicyGovernment Work Group
CommunityCommunity Work Group
Institutional/OrganizationalHealth Care, Schools, and
WorksitesWork Group
Interpersonal
Individual
Public Policy: local, state, and federal government policies, regulations, and laws
Community: social networks, norms, standards, and practices among organizations
Institutional / Organizational: rules, policies, procedures, environment, and informal structures within an organization or system
Interpersonal: family, friends, peers, that provide social identity, support and identity
Individual: awareness, knowledge, attitudes, beliefs, values, and preferences
Adapted from McElroy KR, Bibeau D, Steckler A, Glantz K. An ecological perspective on health promotion programs. Health Education Quarterly 15:351-377, 1988.
Adapted Social-Ecological Model for Levels of Influence
Media is an area of influence at all levels
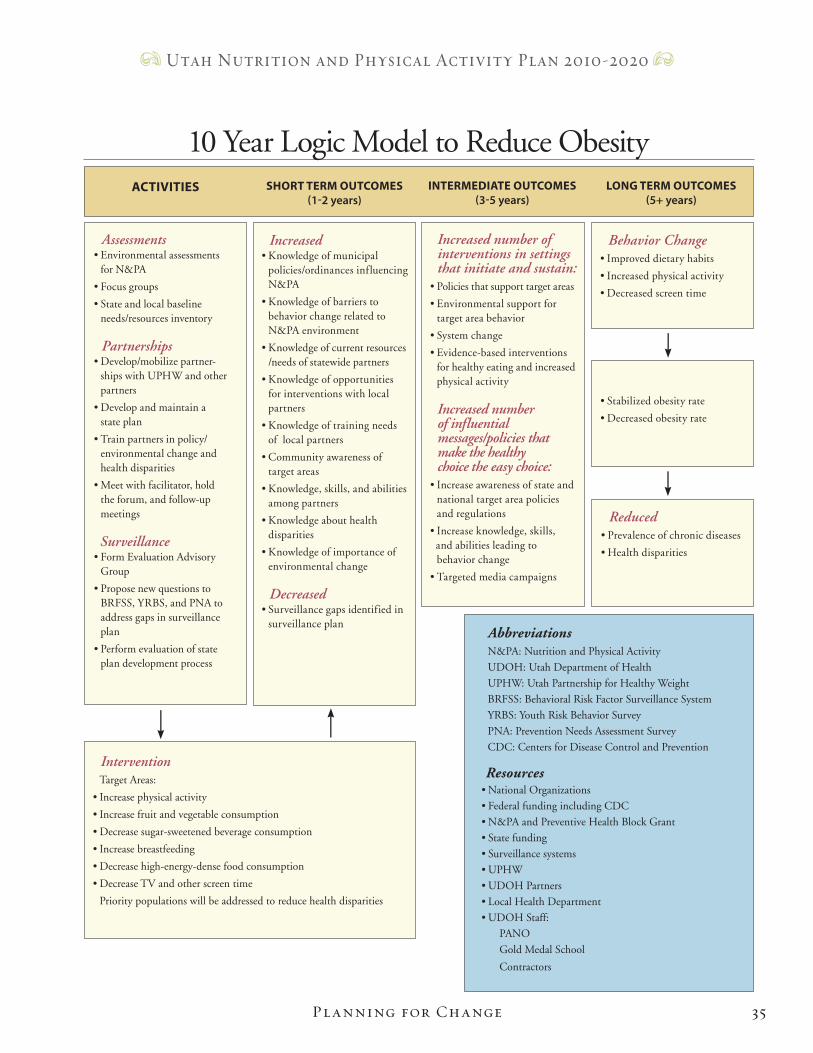
10 Year Logic Model to Reduce Obesity
AbbreviationsN&PA: Nutrition and Physical Activity
UDOH: Utah Department of Health
UPHW: Utah Partnership for Healthy Weight
BRFSS: Behavioral Risk Factor Surveillance System
YRBS: Youth Risk Behavior Survey
PNA: Prevention Needs Assessment Survey
CDC: Centers for Disease Control and Prevention
Resources• National Organizations
• Federal funding including CDC
• N&PA and Preventive Health Block Grant
• State funding
• Surveillance systems
• UPHW
• UDOH Partners
• Local Health Department
• UDOH Staff:
PANO
Gold Medal School
Contractors
ACTIVITIES SHORT TERM OUTCOMES (1-2 years)
INTERMEDIATE OUTCOMES (3-5 years)
LONG TERM OUTCOMES (5+ years)
Increased number of interventions in settings that initiate and sustain:• Policies that support target areas
• Environmental support for target area behavior
• System change
• Evidence-based interventions for healthy eating and increased physical activity
Increased number of influential messages/policies that make the healthy choice the easy choice:• Increase awareness of state and national target area policies and regulations
• Increase knowledge, skills, and abilities leading to behavior change
• Targeted media campaigns
Increased• Knowledge of municipal policies/ordinances influencing N&PA
• Knowledge of barriers to behavior change related to N&PA environment
• Knowledge of current resources /needs of statewide partners
• Knowledge of opportunities for interventions with local partners
• Knowledge of training needs of local partners
• Community awareness of target areas
• Knowledge, skills, and abilities among partners
• Knowledge about health disparities
• Knowledge of importance of environmental change Decreased• Surveillance gaps identified in surveillance plan
Assessments• Environmental assessments for N&PA
• Focus groups
• State and local baseline needs/resources inventory
Partnerships• Develop/mobilize partner- ships with UPHW and other partners
• Develop and maintain a state plan
• Train partners in policy/ environmental change and health disparities
• Meet with facilitator, hold the forum, and follow-up meetings Surveillance• Form Evaluation Advisory Group
• Propose new questions to BRFSS, YRBS, and PNA to address gaps in surveillance plan
• Perform evaluation of state plan development process
Intervention Target Areas:
• Increase physical activity
• Increase fruit and vegetable consumption
• Decrease sugar-sweetened beverage consumption
• Increase breastfeeding
• Decrease high-energy-dense food consumption
• Decrease TV and other screen time
Priority populations will be addressed to reduce health disparities
Behavior Change• Improved dietary habits
• Increased physical activity
• Decreased screen time
• Stabilized obesity rate
• Decreased obesity rate
Reduced• Prevalence of chronic diseases
• Health disparities
35
Utah Nutrition and Physical Activity Plan 2010-2020
Planning for Change
36
Utah Nutrition and Physical Activity Plan 2010-2020
Six Target AreasThe Centers for Disease Control and Prevention has identified six target areas for state obesity prevention programs. These target areas are based on the current and emerging or promising evidence that most likely impact overweight and obesity. The target areas include:
• Increase Physical ActivityChanging physical activity behaviors requires an understanding of how factors at each level of the social-ecological model affect an individual’s physical activity behaviors. Therefore, understanding the determinants of physical activity becomes the cornerstone in setting policies, recommendations, and guidelines that better enable individuals and communities to engage in physical activity as part of a healthful lifestyle and helps to guide the development, implementation, and evaluation of interventions.
• Increase Consumption of Fruits and VegetablesPublic health approaches for eating behavior change in populations have focused on increasing individual knowledge and awareness through educational approaches. Many barriers prevent adequate consumption of fruits and vegetables including lack of knowledge about health benefits, availability, cost, individual taste preference, social support, preparation skills, and time available for preparing food. Studies also show disparities in access to fruits and vegetables as measured by type of stores, geographic distance, or store concentration. Choosing healthy foods is difficult in environments where retail establishments are comprised mainly of convenience stores and fast food restaurants or for individuals dependent on public transportation for supermarket access.
• Decrease Consumption of Sugar-Sweetened BeveragesPotential health problems associated with high intake of sugar-sweetened beverages include weight gain, overweight, or obesity as a result of additional calories in the diet, displacement of milk consumption which can contribute to reduced calcium intake with an attendant risk of osteoporosis and fractures, displacement of other key nutrients, and dental caries/potential enamel erosion. Environmental changes in homes, communities, workplaces, and schools include making water and low-calorie beverages the easy choice by ensuring that they are available and limiting access to sugar-sweetened beverages.
• Increase Breastfeeding Initiation, Exclusivity, and DurationMany barriers make it difficult for mothers to meet their breastfeeding goals. Routine practices in hospitals often interfere with establishment of early breastfeeding. Mothers often do not receive or have access to support from health care professionals when they encounter difficulties with breastfeeding. Mothers encounter social disapproval from society when they choose to breastfeed in public places. When they choose to work outside the home, they encounter rigid schedules, lack of support from employers and coworkers, and difficulties in finding the time to breastfeed or express milk for their infants.
Six Target Areas and Priority Populations
Planning for Change
37
Utah Nutrition and Physical Activity Plan 2010-2020
• Reduce the Consumption of High-Energy-Dense FoodsThe current food supply contains a significant amount of high-energy-dense foods. Many of these are processed foods that are high in fat and/or sugar and low in nutrients. Portion sizes have also increased over the past two decades in restaurants, grocery stores, and vending machines. Portion sizes for manufactured and restaurant foods in the U.S. increased dramatically in the 1980s, and have continued to grow gradually. Promising strategies to decrease high-energy-dense food consumption include substituting low-energy-dense foods, decreasing the portion size of high-energy-dense foods, and limiting the availability of high-energy-dense foods.
• Decrease Television ViewingWatching television is common in most U.S. households, and many children and adults enjoy watching television, not perceiving the amount of time they watch as a problem. There also is substantial confusion as to what television limits would entail and what “counts.” Reducing television time would require parents to find alternative activities to keep children safe and quietly engaged, and it could also prevent parents from accomplishing other tasks, increase conflict between parents and children or between siblings, and would require parents to change their own television viewing behavior.
Priority PopulationsPriority populations include those where the burden of disease is highest (based on data), those that have historically been disenfranchised, and those with limited access to resources due to geographic or socioeconomic f actors.
PRioRity PoPulationS include, but aRe not limited to:
• Children
• Elderly
• Clinically depressed children, youth, and adults
• People with disabilities
• Socioeconomically disadvantaged people
• People who live in rural and frontier areas
• Race/ethnic minorities
• Refugees
Results of recent focus groups conducted in different geographic regions of Utah, showed that different race/ethnic groups have differing opinions of what is healthy, what constitutes physical activity, and what interventions would mesh with their overall culture. It became apparent that matching interventions with the geographical and cultural norms will be critical to optimize permanent change. Social marketing and key informant interviews with individuals in the community will lead to important information to target appropriate interventions.
Assessment of resources and gaps in existing programs relevant to priority populations will be identified.
Planning for Change
38
Utah Nutrition and Physical Activity Plan 2010-2020
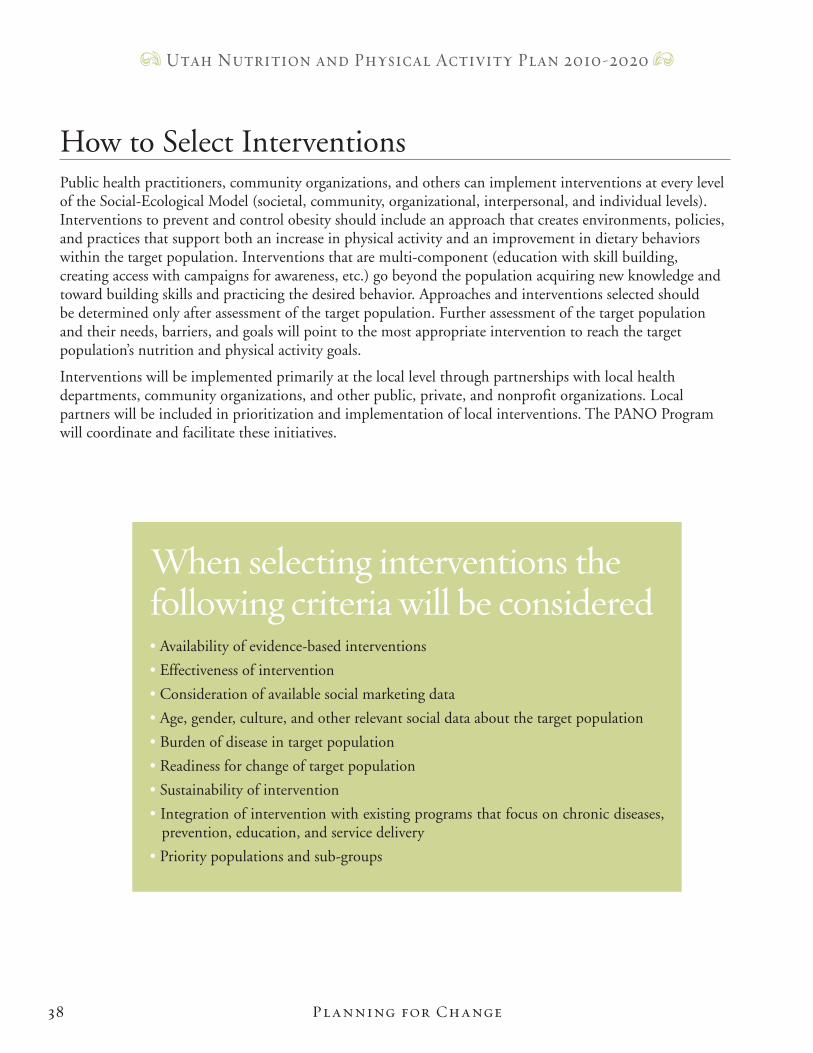
Public health practitioners, community organizations, and others can implement interventions at every level of the Social-Ecological Model (societal, community, organizational, interpersonal, and individual levels). Interventions to prevent and control obesity should include an approach that creates environments, policies, and practices that support both an increase in physical activity and an improvement in dietary behaviors within the target population. Interventions that are multi-component (education with skill building, creating access with campaigns for awareness, etc.) go beyond the population acquiring new knowledge and toward building skills and practicing the desired behavior. Approaches and interventions selected should be determined only after assessment of the target population. Further assessment of the target population and their needs, barriers, and goals will point to the most appropriate intervention to reach the target population’s nutrition and physical activity goals.
Interventions will be implemented primarily at the local level through partnerships with local health departments, community organizations, and other public, private, and nonprofit organizations. Local partners will be included in prioritization and implementation of local interventions. The PANO Program will coordinate and facilitate these initiatives.
How to Select Interventions
When selecting interventions the following criteria will be considered• Availability of evidence-based interventions
• Effectiveness of intervention
• Consideration of available social marketing data
• Age, gender, culture, and other relevant social data about the target population
• Burden of disease in target population
• Readiness for change of target population
• Sustainability of intervention
• Integration of intervention with existing programs that focus on chronic diseases, prevention, education, and service delivery
• Priority populations and sub-groups
Planning for Change
The Easy Choice
Planning through Partnerships
Part
ners
hips
40
Utah Nutrition and Physical Activity Plan 2010-2020
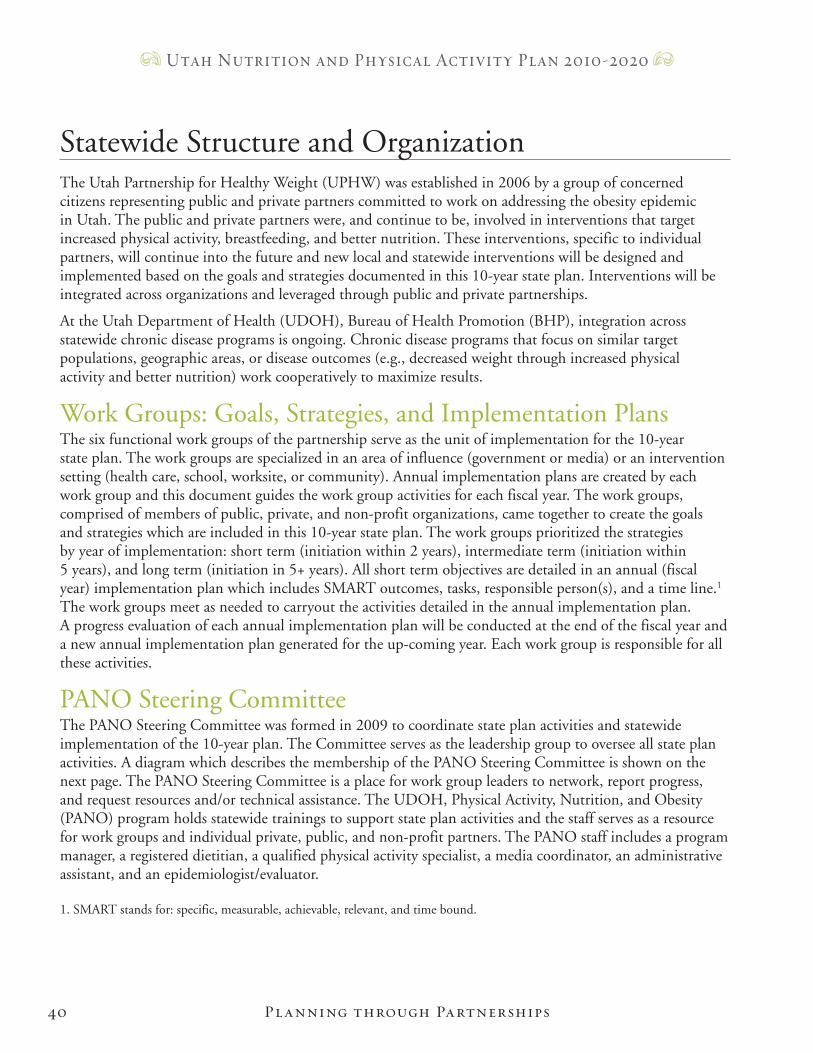
The Utah Partnership for Healthy Weight (UPHW) was established in 2006 by a group of concerned citizens representing public and private partners committed to work on addressing the obesity epidemic in Utah. The public and private partners were, and continue to be, involved in interventions that target increased physical activity, breastfeeding, and better nutrition. These interventions, specific to individual partners, will continue into the future and new local and statewide interventions will be designed and implemented based on the goals and strategies documented in this 10-year state plan. Interventions will be integrated across organizations and leveraged through public and private partnerships.
At the Utah Department of Health (UDOH), Bureau of Health Promotion (BHP), integration across statewide chronic disease programs is ongoing. Chronic disease programs that focus on similar target populations, geographic areas, or disease outcomes (e.g., decreased weight through increased physical activity and better nutrition) work cooperatively to maximize results.
Work Groups: Goals, Strategies, and Implementation PlansThe six functional work groups of the partnership serve as the unit of implementation for the 10-year state plan. The work groups are specialized in an area of influence (government or media) or an intervention setting (health care, school, worksite, or community). Annual implementation plans are created by each work group and this document guides the work group activities for each fiscal year. The work groups, comprised of members of public, private, and non-profit organizations, came together to create the goals and strategies which are included in this 10-year state plan. The work groups prioritized the strategies by year of implementation: short term (initiation within 2 years), intermediate term (initiation within 5 years), and long term (initiation in 5+ years). All short term objectives are detailed in an annual (fiscal year) implementation plan which includes SMART outcomes, tasks, responsible person(s), and a time line.1 The work groups meet as needed to carryout the activities detailed in the annual implementation plan. A progress evaluation of each annual implementation plan will be conducted at the end of the fiscal year and a new annual implementation plan generated for the up-coming year. Each work group is responsible for all these activities.
PANO Steering CommitteeThe PANO Steering Committee was formed in 2009 to coordinate state plan activities and statewide implementation of the 10-year plan. The Committee serves as the leadership group to oversee all state plan activities. A diagram which describes the membership of the PANO Steering Committee is shown on the next page. The PANO Steering Committee is a place for work group leaders to network, report progress, and request resources and/or technical assistance. The UDOH, Physical Activity, Nutrition, and Obesity (PANO) program holds statewide trainings to support state plan activities and the staff serves as a resource for work groups and individual private, public, and non-profit partners. The PANO staff includes a program manager, a registered dietitian, a qualified physical activity specialist, a media coordinator, an administrative assistant, and an epidemiologist/evaluator.
1. SMART stands for: specific, measurable, achievable, relevant, and time bound.
Statewide Structure and Organization
Planning through Partnerships
41
Utah Nutrition and Physical Activity Plan 2010-2020
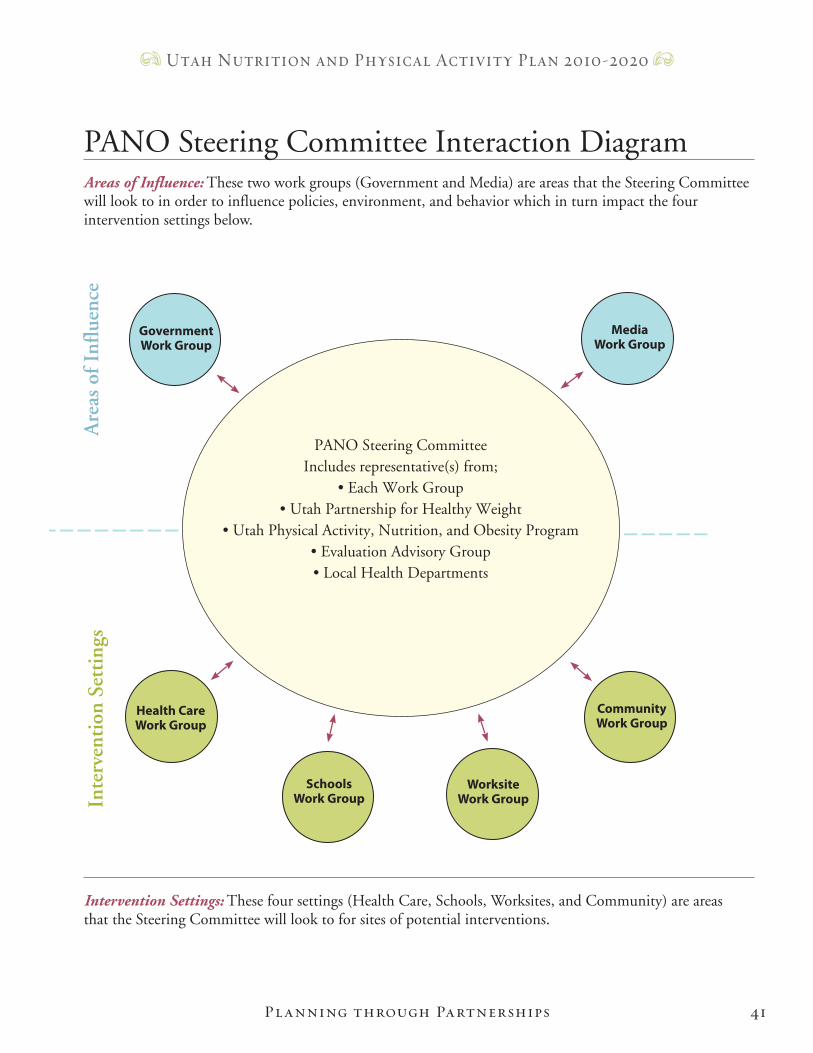
PANO Steering Committee Interaction DiagramAreas of Influence: These two work groups (Government and Media) are areas that the Steering Committee will look to in order to influence policies, environment, and behavior which in turn impact the four intervention settings below.
Intervention Settings: These four settings (Health Care, Schools, Worksites, and Community) are areas that the Steering Committee will look to for sites of potential interventions.
Planning through Partnerships
Media Work Group
Community Work Group
Worksite Work Group
Schools Work Group
Health CareWork Group
GovernmentWork Group
Are
as o
f Inf
luen
ceIn
terv
enti
on S
etti
ngs
– – – – – – – – – – –
PANO Steering CommitteeIncludes representative(s) from;
• Each Work Group• Utah Partnership for Healthy Weight
• Utah Physical Activity, Nutrition, and Obesity Program• Evaluation Advisory Group• Local Health Departments
– – – – – – – – – – –
42
Utah Nutrition and Physical Activity Plan 2010-2020
PANO Steering Committee, continuedThe PANO Steering Committee first convened in September 2009. The Committee agreed on key functions. The key functions of the PANO Steering Committee are to (1) manage work group plans, (2) report on progress, (3) coordinate between/among the work groups, and (4) find resources to support each work group.
Public-private working groups should be formed around key themes or around the major settings in which obesity prevention and treatment
efforts need to take place. The Surgeon General’s Call to Action to Prevent and Decrease Overweight and Obesity, 2001
Planning through Partnerships
The Easy Choice
Goals and Strategies
Stra
tegi
es
44
Utah Nutrition and Physical Activity Plan 2010-2020
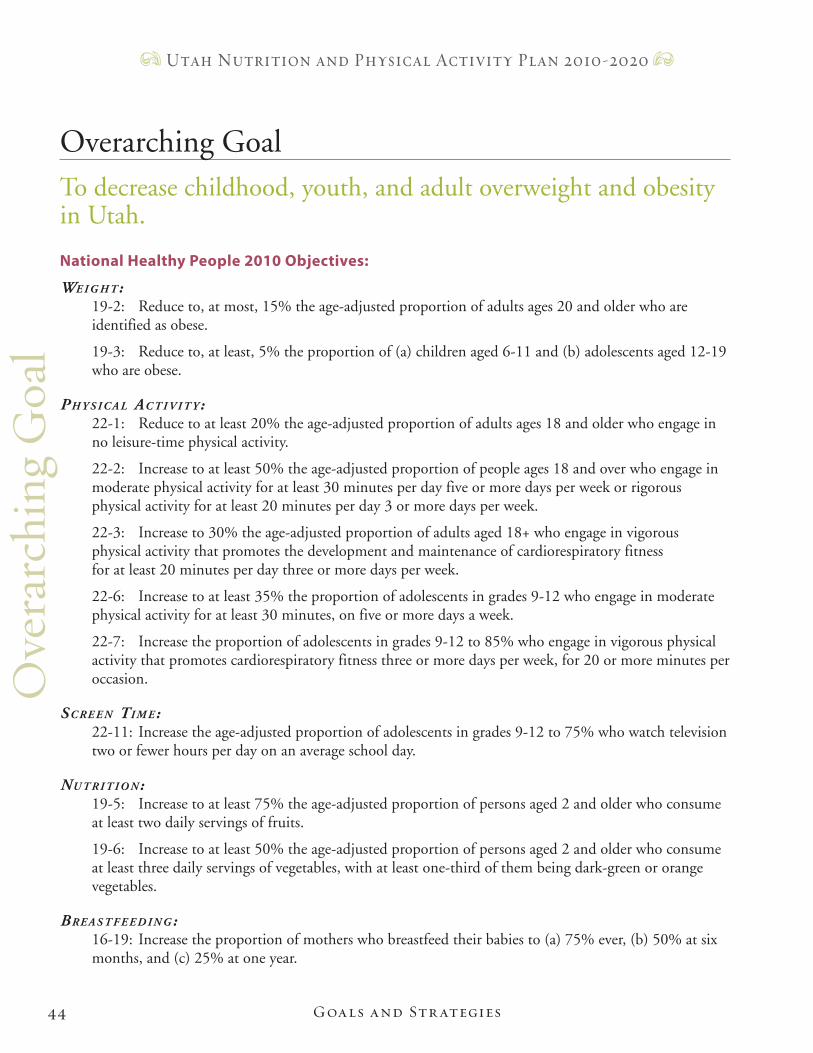
To decrease childhood, youth, and adult overweight and obesity in Utah.
National Healthy People 2010 Objectives:
We i g h t:19-2: Reduce to, at most, 15% the age-adjusted proportion of adults ages 20 and older who are identified as obese.
19-3: Reduce to, at least, 5% the proportion of (a) children aged 6-11 and (b) adolescents aged 12-19 who are obese.
Ph y S i c a l ac t i v i t y:22-1: Reduce to at least 20% the age-adjusted proportion of adults ages 18 and older who engage in no leisure-time physical activity.
22-2: Increase to at least 50% the age-adjusted proportion of people ages 18 and over who engage in moderate physical activity for at least 30 minutes per day five or more days per week or rigorous physical activity for at least 20 minutes per day 3 or more days per week.
22-3: Increase to 30% the age-adjusted proportion of adults aged 18+ who engage in vigorous physical activity that promotes the development and maintenance of cardiorespiratory fitness for at least 20 minutes per day three or more days per week.
22-6: Increase to at least 35% the proportion of adolescents in grades 9-12 who engage in moderate physical activity for at least 30 minutes, on five or more days a week.
22-7: Increase the proportion of adolescents in grades 9-12 to 85% who engage in vigorous physical activity that promotes cardiorespiratory fitness three or more days per week, for 20 or more minutes per occasion.
Sc Re e n ti m e:22-11: Increase the age-adjusted proportion of adolescents in grades 9-12 to 75% who watch television two or fewer hours per day on an average school day.
nu t R i t i o n:19-5: Increase to at least 75% the age-adjusted proportion of persons aged 2 and older who consume at least two daily servings of fruits.
19-6: Increase to at least 50% the age-adjusted proportion of persons aged 2 and older who consume at least three daily servings of vegetables, with at least one-third of them being dark-green or orange vegetables.
bRe a S t f e e d i n g:16-19: Increase the proportion of mothers who breastfeed their babies to (a) 75% ever, (b) 50% at six months, and (c) 25% at one year.
Overarching Goal
Goals and Str ategies
Ove
rarc
hing
Goa
l
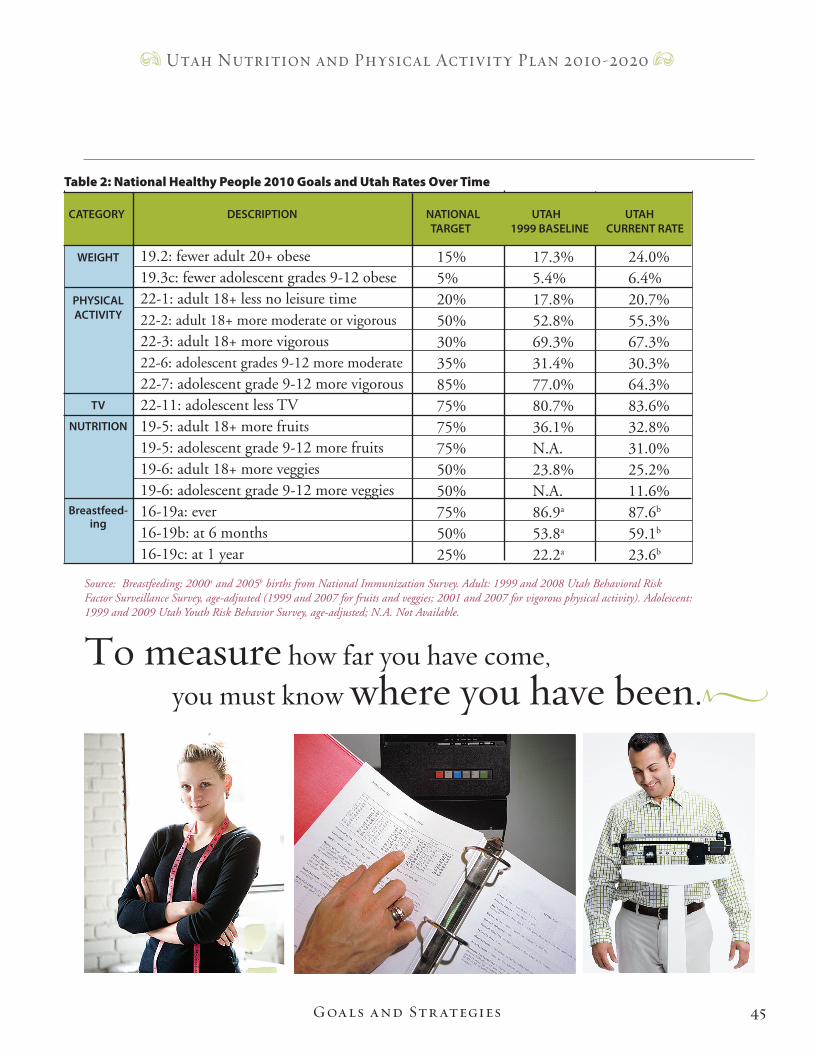
45
Utah Nutrition and Physical Activity Plan 2010-2020
Source: Breastfeeding; 2000a and 2005b births from National Immunization Survey. Adult: 1999 and 2008 Utah Behavioral Risk Factor Surveillance Survey, age-adjusted (1999 and 2007 for fruits and veggies; 2001 and 2007 for vigorous physical activity). Adolescent: 1999 and 2009 Utah Youth Risk Behavior Survey, age-adjusted; N.A. Not Available.
Table 2: National Healthy People 2010 Goals and Utah Rates Over Time
19.2: fewer adult 20+ obese 19.3c: fewer adolescent grades 9-12 obese 22-1: adult 18+ less no leisure time 22-2: adult 18+ more moderate or vigorous22-3: adult 18+ more vigorous 22-6: adolescent grades 9-12 more moderate22-7: adolescent grade 9-12 more vigorous22-11: adolescent less TV 19-5: adult 18+ more fruits 19-5: adolescent grade 9-12 more fruits 19-6: adult 18+ more veggies 19-6: adolescent grade 9-12 more veggies 16-19a: ever 16-19b: at 6 months 16-19c: at 1 year
15% 17.3% 24.0% 5% 5.4% 6.4% 20% 17.8% 20.7% 50% 52.8% 55.3% 30% 69.3% 67.3% 35% 31.4% 30.3% 85% 77.0% 64.3% 75% 80.7% 83.6% 75% 36.1% 32.8% 75% N.A. 31.0% 50% 23.8% 25.2% 50% N.A. 11.6% 75% 86.9a 87.6b
50% 53.8a 59.1b
25% 22.2a 23.6b
CATEGORY DESCRIPTION NATIONAL UTAH UTAH TARGET 1999 BASELINE CURRENT RATE
WEIGHT
PHYSICAL ACTIVITY
TV NUTRITION
Breastfeed-ing
To measure how far you have come, you must know where you have been.
Goals and Str ategies
46
Utah Nutrition and Physical Activity Plan 2010-2020
In order to effectively tackle the problem of overweight and obesity in Utah, many resources, both public and private, are needed to bring about change. A statewide partnership consisting of both public and private organizations collaborated to develop this 10-year state plan which provides a platform for cooperative efforts.
Building partnerships is important to bring together various perspectives, assuring diversity and the ability to respond to the needs of various populations. Partners may also provide leaders, people who are in high-profile professional or management positions in influential organizations, who can be instrumental in leading the implementation of the 10-year state plan goals and strategies.
The Utah Department of Health (UDOH), Physical Activity, Nutrition, and Obesity (PANO) Program staff will spearhead the goals and strategies listed in this section.
Partnerships
Never doubt that a small group of thoughtful, committed citizens can change the world; indeed, it's the only thing that ever has. M a r g a r e t M e a d
• Build capacity
• Share knowledge
• Build grass roots support
• Minimize redundant work
• Set a statewide agenda
By working together the partnership can:
Goals and Str ategies
Part
ners
hips
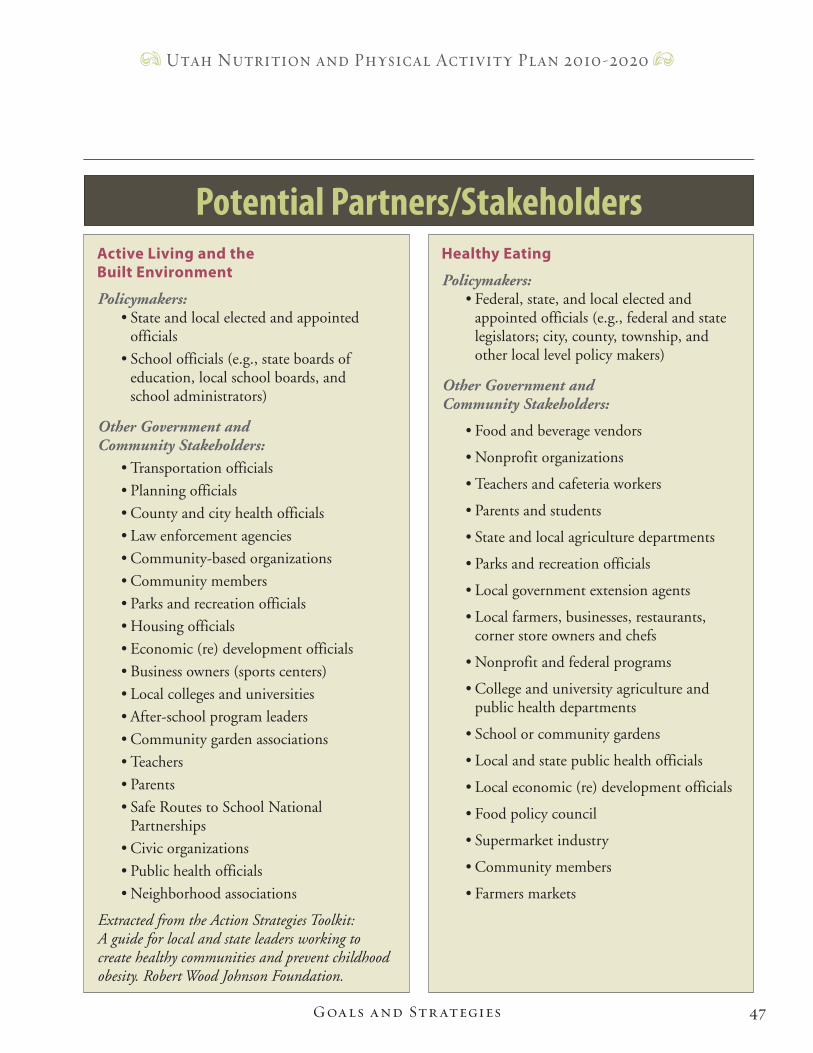
47
Utah Nutrition and Physical Activity Plan 2010-2020
Goals and Str ategies
Active Living and the Built Environment
Policymakers:• State and local elected and appointed officials
• School officials (e.g., state boards of education, local school boards, and school administrators)
Other Government and Community Stakeholders:
• Transportation officials
• Planning officials
• County and city health officials
• Law enforcement agencies
• Community-based organizations
• Community members
• Parks and recreation officials
• Housing officials
• Economic (re) development officials
• Business owners (sports centers)
• Local colleges and universities
• After-school program leaders
• Community garden associations
• Teachers
• Parents
• Safe Routes to School National Partnerships
• Civic organizations
• Public health officials
• Neighborhood associations
Extracted from the Action Strategies Toolkit: A guide for local and state leaders working to create healthy communities and prevent childhood obesity. Robert Wood Johnson Foundation.
Healthy Eating
Policymakers:• Federal, state, and local elected and appointed officials (e.g., federal and state legislators; city, county, township, and other local level policy makers)
Other Government and Community Stakeholders:
• Food and beverage vendors
• Nonprofit organizations
• Teachers and cafeteria workers
• Parents and students
• State and local agriculture departments
• Parks and recreation officials
• Local government extension agents
• Local farmers, businesses, restaurants, corner store owners and chefs
• Nonprofit and federal programs
• College and university agriculture and public health departments
• School or community gardens
• Local and state public health officials
• Local economic (re) development officials
• Food policy council
• Supermarket industry
• Community members
• Farmers markets
Potential Partners/Stakeholders
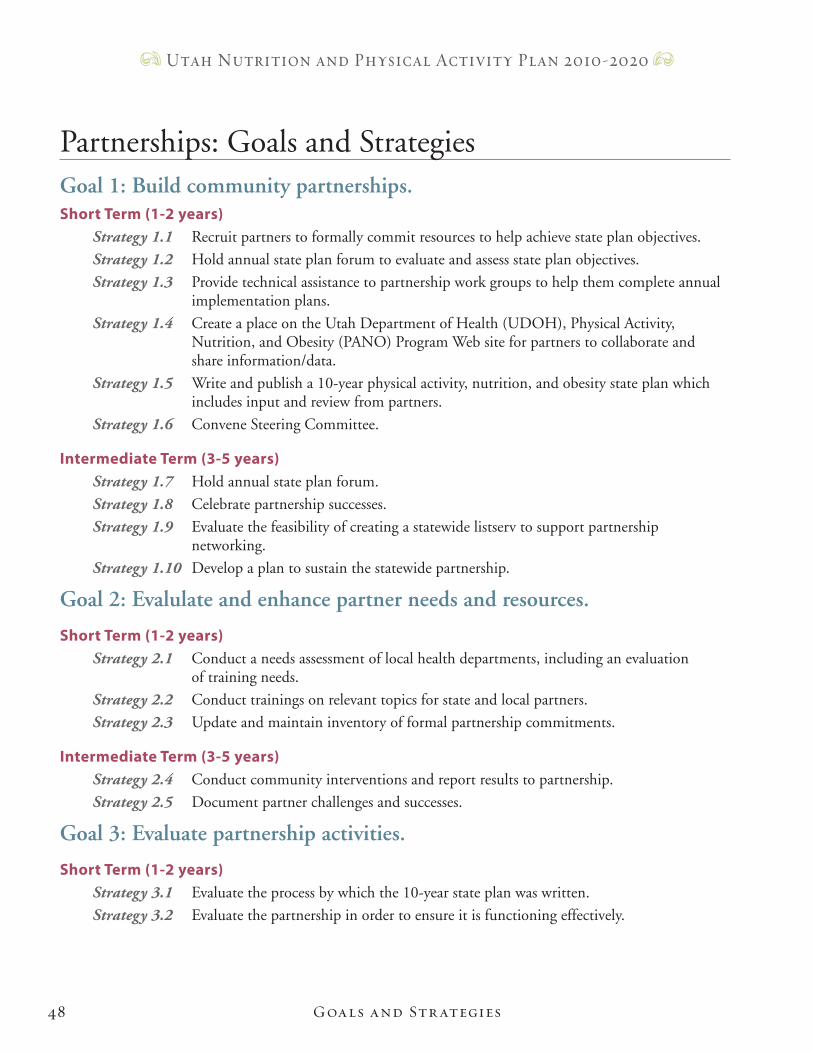
48
Utah Nutrition and Physical Activity Plan 2010-2020
Goal 1: Build community partnerships.Short Term (1-2 years)
Strategy 1.1 Recruit partners to formally commit resources to help achieve state plan objectives.
Strategy 1.2 Hold annual state plan forum to evaluate and assess state plan objectives.
Strategy 1.3 Provide technical assistance to partnership work groups to help them complete annual implementation plans.
Strategy 1.4 Create a place on the Utah Department of Health (UDOH), Physical Activity, Nutrition, and Obesity (PANO) Program Web site for partners to collaborate and share information/data.
Strategy 1.5 Write and publish a 10-year physical activity, nutrition, and obesity state plan which includes input and review from partners.
Strategy 1.6 Convene Steering Committee.
Intermediate Term (3-5 years)Strategy 1.7 Hold annual state plan forum.
Strategy 1.8 Celebrate partnership successes.
Strategy 1.9 Evaluate the feasibility of creating a statewide listserv to support partnership networking.
Strategy 1.10 Develop a plan to sustain the statewide partnership.
Goal 2: Evalulate and enhance partner needs and resources.
Short Term (1-2 years)Strategy 2.1 Conduct a needs assessment of local health departments, including an evaluation of training needs.
Strategy 2.2 Conduct trainings on relevant topics for state and local partners.
Strategy 2.3 Update and maintain inventory of formal partnership commitments.
Intermediate Term (3-5 years)Strategy 2.4 Conduct community interventions and report results to partnership.
Strategy 2.5 Document partner challenges and successes.
Goal 3: Evaluate partnership activities.
Short Term (1-2 years)Strategy 3.1 Evaluate the process by which the 10-year state plan was written.
Strategy 3.2 Evaluate the partnership in order to ensure it is functioning effectively.
Partnerships: Goals and Strategies
Goals and Str ategies
49
Utah Nutrition and Physical Activity Plan 2010-2020
Intermediate (3-5 years)Strategy 3.3 Evaluate the partnership on a periodic, ongoing basis.
Strategy 3.4 Evaluate effectiveness of Steering Committee.
Goal 4: Support collaboration.
Short Term (1-2 years)Strategy 4.1 Collaborate with a local university to conduct a community audit of planning codes for nutrition and physical activity access and distribute results.
Strategy 4.2 Support local, state, and national organizations working to create change that supports the goals and strategies in the 10-year state plan.
Goal 3: Support Healthy Communities.
Short Term (1-2 years)Strategy 5.1 Research key components of partnerships in healthy communities.
Strategy 5.2 Establish an advisory committee for Healthy Communities comprised of local health departments and community organizations.
Strategy 5.3 Create an on-line resource to assist local community efforts.
Strategy 5.4 Support local health departments to provide technical assistance to local communities.
Intermediate Term (3-5 years)Strategy 5.5 Establish and improve community partnerships.
Strategy 5.6 Support local initiatives to promote healthy communities.
Goals and Str ategies
Are
as o
f Inf
luen
ce: G
over
nmen
t
50
Utah Nutrition and Physical Activity Plan 2010-2020
The obesity epidemic is upon us and it affects children, youth, and adults. Especially troubling is the childhood epidemic. “Despite steady progress over most of the past century toward ensuring the health of our country’s children, we begin the 21st century with a startling setback—an epidemic of childhood obesity. This epidemic is occurring in boys and girls in all 50 states, in younger children as well as adolescents, across all socioeconomic strata, and among all ethnic groups…” 1
There is consensus among medical and public health professionals that private and public institutions must work together through environmental and policy change to create an environment where the healthy choice is the easy choice, leading to a decrease in obesity rates.1, 2, 3, 4, 5 It is the government’s role to facilitate, coordinate, and to provide leadership to all organizations in order to create enduring environmental and policy change. The executive and legislative branches of government at the federal, state, and local levels must come forward to provide leadership by involving multiple partners and coordinating efforts for obesity prevention.
All levels of government must work together. State government leaders can be involved by communicating the need for change and making policy-related decisions to support obesity prevention. The government creates a venue for interested members of the community to come together to share ideas and resources. It creates, proposes, passes, and enforces legislation and ensures that individuals have access to safe venues for exercise and access to healthy foods at home, school, work, and play. Together all of these activities can lead to opportunities for individual change and a chance to decrease obesity in Utah and the US.
re f e re n c e s :1. Institutes of Medicine. Preventing Childhood Obesity: Health in the Balance. Washington, D.C.: National Academies Press, 2005.
2. The Trust for American’s Health. Blueprint for a Healthier America: Modernizing the Federal Public Health System to Focus on Prevention and Preparedness. October 2008.
3. Centers for Disease Control and Prevention. Obesity: Halting the Epidemic by Making Health Easier. Retrieved from the World Wide Web on June 22, 2009. Located at http://www.cdc.gov/NCCdphp/publications/AAG/obesity.htm.
4. National Governor’s Association. Creating Healthy States: Actions for Governors. National Governor’s Association. February 25, 2006.
5. Office of the Surgeon General. The Surgeon General’s Call to Action to Prevent and Decrease Overweight and Obesity. Rockville, MD: U.S. Department of Health and Human Services, Public Health Service, Office of the Surgeon General, 2001.
Government
Goals and Str ategies
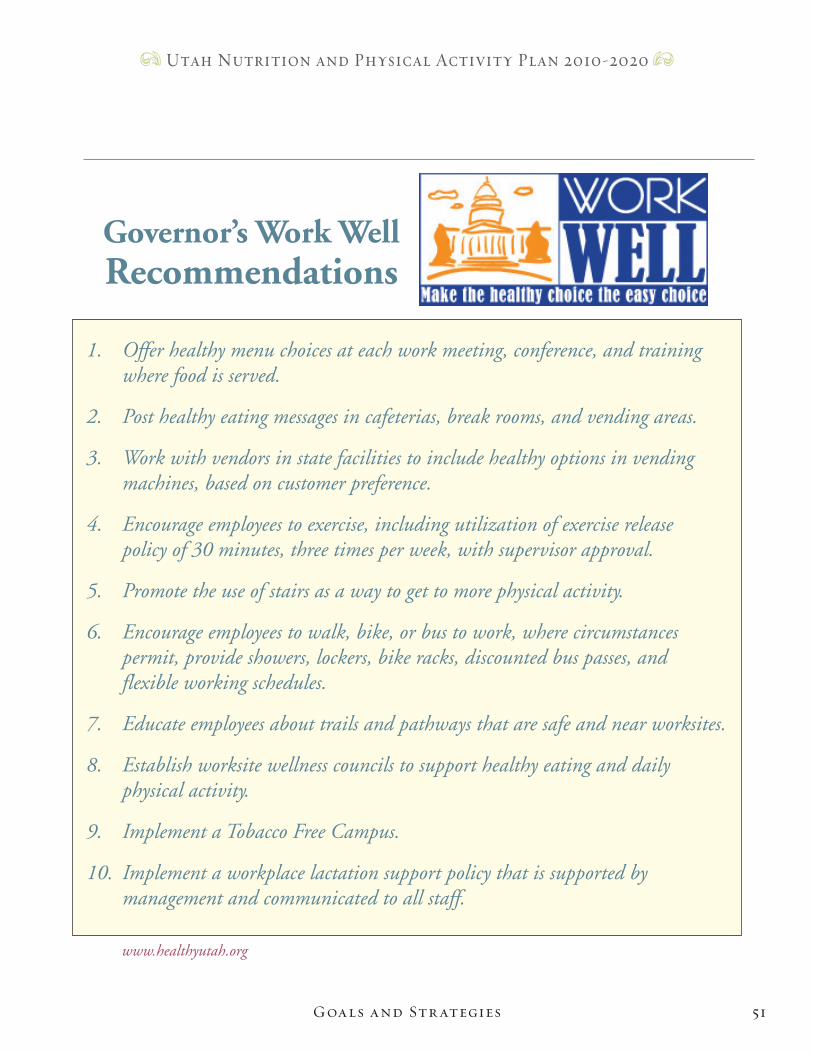
51
Utah Nutrition and Physical Activity Plan 2010-2020
Goals and Str ategies
www.healthyutah.org
1. Offer healthy menu choices at each work meeting, conference, and training where food is served.
2. Post healthy eating messages in cafeterias, break rooms, and vending areas.
3. Work with vendors in state facilities to include healthy options in vending machines, based on customer preference.
4. Encourage employees to exercise, including utilization of exercise release policy of 30 minutes, three times per week, with supervisor approval.
5. Promote the use of stairs as a way to get to more physical activity.
6. Encourage employees to walk, bike, or bus to work, where circumstances permit, provide showers, lockers, bike racks, discounted bus passes, and flexible working schedules.
7. Educate employees about trails and pathways that are safe and near worksites.
8. Establish worksite wellness councils to support healthy eating and daily physical activity.
9. Implement a Tobacco Free Campus.
10. Implement a workplace lactation support policy that is supported by management and communicated to all staff.
Governor’sWorkWellRecommendations
52
Utah Nutrition and Physical Activity Plan 2010-2020
Goal 1: Collaborate with the Offices of the Governor and First Lady, as well as local municipality leadership, to promote healthy eating, physical activity, and obesity prevention.
Short Term (1-2 years)Strategy 1.1 Encourage state agencies and all worksites to implement the Governor’s Work Well Recommendations.
Strategy 1.2 Provide support to the Governor’s Office regarding health care reform.
Strategy 1.3 Solicit Governor's, First Lady’s, and local municipality leadership’s support of the state plan and related initiatives.
Goal 2: Increase support of healthy eating, physical activity, and obesity prevention among state and local leaders and partners.
Short Term (1-2 years)Strategy 2.1 Create and maintain an inventory of programs, including policy and environmental supports implemented by state and local partners that encourage opportunities for healthy eating and physical activity.
Strategy 2.2 Share information with partners (e.g., legislators, and targeted school administrators, and community leaders) on methods and rationale for policy and environmental initiatives.
Strategy 2.3 Document collaboration between state chronic disease programs, other state and local agencies, university researchers, and organizations to pool resources.
Strategy 2.4 Develop a mechanism to track the numbers, type, and attendance at conferences and trainings related to implementation of the state plan and its objectives.
Strategy 2.5 Identify, prioritize, and support legislative and policy actions, such as a tax on sugar-sweetened beverages, lactation support policies in the workplace, funding to promote walking and bicycling “complete streets,” or farmers markets/community supported agriculture. Complete streets is defined on page 57.
Intermediate Term (3-5 years)Strategy 2.6 Encourage support of policy and environmental initiatives among partners (e.g., legislators, targeted school administrators, community leaders, and state and local governments).
Strategy 2.7 Coordinate and/or provide trainings to health care providers, school personnel, consumers, community-based organizations, transportation, city planners and others as identified.
Government: Goals and Strategies
Goals and Str ategies
53
Utah Nutrition and Physical Activity Plan 2010-2020
Goal 3: Enhance capacity for state and local obesity prevention efforts.
Short Term (1-2 years)Strategy 3.1 Support partners, including culturally diverse community organizations, to promote healthy eating and increased physical activity.
Strategy 3.2 Advocate for funding at all levels necessary to support the identified strategies.
Strategy 3.3 Identify and apply for funding opportunities.
Strategy 3.4 Network with other states and national organizations to share best practices.
Goal 4: Improve assessment and evaluation resources, surveillance measures, and methods to measure healthy eating, physical activity, and obesity prevention.
Short Term (1-2 years)Strategy 4.1 Support communities/neighborhoods in conducting community assessments.
Strategy 4.2 Evaluate Physical Activity, Nutrition, and Obesity Program (PANO) measuring and reporting system.
Strategy 4.3 Identify and reduce gaps in surveillance data for children, youth, and adults and share the information with partners and stakeholders.
Intermediate Term (3-5 years)Strategy 4.4 Create an inventory of state and local government databases and data sources.
Strategy 4.5 Provide advice and technical assistance on evaluation methods to partners.
Goals and Str ategies
Are
as o
f Inf
luen
ce: M
edia
54
Utah Nutrition and Physical Activity Plan 2010-2020
The mass media reaches large segments of the population in a way that no other system can begin to match. Therefore, its powerful role can also be used for social marketing, messaging that “sells” effective ways to improve attitudes and knowledge, and to provide cues to action for healthy behaviors.
The media work group has the ability to influence all levels of the social-ecological model, and will do so through assisting with message creation and development, community connections, support and guidance to all other spheres of influence and intervention areas.
Media: Goals and StrategiesGoal 1: Increase Utah mass media’s understanding of overweight and obesity and their understanding of how healthy eating, breastfeeding, physical activity and a positive body image, as well as a decrease in screen time and other sedentary behaviors, can positively affect incidence of obesity and overweight in Utah.
Short Term (1-2 years)Strategy 1.1 Create a listserv of media organizations and professionals to be used to disseminate healthy weight messages.
Strategy 1.2 Create a tracking system for stories on overweight and obesity and, when appropriate, respond to reporters and managers who disseminate incorrect or confusing information concerning overweight and obesity.
Intermediate Term (3-5 years)Strategy 1.3 Create and distribute to Utah’s mass media information that highlights the environmental, political, commercial, and personal issues behind the rising rates of obesity and overweight.
Long Term (5+ years)Strategy 1.4 Regularly obtain and disseminate materials and information developed by other media markets to Utah’s mass media.
Goal 2: Increase participation of Utah’s mass media in public awareness and education campaigns in order to increase awareness of the seriousness of the obesity epidemic; increase fruit and vegetable consumption, decrease consumption of sugar-sweetened beverages and high-calorie, high-fat foods, improve breastfeeding and physical activity patterns and decrease screen time among Utahns.
Media
Goals and Str ategies
55
Utah Nutrition and Physical Activity Plan 2010-2020
Short Term (1-2 years)Strategy 2.1 Develop innovative strategies to secure and share funding to run messages.
Intermediate (3-5 years)Strategy 2.2 Work with health and social marketing experts to develop a multifaceted campaign set of consistent and complementary messages that are easy for all Utahns to act upon.
Strategy 2.3 Encourage the Governor and First Lady to promote civic, family, and personal responsibility for healthy eating, increased physical activity, and breastfeeding.
Long Term (5+ years)Strategy 2.4 Evaluate success of efforts, including awareness, knowledge, attitudes, and actions.
Goal 3: Provide consistent messages and create opportunities for media coverage as individual work group goals are implemented and achieved.
Short Term (1-2 years)Strategy 3.1 Develop a system to communicate with chairpersons of other work groups to understand and assist with their media-related needs.
Strategy 3.2 Identify spokespersons from each work group to address work group specific issues and policies in the media.
Strategy 3.3 Train and prepare spokespersons or other representatives to insure consistency and quality of message.
Goals and Str ategies
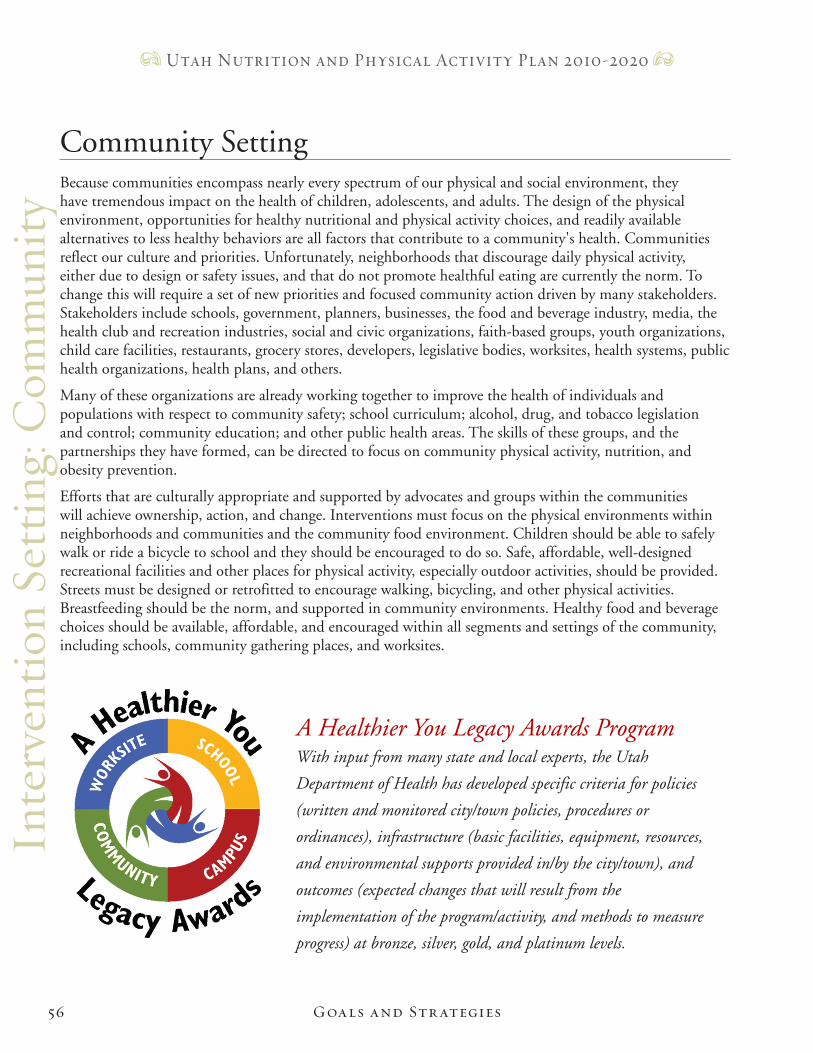
Inte
rven
tion
Sett
ing:
Com
mun
ity
56
Utah Nutrition and Physical Activity Plan 2010-2020
Because communities encompass nearly every spectrum of our physical and social environment, they have tremendous impact on the health of children, adolescents, and adults. The design of the physical environment, opportunities for healthy nutritional and physical activity choices, and readily available alternatives to less healthy behaviors are all factors that contribute to a community's health. Communities reflect our culture and priorities. Unfortunately, neighborhoods that discourage daily physical activity, either due to design or safety issues, and that do not promote healthful eating are currently the norm. To change this will require a set of new priorities and focused community action driven by many stakeholders. Stakeholders include schools, government, planners, businesses, the food and beverage industry, media, the health club and recreation industries, social and civic organizations, faith-based groups, youth organizations, child care facilities, restaurants, grocery stores, developers, legislative bodies, worksites, health systems, public health organizations, health plans, and others.
Many of these organizations are already working together to improve the health of individuals and populations with respect to community safety; school curriculum; alcohol, drug, and tobacco legislation and control; community education; and other public health areas. The skills of these groups, and the partnerships they have formed, can be directed to focus on community physical activity, nutrition, and obesity prevention.
Efforts that are culturally appropriate and supported by advocates and groups within the communities will achieve ownership, action, and change. Interventions must focus on the physical environments within neighborhoods and communities and the community food environment. Children should be able to safely walk or ride a bicycle to school and they should be encouraged to do so. Safe, affordable, well-designed recreational facilities and other places for physical activity, especially outdoor activities, should be provided. Streets must be designed or retrofitted to encourage walking, bicycling, and other physical activities. Breastfeeding should be the norm, and supported in community environments. Healthy food and beverage choices should be available, affordable, and encouraged within all segments and settings of the community, including schools, community gathering places, and worksites.
Community Setting
A Healthier You Legacy Awards Program
With input from many state and local experts, the Utah
Department of Health has developed specific criteria for policies
(written and monitored city/town policies, procedures or
ordinances), infrastructure (basic facilities, equipment, resources,
and environmental supports provided in/by the city/town), and
outcomes (expected changes that will result from the
implementation of the program/activity, and methods to measure
progress) at bronze, silver, gold, and platinum levels.
Goals and Str ategies
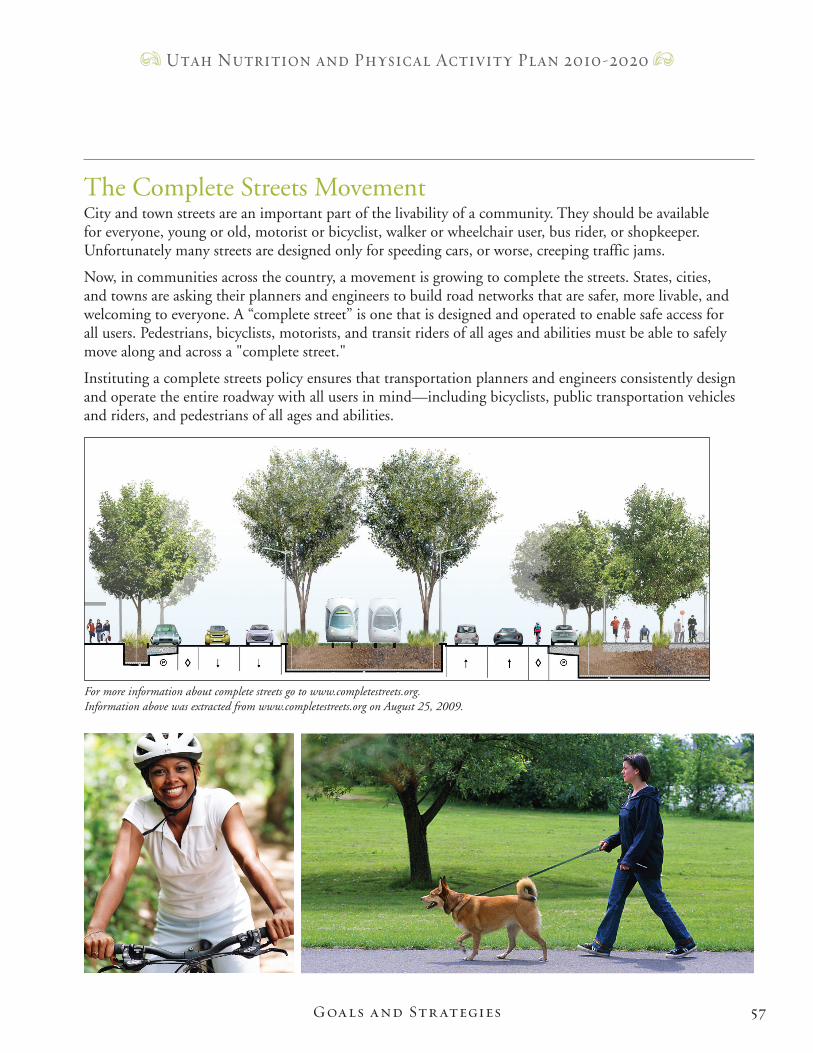
57
Utah Nutrition and Physical Activity Plan 2010-2020
The Complete Streets MovementCity and town streets are an important part of the livability of a community. They should be available for everyone, young or old, motorist or bicyclist, walker or wheelchair user, bus rider, or shopkeeper. Unfortunately many streets are designed only for speeding cars, or worse, creeping traffic jams.
Now, in communities across the country, a movement is growing to complete the streets. States, cities, and towns are asking their planners and engineers to build road networks that are safer, more livable, and welcoming to everyone. A “complete street” is one that is designed and operated to enable safe access for all users. Pedestrians, bicyclists, motorists, and transit riders of all ages and abilities must be able to safely move along and across a "complete street."
Instituting a complete streets policy ensures that transportation planners and engineers consistently design and operate the entire roadway with all users in mind—including bicyclists, public transportation vehicles and riders, and pedestrians of all ages and abilities.
Goals and Str ategies
For more information about complete streets go to www.completestreets.org. Information above was extracted from www.completestreets.org on August 25, 2009.
58
Utah Nutrition and Physical Activity Plan 2010-2020
Goal 1: Increase the number and quality of active community environments (ACEs) in Utah in order to encourage increased physical activity.Short Term (1-2 years)
Strategy 1.1 Establish a statewide ACEs team composed of city and county planners, city council persons, zoning specialists, parks and recreation departments, bicycling/trail advocacy groups, local health departments and local government, chamber of commerce, (including rural, tribal, etc.), and others to develop model policies leading to increased opportunity for physical activity in neighborhoods and communities.
Strategy 1.2 Promote safe routes, systems, and resources such as walking school buses, for children and seniors that encourage walking and cycling in neighborhoods and to schools.
Strategy 1.3 Utilize partnerships within all segments of the community to develop, implement, and promote programs that encourage regular physical activity.
Strategy 1.4 Encourage and support communities to conduct an environmental audit to identify support and barriers to physical activity within their community.
Intermediate (3-5 years)Strategy 1.5 Support implementation of ACE policies in local areas.
Strategy 1.6 Incorporate state and local transportation policies and infrastructure changes to promote non-motorized and mass transportation.
Strategy 1.7 Partner with the city’s local shops, services, parks, and trails (attractive destinations for pedestrians and cyclists).
Strategy 1.8 Work with city planners to encourage the creation of retail areas around transit stops.
Strategy 1.9 Work with municipalities to enhance the safety and perceived safety of communities to improve walkability and bikeability.
Goal 2: Increase availability and access to affordable or free recreation opportunities for physical activity.Short Term (1-2 years)
Strategy 2.1 Help facilities find adequate financial resources to develop and staff safe and well- designed local- and state-level recreational and park sites and facilities.
Strategy 2.2 Develop model policies to increase access to and awareness of public facilities for physical activity, such as after school use of school fitness facilities by the community.
Intermediate (3-5 years)Strategy 2.3 Partner with clergy associations and church wellness committees to increase the number of low-cost exercise classes for adults and seniors and play and/or game opportunities for toddlers and youth.
Community: Goals and Strategies
Goals and Str ategies
59
Utah Nutrition and Physical Activity Plan 2010-2020
Strategy 2.4 Increase the number, type, and availability of community-based recreational sports programs, including intramural recreation programs.
Goal 3: Increase the availability of and access to healthy foods in neighborhoods.
Short Term (1-2 years)Strategy 3.1 Support communities to conduct an environmental audit to determine access and barriers to healthy foods, including fruits and vegetables.
Strategy 3.2 Assist communities to develop a food policy council or task force to examine local food policy and envrionments and set priorities to increase access to healthy foods.
Strategy 3.3 Expand outreach efforts to connect low-income families and individuals to food assistance programs.
Intermediate Term (3-5 years)Strategy 3.4 Identify and compile a directory of local resources for healthy eating.
Strategy 3.5 Work with partners to increase availability of healthy foods in all segments of communities (including community-based gardening, farmers markets and cooperative buying groups, retailers, food banks, community events, etc.).
Strategy 3.6 Encourage availability of point-of-purchase nutrition information and programs in retail establishments such as supermarkets, restaurants, and fast food outlets.
Strategy 3.7 Encourage restaurants to offer and label healthier choices through a healthy dining program.
Strategy 3.8 Implement programs for parents on healthy food, eating behaviors, and weight for infants, children, and youth.
Goals and Str ategies
60
Utah Nutrition and Physical Activity Plan 2010-2020
Long Term (5+ years)Strategy 3.9 Support the use of locally grown produce in institutions (schools, nursing homes, etc.).
Strategy 3.10 Encourage grocers to increase sales of fruits and vegetables through creative pricing and marketing.
Strategy 3.11 Work with local food retailers to adopt family-friendly policies and to limit displays promoting unhealthy foods to children.
Strategy 3.12 Encourage small store owners in underserved areas to carry healthier food options, such as fruits and vegetables.
Strategy 3.13 Encourage development of zoning restrictions for fast-food restaurant operations.
Strategy 3.14 Develop partnerships with faith-based organizations and wellness coalitions to offer fruits and vegetables at church and social events.
Strategy 3.15 Educate and empower parents about the need to serve as good role models by practicing healthy eating habits and engaging in regular physical activity.
Goal 4: Increase the proportion of mothers who breastfeed their infants (initiation, duration, and exclusivity).
Short Term (1-2 years)Strategy 4.1 Conduct a community-based needs assessment of breastfeeding resources, including education, peer support, breastfeeding-friendly environments, and access to International Board Certified Lactation Consultants.
Strategy 4.2 Develop a community-based breastfeeding resource guide and work with partners to promote support resources for breastfeeding women/families.
Strategy 4.3 Work with public health and community partners to provide education regarding the benefits of breastfeeding and promote breastfeeding as the norm.
Intermediate Term (3-5 years)Strategy 4.4 Encourage communities to provide breastfeeding-friendly community environments in places of worship, child care facilities, worksites, schools, and health care facilities.
Strategy 4.5 Identify and promote breastfeeding classes.
Strategy 4.6 Establish local breastfeeding coalitions.
Strategy 4.7 Establish/publicize breastfeeding as a healthy lifestyle choice that prevents obesity.
Long Term (5+ years)Strategy 4.8 Develop support systems and networks for fathers and other family members.
Goals and Str ategies
61
Utah Nutrition and Physical Activity Plan 2010-2020
Goal 5: Increase the number of cities and towns that participate in A Healthier You (AHY) Community Award Program.
Short Term (1-2 years)Strategy 5.1 Increase participation of mayors and city business managers on the AHY Community Award Program Committee.
Intermediate Term (3-5 years)Strategy 5.2 Partner with community organizations and Healthy Community coalitions to promote AHY Community Awards.
Long Term (5+ years)Strategy 5.3 Recruit a corporate sponsor to support financial and recognition incentives to cities and towns that participate.
Goal 6: Increase the number of programs and policies to reduce screen time (including television, video games, computers, etc.) for children, youth, and adults.
Short Term (1-2 years)Strategy 6.1 Promote TV Turnoff Week in communities.
Intermediate Term (3-5 years)Strategy 6.2 Develop and promote the use of reduced screen time policies at community centers, recreation centers, and various venues within the community where citizens gather.
Strategy 6.3 Develop/promote an awareness campaign to educate parents/caretakers about the hazards of inactivity and poor nutritional choices of children due to screen time.
Goals and Str ategies
Inte
rven
tion
Sett
ing;
Hea
lth C
are
62
Utah Nutrition and Physical Activity Plan 2010-2020
Health Care Setting
Goals and Str ategies
Health care professionals and health systems have unique opportunities to encourage children, youth, and adults to engage in healthy lifestyles. The majority of Americans interact with the health care system at least once in any given year. Additionally, health care providers are the primary and most trusted source of health information. Medical providers are in a critical position to influence physical activity behaviors, eating choices, and other obesity-related issues. However, prevention and treatment of obesity through physical activity and nutrition interventions are rarely considered reimbursable services by third party payers, and office visits are often not long enough to allow for a comprehensive assessment and counseling for overweight or obesity. Even if insurers were to reimburse for these services, medical providers generally are not adequately trained in nutrition or physical activity interventions, making it less likely for them to effectively counsel on these topics. One way to improve the counseling and education they provide is to make medical providers aware of professional and community resources that may support the care of their patients. Also, efforts should be made to influence provider education in these topics during and after medical school.
To realize improved prevention and treatment of overweight and obesity through the health care system, several things must happen. Health care providers should routinely measure their patients’ height and weight, calculate their body mass index (BMI), and counsel patients regarding the risks of overweight and obesity. Resources, including education materials and referral sources, should be available to help educate providers and patients regarding the benefits of healthy eating, physical activity, decreased screen time, and breastfeeding, and the roles that these elements play in obtaining or maintaining healthy weight.
Insurers and accreditation organizations should add support by reimbursing for health care services that effectively address the issues of overweight and obesity. Reimbursement should focus on evidence-based interventions that improve health and weight through multiple interactions with patients. It is important to begin to identify and disseminate best practices for prevention and treatment to providers, insurers, accrediting organizations, and others in the health care community.
In addition to direct services provided, health care personnel can play a significant role in influencing policy makers at the local and state levels. Because of their position of trust within communities and with patients, they have a unique opportunity to influence key decision makers and impact community decisions that affect physical activity and healthy eating options.
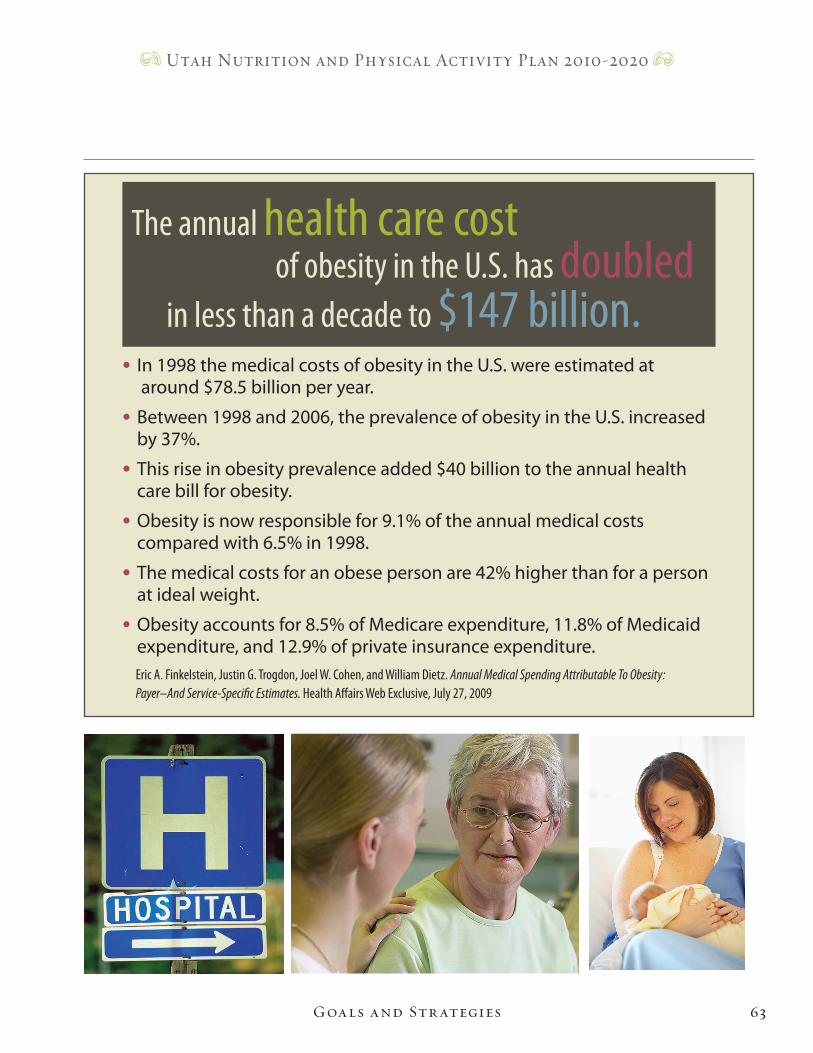
63
Utah Nutrition and Physical Activity Plan 2010-2020
• In1998themedicalcostsofobesityintheU.S.wereestimatedat around$78.5billionperyear.
• Between1998and2006,theprevalenceofobesityintheU.S.increased by37%.
• Thisriseinobesityprevalenceadded$40billiontotheannualhealth carebillforobesity.
• Obesityisnowresponsiblefor9.1%oftheannualmedicalcosts comparedwith6.5%in1998.
• Themedicalcostsforanobesepersonare42%higherthanforaperson atidealweight.
• Obesityaccountsfor8.5%ofMedicareexpenditure,11.8%ofMedicaid expenditure,and12.9%ofprivateinsuranceexpenditure.
Eric A. Finkelstein, Justin G. Trogdon, Joel W. Cohen, and William Dietz. Annual M edical Spending Attributable To Obesity: Payer–And Service-Specific Estimates. Health Affairs Web Exclusive, July 27, 2009
The annual health care cost of obesity in the U.S. has doubled in less than a decade to $147 billion.
Goals and Str ategies
64
Utah Nutrition and Physical Activity Plan 2010-2020
Goal 1: Increase provider awareness and the proportion of health care providers who routinely monitor, track, and inform patients and/or parents about body mass index (BMI), overweight and obesity, and their risks.Short Term (1-2 years)
Strategy 1.1 Find funding for and develop, administer, and analyze a web-based survey to assess knowledge, attitudes, and skills related to body mass index (BMI). Note that this strategy incorporates concepts from the following strategies.
• Increase knowledge and use of BMI as a screening tool by medical providers in order to identify overweight or obesity in children, youth, and adults.
• Identify barriers to implementation of practice recommendations and policies to support obesity prevention and control.
• Assess the number of health care providers that document BMI in patient charts and assess the number of health care providers who document treatment for children who are determined to be overweight or obese.
Intermediate (3-5 years)Strategy 1.2 Increase the number of health care organizations that include BMI screening and obesity preventive services as part of clinical practice guidelines and quality assessment measures.
Strategy 1.3 Identify whether a clinic evaluation tool is available to evaluate clinic use of BMI.
Long Term (5+ years)Strategy 1.4 Increase the use of evidence-based counseling and guidance by health care providers for patients and parents in order to promote healthy weight and prevent overweight and obesity.
Strategy 1.5 Collaborate with professional, medical, and allied health organizations, and community leaders to develop culturally sensitive methods for discussing weight status and weight- related issues, especially with high-risk population groups.
Strategy 1.6 Collaborate with insurers, and other medical professional organizations, managed care programs, and health care systems to provide incentives for maintaining a healthy body weight.
Goal 2: Increase the number of health care professionals who educate and offer resources to their patients about healthy eating, screen time, physical activity, and breastfeeding.
Health Care: Goals and Strategies
Goals and Str ategies
65
Utah Nutrition and Physical Activity Plan 2010-2020
Short Term (1-2 years)Strategy 2.1 Identify or develop and offer resources for increasing fruit and vegetable intake to five per day, limiting screen time to two hours per day, recommending one hour of physical activity per day, and promoting breastfeeding.
Strategy 2.2 Encourage health professionals to incorporate information about fruit and vegetable intake, limit screen time, increase physical activity, and promote breastfeeding assessments and counseling into their patient office visits.
Goal 3: Increase the awareness of and referrals to community resources to increase physical activity and to encourage healthy eating.Short Term (1-2 years)
Strategy 3.1 Encourage Utah Partners for Healthy Weight, the Utah Medical Association (UMA), and/or the Department of Health to partner with the Utah Pediatric Partnership to Improve Health Care Quality (UPIQ) to develop, distribute, and maintain an inventory of existing community resources related to physical activity and healthy eating.
Strategy 3.2 Distribute national physical activity guidelines to providers in the health care community.
Strategy 3.3 Increase awareness of and referrals to food assistance programs through health care settings.
Intermediate Term (3-5 years)Strategy 3.4 Develop training programs for medical and allied health professionals to improve their knowledge and counseling skills related to nutrition and other life behaviors related to obesity prevention (partner with UPIQ).
Goals and Str ategies
66
Utah Nutrition and Physical Activity Plan 2010-2020
Strategy 3.5 Identify and share obesity-related clinical best practices among and between providers, insurers, accrediting organizations, and others.
Long Term (5+ years)Strategy 3.6 Work with providers, insurers, and health systems to develop and implement materials and systems supporting patient referral to the above resources.
Strategy 3.7 Develop and implement methods for patient feedback to providers regarding their experiences with the above resources (partner with the Utah Women’s Health Information Network [UWIN]).
Strategy 3.8 Place educational materials about physical activity benefits and recommendations in health care office waiting rooms, on bulletin boards, etc.
Strategy 3.9 Develop training programs for medical and allied health professionals to improve their knowledge and counseling skills related to physical activity and other life behaviors related to obesity prevention.
Strategy 3.10 Increase nutrition education hours in the curriculum of health professional programs.
Strategy 3.11 Eliminate co-location of fast-food restaurants inside hospitals and other health care facilities.
Goal 4: Increase insurer and accrediting organization support of clinical measurement and counseling related to BMI.
Short Term (1-2 years)Strategy 4.1 Evaluate which insurers cover International Classification of Disease, 9th Edition (ICD9) 278 and similar codes and associated laboratory tests and disseminate the results.
Strategy 4.2 Lobby Medicaid and others to cover obesity and physical activity codes (e.g., ICD9 278).
Intermediate Term (3-5 years)Strategy 4.3 Work with insurers and employers to identify, prioritize, and evaluate insurance coverage by public and private payers for behavioral and medical nutrition therapy as well as medical and surgical treatment of overweight and obesity.
Strategy 4.4 Address resources for uninsured.
Long Term (5+ years)Strategy 4.5 Work with medical professional organizations, insurers, and accrediting organizations to gain support through reimbursement and/or through acceptance of BMI-based quality improvement incentives for accreditation purposes.
Goals and Str ategies
67
Utah Nutrition and Physical Activity Plan 2010-2020
Goal 5: Increase the proportion of health care providers who advocate for policy and environmental changes that support healthy eating and physical activity in schools, worksites, communities, campuses, and health care facilities.
Short Term (1-2 years)Strategy 5.1 Recommend that Utah Partnership for Healthy Weight create a lobbying arm and use an online list for tracking, recruitment, and communication when recruiting members from the health care community and/or the UMA to prioritize lobbying for healthy lifestyles.
Intermediate (3-5 years)Strategy 5.2 Disseminate information to health care providers about ongoing efforts to influence policy and environmental changes, including efforts by state-based programs.
Strategy 5.3 Recruit the health care community to attend local school board, city council, chamber of commerce, and legislative meetings to advocate for policy and environmental changes.
Long Term (5+ years)Strategy 5.4 Develop and disseminate an advocacy toolkit for health care providers.
Goal 6: Increase the number of health care facilities that include maternity practices that are consistent with the World Health Organization/United Nationals Children’s Fund (WHO/UNICEF) Ten Steps to Successful Breastfeeding; increase the number of health care facilities that are designated as Baby Friendly.
Short Term (1-2 years)Strategy 6.1 Familiarize health care facilities and providers with the Baby Friendly Initiative and links of breastfeeding to healthy weight.
Long Term (5+ years)Strategy 6.2 Promote in-hospital maternity care practices supportive of breastfeeding in accordance with the Baby Friendly Hospital Initiative.
Strategy 6.3 Provide supportive environments for breastfeeding in Neonatal Intensive Care Units.
Strategy 6.4 Develop systems for the reimbursement of lactation services and equipment, such as through health insurance/Health Maintenance Organizations (HMOs), hospital services, etc.
Goals and Str ategies
Inte
rven
tion
Sett
ing:
Sch
ools
68
Utah Nutrition and Physical Activity Plan 2010-2020
School SettingSchools play a significant role in educating children (including youth), going far beyond reading, math, and science. Children spend a significant amount of time in school and in after-school programs interacting with students and the adults who work there. They are influenced by the messages and the behavior modeled by the students, teachers, school nurses, administrators, and others. Therefore, schools are in an unrivaled position to deliver nutrition and physical activity lessons. They provide opportunities for students to learn about and practice healthful eating habits and physical activity.
Schools provide many students with their most nourishing meals, and, in some instances, the only safe place to play in their neighborhoods. They provide connections to families and local businesses. In some instances, the school’s physical activity facilities may be the only recreational setting in the community. Because of these key functions for children and their families, schools are integral to addressing the childhood overweight problem. Additionally, early childhood education sites, such as day care centers, Head Start programs and home-based child care, are places where obesity prevention is important, as are colleges and universities. Both of these settings are important to consider in the future.
Schools: Goals and StrategiesGoal 1: Increase the number of schools that provide an environment that encourages regular physical activity, including written policies.
Short Term (1-2 years)Strategy 1.1 Encourage elementary and middle/junior high schools to maintain participation in the Gold Medal Schools and Power-Up Programs.
Strategy 1.2 Improve safety of walking and cycling to and from school for children and adolescents.
Strategy 1.3 Encourage schools to require daily physical activity breaks/recess for all elementary school students.
Strategy 1.4 Begin the process of assessing the physical fitness level of Utah students.
Intermediate Term (3-5 years)Strategy 1.5 Encourage elementary schools to have certified Physical Education (PE) specialists.
Strategy 1.6 Encourage school districts to promote physical activity programs before, during, and after school activity programs.
Strategy 1.7 Provide programs for parents on appropriate physical activity for pre-school and school-age children.
Long Term (5+ years)Strategy 1.8 Provide access to intramural sports programs, physical activity clubs, and additional programs in secondary schools.
Strategy 1.9 Increase the number of after-school programs that offer a minimum of 30 minutes/day of physical activity.
Goals and Str ategies

69
Utah Nutrition and Physical Activity Plan 2010-2020
Strategy 1.10 Devote the majority of Physical Education time to moderate or vigorous physical activity.
Strategy 1.11 Integrate health-related physical fitness assessment into the curriculum as an evaluation tool.
Strategy 1.12 Assist school districts to include access to their facilities outside normal school hours as a component of their wellness policy.
Strategy 1.13 Encourage parents and child care caregivers to walk with children for recreation and transportation.
Goal 2: Increase access to and selection of healthy foods in schools, including written policies.
Short Term (1-2 years)Strategy 2.1 Monitor schools to assure that foods offered in addition to the standard lunch meal, such as a la carte items, meet Institute of Medicine recommendations.
Strategy 2.2 Link classroom and nutrition education lessons and food service activities.
Strategy 2.3 Provide a forum to educate school boards, school administrators, and Parent Teacher Associations (PTAs)/Parent Teacher Organizations (PTOs) about nutritional standards for competitive foods in schools.
Strategy 2.4 Encourage the PTAs/PTOs and parents to offer nutritious foods for all extracurricular activities and fund raisers.
Strategy 2.5 Encourage schools to eliminate exclusive beverage contracts that require the marketing of unhealthy beverages.
Strategy 2.6 Encourage parents and teachers to use nonfood rewards in the classroom.
Goals and Str ategies
70
Utah Nutrition and Physical Activity Plan 2010-2020
Intermediate Term (3-5 years)Strategy 2.7 Increase participation in school breakfast and lunch programs.
Strategy 2.8 Explore and/or expand partnerships with PTAs/PTOs to encourage parents to be involved in developing and monitoring school food policies and education to promote healthy eating behaviors.
Strategy 2.9 In child care settings, encourage families and caregivers to take advantage of food- assistance programs that offer nutrition education and balanced food choices.
Long Term (5+ years)Strategy 2.10 Encourage schools to plant and maintain an on-site fruit and vegetable garden.
Goal 3: Increase the number of school teachers who teach the nutrition and physical fitness components of the Utah core curriculum, including application and behavioral skills.
Short Term (1-2 years)Strategy 3.1 Review and identify strategies to teach the core curriculum.
Strategy 3.2 Collect data on use of the Utah State Office of Education’s (USOE) health and physical education curricula.
Intermediate Term (3-5 years)Strategy 3.3 Work with the USOE to develop plans to address barriers.
Strategy 3.4 Promote awareness of the link between healthy eating and physical activity to increase academic achievement.
Strategy 3.5 Develop a method for measuring the number of teachers who teach components of the Utah nutrition core curriculum.
Strategy 3.6 Encourage schools to adopt and use the USOE lifetime physical activity curriculum.
Goal 4: Increase the opportunities for school wellness programs and activities for staff and faculty.
Short Term (1-2 years)Strategy 4.1 Provide information on wellness programs and activities to schools.
Strategy 4.2 Promote regular physical activity among school personnel.
Intermediate (3-5 years)Strategy 4.3 Provide training to enable school personnel to promote enjoyable, lifelong physical activity.
Strategy 4.4 Provide training to school personnel promoting healthy eating behaviors.
Goals and Str ategies

71
Utah Nutrition and Physical Activity Plan 2010-2020
Goal 5: Increase opportunities for schools to support alternatives to screen time at home and school.
Short Term (1-2 years)Strategy 5.1 Promote TV Turn-Off Week/Unplug N' Play every year and encourage students to reduce the overall amount of time spent watching television and video gaming.
Intermediate Term (3-5 years)Strategy 5.2 Promote inexpensive after-school movement activities.
Long Term (5+ years)Strategy 5.3 Encourage schools and child care facilities to adopt “nonacademic screen time” policies.
The goal of the Gold Medal Schools (GMS) program is to help elementary schools develop supportive policies and environments to increase opportunities for staff and students to make healthier food choices, increase physical activity, and live tobacco-free. The GMS program was designed using evidence-based guidance documents. GMS creates opportunities for students to “Eat healthy, Be active, and Stay tobacco-free”.
In 2007, after many successful years in Utah elementary schools, the GMS program expanded to create a similar health culture for students aged 12-15 years. The GMS Power-Up program will teach students to “Eat Smart, Move Smart, and Be Smart”.
Goals and Str ategies
Inte
rven
tion
Sett
ing:
Wor
ksite
72
Utah Nutrition and Physical Activity Plan 2010-2020
Worksite SettingEmployees spend nearly a third of their time at work, thus worksites are a vital place to influence lifestyle behaviors such as physical activity and healthy eating. Employers can influence their employees not only with personal behavior change but also through interpersonal, institutional, or organizational change, support systems, and policies.
If worksites provide a supportive environment and have programs that allow employees to include physical activity and healthful eating in their day, it benefits both the employees and the business’s bottom line. Research suggests that 80% of obese adults have diabetes, high blood pressure, heart disease, gallbladder disease, high cholesterol, and/or osteoarthritis. The cost of these diseases is more than 39 million days of lost work time each year. A coordinated effort between employers and employees is needed to improve levels of physical activity and healthy food choices in the workplace. Offering on-site wellness services allows employees to take advantage of low-cost, accessible options that can fit into the average workday.
Changes that make it easier to choose healthy foods at work have the potential to reach many adults. The most frequently cited barrier to eating vegetables and fruit is that they are hard to get at work. Employers can make a difference in several ways. Worksites with formal and informal guidelines that support healthful food choices and eating patterns exert a powerful influence. Employers can offer healthy foods at meetings and social events, schedule work and meetings to allow adequate time for eating, provide storage and cooking facilities for healthy foods brought from home, and provide healthy foods in vending machines and cafeterias. Changes in the variety and pricing of foods offered at worksites have been shown to increase intake of healthy foods and to reach a large percentage of employees.
Worksite: Goals and StrategiesGoal 1: Increase Utah employers’ awareness of the epidemic of overweight and obesity and resources available to promote healthy weight among employees.
Short Term (1-2 years)Strategy 1.1 Provide education sessions at conferences and meetings currently held by business groups about the health and economic impact associated with overweight, obesity, and obesity-related diseases, as well as the environmental, socioeconomic, and personal factors that contribute to obesity.
Strategy 1.2 Inform and encourage businesses to participate in the Healthy Worksite Awards Program.
Strategy 1.3 Encourage employers to obtain continuing education credits for worksite wellness staff through attendance at the Utah Council for Worksite Health Promotion Conferences.
Intermediate Term (3-5 years)Strategy 1.4 Encourage employers/insurers to reimburse employees for preventive health and wellness activities.
Goals and Str ategies
73
Utah Nutrition and Physical Activity Plan 2010-2020
Strategy 1.5 Encourage employers to form a support group/program to help employees who are participating in weight management.
Strategy 1.6 Provide a resource list to businesses for regular health education presentations on various physical activity, nutrition, and wellness-related topics.
Strategy 1.7 Encourage companies to utilize health risk assessments and on-site biometrics screenings to tailor programs to their employees’ needs.
Long Term (5+ years)Strategy 1.8 Work with employers to identify coverage by public and private payers for prevention and treatment of overweight and obesity.
Goal 2: Increase the number of businesses that support and promote healthy eating at the worksite.
Short Term (1-2 years)Strategy 2.1 Encourage employers to adopt policies that ensure healthy food options are available on-site such as cafeteria and vending machine options.
Strategy 2.2 Encourage employers in providing point-of-purchase nutrition information such as Fruits & Veggies—More Matters® information and nutritional content of foods in cafeterias and near vending machines.
Intermediate Term (3-5 years)Strategy 2.3 Provide resources to assist employers to adopt healthy food policies for all on-site meetings. Provide resources to assist businesses in creating a company culture that minimizes consumption of low-nutrient foods and beverages, such as cakes at parties, candy bowls, and sweets as rewards.
Goals and Str ategies
74
Utah Nutrition and Physical Activity Plan 2010-2020
Strategy 2.4 Assist businesses in having increased access to fresh fruits and vegetables through on-site farmer’s markets.
Strategy 2.5 Encourage businesses to provide on-site nutrition education and social support for employees through programs like Weight WatchersTM and evidence-based disease management programs.
Goal 3: Increase the number of businesses that support and promote physical activity at the worksite.
Short Term (1-2 years)Strategy 3.1 Disseminate the Governor's Work Well Recommendations for state agencies and other worksite tools to all Utah businesses.
Strategy 3.2 Encourage employees and visitors to use the stairs and make them accessible and clearly marked.
Strategy 3.3 Promote flexible work hours (including lunch and breaks) to allow for on-site physical activity during the workday for businesses.
Intermediate Term (3-5 years)Strategy 3.4 Encourage employers who are remodeling or expanding to provide facilities for workers to keep bicycles secure and provide worksite showers and lockers.
Strategy 3.5 Increase the number of business that have worksite physical activity programs.
Strategy 3.6 Encourage employers to promote physical activity through work functions or related events. For example: lunch time walking/running clubs, company sports teams, informing employees about accessible walking trails and/or bike paths.
Long Term (5+ years)Strategy 3.7 Increase the number of businesses that have exercise facilities.
Strategy 3.8 Assist employers in creating a company culture that discourages sedentary behavior, such as TV viewing on breaks and sitting for long periods of time.
Goal 4: Increase promotion and support in the workplace for breastfeeding employees.
Short Term (1-2 years)Strategy 4.1 Educate employers and employees on the benefits of breastfeeding, the risks of not breastfeeding, and why it is important to support breastfeeding at the worksite.
Strategy 4.2 Increase collaboration between the Utah Breastfeeding Coalition, the Utah Council for Worksite Health Promotion (UCWHP), and other partners to provide tools and incentives to worksites to implement lactation support policies.
Goals and Str ategies
75
Utah Nutrition and Physical Activity Plan 2010-2020
Strategy 4.3 Establish a method of measuring or tracking the number of worksites that have lactation policies.
Intermediate Term (3-5 years)Strategy 4.4 Promote written policies describing the company’s support of breastfeeding, f acilities provided, and utilization of paid or unpaid time off for breastfeeding.
Strategy 4.5 Promote workplace lactation support options which could include adequate maternity leave, part-time work schedules, flex-scheduling, telecommuting, on-site child care, and private room for breastfeeding or pumping.
Long Term (5+ years)Strategy 4.6 Support upcoming state legislation on Workplace Accommodations for Lactating Employees.
Goals and Str ategies
Hea
lth E
quity
76
Utah Nutrition and Physical Activity Plan 2010-2020
Health Equity
Goals and Str ategies
A basic principle of public health is that all people have a right to good health. Differences in the incidence and prevalence of health conditions and health status between groups are commonly referred to as health disparities. Most health disparities affect groups marginalized because of socioeconomic status, race/ethnicity, sexual orientation, gender, age, disability status (mental, physical, etc.), geographic location, or some combination of these. People in such groups not only experience worse health but also tend to have less access to social determinant conditions (e.g., healthy food, good housing, good education, safe neighborhoods, freedom from racism, and other forms of discrimination). Health disparities are referred to as health inequalities when they are the result of the systematic and unjust distribution of these critical conditions. Health equity, as understood in public health literature and practice, is when everyone has the opportunity to “attain their full health potential” and no one is “disadvantaged from achieving this potential because of their social position or other socially determined circumstances.”1
Social determinants of health broadly include both societal conditions and psychosocial factors, such as access to care, insurance coverage, employment, education, access to resources, income, housing, transportation, hopefulness, and freedom from racism. These determinants can affect individuals and community health directly, through an independent influence or an interaction with other determinants, or indirectly, through their influence on health-promoting behaviors such as determining whether a person has access to healthy food or a safe environment in which to exercise. Policies and other interventions influence the availability and distribution of these social determinants to different social groups.1
Currently the Utah Department of Health (UDOH), Physical Activity, Nutrition, and Obesity (PANO) Program staff will spearhead the goals and strategies listed in this section.
Lower income and minority communities are less likely to have access to grocery stores with a wide variety of fruits and vegetables.2, 3
In 2007, Hispanics were three times more likely to be uninsured than non-Hispanic Whites (31% versus 10%, respectively).4
Low socioeconomic status (SES) is associated with an increased risk for many diseases, including cardiovascular disease, arthritis, diabetes, chronic respiratory diseases, and cervical cancer as well as for frequent mental distress.4
re f e re n c e s :1. Brennan Ramirez LK, Baker EA, Metzler M. Promoting Health Equity: A Resource to Help Communities Address Social Determinants of Health. Atlanta: U.S. Department of Health and Human Services, Center for Disease Control and Prevention; 2008.
2. Moreland K, Wing S, Diez Roux A, Poole C. Neighborhood chracteristics associated with the location of food stores and food service places. American Journal of Preventive Medicine 2002;22(1):23-29.
3. Baker E, Schootman M, Barnidge E, Kelly C. Access to foods that enable individuals to adhere to dietary guidelines: the role of race and poverty. Preventing Chronic Disease 2006;3(3):1-11.
4. Pleis JR, Lethbridge-Cejku M. Summary of health statistics for U.S. adults: national health interview survey. National Center for Health Statistics. Vital Health Statistics 2007;10(235). Available at http://www.cdc.gov/nchs/data/series/sr_10/sr10_235.pdf..
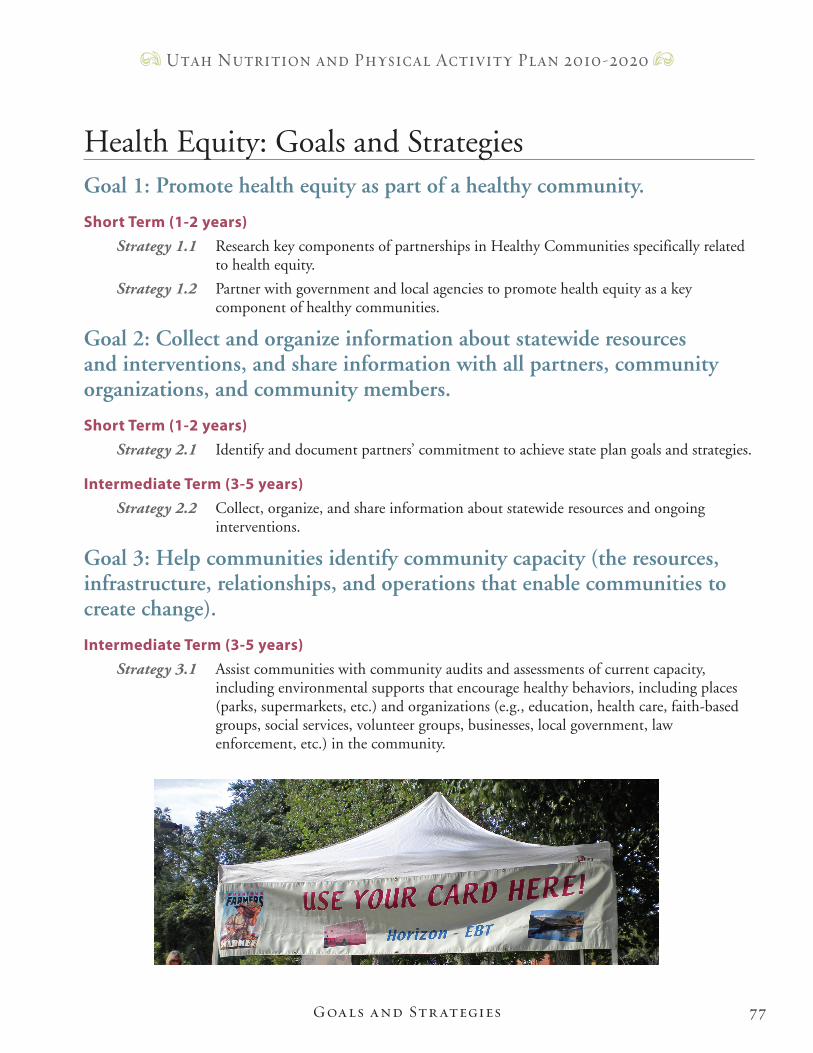
77
Utah Nutrition and Physical Activity Plan 2010-2020
Goal 1: Promote health equity as part of a healthy community.
Short Term (1-2 years)Strategy 1.1 Research key components of partnerships in Healthy Communities specifically related to health equity.
Strategy 1.2 Partner with government and local agencies to promote health equity as a key component of healthy communities.
Goal 2: Collect and organize information about statewide resources and interventions, and share information with all partners, community organizations, and community members.
Short Term (1-2 years)Strategy 2.1 Identify and document partners’ commitment to achieve state plan goals and strategies.
Intermediate Term (3-5 years)Strategy 2.2 Collect, organize, and share information about statewide resources and ongoing interventions.
Goal 3: Help communities identify community capacity (the resources, infrastructure, relationships, and operations that enable communities to create change).
Intermediate Term (3-5 years)Strategy 3.1 Assist communities with community audits and assessments of current capacity, including environmental supports that encourage healthy behaviors, including places (parks, supermarkets, etc.) and organizations (e.g., education, health care, faith-based groups, social services, volunteer groups, businesses, local government, law enforcement, etc.) in the community.
Goals and Str ategies
Health Equity: Goals and Strategies
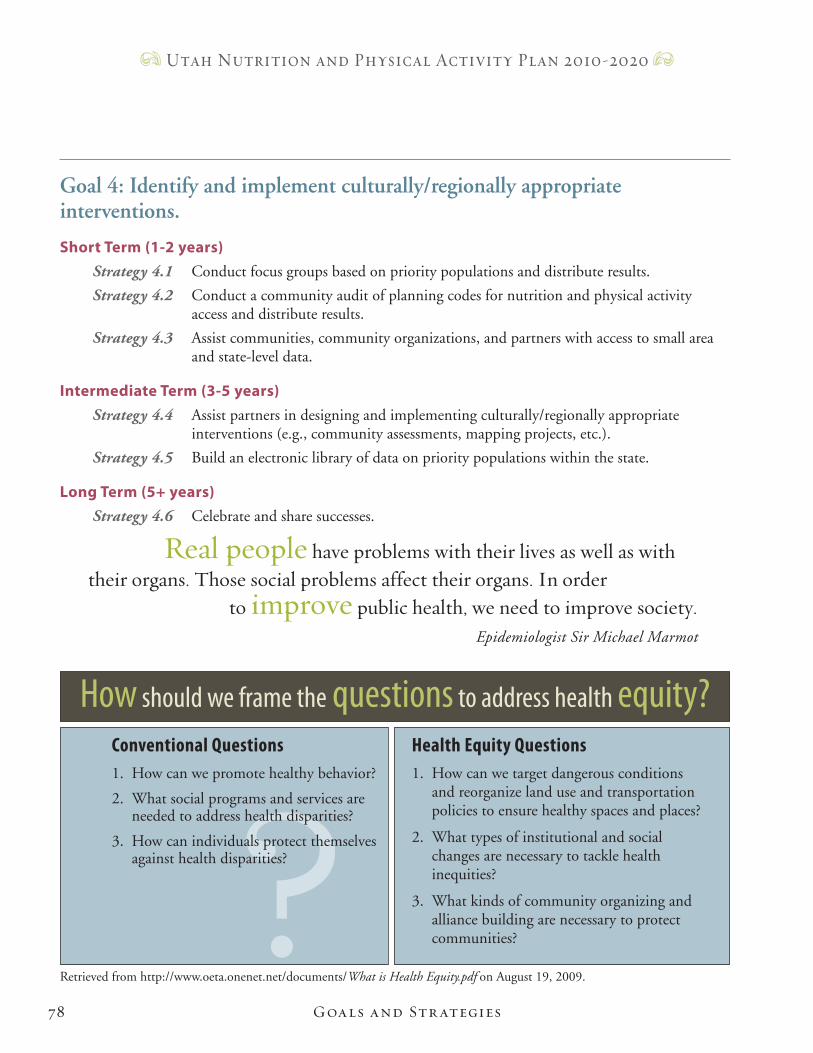
78
Utah Nutrition and Physical Activity Plan 2010-2020
Goal 4: Identify and implement culturally/regionally appropriate interventions.
Short Term (1-2 years)Strategy 4.1 Conduct focus groups based on priority populations and distribute results.
Strategy 4.2 Conduct a community audit of planning codes for nutrition and physical activity access and distribute results.
Strategy 4.3 Assist communities, community organizations, and partners with access to small area and state-level data.
Intermediate Term (3-5 years)Strategy 4.4 Assist partners in designing and implementing culturally/regionally appropriate interventions (e.g., community assessments, mapping projects, etc.).
Strategy 4.5 Build an electronic library of data on priority populations within the state.
Long Term (5+ years)Strategy 4.6 Celebrate and share successes.
Real people have problems with their lives as well as with their organs. Those social problems affect their organs. In order to improve public health, we need to improve society.
Epidemiologist Sir Michael Marmot
Goals and Str ategies
How should we frame the questions to address health equity?Conventional Questions1. How can we promote healthy behavior?
2. What social programs and services are needed to address health disparities?
3. How can individuals protect themselves against health disparities?
Health Equity Questions1. How can we target dangerous conditions and reorganize land use and transportation policies to ensure healthy spaces and places?
2. What types of institutional and social changes are necessary to tackle health inequities?
3. What kinds of community organizing and alliance building are necessary to protect com munities?
Retrieved from http://www.oeta.onenet.net/documents/What is Health Equity.pdf on August 19, 2009.
The Easy Choice
Implementing the Plan
Impl
emen
t
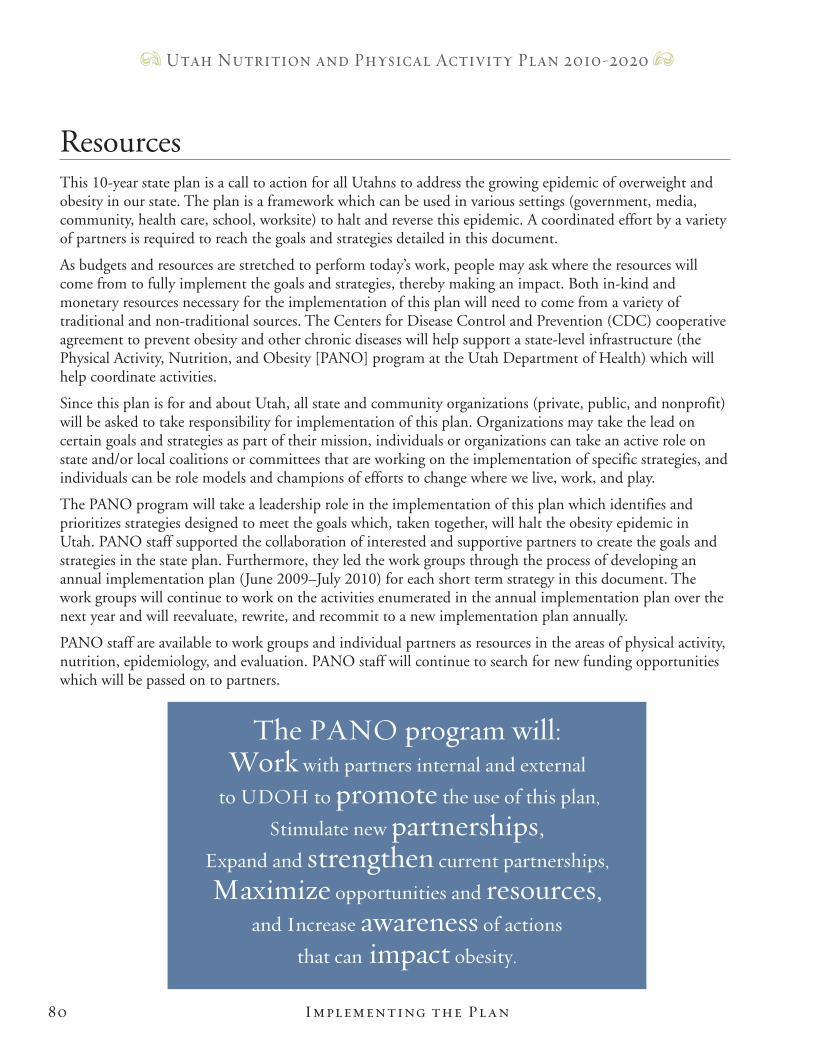
80
Utah Nutrition and Physical Activity Plan 2010-2020
ResourcesThis 10-year state plan is a call to action for all Utahns to address the growing epidemic of overweight and obesity in our state. The plan is a framework which can be used in various settings (government, media, community, health care, school, worksite) to halt and reverse this epidemic. A coordinated effort by a variety of partners is required to reach the goals and strategies detailed in this document.
As budgets and resources are stretched to perform today’s work, people may ask where the resources will come from to fully implement the goals and strategies, thereby making an impact. Both in-kind and monetary resources necessary for the implementation of this plan will need to come from a variety of traditional and non-traditional sources. The Centers for Disease Control and Prevention (CDC) cooperative agreement to prevent obesity and other chronic diseases will help support a state-level infrastructure (the Physical Activity, Nutrition, and Obesity [PANO] program at the Utah Department of Health) which will help coordinate activities.
Since this plan is for and about Utah, all state and community organizations (private, public, and nonprofit) will be asked to take responsibility for implementation of this plan. Organizations may take the lead on certain goals and strategies as part of their mission, individuals or organizations can take an active role on state and/or local coalitions or committees that are working on the implementation of specific strategies, and individuals can be role models and champions of efforts to change where we live, work, and play.
The PANO program will take a leadership role in the implementation of this plan which identifies and prioritizes strategies designed to meet the goals which, taken together, will halt the obesity epidemic in Utah. PANO staff supported the collaboration of interested and supportive partners to create the goals and strategies in the state plan. Furthermore, they led the work groups through the process of developing an annual implementation plan (June 2009–July 2010) for each short term strategy in this document. The work groups will continue to work on the activities enumerated in the annual implementation plan over the next year and will reevaluate, rewrite, and recommit to a new implementation plan annually.
PANO staff are available to work groups and individual partners as resources in the areas of physical activity, nutrition, epidemiology, and evaluation. PANO staff will continue to search for new funding opportunities which will be passed on to partners.
The PANO program will: Work with partners internal and external
to UDOH to promote the use of this plan,
Stimulate new partnerships,Expand and strengthen current partnerships,
Maximize opportunities and resources, and Increase awareness of actions
that can impact obesity.
Implementing the Plan
81
Utah Nutrition and Physical Activity Plan 2010-2020
Collaboration Across Work GroupsIndividual work groups are encouraged to work together to increase impact and effectiveness. In some cases, work groups have similar goals and strategies and are already planning joint activities. The PANO Steering Committee, shown on page 41, is a venue for work group leadership to network and/or request resources and technical assistance. The committee includes a member from the Evaluation Advisory Group which can offer assistance with evaluation design.
What You Can DoIndividuals, partners, and organizations can:
1. Review the plan goals and strategies.
2. Complete a partnership form to pledge your commitment. Anyone interested in existing activities, new ideas, or any interest in being involved can complete the form. Found in Appendix.
3. Collaborate with others who share common goals to maximize opportunities and resources.
4. Advocate for policy change which positively impacts the physical activity and nutrition environments.
How to Become InvolvedYou or your organization can become involved in implementing state plan goals by completing and returning a partnership form. This form is found in the appendix of this document or at the following web site: http:/health.utah.gov/obesity.
Once you have completed the form your information will be included in an online database which tracks partner and activities around the state. The information will be used to help coordinate efforts, connect partners with similar interests, and maintain an inventory of statewide activities. It may also be used to identify any gaps in implementation and future priority populations.
Programs and InterventionsA list of programs and interventions that were ongoing in 2008 is included in the Appendix. Some of these programs and interventions will continue into the future and new ones will be created and implemented.
Implementing the Plan
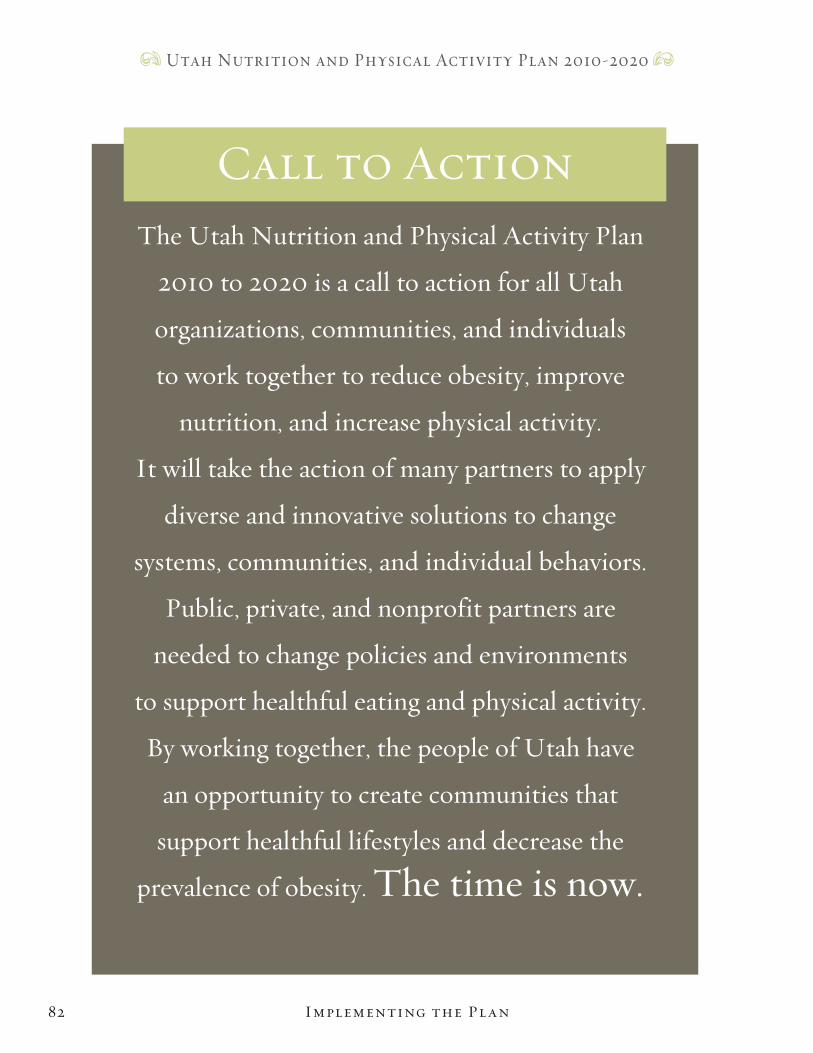
82
Utah Nutrition and Physical Activity Plan 2010-2020
The Utah Nutrition and Physical Activity Plan
2010 to 2020 is a call to action for all Utah
organizations, communities, and individuals
to work together to reduce obesity, improve
nutrition, and increase physical activity.
It will take the action of many partners to apply
diverse and innovative solutions to change
systems, communities, and individual behaviors.
Public, private, and nonprofit partners are
needed to change policies and environments
to support healthful eating and physical activity.
By working together, the people of Utah have
an opportunity to create communities that
support healthful lifestyles and decrease the
prevalence of obesity. The time is now.
Call to Action
Implementing the Plan
The Easy Choice
Measuring Progress:Surveillance and Evaluation
Prog
ress
84
Utah Nutrition and Physical Activity Plan 2010-2020
Surveillance and EvaluationThe main purpose of conducting routine surveillance and evaluation is to ensure that progress toward the overarching goal (to decrease overweight and obesity in children, youth, and adults) is monitored and to ensure that initiatives implemented through the 10-year state plan are monitored and evaluated. A surveillance and evaluation system will meet these needs through establishing a Surveillance Data Plan, establishing an evaluation plan in collaboration with the Evaluation Advisory Group, and routinely assessing training needs of partners.
Evaluations performed will include process evaluation of the state plan development, process evaluation of the statewide partnership to decrease overweight and obesity in Utah, and program evaluation of interventions. All evaluations will be guided by the program logic model found on page 35.
Measuring Progr ess
Surveillance Surveillance Data PlanState-specific data on individual weight and weight control practices, physical activity and sedentary behaviors, dietary and nutritional status, morbidity (related chronic diseases or conditions), and breastfeeding practices are essential to understand the burden of obesity in the state. The statewide surveillance system includes data sources that provide information on the six target areas (increase physical activity; increase consumption of fruits and vegetables; decrease consumption of sugar-sweetened beverages; increase breastfeeding initiation, duration, and exclusivity; decrease consumption of high-energy-dense foods; and decrease television screen time). These target areas are addressed in varying degrees by the following data sources: the Behavioral Risk Factor Surveillance System (BRFSS), the Youth Risk Behavior Surveillance System (YRBS), the Pediatric Nutrition Surveillance System (PedNSS), the Pregnancy Nutrition Survey, the National Immunization Survey, the Pregnancy Risk Assessment Monitoring System, the School Health Policies and Programs Study, the National Hospital Discharge Survey, and the National Vital Statistics System. However, it should be noted that some of the current measures could be modified in order to better identify and monitor the six target areas.
A comprehensive state surveillance data plan will be written and published in 2010 and will be reviewed and updated every two years. The report will include an evaluation of current measures and proposed future measures. Reports of the current state of overweight and obesity, along with measurements for the six target areas will be created routinely. These reports will be distributed to all partners and they will be available to the public.
EvaluationEvaluation is generally categorized into process or outcome evaluation. The purpose of process evaluation is to measure changes in the level of effort or activity and the purpose of outcome evaluation is to measure changes that have occurred, accomplishments that have been achieved, and needs that have been met among a target population. Within the context of obesity and overweight reduction in Utah, process evaluation will be used to evaluate processes and organizations and program evaluation will be used to evaluate programs and interventions.
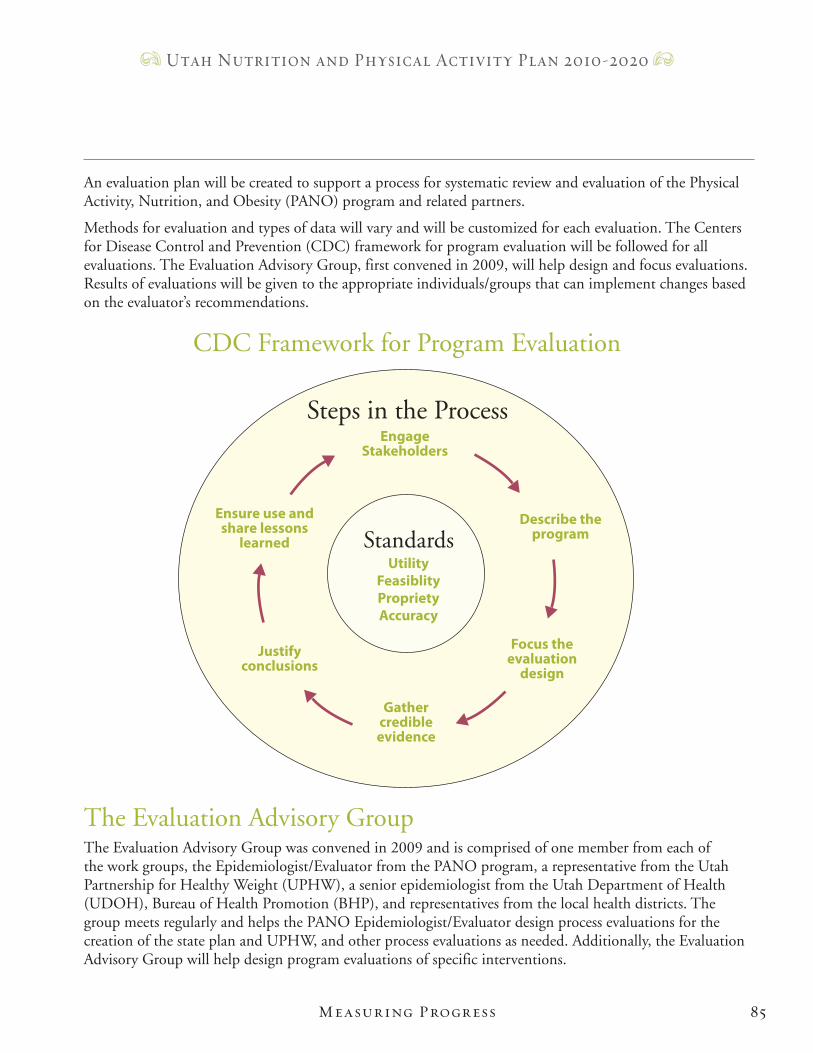
85
Utah Nutrition and Physical Activity Plan 2010-2020
EngageStakeholders
Describe the program
Focus the evaluation
design
Ensure use and share lessons
learned
Justify conclusions
Gather credible evidence
UtilityFeasiblityProprietyAccuracy
Steps in the Process
Standards
CDC Framework for Program Evaluation
The Evaluation Advisory GroupThe Evaluation Advisory Group was convened in 2009 and is comprised of one member from each of the work groups, the Epidemiologist/Evaluator from the PANO program, a representative from the Utah Partnership for Healthy Weight (UPHW), a senior epidemiologist from the Utah Department of Health (UDOH), Bureau of Health Promotion (BHP), and representatives from the local health districts. The group meets regularly and helps the PANO Epidemiologist/Evaluator design process evaluations for the creation of the state plan and UPHW, and other process evaluations as needed. Additionally, the Evaluation Advisory Group will help design program evaluations of specific interventions.
Measuring Progr ess
An evaluation plan will be created to support a process for systematic review and evaluation of the Physical Activity, Nutrition, and Obesity (PANO) program and related partners.
Methods for evaluation and types of data will vary and will be customized for each evaluation. The Centers for Disease Control and Prevention (CDC) framework for program evaluation will be followed for all evaluations. The Evaluation Advisory Group, first convened in 2009, will help design and focus evaluations. Results of evaluations will be given to the appropriate individuals/groups that can implement changes based on the evaluator’s recommendations.
86
Utah Nutrition and Physical Activity Plan 2010-2020
Evaluation of State Plan Development ProcessThe state plan represents a road map of activities that the partners intend to undertake to achieve important goals that address obesity and other chronic diseases. In order to determine whether the method used to develop the state plan was an effective process, this process will be evaluated. The process evaluation will be designed with the help of the Evaluation Advisory Group and will be implemented by the PANO Epidemiologist/Evaluator. All individuals/ organizations that contributed to the state plan will be included.
The results and recommendations will be distributed to PANO staff. This process evaluation will be conducted in 2010 and every time a new 10-year state plan is created. In addition to this process evaluation, the state plan will be evaluated annually to determine which goals and strategies partners are working on and the relevance of the current state plan.
Evaluation of the Statewide Partnership An evaluation of Utah’s statewide partnership to address overweight and obesity in Utah will be conducted in 2010 and every two years thereafter. The focus of this process evaluation will be determined by the Evaluation Advisory Group and the evaluation will be conducted by the PANO Epidemiologist/Evaluator. The results and recommendations will be distributed to appropriate leadership.
Evaluation of Annual Implementation PlansThe annual implementation plans developed by each work group will be reviewed annually. The implementation plans are created based on the goals and strategies found in the state plan and include detail about how the selected strategy will be accomplished within the one-year time frame. At the end of the year, the work group will review the progress for each strategy and decide on the action for next year (i.e., continue working on the strategy, state that the strategy has been accomplished, or modify the strategy based on the previous year’s experience). Thus, the implementation plans become the working document for the work group.
The activities included in the annual implementation plans are based on the goals and strategies in the 10-year state plan. However, all work groups review the goals and strategies annually and decide if they need to be revised. Any changes made are captured in the implementation plan since the state plan will only be updated every 10 years.
Evaluation of InterventionsEvaluation of state plan intervention activities (outcome evaluation) will be conducted when program interventions are designed. These evaluations could be designed and conducted by partners or the Evaluation Advisory Group. PANO staff or contractors could be responsible for conducting program intervention evaluation(s). The results/recommendations from the evaluation will be distributed to appropriate individuals/organizations that were identified during the design process.
Training NeedsA needs assessment of local health districts was conducted in 2009. This resulted in trainings conducted by the PANO staff. Partner training needs will be reassessed routinely by the PANO Epidemiologist/Evaluator and appropriate trainings will be identified and/or conducted by the PANO staff or contractors.
Measuring Progr ess
App
endi
ces
The Easy Choice
Appendices
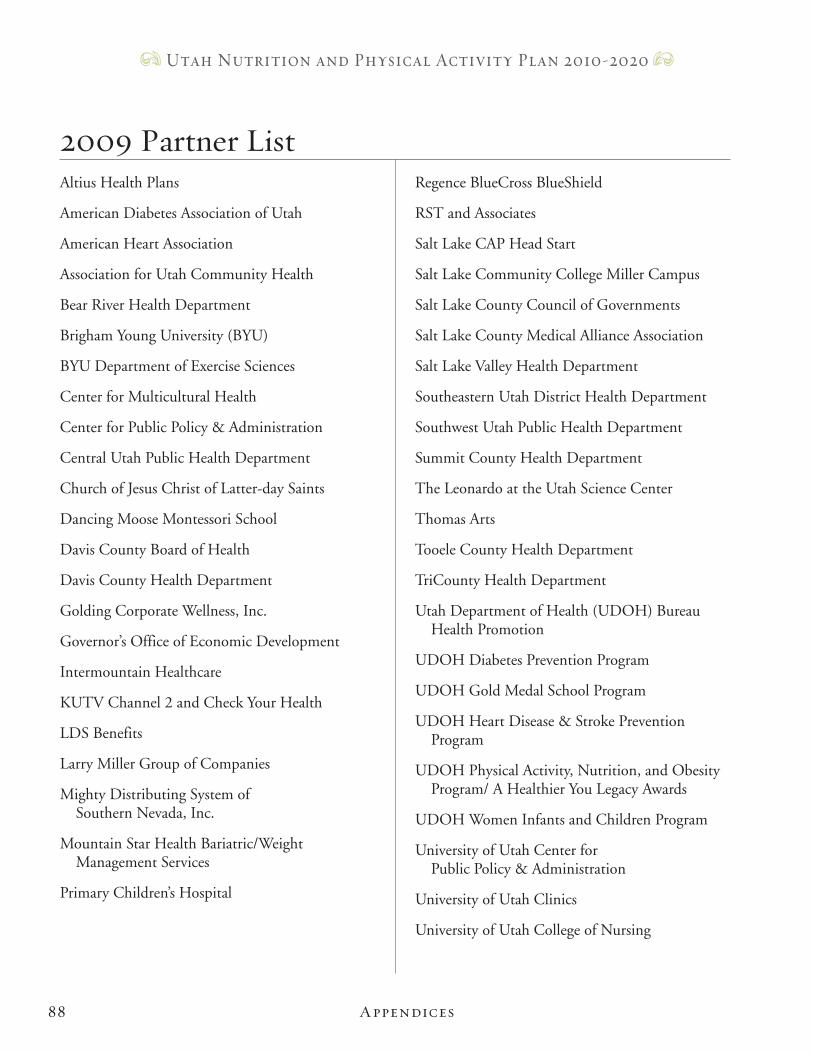
88
Utah Nutrition and Physical Activity Plan 2010-2020
2009 Partner ListAltius Health Plans
American Diabetes Association of Utah
American Heart Association
Association for Utah Community Health
Bear River Health Department
Brigham Young University (BYU)
BYU Department of Exercise Sciences
Center for Multicultural Health
Center for Public Policy & Administration
Central Utah Public Health Department
Church of Jesus Christ of Latter-day Saints
Dancing Moose Montessori School
Davis County Board of Health
Davis County Health Department
Golding Corporate Wellness, Inc.
Governor’s Office of Economic Development
Intermountain Healthcare
KUTV Channel 2 and Check Your Health
LDS Benefits
Larry Miller Group of Companies
Mighty Distributing System of Southern Nevada, Inc.
Mountain Star Health Bariatric/Weight Management Services
Primary Children’s Hospital
Regence BlueCross BlueShield
RST and Associates
Salt Lake CAP Head Start
Salt Lake Community College Miller Campus
Salt Lake County Council of Governments
Salt Lake County Medical Alliance Association
Salt Lake Valley Health Department
Southeastern Utah District Health Department
Southwest Utah Public Health Department
Summit County Health Department
The Leonardo at the Utah Science Center
Thomas Arts
Tooele County Health Department
TriCounty Health Department
Utah Department of Health (UDOH) Bureau Health Promotion
UDOH Diabetes Prevention Program
UDOH Gold Medal School Program
UDOH Heart Disease & Stroke Prevention Program
UDOH Physical Activity, Nutrition, and Obesity Program/ A Healthier You Legacy Awards
UDOH Women Infants and Children Program
University of Utah Center for Public Policy & Administration
University of Utah Clinics
University of Utah College of Nursing
Appendices
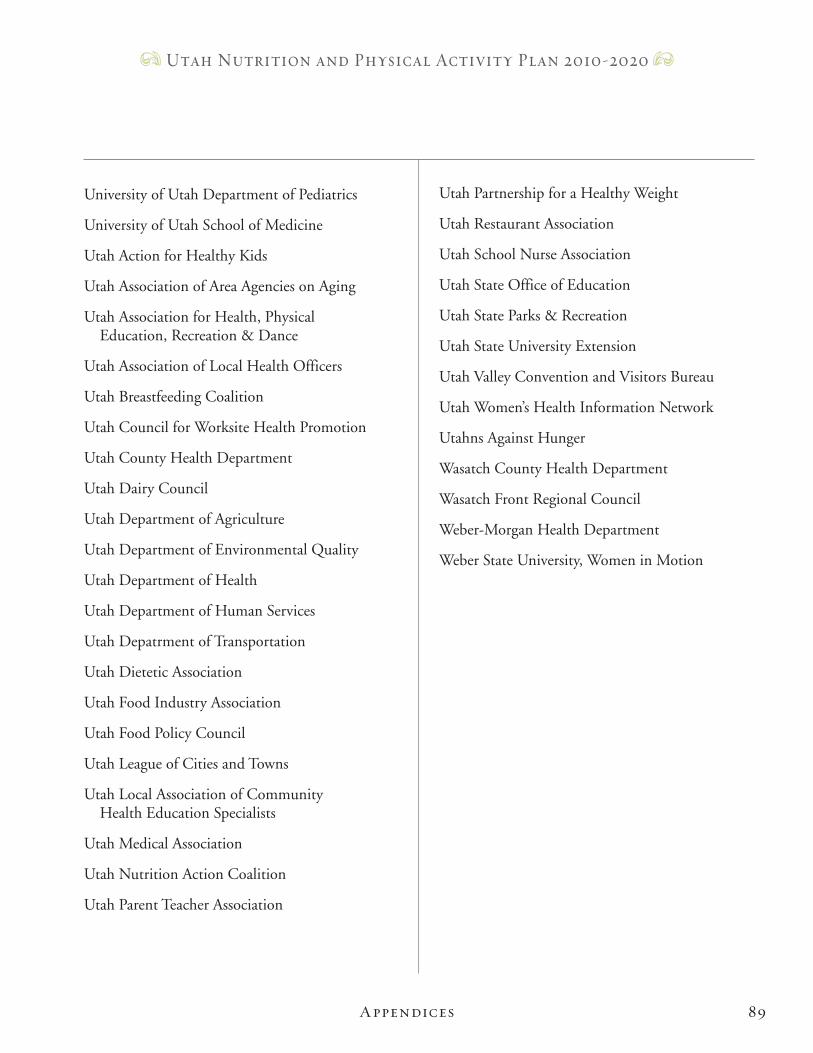
89
Utah Nutrition and Physical Activity Plan 2010-2020
University of Utah Department of Pediatrics
University of Utah School of Medicine
Utah Action for Healthy Kids
Utah Association of Area Agencies on Aging
Utah Association for Health, Physical Education, Recreation & Dance
Utah Association of Local Health Officers
Utah Breastfeeding Coalition
Utah Council for Worksite Health Promotion
Utah County Health Department
Utah Dairy Council
Utah Department of Agriculture
Utah Department of Environmental Quality
Utah Department of Health
Utah Department of Human Services
Utah Depatrment of Transportation
Utah Dietetic Association
Utah Food Industry Association
Utah Food Policy Council
Utah League of Cities and Towns
Utah Local Association of Community Health Education Specialists
Utah Medical Association
Utah Nutrition Action Coalition
Utah Parent Teacher Association
Utah Partnership for a Healthy Weight
Utah Restaurant Association
Utah School Nurse Association
Utah State Office of Education
Utah State Parks & Recreation
Utah State University Extension
Utah Valley Convention and Visitors Bureau
Utah Women’s Health Information Network
Utahns Against Hunger
Wasatch County Health Department
Wasatch Front Regional Council
Weber-Morgan Health Department
Weber State University, Women in Motion
Appendices
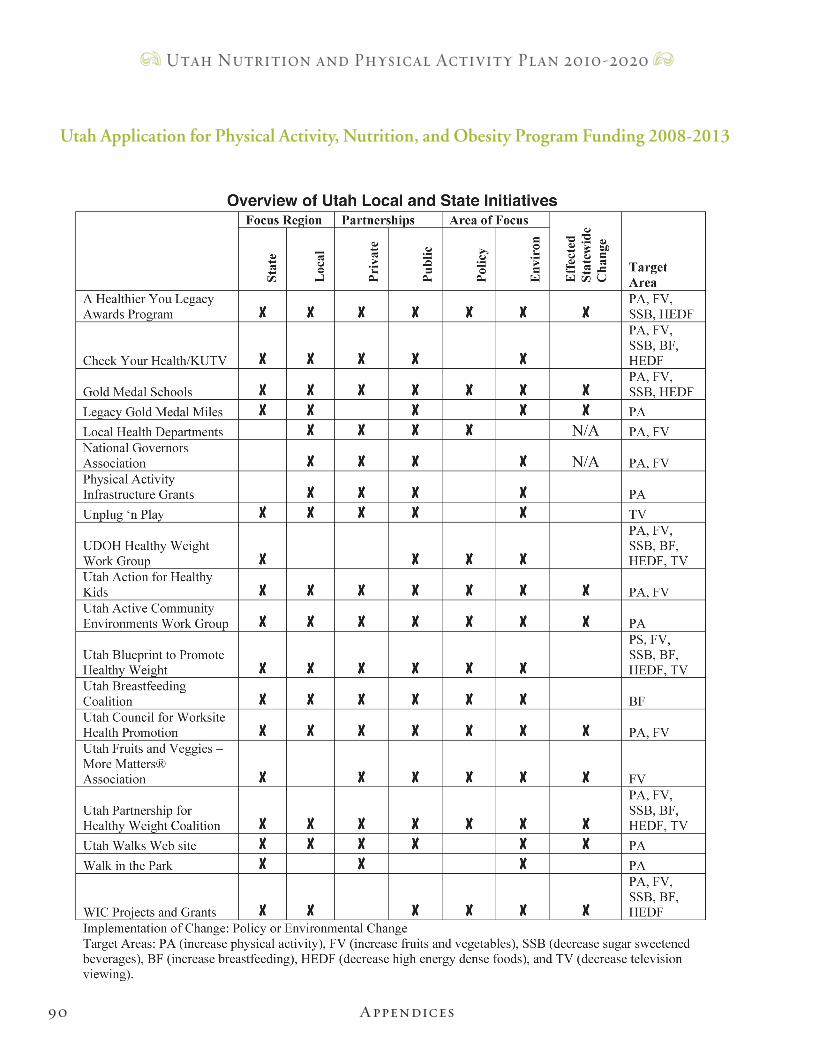
90
Utah Nutrition and Physical Activity Plan 2010-2020
Appendices
Utah Application for Physical Activity, Nutrition, and Obesity Program Funding 2008-2013
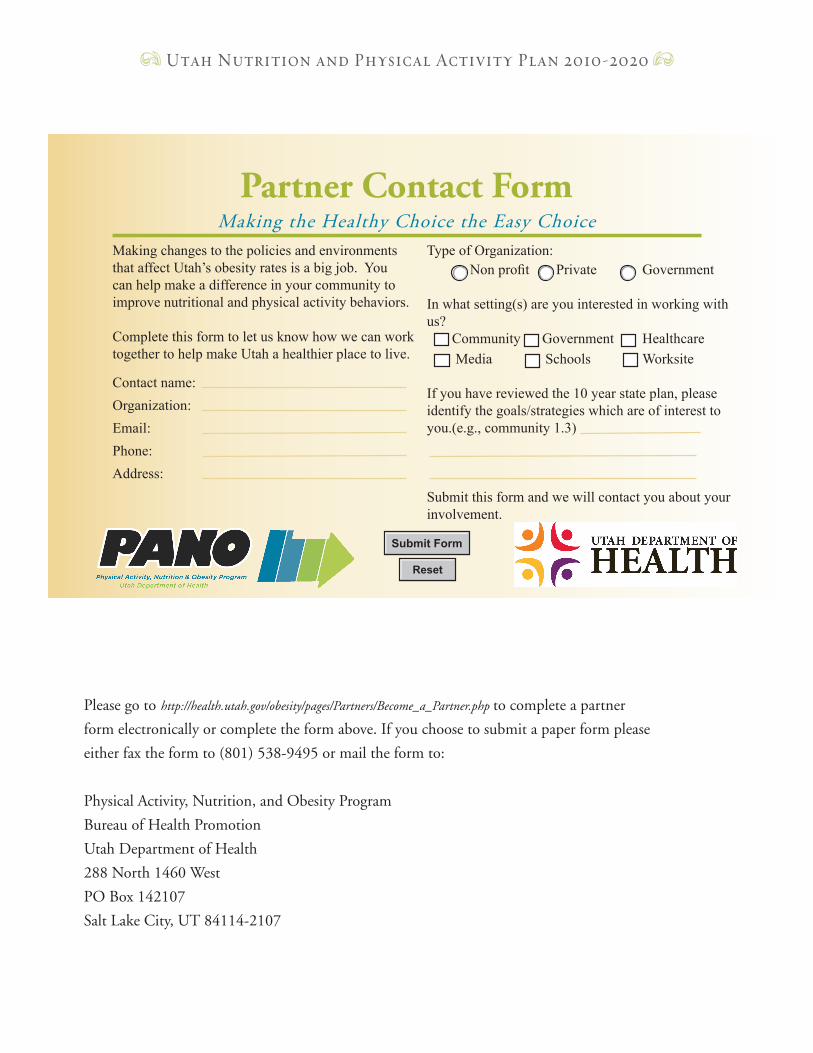
Utah Nutrition and Physical Activity Plan 2010-2020
Please go to http://health.utah.gov/obesity/pages/Partners/Become_a_Partner.php to complete a partner
form electronically or complete the form above. If you choose to submit a paper form please
either fax the form to (801) 538-9495 or mail the form to:
Physical Activity, Nutrition, and Obesity Program
Bureau of Health Promotion
Utah Department of Health
288 North 1460 West
PO Box 142107
Salt Lake City, UT 84114-2107
Partner Contact FormMaking the Healthy Choice the Easy Choice
Making changes to the policies and environments that affect Utah’s obesity rates is a big job. You can help make a difference in your community to improve nutritional and physical activity behaviors.
Complete this form to let us know how we can work together to help make Utah a healthier place to live.
Contact name:Organization:Email:Phone:Address:
Type of Organization: Non profit Private Government
In what setting(s) are you interested in working with us? Community Government Healthcare Media Schools Worksite If you have reviewed the 10 year state plan, please identify the goals/strategies which are of interest to you.(e.g., community 1.3)
Submit this form and we will contact you about your involvement.
Submit Form
Reset
phySical activity, nutRition, and obeSity pRogRam
Bureau of Health Promotion Utah Department of Health
288 North 1460 West PO Box 142107
Salt Lake City, Utah 84114-2107