Embed Size (px)
Citation preview
Real-time tomographic images for organ function monitoring and diagnosis
electricalimpedancetomography
U s e r i n t e r fa c e e x p l a i n e d
See what really mattersaward-winning interface of swisstom BB2
2ST800-106 Rev. 000 © Swisstom aG 2015 patents pending
LuFuView stretchsilent spaces
VentView minimum maximum
time (s) 010
current time signal quality skin contact patient position SensorBelt time left
12 h14:15 RScoutViewScoutView
VentViewTM: Shows the distribution of
air within the lungs during breathing just like a movie. This in-
formation on regional ventilation is brought
to you continuously and in real-time.
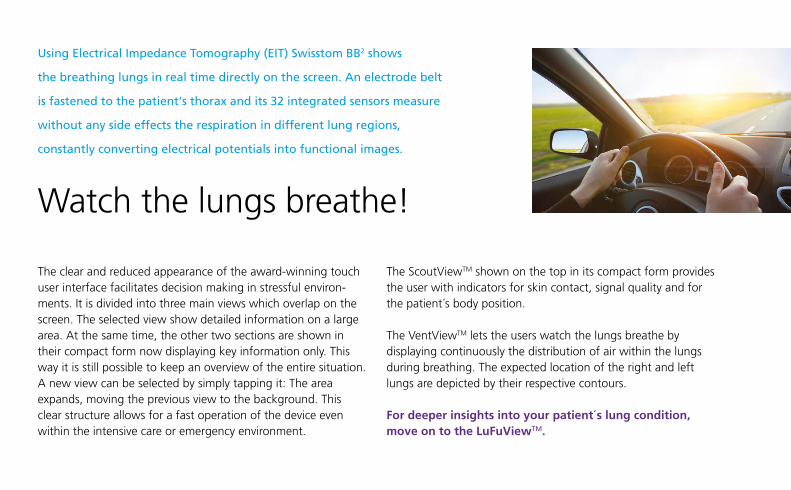
Watch the lungs breathe!
Using electrical impedance tomography (eit) swisstom BB2 shows
the breathing lungs in real time directly on the screen. an electrode belt
is fastened to the patient‘s thorax and its 32 integrated sensors measure
without any side effects the respiration in different lung regions,
constantly converting electrical potentials into functional images.
The clear and reduced appearance of the award-winning touch user interface facilitates decision making in stressful environ-ments. it is divided into three main views which overlap on the screen. The selected view show detailed information on a large area. at the same time, the other two sections are shown in their compact form now displaying key information only. This way it is still possible to keep an overview of the entire situation. a new view can be selected by simply tapping it: The area expands, moving the previous view to the background. This clear structure allows for a fast operation of the device even within the intensive care or emergency environment.
The ScoutViewTM shown on the top in its compact form provides the user with indicators for skin contact, signal quality and for the patient´s body position.
The VentViewTM lets the users watch the lungs breathe by displaying continuously the distribution of air within the lungs during breathing. The expected location of the right and left lungs are depicted by their respective contours.
For deeper insights into your patient´s lung condition, move on to the LuFuViewtM.
VentView
time (s) 010
LuFuView
20
15
10
5
0,2 0,3 0,4 0,5 0,6 0,7 0,8 0,9 1,0
% relative volume
relative stretch
stretch
event trend time scaledetails
silent spaces
ScoutViewScoutView
start
current time signal quality SensorBelt time leftskin contact patient position
12 h14:15 R
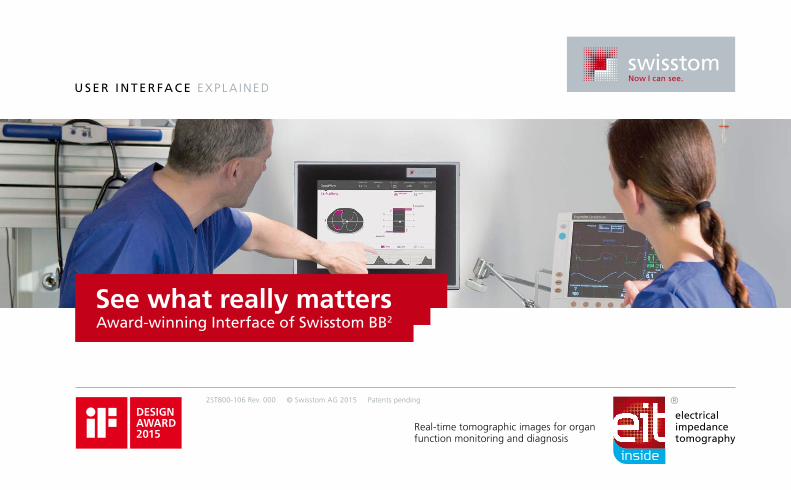
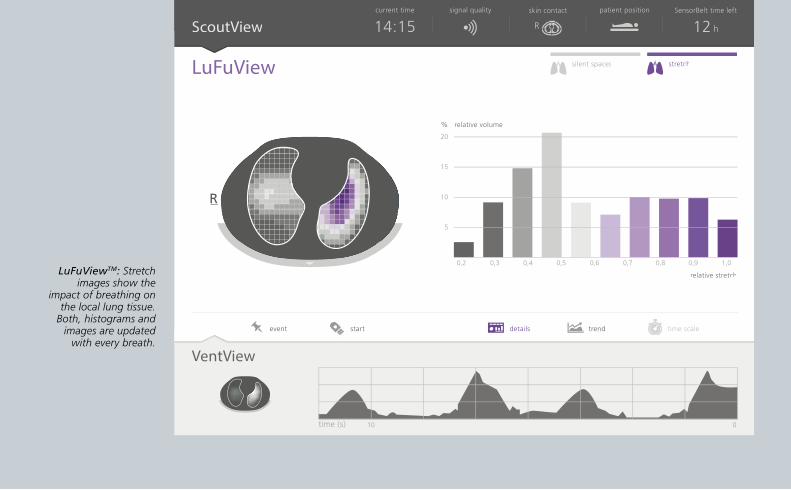
LuFuViewTM: Stretch images show the
impact of breathing on the local lung tissue.
Both, histograms and images are updated
with every breath.
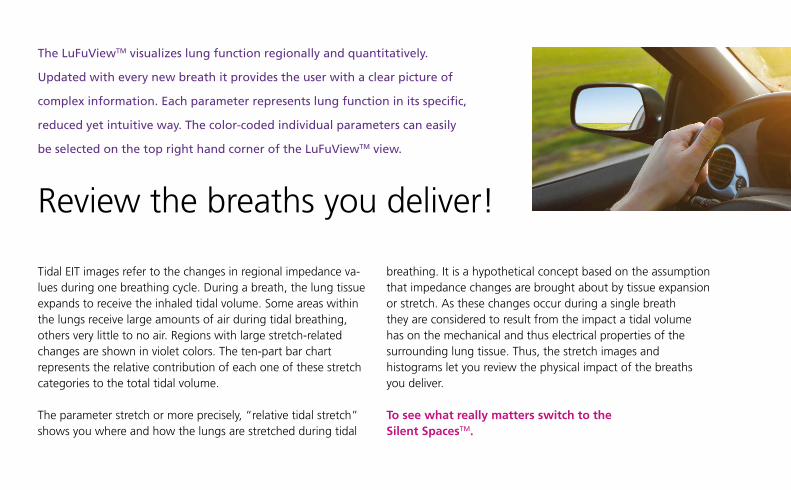
Review the breaths you deliver!
the LufuViewtM visualizes lung function regionally and quantitatively.
Updated with every new breath it provides the user with a clear picture of
complex information. each parameter represents lung function in its specific,
reduced yet intuitive way. the color-coded individual parameters can easily
be selected on the top right hand corner of the LufuViewtM view.
Tidal eiT images refer to the changes in regional impedance va-lues during one breathing cycle. during a breath, the lung tissue expands to receive the inhaled tidal volume. Some areas within the lungs receive large amounts of air during tidal breathing, others very little to no air. Regions with large stretch-related changes are shown in violet colors. The ten-part bar chart represents the relative contribution of each one of these stretch categories to the total tidal volume.
The parameter stretch or more precisely, “relative tidal stretch” shows you where and how the lungs are stretched during tidal
breathing. it is a hypothetical concept based on the assumption that impedance changes are brought about by tissue expansion or stretch. as these changes occur during a single breath they are considered to result from the impact a tidal volume has on the mechanical and thus electrical properties of the surrounding lung tissue. Thus, the stretch images and histograms let you review the physical impact of the breaths you deliver.
To see what really matters switch to the Silent SpacestM.
VentView
7
9
time (s) 010
LuFuView
75
50
25
0
0
25
50
75
% nondependent
dependent %
stretchsilent spaces
trendevent start time scaledetails
ScoutViewcurrent time signal quality SensorBelt time leftskin contact patient position
12 h14:15 R
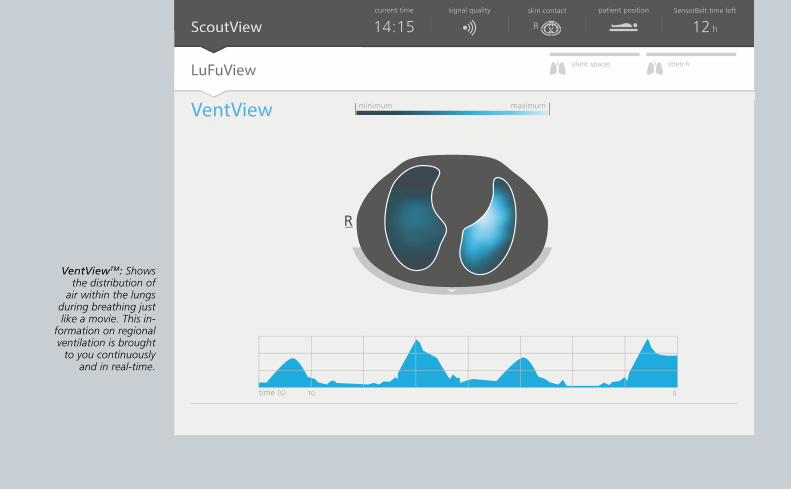
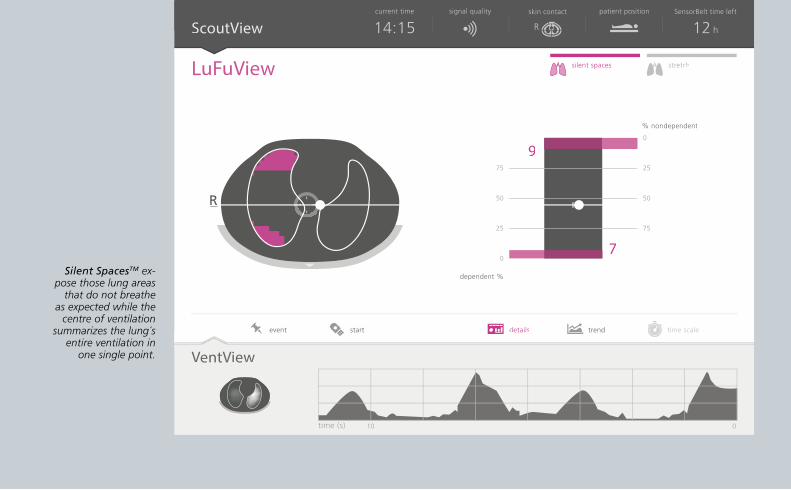
Silent SpacesTM ex-pose those lung areas
that do not breathe as expected while the
centre of ventilation summarizes the lung´s
entire ventilation in one single point.
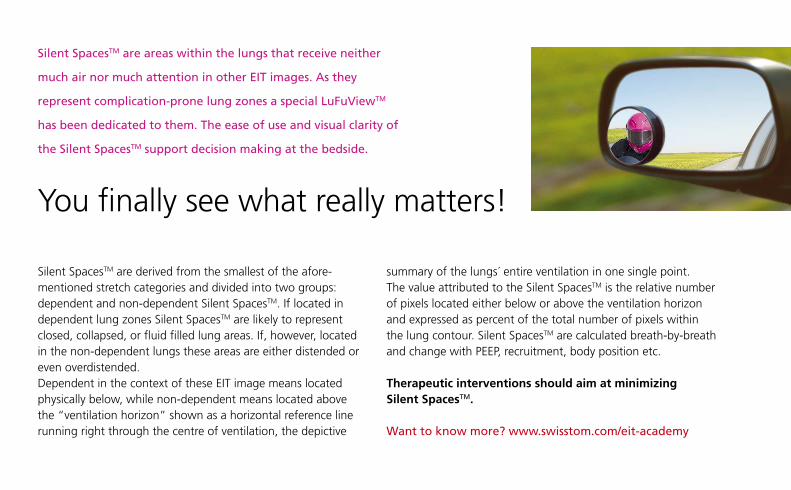
You finally see what really matters!
silent spacestM are areas within the lungs that receive neither
much air nor much attention in other eit images. as they
represent complication-prone lung zones a special LufuViewtM
has been dedicated to them. the ease of use and visual clarity of
the silent spacestM support decision making at the bedside.
Silent SpacesTM are derived from the smallest of the afore-mentioned stretch categories and divided into two groups: dependent and non-dependent Silent SpacesTM. if located in dependent lung zones Silent SpacesTM are likely to represent closed, collapsed, or fluid filled lung areas. if, however, located in the non-dependent lungs these areas are either distended or even overdistended. dependent in the context of these eiT image means located physically below, while non-dependent means located above the “ventilation horizon” shown as a horizontal reference line running right through the centre of ventilation, the depictive
summary of the lungs´ entire ventilation in one single point. The value attributed to the Silent SpacesTM is the relative number of pixels located either below or above the ventilation horizon and expressed as percent of the total number of pixels within the lung contour. Silent SpacesTM are calculated breath-by-breath and change with peep, recruitment, body position etc.
Therapeutic interventions should aim at minimizing Silent SpacestM.
Want to know more? www.swisstom.com/eit-academy
electricalimpedancetomography
Real-time tomographic images for organ function monitoring and diagnosis
Contact us!
call: + 41 (0) 81 330 09 72 mail: [email protected]: www.swisstom.com
Swisstom aGSchulstrasse 1, CH-7302 landquart, Switzerland
Swisstom AGSwisstom aG, located in landquart, Switzerland, develops and manufactures innovative medical devices. Our new lung function monitor enables life-saving treatments for patients in intensive care and during general anesthesia.
Unlike traditional tomography, Swisstom´s bedside imaging is based on non-radiating principles: electrical impedance Tomography (eiT). To date, no comparable devices can show such regional organ function continuously and in real-time at the patient’s bedside.
Swisstom creates its competitive edge by passionate leadership in non-invasive tomography with the goal to improve individual lives and therapies.
Made in Switzerland
2ST800-106 Rev. 000 © Swisstom aG 2015 patents pending
Text
: D
r. S
tep
han
H.
Bö
hm
; C
on
cep
t an
d r
ealis
atio
n :
Zw
eize
it B
ran
d D
evel
op
men
t,
Ham
bu
rg;
Scre
ens:
Sw
isst
om
AG
; Ph
oto
s: is
tock
, 1
23
RF;
Ph
oto
mo
nta
ge:
Zw
eize
it
U s e r i n t e r fa c e e x p l a i n e d