Embed Size (px)
Citation preview
2016 European Venture Capital Report
January 2017
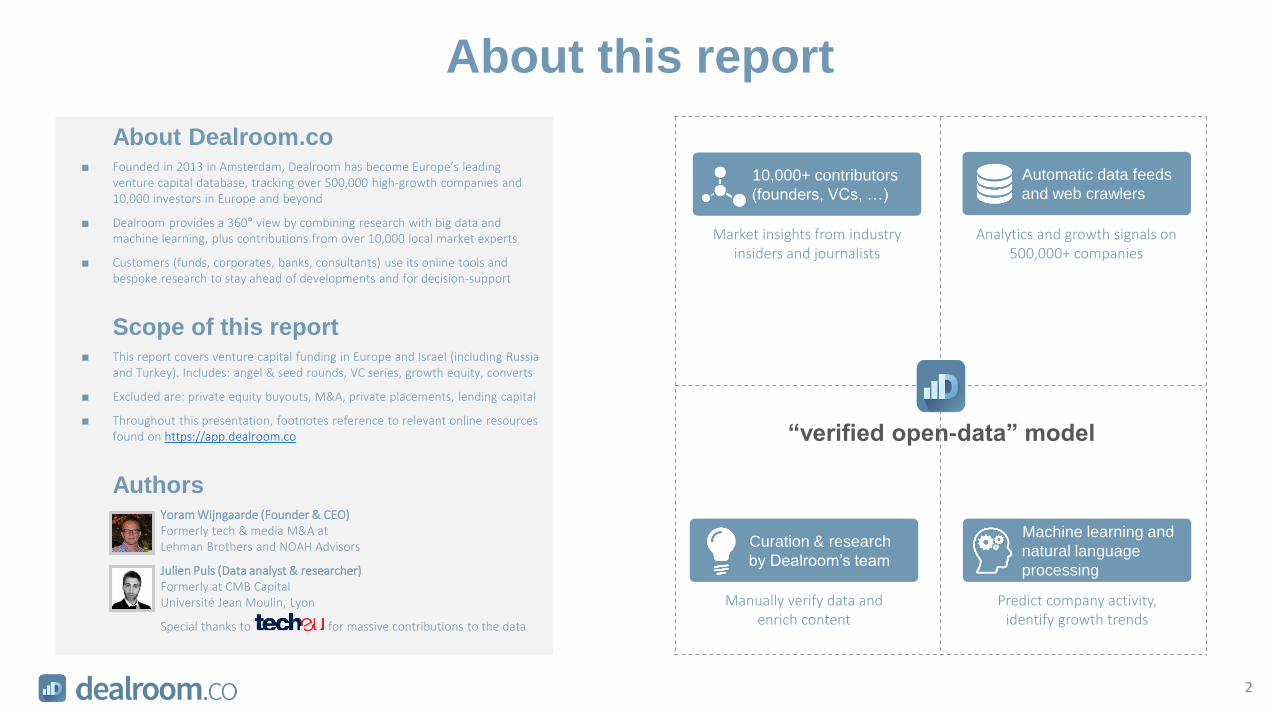
About this report
Curation & research
by Dealroom’s team
Machine learning and
natural language
processing
Analytics and growth signals on 500,000+ companies
10,000+ contributors
(founders, VCs, …)
Automatic data feeds
and web crawlers
Market insights from industry insiders and journalists
Manually verify data and enrich content
Predict company activity, identify growth trends
2
About Dealroom.co■ Founded in 2013 in Amsterdam, Dealroom has become Europe’s leading
venture capital database, tracking over 500,000 high-growth companies and 10,000 investors in Europe and beyond
■ Dealroom provides a 360° view by combining research with big data and machine learning, plus contributions from over 10,000 local market experts
■ Customers (funds, corporates, banks, consultants) use its online tools and bespoke research to stay ahead of developments and for decision-support
Scope of this report■ This report covers venture capital funding in Europe and Israel (including Russia
and Turkey). Includes: angel & seed rounds, VC series, growth equity, converts
■ Excluded are: private equity buyouts, M&A, private placements, lending capital
■ Throughout this presentation, footnotes reference to relevant online resources found on https://app.dealroom.co
AuthorsYoram Wijngaarde (Founder & CEO)Formerly tech & media M&A at Lehman Brothers and NOAH Advisors
Julien Puls (Data analyst & researcher)Formerly at CMB CapitalUniversité Jean Moulin, Lyon
Special thanks to for massive contributions to the data
“verified open-data” model
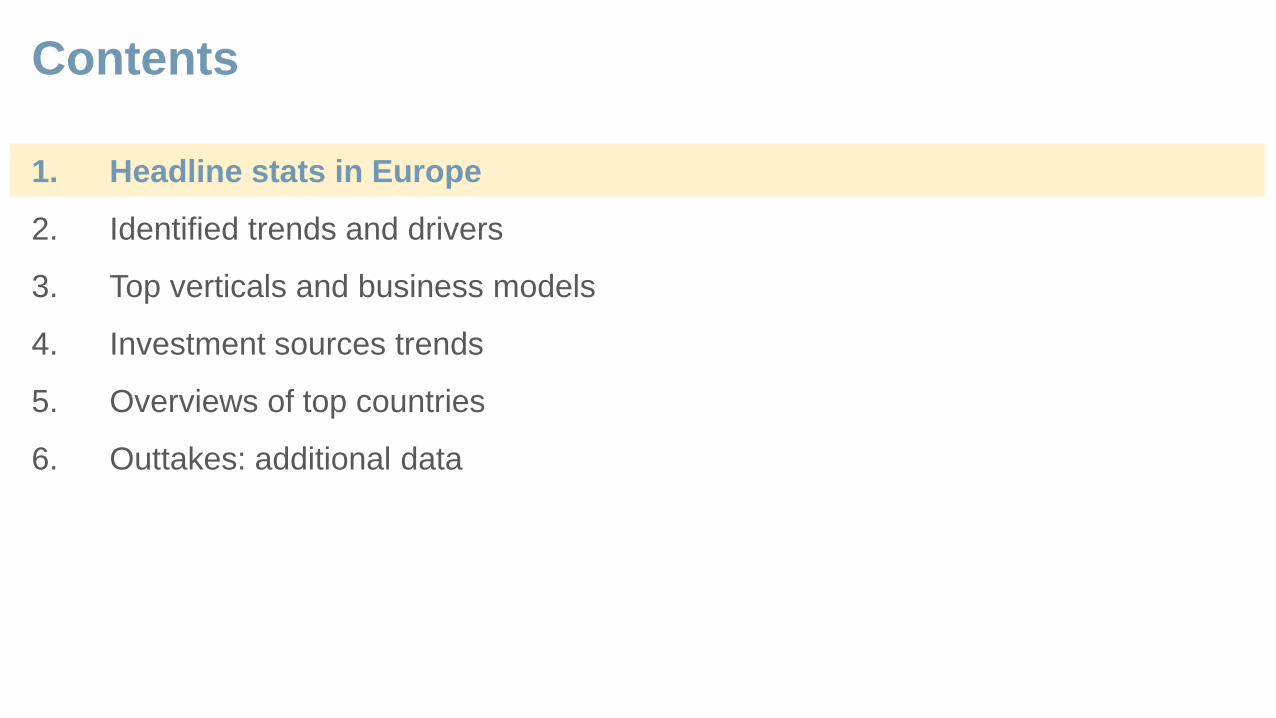
1. Headline stats in Europe
2. Identified trends and drivers
3. Top verticals and business models
4. Investment sources trends
5. Overviews of top countries
6. Outtakes: additional data
Contents
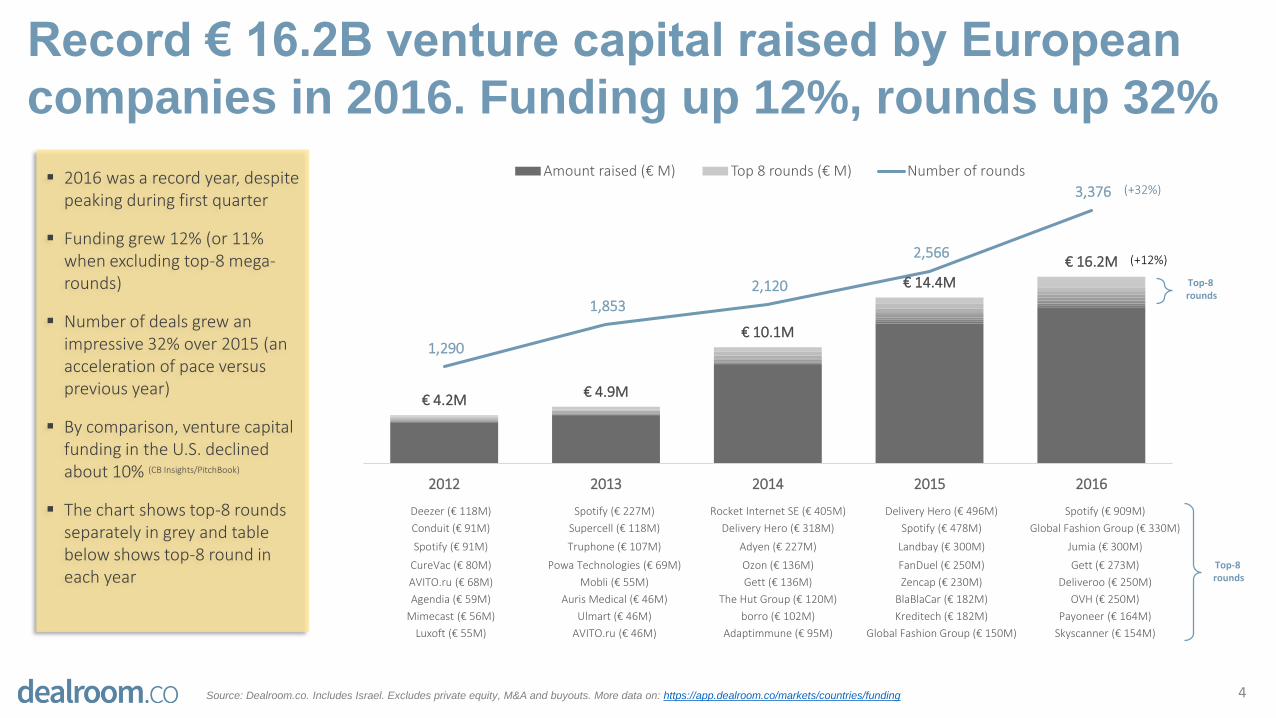
Record € 16.2B venture capital raised by European
companies in 2016. Funding up 12%, rounds up 32%
2016 was a record year, despite peaking during first quarter
Funding grew 12% (or 11% when excluding top-8 mega-rounds)
Number of deals grew an impressive 32% over 2015 (an acceleration of pace versus previous year)
By comparison, venture capital funding in the U.S. declined about 10% (CB Insights/PitchBook)
The chart shows top-8 rounds separately in grey and table below shows top-8 round in each year
4
€ 4.2M€ 4.9M
€ 10.1M
€ 14.4M
€ 16.2M
1,290
1,853
2,120
2,566
3,376
2012 2013 2014 2015 2016
Amount raised (€ M) Top 8 rounds (€ M) Number of rounds
Deezer (€ 118M) Spotify (€ 227M) Rocket Internet SE (€ 405M) Delivery Hero (€ 496M) Spotify (€ 909M)
Conduit (€ 91M) Supercell (€ 118M) Delivery Hero (€ 318M) Spotify (€ 478M) Global Fashion Group (€ 330M)
Spotify (€ 91M) Truphone (€ 107M) Adyen (€ 227M) Landbay (€ 300M) Jumia (€ 300M)
CureVac (€ 80M) Powa Technologies (€ 69M) Ozon (€ 136M) FanDuel (€ 250M) Gett (€ 273M)
AVITO.ru (€ 68M) Mobli (€ 55M) Gett (€ 136M) Zencap (€ 230M) Deliveroo (€ 250M)
Agendia (€ 59M) Auris Medical (€ 46M) The Hut Group (€ 120M) BlaBlaCar (€ 182M) OVH (€ 250M)
Mimecast (€ 56M) Ulmart (€ 46M) borro (€ 102M) Kreditech (€ 182M) Payoneer (€ 164M)
Luxoft (€ 55M) AVITO.ru (€ 46M) Adaptimmune (€ 95M) Global Fashion Group (€ 150M) Skyscanner (€ 154M)
Top-8 rounds
Top-8 rounds
(+32%)
(+12%)
Source: Dealroom.co. Includes Israel. Excludes private equity, M&A and buyouts. More data on: https://app.dealroom.co/markets/countries/funding

€ 888M
€ 1,331M€ 1,118M
€ 1,569M
€ 2,015M
€ 2,478M
€ 3,618M
€ 2,116M
€ 3,552M€ 3,848M
€ 4,310M
€ 3,535M
€ 4,627M€ 4,238M
€ 3,513M€ 3,799M
389
467 499 498
544 561 530
485
636 561 648
721
883 836
786
871
Q1 Q2 Q3 Q4 Q1 Q2 Q3 Q4 Q1 Q2 Q3 Q4 Q1 Q2 Q3 Q4
2013 2014 2015 2016
Amount raised (€ M) Top 8 rounds (€ M) Number of rounds
Q4: €3.8 billion raised by European companies.
Number of rounds in Q4 were second highest ever
5
Funding peaked during Q1, in € terms.
Number of rounds during Q4 were close to an all-time high.
Source: Dealroom.co. Note: blue font indicates biotech. Excludes private equity, M&A and buyouts. More data on: https://app.dealroom.co/markets/countries/funding
Q4 ranks as #5 highest quarter ever.
Top-8 rounds
Top-8 rounds
Truphone Supercell Powa Spotify Klarna Ozon Rocket Adyen Delivery Hero Spotify FanDuel CureVac Spotify GFG OVH Payoneer
€ 107M € 118M € 69M € 227M € 90M € 136M € 405M € 227M € 496M € 478M € 250M € 100M € 909M € 330M € 250M € 164M
AVITO.ru Auris Medical Shazam Mobli Delivery Hero Takeaway Delivery Hero Powa HelloFresh INFINIDAT BlaBlaCar Atom Bank Jumia Gett Deliveroo SIGFOX
€ 46M € 46M € 36M € 55M € 80M € 94M € 318M € 73M € 110M € 136M € 182M € 98M € 300M € 273M € 250M € 150M
Hybris Ulmart Evotec Arria NLG NovImmune Delivery Hero Gett Blue Yonder SIGFOX Funding Circle GFG Deliveroo Skyscanner Cabify OurCrowd Devialet
€ 27M € 46M € 36M € 37M € 60M € 77M € 136M € 68M € 105M € 136M € 150M € 91M € 154M € 109M € 66M € 100M
3V Symphogen Crocus ADC SoundCloud Sarenza The Hut Group Cell Medica Foodpanda Home24 Reward Gtwy Ebury Cool Blue Farfetch Sabio Gett
€ 23M € 41M € 34M € 36M € 55M € 74M € 120M € 60M € 104M € 120M € 144M € 76M € 140M € 100M € 60M € 91M
Game Insight NumberFour NewVoiceMedia Funding Circle Hoccer Westwing Adaptimmune Truecaller WorldRemit Auto1 Group Letgo Symphogen Deezer Letgo Darktrace Voyager Labs
€ 23M € 35M € 32M € 34M € 50M € 72M € 95M € 55M € 91M € 107M € 91M € 68M € 100M € 91M € 58M € 91M
Ostrovok Opsona Delivery Hero Wilocity Avantium Farfetch BlaBlaCar Ascendis Verne Global Delivery Hero Prodigy ObsEva MindMaze SoundCloud LINKBYNET Carrick
€ 23M € 33M € 27M € 32M € 46M € 60M € 91M € 55M € 89M € 100M € 91M € 55M € 91M € 87M € 50M € 86M
Farfetch GenSight WiThings Merus Hailo iZettle ironSource Huddle Farfetch Foodpanda CeQur Cybereason Starling Bank Jumia Jumia HelloFresh
€ 18M € 32M € 27M € 31M € 46M € 50M € 77M € 46M € 78M € 91M € 91M € 54M € 58M € 75M € 50M € 85M
NewVoiceMedia ResearchGate ObsEva Biocartis Kaltura HelloFresh Biocartis StoreDot TransferWise Wallapop Kreditech TransferWise WISeKey SIRIN Labs Silent Circle Sonnenbatterie
€ 18M € 32M € 26M € 30M € 43M € 46M € 65M € 46M € 53M € 91M € 83M € 53M € 55M € 66M € 46M € 77M
€ 1.3B € 1.3B
€ 3.2B
€ 3.8B
€ 3.2B
€ 0.6B € 0.6B
€ 2.0B
€ 2.9B
€ 2.0B
€ 0.5B€ 0.6B
€ 0.8B
€ 1.5B
€ 2.7B
€ 0.5B € 0.5B
€ 1.2B
€ 1.8B
€ 2.7B
€ 0.2B€ 0.3B
€ 0.5B
€ 1.0B
€ 1.6B
€ 1.1B
€ 1.6B
€ 2.4B
€ 3.4B
€ 4.0B
410
542
644
545 520
165 245
288 353 380
118 167 180
243
590
88 132
166 241 231
57 42 82
163
366
452
725 760
1,021
1,289
2012 2013 2014 2015 2016 2012 2013 2014 2015 2016 2012 2013 2014 2015 2016 2012 2013 2014 2015 2016 2012 2013 2014 2015 2016 2012 2013 2014 2015 2016
United Kingdom Germany France Israel Sweden Other
Amount raised (€ billion) Number of rounds
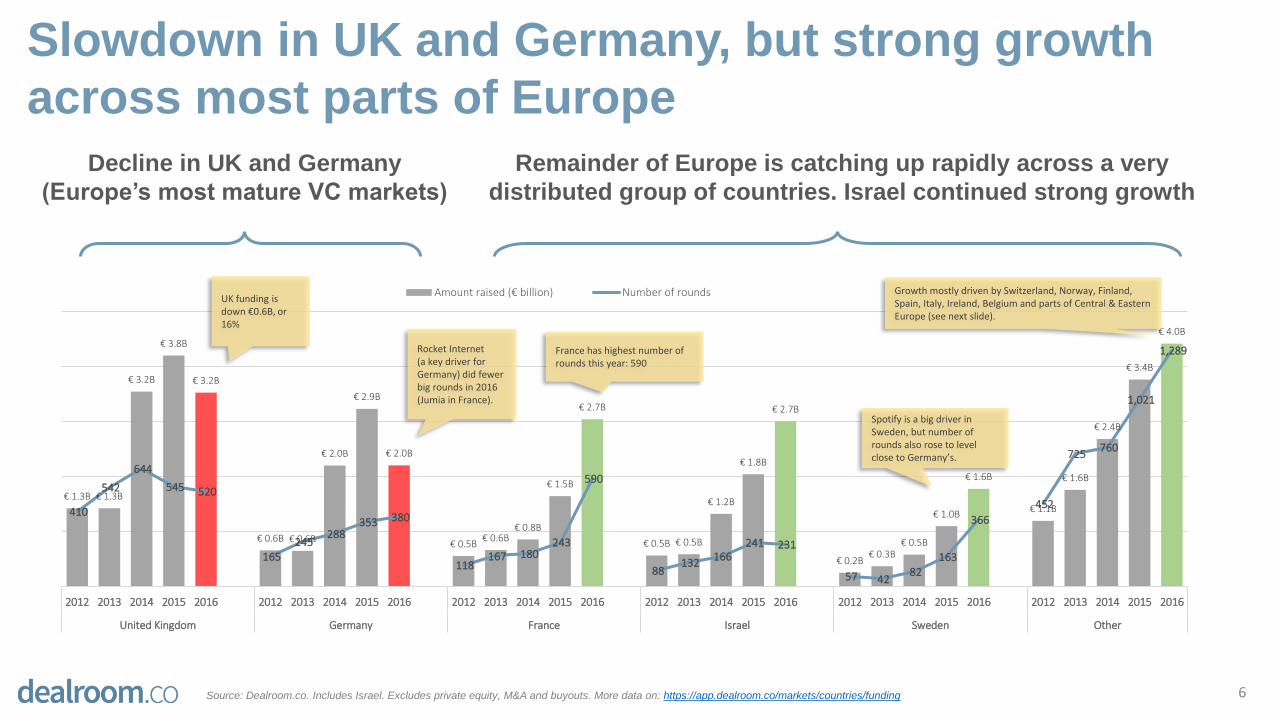
Slowdown in UK and Germany, but strong growth
across most parts of Europe
6
Rocket Internet (a key driver for Germany) did fewer big rounds in 2016 (Jumia in France).
UK funding is down €0.6B, or 16%
Decline in UK and Germany
(Europe’s most mature VC markets)
Remainder of Europe is catching up rapidly across a very
distributed group of countries. Israel continued strong growth
France has highest number of rounds this year: 590
Spotify is a big driver in Sweden, but number of rounds also rose to level close to Germany’s.
Growth mostly driven by Switzerland, Norway, Finland, Spain, Italy, Ireland, Belgium and parts of Central & Eastern Europe (see next slide).
Source: Dealroom.co. Includes Israel. Excludes private equity, M&A and buyouts. More data on: https://app.dealroom.co/markets/countries/funding
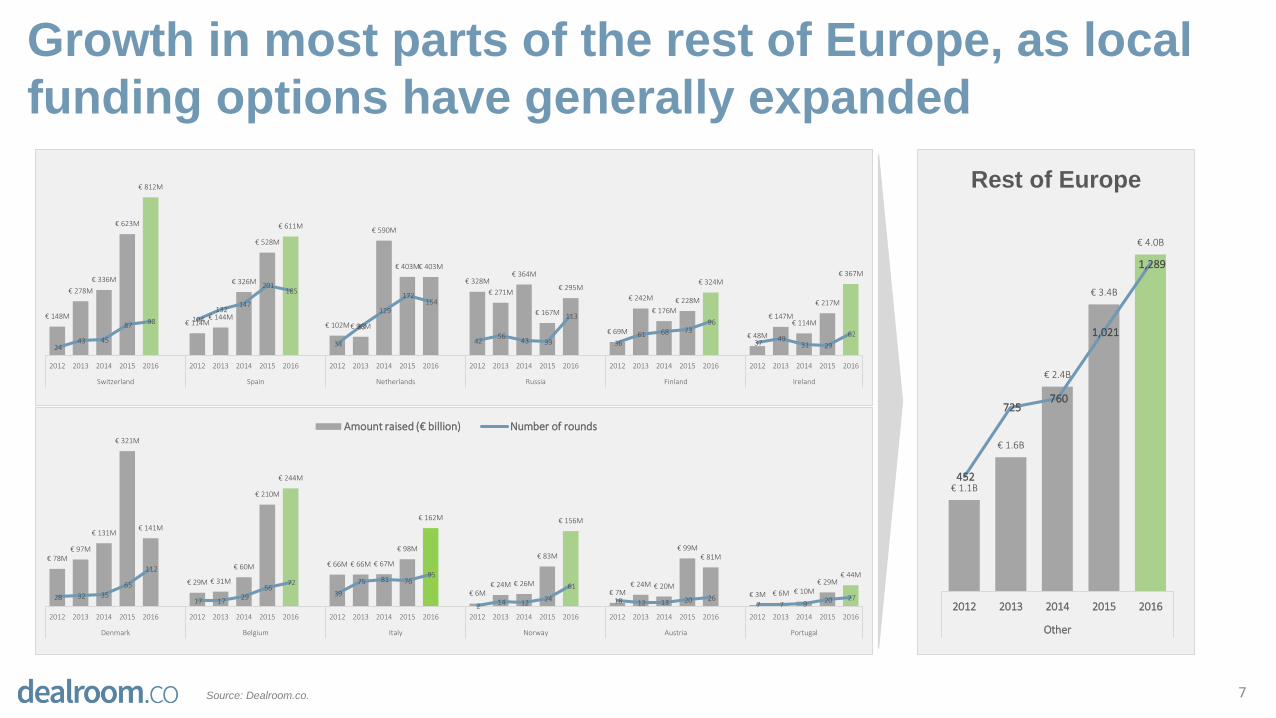
Growth in most parts of the rest of Europe, as local
funding options have generally expanded
7Source: Dealroom.co.
€ 148M
€ 278M
€ 336M
€ 623M
€ 812M
€ 114M€ 144M
€ 326M
€ 528M
€ 611M
€ 102M€ 96M
€ 590M
€ 403M€ 403M
€ 328M
€ 271M
€ 364M
€ 167M
€ 295M
€ 69M
€ 242M
€ 176M
€ 228M
€ 324M
€ 48M
€ 147M€ 114M
€ 217M
€ 367M
24 43 45
87 98 104 132
147
201 185
34
83
129
172 154
42 56
43 39
113
36 61 68 73
96
37 49
31 29
62
2012 2013 2014 2015 2016 2012 2013 2014 2015 2016 2012 2013 2014 2015 2016 2012 2013 2014 2015 2016 2012 2013 2014 2015 2016 2012 2013 2014 2015 2016
Switzerland Spain Netherlands Russia Finland Ireland
€ 78M€ 97M
€ 131M
€ 321M
€ 141M
€ 29M € 31M
€ 60M
€ 210M
€ 244M
€ 66M € 66M € 67M
€ 98M
€ 162M
€ 6M€ 24M € 26M
€ 83M
€ 156M
€ 7M€ 24M € 20M
€ 99M€ 81M
€ 3M € 6M € 10M€ 29M
€ 44M
28 32 35
65
112
17 17 29
56 72
39
75 81 76 95
2 14 12
24
61
18 12 13 20 26 7 7 9 20 27
2012 2013 2014 2015 2016 2012 2013 2014 2015 2016 2012 2013 2014 2015 2016 2012 2013 2014 2015 2016 2012 2013 2014 2015 2016 2012 2013 2014 2015 2016
Denmark Belgium Italy Norway Austria Portugal
Amount raised (€ billion) Number of rounds
€ 1.1B
€ 1.6B
€ 2.4B
€ 3.4B
€ 4.0B
452
725 760
1,021
1,289
2012 2013 2014 2015 2016
Other
Rest of Europe
1. Introduction: headline stats in Europe
2. Insights: understanding the key trends and drivers
3. Top verticals and business models
4. Investment sources trends
5. Overviews of top countries
6. Outtakes: additional data
Contents
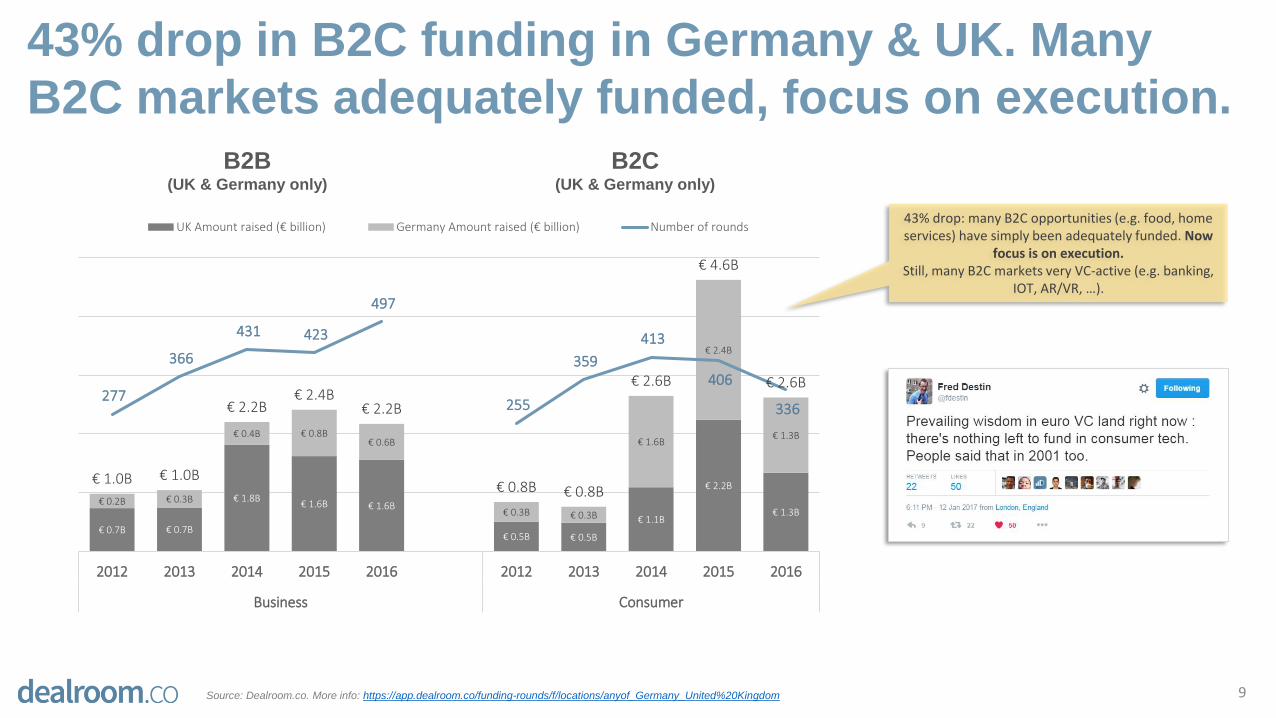
43% drop in B2C funding in Germany & UK. Many
B2C markets adequately funded, focus on execution.
9Source: Dealroom.co. More info: https://app.dealroom.co/funding-rounds/f/locations/anyof_Germany_United%20Kingdom
B2C (UK & Germany only)
B2B (UK & Germany only)
€ 0.7B € 0.7B
€ 1.8B€ 1.6B € 1.6B
€ 0.5B € 0.5B
€ 1.1B
€ 2.2B
€ 1.3B€ 0.2B € 0.3B
€ 0.4B € 0.8B€ 0.6B
€ 0.3B € 0.3B
€ 1.6B
€ 2.4B
€ 1.3B
€ 1.0B € 1.0B
€ 2.2B€ 2.4B
€ 2.2B
€ 0.8B € 0.8B
€ 2.6B
€ 4.6B
€ 2.6B277
366
431 423
497
255
359
413
406
336
2012 2013 2014 2015 2016 2012 2013 2014 2015 2016
Business Consumer
UK Amount raised (€ billion) Germany Amount raised (€ billion) Number of rounds43% drop: many B2C opportunities (e.g. food, home services) have simply been adequately funded. Now
focus is on execution. Still, many B2C markets very VC-active (e.g. banking,
IOT, AR/VR, …).
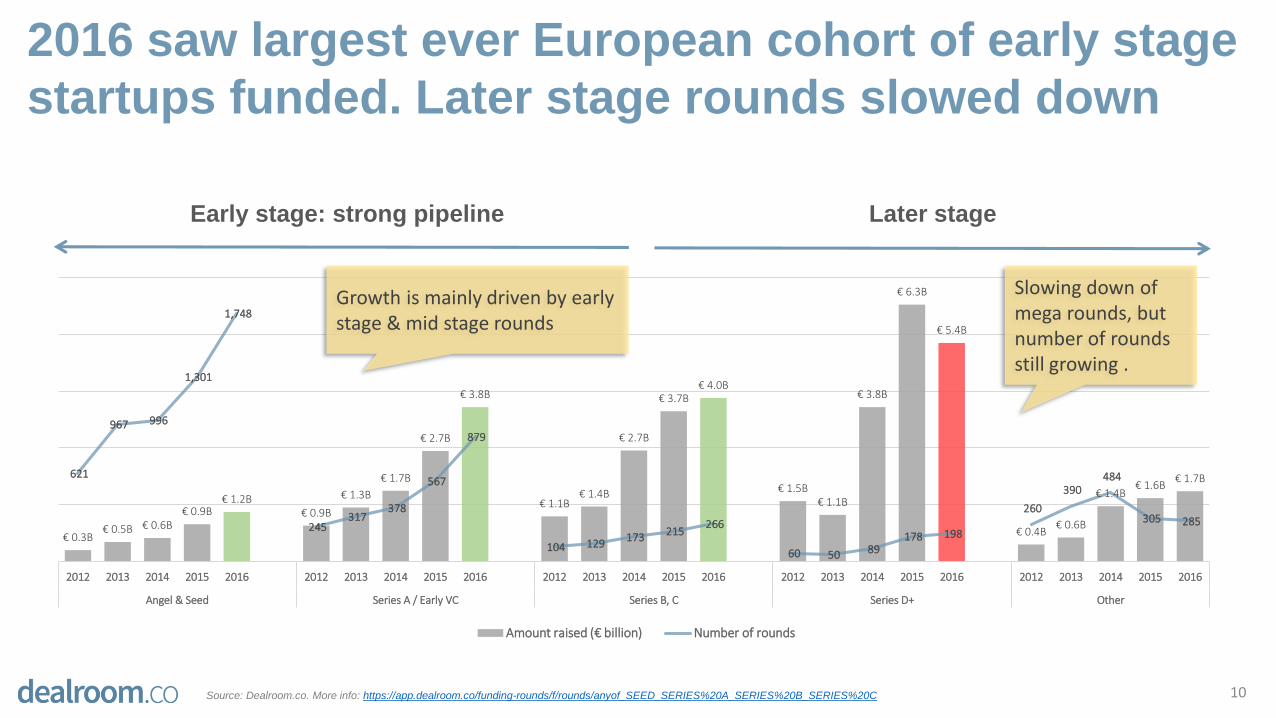
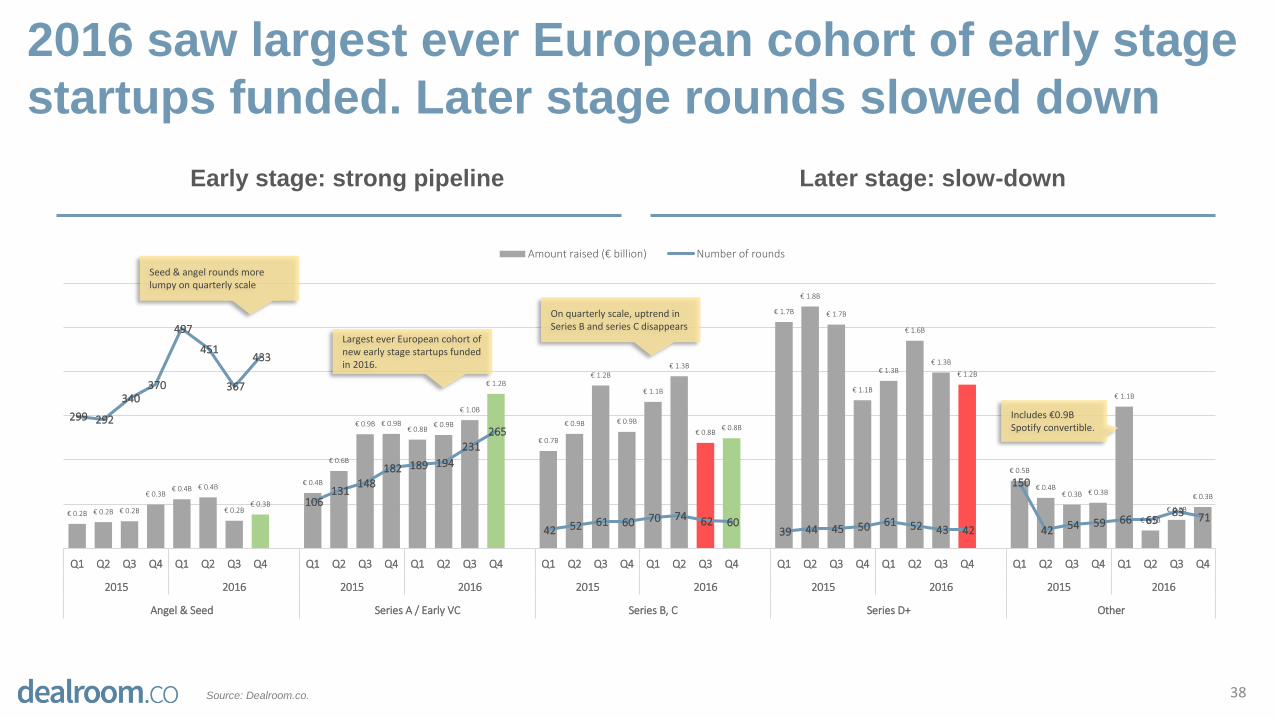
2016 saw largest ever European cohort of early stage
startups funded. Later stage rounds slowed down
10
€ 0.3B€ 0.5B € 0.6B
€ 0.9B€ 1.2B
€ 0.9B
€ 1.3B
€ 1.7B
€ 2.7B
€ 3.8B
€ 1.1B€ 1.4B
€ 2.7B
€ 3.7B€ 4.0B
€ 1.5B€ 1.1B
€ 3.8B
€ 6.3B
€ 5.4B
€ 0.4B€ 0.6B
€ 1.4B€ 1.6B
€ 1.7B621
967 996
1,301
1,748
245 317
378
567
879
104 129 173 215
266
60 50 89 178 198
260
390 484
305 285
2012 2013 2014 2015 2016 2012 2013 2014 2015 2016 2012 2013 2014 2015 2016 2012 2013 2014 2015 2016 2012 2013 2014 2015 2016
Angel & Seed Series A / Early VC Series B, C Series D+ Other
Amount raised (€ billion) Number of rounds
Early stage: strong pipeline Later stage
Source: Dealroom.co. More info: https://app.dealroom.co/funding-rounds/f/rounds/anyof_SEED_SERIES%20A_SERIES%20B_SERIES%20C
Growth is mainly driven by early stage & mid stage rounds
Slowing down of mega rounds, but number of rounds still growing .
31%
16%
9% 5%
21%
8%
–
10%
20%
30%
40%
50%
60%
70%
80%
90%
100%
Seed Series A Series B Series C Series D
2009 cohort 2010 cohort 2011 cohort 2012 cohort 2013 cohort% of startups reaching next funding round
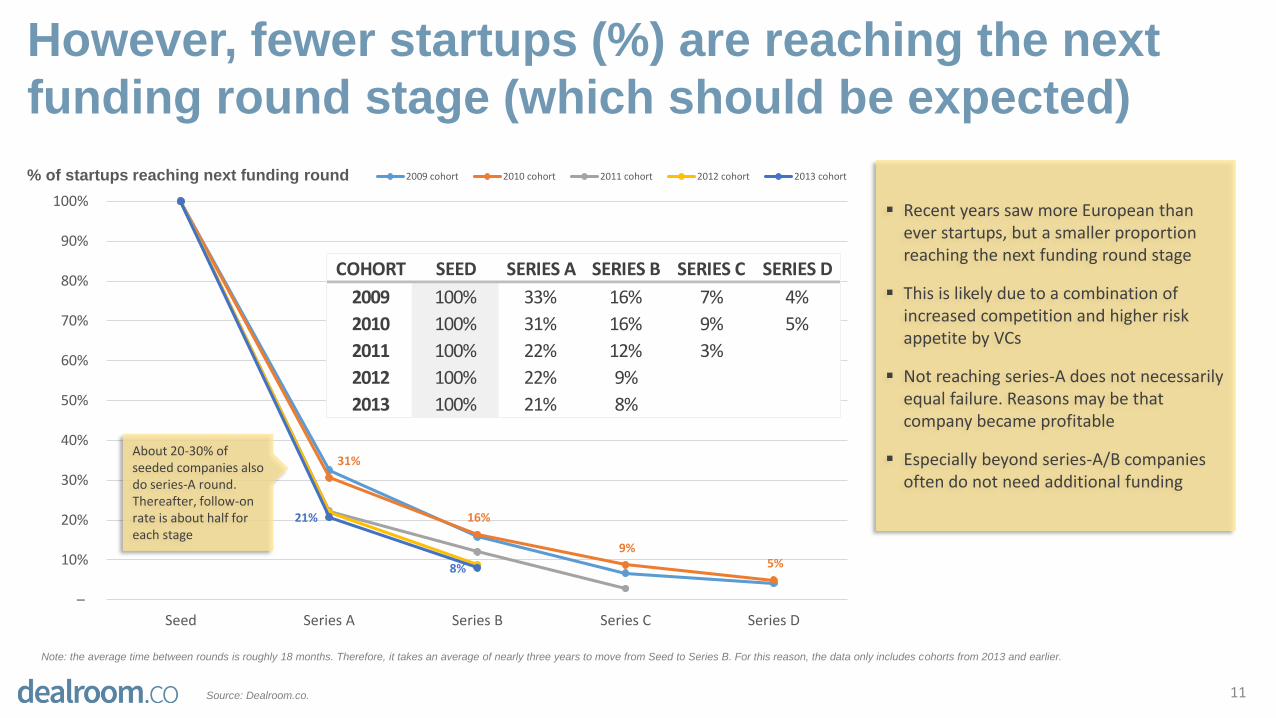
However, fewer startups (%) are reaching the next
funding round stage (which should be expected)
Note: the average time between rounds is roughly 18 months. Therefore, it takes an average of nearly three years to move from Seed to Series B. For this reason, the data only includes cohorts from 2013 and earlier.
COHORT SEED SERIES A SERIES B SERIES C SERIES D
2009 100% 33% 16% 7% 4%
2010 100% 31% 16% 9% 5%
2011 100% 22% 12% 3%
2012 100% 22% 9%
2013 100% 21% 8%
Recent years saw more European than ever startups, but a smaller proportion reaching the next funding round stage
This is likely due to a combination of increased competition and higher risk appetite by VCs
Not reaching series-A does not necessarily equal failure. Reasons may be that company became profitable
Especially beyond series-A/B companies often do not need additional funding
About 20-30% of seeded companies also do series-A round. Thereafter, follow-on rate is about half for each stage
11Source: Dealroom.co.
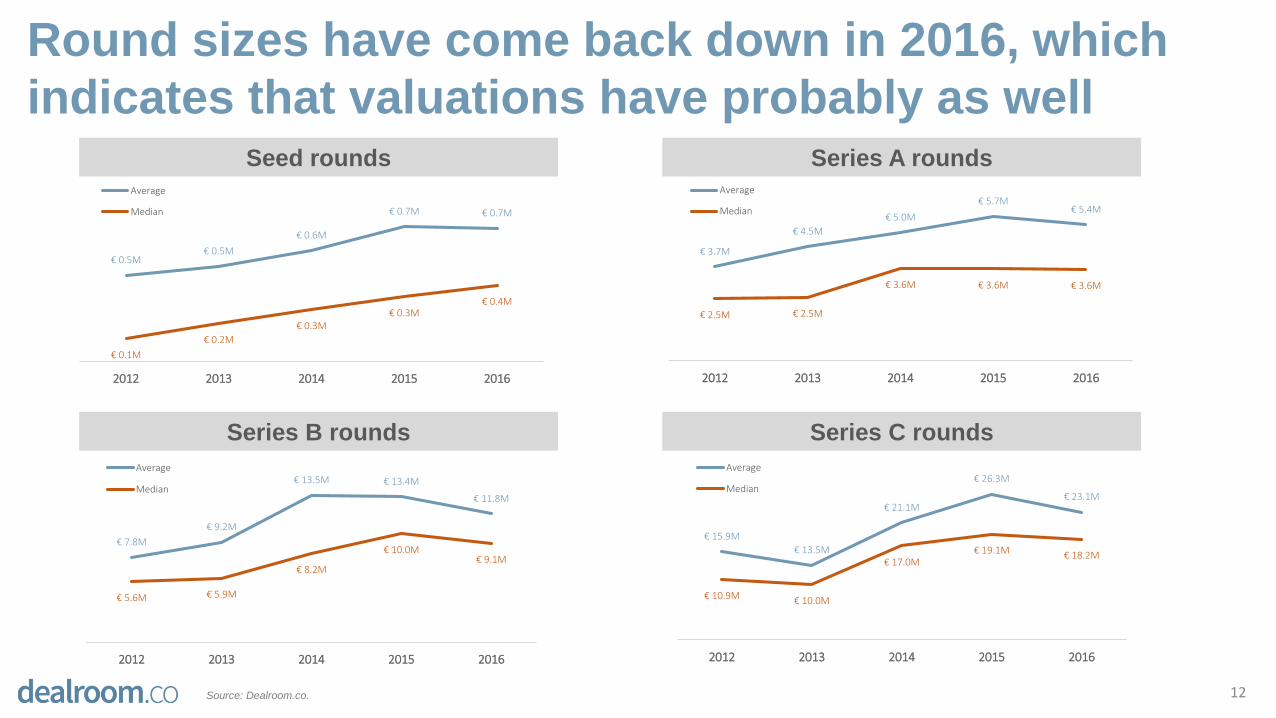
Round sizes have come back down in 2016, which
indicates that valuations have probably as well
12Source: Dealroom.co.
€ 0.5M€ 0.5M
€ 0.6M
€ 0.7M € 0.7M
€ 0.1M
€ 0.2M
€ 0.3M€ 0.3M
€ 0.4M
2012 2013 2014 2015 2016
Average
Median
Series C rounds
Seed rounds Series A rounds
€ 3.7M
€ 4.5M
€ 5.0M
€ 5.7M€ 5.4M
€ 2.5M € 2.5M
€ 3.6M € 3.6M € 3.6M
2012 2013 2014 2015 2016
Average
Median
€ 7.8M
€ 9.2M
€ 13.5M € 13.4M
€ 11.8M
€ 5.6M € 5.9M
€ 8.2M
€ 10.0M€ 9.1M
2012 2013 2014 2015 2016
Average
Median
€ 15.9M
€ 13.5M
€ 21.1M
€ 26.3M
€ 23.1M
€ 10.9M € 10.0M
€ 17.0M€ 19.1M € 18.2M
2012 2013 2014 2015 2016
Average
Median
Series B rounds
1. Introduction: headline stats in Europe
2. Insights: understanding the key trends and drivers
3. Top verticals and business models
4. Investment sources trends
5. Overviews of top countries
6. Outtakes: additional data
Contents
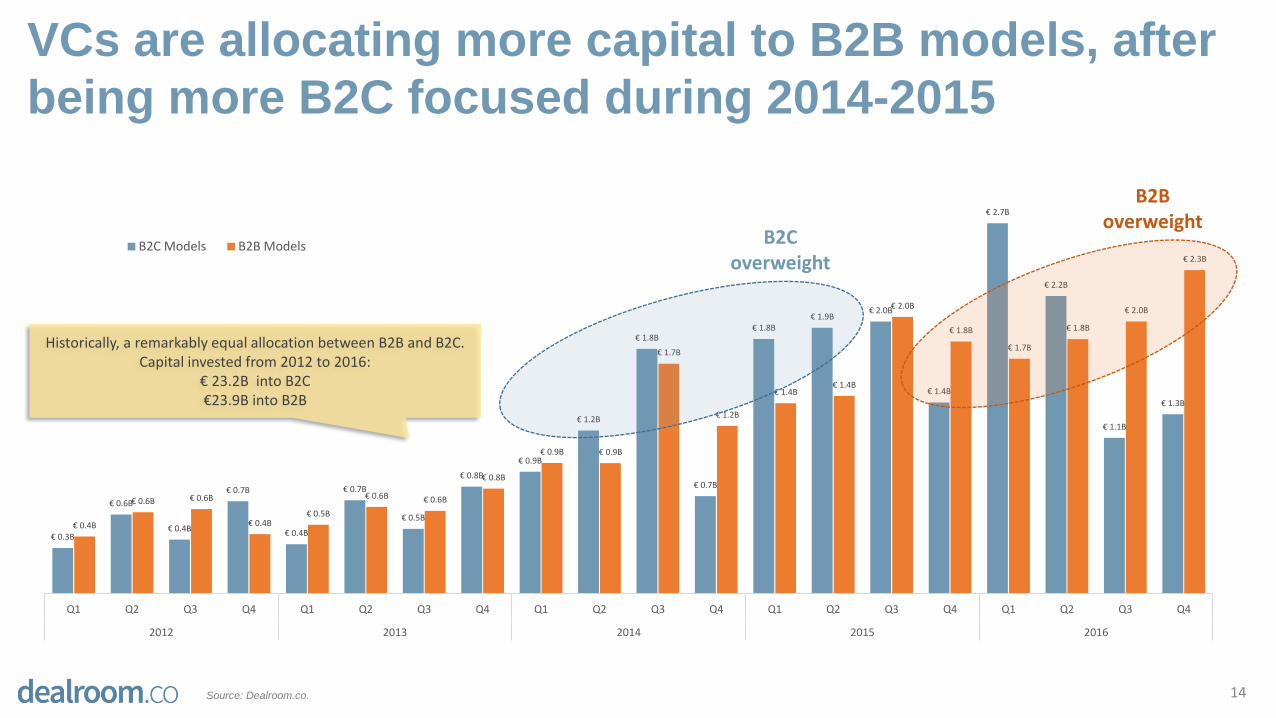
VCs are allocating more capital to B2B models, after
being more B2C focused during 2014-2015
14Source: Dealroom.co.
€ 0.3B
€ 0.6B
€ 0.4B
€ 0.7B
€ 0.4B
€ 0.7B
€ 0.5B
€ 0.8B
€ 0.9B
€ 1.2B
€ 1.8B
€ 0.7B
€ 1.8B€ 1.9B
€ 2.0B
€ 1.4B
€ 2.7B
€ 2.2B
€ 1.1B
€ 1.3B
€ 0.4B
€ 0.6B € 0.6B
€ 0.4B€ 0.5B
€ 0.6B € 0.6B
€ 0.8B
€ 0.9B € 0.9B
€ 1.7B
€ 1.2B
€ 1.4B€ 1.4B
€ 2.0B
€ 1.8B
€ 1.7B
€ 1.8B
€ 2.0B
€ 2.3B
Q1 Q2 Q3 Q4 Q1 Q2 Q3 Q4 Q1 Q2 Q3 Q4 Q1 Q2 Q3 Q4 Q1 Q2 Q3 Q4
2012 2013 2014 2015 2016
B2C Models B2B Models
Historically, a remarkably equal allocation between B2B and B2C. Capital invested from 2012 to 2016:
€ 23.2B into B2C€23.9B into B2B
B2C overweight
B2B overweight
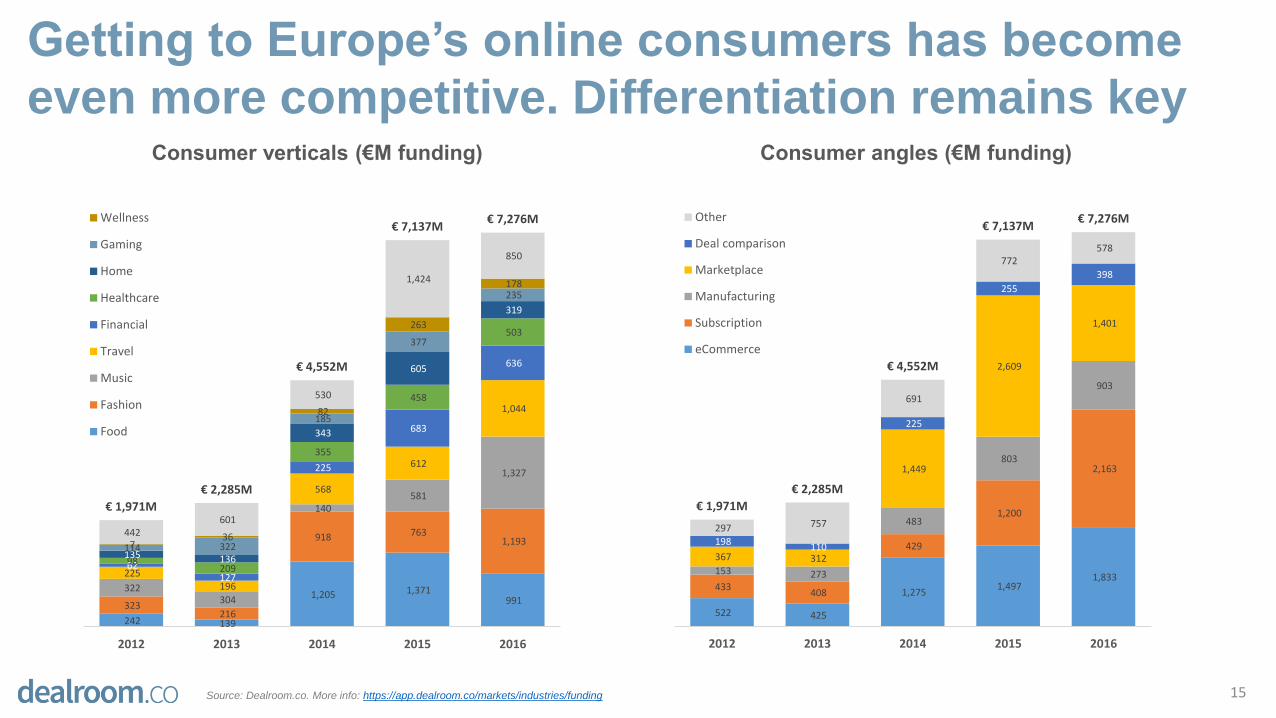
Getting to Europe’s online consumers has become
even more competitive. Differentiation remains key
15Source: Dealroom.co. More info: https://app.dealroom.co/markets/industries/funding
Consumer verticals (€M funding) Consumer angles (€M funding)
522 425
1,275 1,497
1,833 433
408
429
1,200
2,163
153 273
483
803
903
367 312
1,449
2,609
1,401
198 110
225
255
398
297 757
691
772 578
€ 1,971M
€ 2,285M
€ 4,552M
€ 7,137M€ 7,276M
2012 2013 2014 2015 2016
Other
Deal comparison
Marketplace
Manufacturing
Subscription
eCommerce
242 139
1,205 1,371 991 323
216
918 763 1,193
322 304
140 581
1,327
225 196
568
612
1,044
62 127
225
683
636
98 209
355
458
503
135 136
343
605
319
114 322
185
377
235
7 36
82
263
178
442 601
530
1,424
850
€ 1,971M
€ 2,285M
€ 4,552M
€ 7,137M€ 7,276M
2012 2013 2014 2015 2016
Wellness
Gaming
Home
Healthcare
Financial
Travel
Music
Fashion
Food
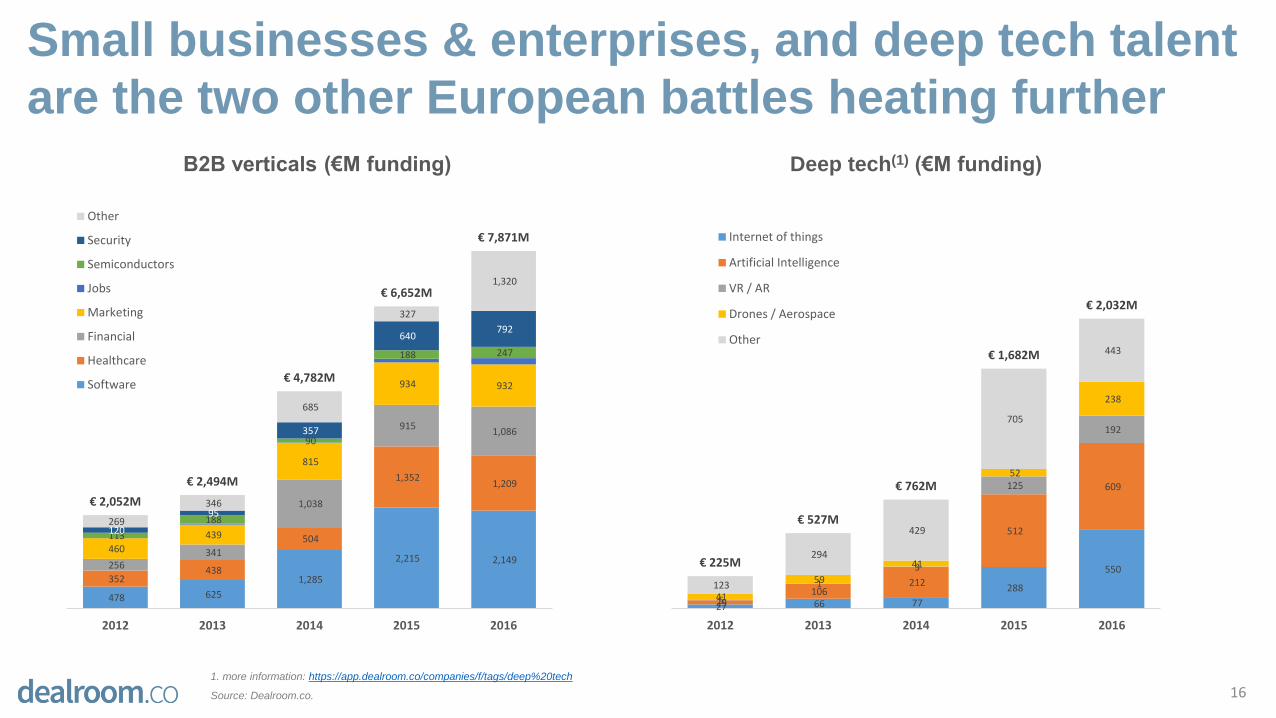
Small businesses & enterprises, and deep tech talent
are the two other European battles heating further
161. more information: https://app.dealroom.co/companies/f/tags/deep%20tech
Source: Dealroom.co.
B2B verticals (€M funding) Deep tech(1) (€M funding)
478 625
1,285
2,215 2,149
352 438
504
1,352 1,209
256 341
1,038
915 1,086
460
439
815
934 932
113
188
90
188 247
120
95
357
640 792
269
346
685
327
1,320
€ 2,052M
€ 2,494M
€ 4,782M
€ 6,652M
€ 7,871M
2012 2013 2014 2015 2016
Other
Security
Semiconductors
Jobs
Marketing
Financial
Healthcare
Software
27 66 77
288
550
29 106
212
512
609
5
1
3
125
192
41
59
41
52
238
123
294
429
705
443
€ 225M
€ 527M
€ 762M
€ 1,682M
€ 2,032M
2012 2013 2014 2015 2016
Internet of things
Artificial Intelligence
VR / AR
Drones / Aerospace
Other
Europe’s high-growth industries: funding heatmap
17Source: Dealroom.co. More info https://app.dealroom.co/markets/cities/funding
Capital invested (€ millions) Number of rounds Capital invested 2012-2016 (€ millions)Market vertical 2012 2013 2014 2015 2016 TOTAL 2016 Q1 2016 Q2 2016 Q3 2016 Q4 2012 2013 2014 2015 2016 TOTAL 2016 Q1 2016 Q2 2016 Q3 2016 Q4
Enterprise software 522 650 1,335 2,261 2,207 6,974 654 587 432 534 Enterprise software 213 326 429 515 653 2,136 219 155 144 135
Financial 341 490 1,396 1,741 1,995 5,963 566 504 373 552 Financial 124 179 256 293 426 1,278 125 100 95 106
Healthcare 483 655 1,013 1,869 1,842 5,862 223 639 355 625 Healthcare 72 115 123 207 330 847 65 95 70 100
Food 242 144 1,222 1,391 1,048 4,048 396 130 351 171 Food 41 66 104 109 163 483 49 40 36 38
Music 323 306 143 608 1,340 2,719 1,053 147 28 112 Music 33 48 29 44 44 198 13 11 9 11
Fashion 323 219 925 783 1,224 3,474 356 578 187 103 Fashion 64 104 109 120 147 544 30 37 41 39
Transportation 199 187 530 843 1,373 3,132 166 568 224 414 Transportation 41 66 121 164 248 640 65 55 65 63
Travel 240 206 627 673 1,132 2,878 291 498 104 239 Travel 84 103 127 139 173 626 54 45 34 40
Security 127 127 411 674 918 2,257 237 320 281 80 Security 41 53 69 100 132 395 35 42 33 22
Energy 23 31 381 275 513 1,222 97 113 123 180 Energy 11 26 20 32 106 195 29 21 23 33
Home 152 152 364 642 553 1,862 195 98 103 156 Home 32 45 55 79 116 327 26 30 23 37
Hosting 51 54 92 28 322 547 – – 300 22 Hosting 9 9 9 6 12 45 1 – 6 5
Jobs / recruitment 12 41 48 153 285 539 80 81 61 62 Jobs / recruitment 26 33 39 67 115 280 24 34 29 28
Gaming 119 343 214 411 266 1,353 104 46 69 48 Gaming 47 68 44 67 92 318 19 23 29 21
Education 38 58 193 179 253 721 137 49 30 37 Education 39 69 57 76 98 339 27 27 18 26
Real estate 152 58 111 117 229 667 121 55 41 12 Real estate 17 16 40 51 73 197 22 26 17 8
Wellness 7 57 111 419 195 788 50 49 56 40 Wellness 15 37 50 74 55 231 14 17 17 7
Sports 54 51 152 489 190 936 96 39 32 24 Sports 17 26 32 51 93 219 33 26 25 9
Events 22 42 99 119 65 348 7 5 24 29 Events 21 32 32 30 49 164 10 14 10 15
Dating 0 0 9 31 8 48 3 5 – – Dating 1 7 6 9 4 27 3 1 – –
Horizontals & other (overlap) 755 1,036 696 677 220 (205) (273) 339 359 Horizontals & other (overlap) 342 425 369 333 247 20 37 62 128
TOTAL 4,184 4,906 10,072 14,382 16,177 4,627 4,238 3,513 3,799 TOTAL 1,290 1,853 2,120 2,566 3,376 883 836 786 871
Angle / problem solve 2012 2013 2014 2015 2016 TOTAL 2016 Q1 2016 Q2 2016 Q3 2016 Q4 2012 2013 2014 2015 2016 TOTAL 2016 Q1 2016 Q2 2016 Q3 2016 Q4
Enterprise software 522 650 1,335 2,261 2,207 6,974 654 587 432 534 Enterprise software 213 326 429 515 653 2,136 219 155 144 135
Deep tech 225 527 762 1,682 2,032 5,228 757 439 322 513 Deep tech 76 169 238 362 398 1,243 113 107 87 91
Marketplace 397 380 1,646 2,973 1,842 7,238 267 749 579 247 Marketplace 116 172 245 279 389 1,201 91 115 107 76
Marketing 466 460 833 962 1,051 3,772 303 205 317 227 Marketing 139 183 220 258 345 1,145 91 75 91 88
Internet of things 57 91 111 498 862 1,619 139 246 43 434 Internet of things 14 37 82 127 186 446 42 54 29 61
Content 287 432 349 695 668 2,430 127 124 188 230 Content 124 177 174 199 235 909 61 67 49 58
Deal comparison 204 126 254 360 505 1,448 293 100 77 36 Deal comparison 50 75 72 80 93 370 25 24 25 19
Directories 201 113 856 1,307 451 2,928 17 56 293 85 Directories 39 47 73 63 84 306 16 22 18 28
Semiconductors 113 188 90 188 258 837 44 42 90 82 Semiconductors 12 20 13 24 34 103 6 9 9 10
Consumer productivity 13 66 145 67 225 516 75 69 66 15 Consumer productivity 14 29 53 65 86 247 19 34 25 8
Other (overlap) 1,699 1,874 3,692 3,389 6,077 1,952 1,622 1,106 1,397 Other (overlap) 493 618 521 594 873 200 174 202 297
TOTAL 4,184 4,906 10,072 14,382 16,177 4,627 4,238 3,513 3,799 TOTAL 1,290 1,853 2,120 2,566 3,376 883 836 786 871
Revenue source 2012 2013 2014 2015 2016 TOTAL 2016 Q1 2016 Q2 2016 Q3 2016 Q4 2012 2013 2014 2015 2016 TOTAL 2016 Q1 2016 Q2 2016 Q3 2016 Q4
Subscription 1,302 1,681 3,228 4,871 5,761 16,843 2,516 1,192 1,146 907 Subscription 461 667 813 986 1,050 3,977 322 280 210 238
Commission 1,116 869 3,366 4,492 3,632 13,476 904 1,254 840 635 Commission 295 400 558 571 733 2,557 209 226 142 156
Manufacturing 709 1,058 1,728 2,709 3,049 9,254 521 913 497 1,118 Manufacturing 113 199 226 348 518 1,404 120 128 112 158
eCommerce 538 447 1,307 1,569 2,170 6,030 697 855 353 264 eCommerce 136 210 208 250 344 1,148 110 99 72 63
Freemium 606 827 594 1,280 1,795 5,102 1,318 196 185 96 Freemium 138 184 212 254 175 963 63 42 39 31
Classified listing 176 157 349 766 379 1,827 75 214 58 32 Classified listing 36 59 84 101 74 354 23 26 14 11
Advertising 178 224 290 339 174 1,206 31 73 40 30 Advertising 79 109 96 95 84 463 31 24 17 12
Other (overlap) (443) (358) (789) (1,645) (783) (1,435) (458) 393 718 Other (overlap) 32 25 (77) (39) 398 5 11 180 202
TOTAL 4,184 4,906 10,072 14,382 16,177 4,627 4,238 3,513 3,799 TOTAL 1,290 1,853 2,120 2,566 3,376 883 836 786 871
End-user focus 2012 2013 2014 2015 2016 TOTAL 2016 Q1 2016 Q2 2016 Q3 2016 Q4 2012 2013 2014 2015 2016 TOTAL 2016 Q1 2016 Q2 2016 Q3 2016 Q4
Consumer 1,971 2,285 4,552 7,137 7,276 23,221 2,686 2,159 1,130 1,301 Consumer 573 840 906 1,070 1,295 4,684 346 361 277 311
Business 2,052 2,494 4,782 6,652 7,871 23,851 1,704 1,847 1,974 2,347 Business 622 877 1,010 1,272 1,762 5,543 469 405 415 473
Other 161 127 738 593 1,030 237 232 409 152 Other 95 136 204 224 319 68 70 94 87
TOTAL 4,184 4,906 10,072 14,382 16,177 4,627 4,238 3,513 3,799 TOTAL 1,290 1,853 2,120 2,566 3,376 883 836 786 871
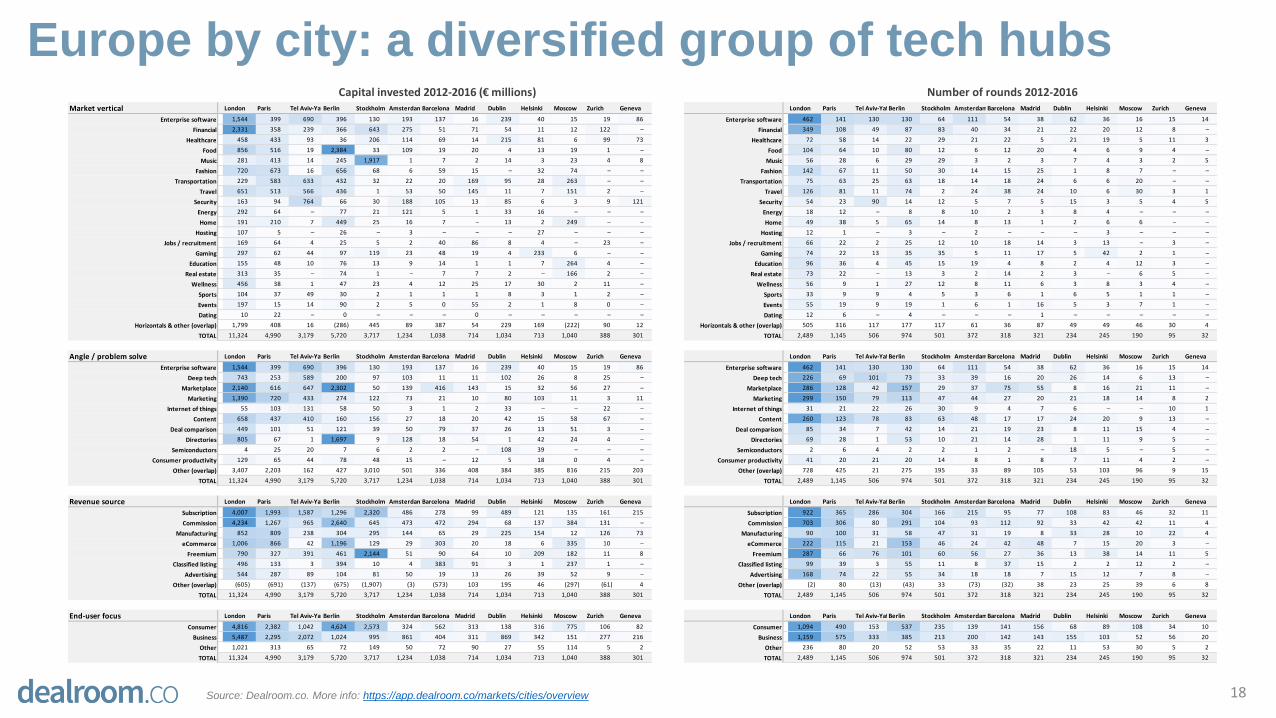
Europe by city: a diversified group of tech hubs
18Source: Dealroom.co. More info: https://app.dealroom.co/markets/cities/overview
Capital invested 2012-2016 (€ millions) Number of rounds 2012-2016Market vertical London Paris Tel Aviv-YafoBerlin Stockholm AmsterdamBarcelona Madrid Dublin Helsinki Moscow Zurich Geneva London Paris Tel Aviv-YafoBerlin Stockholm AmsterdamBarcelona Madrid Dublin Helsinki Moscow Zurich Geneva
Enterprise software 1,544 399 690 396 130 193 137 16 239 40 15 19 86 Enterprise software 462 141 130 130 64 111 54 38 62 36 16 15 14
Financial 2,331 358 239 366 643 275 51 71 54 11 12 122 – Financial 349 108 49 87 83 40 34 21 22 20 12 8 –
Healthcare 458 433 93 36 206 114 69 14 215 81 6 99 73 Healthcare 72 58 14 22 29 21 22 5 21 19 5 11 3
Food 856 516 19 2,384 33 109 19 20 4 13 19 1 – Food 104 64 10 80 12 6 12 20 4 6 9 4 –
Music 281 413 14 245 1,917 1 7 2 14 3 23 4 8 Music 56 28 6 29 29 3 2 3 7 4 3 2 5
Fashion 720 673 16 656 68 6 59 15 – 32 74 – – Fashion 142 67 11 50 30 14 15 25 1 8 7 – –
Transportation 229 583 633 432 32 22 20 169 95 28 263 – – Transportation 75 63 25 63 18 14 18 24 6 6 20 – –
Travel 651 513 566 436 1 53 50 145 11 7 151 2 – Travel 126 81 11 74 2 24 38 24 10 6 30 3 1
Security 163 94 764 66 30 188 105 13 85 6 3 9 121 Security 54 23 90 14 12 5 7 5 15 3 5 4 5
Energy 292 64 – 77 21 121 5 1 33 16 – – – Energy 18 12 – 8 8 10 2 3 8 4 – – –
Home 191 210 7 449 25 16 7 – 13 2 249 – – Home 49 38 5 65 14 8 13 1 2 6 6 – –
Hosting 107 5 – 26 – 3 – – – 27 – – – Hosting 12 1 – 3 – 2 – – – 3 – – –
Jobs / recruitment 169 64 4 25 5 2 40 86 8 4 – 23 – Jobs / recruitment 66 22 2 25 12 10 18 14 3 13 – 3 –
Gaming 297 62 44 97 119 23 48 19 4 233 6 – – Gaming 74 22 13 35 35 5 11 17 5 42 2 1 –
Education 155 48 10 76 13 9 14 1 1 7 264 4 – Education 96 36 4 45 15 19 4 8 2 4 12 3 –
Real estate 313 35 – 74 1 – 7 7 2 – 166 2 – Real estate 73 22 – 13 3 2 14 2 3 – 6 5 –
Wellness 456 38 1 47 23 4 12 25 17 30 2 11 – Wellness 56 9 1 27 12 8 11 6 3 8 3 4 –
Sports 104 37 49 30 2 1 1 1 8 3 1 2 – Sports 33 9 9 4 5 3 6 1 6 5 1 1 –
Events 197 15 14 90 2 5 0 55 2 1 8 0 – Events 55 19 9 19 1 6 1 16 5 3 7 1 –
Dating 10 22 – 0 – – – 0 – – – – – Dating 12 6 – 4 – – – 1 – – – – –
Horizontals & other (overlap) 1,799 408 16 (286) 445 89 387 54 229 169 (222) 90 12 Horizontals & other (overlap) 505 316 117 177 117 61 36 87 49 49 46 30 4
TOTAL 11,324 4,990 3,179 5,720 3,717 1,234 1,038 714 1,034 713 1,040 388 301 TOTAL 2,489 1,145 506 974 501 372 318 321 234 245 190 95 32
Angle / problem solve London Paris Tel Aviv-YafoBerlin Stockholm AmsterdamBarcelona Madrid Dublin Helsinki Moscow Zurich Geneva London Paris Tel Aviv-YafoBerlin Stockholm AmsterdamBarcelona Madrid Dublin Helsinki Moscow Zurich Geneva
Enterprise software 1,544 399 690 396 130 193 137 16 239 40 15 19 86 Enterprise software 462 141 130 130 64 111 54 38 62 36 16 15 14
Deep tech 743 253 589 200 97 103 11 11 102 26 8 25 – Deep tech 226 69 101 73 33 39 16 20 26 14 6 13 –
Marketplace 2,140 616 647 2,302 50 139 416 143 15 32 56 27 – Marketplace 286 128 42 157 29 37 75 55 8 16 21 11 –
Marketing 1,390 720 433 274 122 73 21 10 80 103 11 3 11 Marketing 299 150 79 113 47 44 27 20 21 18 14 8 2
Internet of things 55 103 131 58 50 3 1 2 33 – – 22 – Internet of things 31 21 22 26 30 9 4 7 6 – – 10 1
Content 658 437 410 160 156 27 18 20 42 15 58 67 – Content 260 123 78 83 63 48 17 17 24 20 9 13 –
Deal comparison 449 101 51 121 39 50 79 37 26 13 51 3 – Deal comparison 85 34 7 42 14 21 19 23 8 11 15 4 –
Directories 805 67 1 1,697 9 128 18 54 1 42 24 4 – Directories 69 28 1 53 10 21 14 28 1 11 9 5 –
Semiconductors 4 25 20 7 6 2 2 – 108 39 – – – Semiconductors 2 6 4 2 2 1 2 – 18 5 – 5 –
Consumer productivity 129 65 44 78 48 15 – 12 5 18 0 4 – Consumer productivity 41 20 21 20 14 8 1 8 7 11 4 2 –
Other (overlap) 3,407 2,203 162 427 3,010 501 336 408 384 385 816 215 203 Other (overlap) 728 425 21 275 195 33 89 105 53 103 96 9 15
TOTAL 11,324 4,990 3,179 5,720 3,717 1,234 1,038 714 1,034 713 1,040 388 301 TOTAL 2,489 1,145 506 974 501 372 318 321 234 245 190 95 32
Revenue source London Paris Tel Aviv-YafoBerlin Stockholm AmsterdamBarcelona Madrid Dublin Helsinki Moscow Zurich Geneva London Paris Tel Aviv-YafoBerlin Stockholm AmsterdamBarcelona Madrid Dublin Helsinki Moscow Zurich Geneva
Subscription 4,007 1,993 1,587 1,296 2,320 486 278 99 489 121 135 161 215 Subscription 922 365 286 304 166 215 95 77 108 83 46 32 11
Commission 4,234 1,267 965 2,640 645 473 472 294 68 137 384 131 – Commission 703 306 80 291 104 93 112 92 33 42 42 11 4
Manufacturing 852 809 238 304 295 144 65 29 225 154 12 126 73 Manufacturing 90 100 31 58 47 31 19 8 33 28 10 22 4
eCommerce 1,006 866 42 1,196 129 29 303 20 18 6 335 10 – eCommerce 222 115 21 153 46 24 42 48 7 15 20 3 –
Freemium 790 327 391 461 2,144 51 90 64 10 209 182 11 8 Freemium 287 66 76 101 60 56 27 36 13 38 14 11 5
Classified listing 496 133 3 394 10 4 383 91 3 1 237 1 – Classified listing 99 39 3 55 11 8 37 15 2 2 12 2 –
Advertising 544 287 89 104 81 50 19 13 26 39 52 9 – Advertising 168 74 22 55 34 18 18 7 15 12 7 8 –
Other (overlap) (605) (691) (137) (675) (1,907) (3) (573) 103 195 46 (297) (61) 4 Other (overlap) (2) 80 (13) (43) 33 (73) (32) 38 23 25 39 6 8
TOTAL 11,324 4,990 3,179 5,720 3,717 1,234 1,038 714 1,034 713 1,040 388 301 TOTAL 2,489 1,145 506 974 501 372 318 321 234 245 190 95 32
End-user focus London Paris Tel Aviv-YafoBerlin Stockholm AmsterdamBarcelona Madrid Dublin Helsinki Moscow Zurich Geneva London Paris Tel Aviv-YafoBerlin Stockholm AmsterdamBarcelona Madrid Dublin Helsinki Moscow Zurich Geneva
Consumer 4,816 2,382 1,042 4,624 2,573 324 562 313 138 316 775 106 82 Consumer 1,094 490 153 537 235 139 141 156 68 89 108 34 10
Business 5,487 2,295 2,072 1,024 995 861 404 311 869 342 151 277 216 Business 1,159 575 333 385 213 200 142 143 155 103 52 56 20
Other 1,021 313 65 72 149 50 72 90 27 55 114 5 2 Other 236 80 20 52 53 33 35 22 11 53 30 5 2
TOTAL 11,324 4,990 3,179 5,720 3,717 1,234 1,038 714 1,034 713 1,040 388 301 TOTAL 2,489 1,145 506 974 501 372 318 321 234 245 190 95 32
1. Introduction: headline stats in Europe
2. Insights: understanding the key trends and drivers
3. Top verticals and business models
4. Investment sources trends
5. Overviews of top countries
6. Outtakes: additional data
Contents
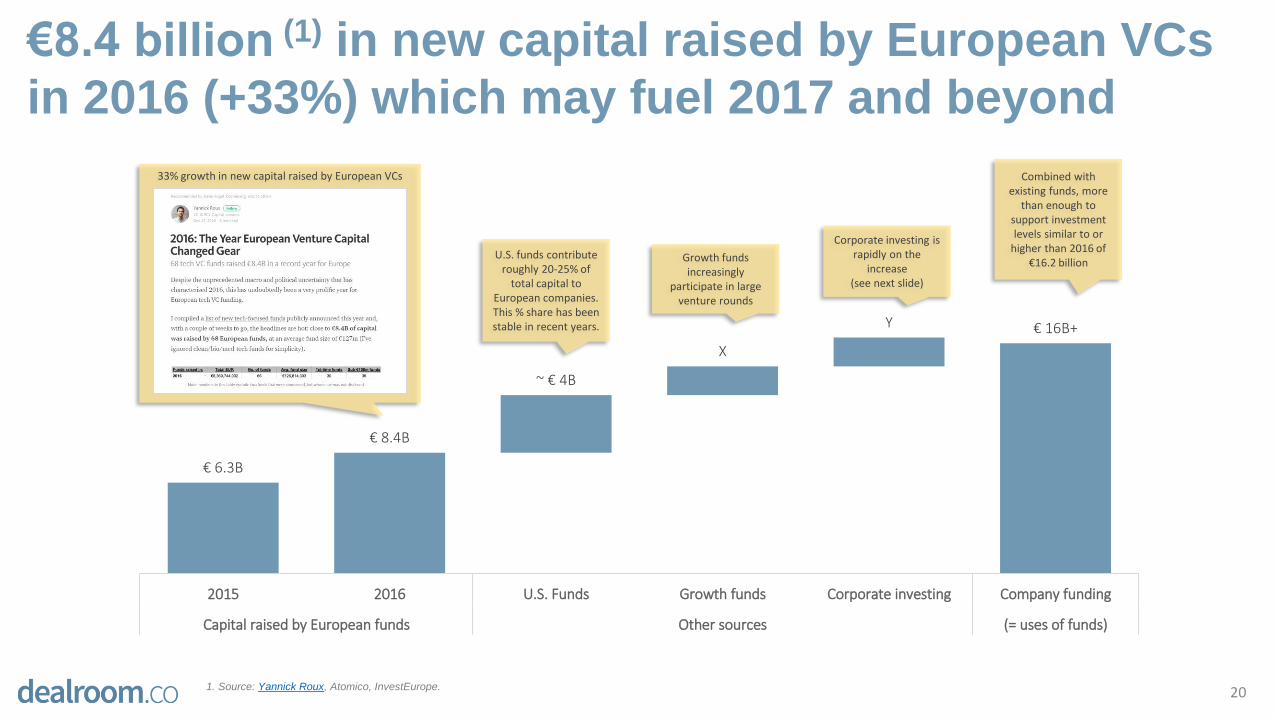
€ 6.3B
€ 8.4B
~ € 4B
X
Y € 16B+
2015 2016 U.S. Funds Growth funds Corporate investing Company funding
Capital raised by European funds Other sources (= uses of funds)
€8.4 billion (1) in new capital raised by European VCs
in 2016 (+33%) which may fuel 2017 and beyond
201. Source: Yannick Roux, Atomico, InvestEurope.
33% growth in new capital raised by European VCs
U.S. funds contribute roughly 20-25% of
total capital to European companies. This % share has been stable in recent years.
Growth funds increasingly
participate in large venture rounds
Corporate investing is rapidly on the
increase (see next slide)
Combined with existing funds, more
than enough to support investment levels similar to or
higher than 2016 of €16.2 billion
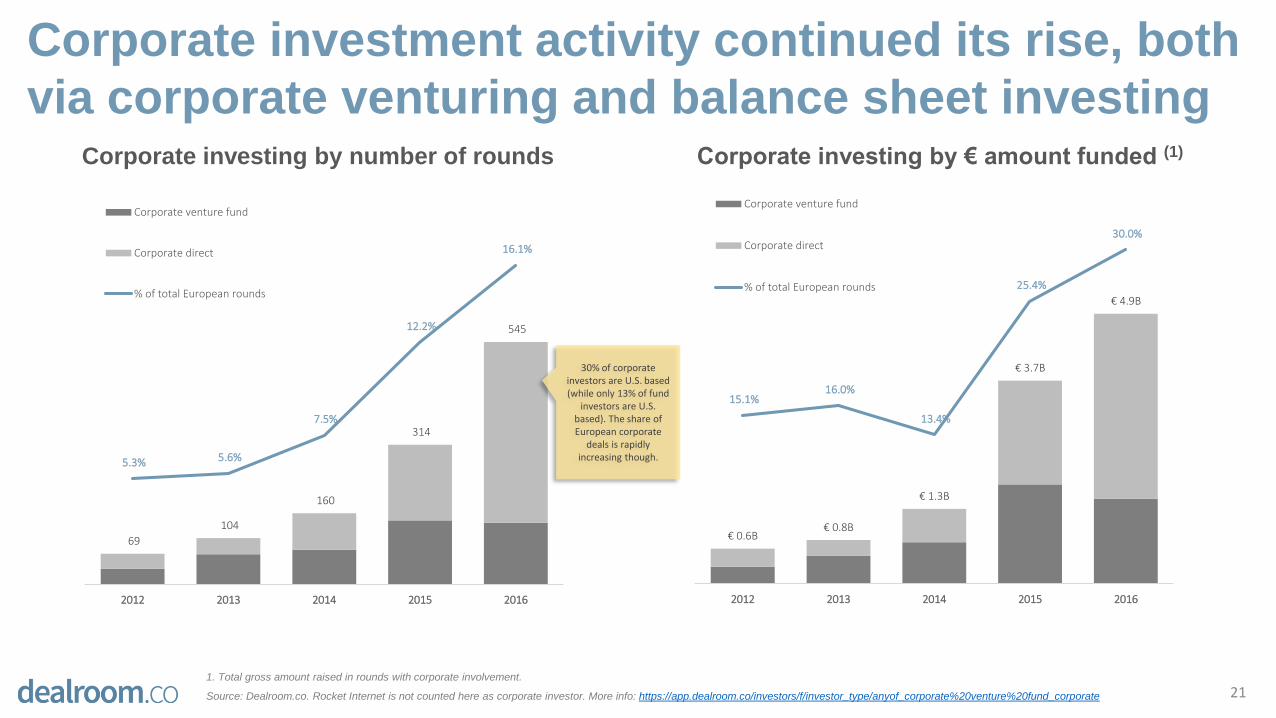
Corporate investment activity continued its rise, both
via corporate venturing and balance sheet investing
211. Total gross amount raised in rounds with corporate involvement.
Source: Dealroom.co. Rocket Internet is not counted here as corporate investor. More info: https://app.dealroom.co/investors/f/investor_type/anyof_corporate%20venture%20fund_corporate
Corporate investing by number of rounds Corporate investing by € amount funded (1)
69
104
160
314
545
5.3% 5.6%
7.5%
12.2%
16.1%
2012 2013 2014 2015 2016
Corporate venture fund
Corporate direct
% of total European rounds
€ 0.6B€ 0.8B
€ 1.3B
€ 3.7B
€ 4.9B
15.1% 16.0%
13.4%
25.4%
30.0%
2012 2013 2014 2015 2016
Corporate venture fund
Corporate direct
% of total European rounds
30% of corporate investors are U.S. based (while only 13% of fund
investors are U.S. based). The share of European corporate
deals is rapidly increasing though.
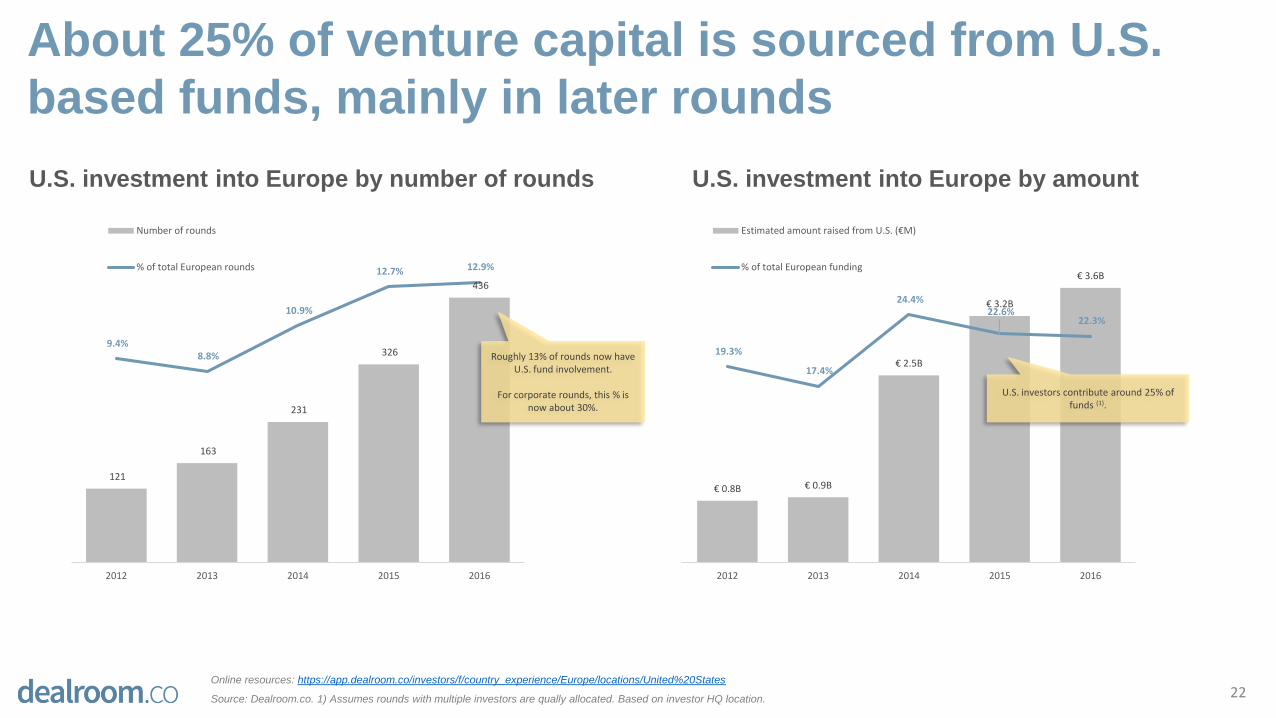
About 25% of venture capital is sourced from U.S.
based funds, mainly in later rounds
22Online resources: https://app.dealroom.co/investors/f/country_experience/Europe/locations/United%20States
Source: Dealroom.co. 1) Assumes rounds with multiple investors are qually allocated. Based on investor HQ location.
121
163
231
326
436
9.4% 8.8%
10.9%
12.7% 12.9%
2012 2013 2014 2015 2016
Number of rounds
% of total European rounds
U.S. investment into Europe by number of rounds U.S. investment into Europe by amount
€ 0.8B € 0.9B
€ 2.5B
€ 3.2B
€ 3.6B
19.3%
17.4%
24.4% 22.6%
22.3%
2012 2013 2014 2015 2016
Estimated amount raised from U.S. (€M)
% of total European funding
Roughly 13% of rounds now have U.S. fund involvement.
For corporate rounds, this % is now about 30%.
U.S. investors contribute around 25% of funds (1).
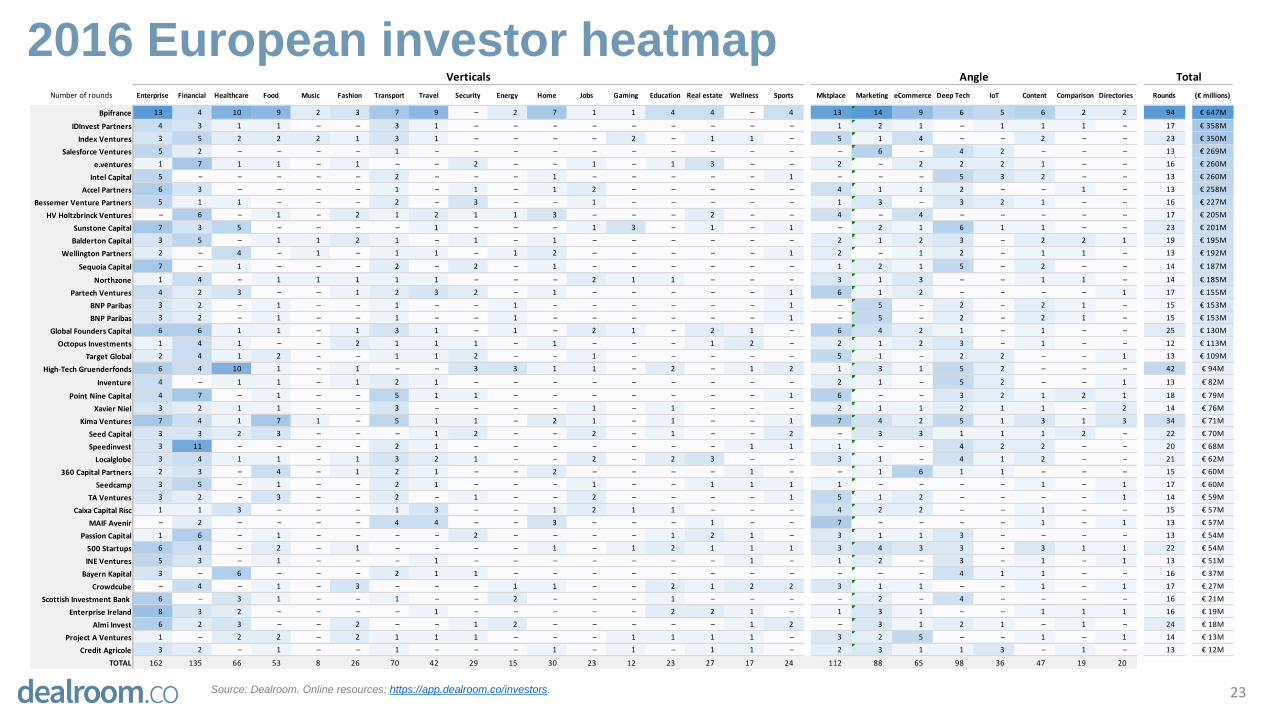
2016 European investor heatmap
23Source: Dealroom. Online resources: https://app.dealroom.co/investors.
Verticals Angle Total
Number of rounds Enterprise Financial Healthcare Food Music Fashion Transport Travel Security Energy Home Jobs Gaming Education Real estate Wellness Sports Mktplace Marketing eCommerce Deep Tech IoT Content Comparison Directories Rounds (€ millions)
Bpifrance 13 4 10 9 2 3 7 9 – 2 7 1 1 4 4 – 4 13 14 9 6 5 6 2 2 94 € 647M
IDInvest Partners 4 3 1 1 – – 3 1 – – – – – – – – – 1 2 1 – 1 1 1 – 17 € 358M
Index Ventures 3 5 2 2 2 1 3 1 – – – – 2 – 1 1 – 5 1 4 – – 2 – – 23 € 350M
Salesforce Ventures 5 2 – – – – 1 – – – – – – – – – – – 6 – 4 2 – – – 13 € 269M
e.ventures 1 7 1 1 – 1 – – 2 – – 1 – 1 3 – – 2 – 2 2 2 1 – – 16 € 260M
Intel Capital 5 – – – – – 2 – – – 1 – – – – – 1 – – – 5 3 2 – – 13 € 260M
Accel Partners 6 3 – – – – 1 – 1 – 1 2 – – – – – 4 1 1 2 – – 1 – 13 € 258M
Bessemer Venture Partners 5 1 1 – – – 2 – 3 – – 1 – – – – – 1 3 – 3 2 1 – – 16 € 227M
HV Holtzbrinck Ventures – 6 – 1 – 2 1 2 1 1 3 – – – 2 – – 4 – 4 – – – – – 17 € 205M
Sunstone Capital 7 3 5 – – – – 1 – – – 1 3 – 1 – 1 – 2 1 6 1 1 – – 23 € 201M
Balderton Capital 3 5 – 1 1 2 1 – 1 – 1 – – – – – – 2 1 2 3 – 2 2 1 19 € 195M
Wellington Partners 2 – 4 – 1 – 1 1 – 1 2 – – – – – 1 2 – 1 2 – 1 1 – 13 € 192M
Sequoia Capital 7 – 1 – – – 2 – 2 – 1 – – – – – – 1 2 1 5 – 2 – – 14 € 187M
Northzone 1 4 – 1 1 1 1 1 – – – 2 1 1 – – – 3 1 3 – – 1 1 – 14 € 185M
Partech Ventures 4 2 3 – – 1 2 3 2 – 1 – – – – – 1 6 1 2 – – – – 1 17 € 155M
BNP Paribas 3 2 – 1 – – 1 – – 1 – – – – – – 1 – 5 – 2 – 2 1 – 15 € 153M
BNP Paribas 3 2 – 1 – – 1 – – 1 – – – – – – 1 – 5 – 2 – 2 1 – 15 € 153M
Global Founders Capital 6 6 1 1 – 1 3 1 – 1 – 2 1 – 2 1 – 6 4 2 1 – 1 – – 25 € 130M
Octopus Investments 1 4 1 – – 2 1 1 1 – 1 – – – 1 2 – 2 1 2 3 – 1 – – 12 € 113M
Target Global 2 4 1 2 – – 1 1 2 – – 1 – – – – – 5 1 – 2 2 – – 1 13 € 109M
High-Tech Gruenderfonds 6 4 10 1 – 1 – – 3 3 1 1 – 2 – 1 2 1 3 1 5 2 – – – 42 € 94M
Inventure 4 – 1 1 – 1 2 1 – – – – – – – – – 2 1 – 5 2 – – 1 13 € 82M
Point Nine Capital 4 7 – 1 – – 5 1 1 – – – – – – – 1 6 – – 3 2 1 2 1 18 € 79M
Xavier Niel 3 2 1 1 – – 3 – – – – 1 – 1 – – – 2 1 1 2 1 1 – 2 14 € 76M
Kima Ventures 7 4 1 7 1 – 5 1 1 – 2 1 – 1 – – 1 7 4 2 5 1 3 1 3 34 € 71M
Seed Capital 3 3 2 3 – – – 1 2 – – 2 – 1 – – 2 – 3 3 1 1 1 2 – 22 € 70M
Speedinvest 3 11 – – – – 2 1 – – – – – – – 1 1 1 – – 4 2 2 – – 20 € 68M
Localglobe 3 4 1 1 – 1 3 2 1 – – 2 – 2 3 – – 3 1 – 4 1 2 – – 21 € 62M
360 Capital Partners 2 3 – 4 – 1 2 1 – – 2 – – – – 1 – – 1 6 1 1 – – – 15 € 60M
Seedcamp 3 5 – 1 – – 2 1 – – – 1 – – 1 1 1 1 – – – – 1 – 1 17 € 60M
TA Ventures 3 2 – 3 – – 2 – 1 – – 2 – – – – 1 5 1 2 – – – – 1 14 € 59M
Caixa Capital Risc 1 1 3 – – – 1 3 – – 1 2 1 1 – – – 4 2 2 – – 1 – – 15 € 57M
MAIF Avenir – 2 – – – – 4 4 – – 3 – – – 1 – – 7 – – – – 1 – 1 13 € 57M
Passion Capital 1 6 – 1 – – – – 2 – – – – 1 2 1 – 3 1 1 3 – – – – 13 € 54M
500 Startups 6 4 – 2 – 1 – – – – 1 – 1 2 1 1 1 3 4 3 3 – 3 1 1 22 € 54M
INE Ventures 5 3 – 1 – – – 1 – – – – – – – 1 – 1 2 – 3 – 1 – 1 13 € 51M
Bayern Kapital 3 – 6 – – – 2 1 1 – – – – – – – – – – – 4 1 1 – – 16 € 37M
Crowdcube – 4 – 1 – 3 – – – 1 1 – – 2 1 2 2 3 1 1 – – 1 – 1 17 € 27M
Scottish Investment Bank 6 – 3 1 – – 1 – – 2 – – – 1 – – – – 2 – 4 – – – – 16 € 21M
Enterprise Ireland 8 3 2 – – – – 1 – – – – – 2 2 1 – 1 3 1 – – 1 1 1 16 € 19M
Almi Invest 6 2 3 – – 2 – – 1 2 – – – – – 1 2 – 3 1 2 1 – 1 – 24 € 18M
Project A Ventures 1 – 2 2 – 2 1 1 1 – – – 1 1 1 1 – 3 2 5 – – 1 – 1 14 € 13M
Credit Agricole 3 2 – 1 – – 1 – – – 1 – 1 – 1 1 – 2 3 1 1 3 – 1 – 13 € 12M
TOTAL 162 135 66 53 8 26 70 42 29 15 30 23 12 23 27 17 24 112 88 65 98 36 47 19 20
1. Introduction: headline stats in Europe
2. Insights: understanding the key trends and drivers
3. Top verticals and business models
4. Investment sources trends
5. Overviews of top countries
6. Outtakes: additional data
Contents
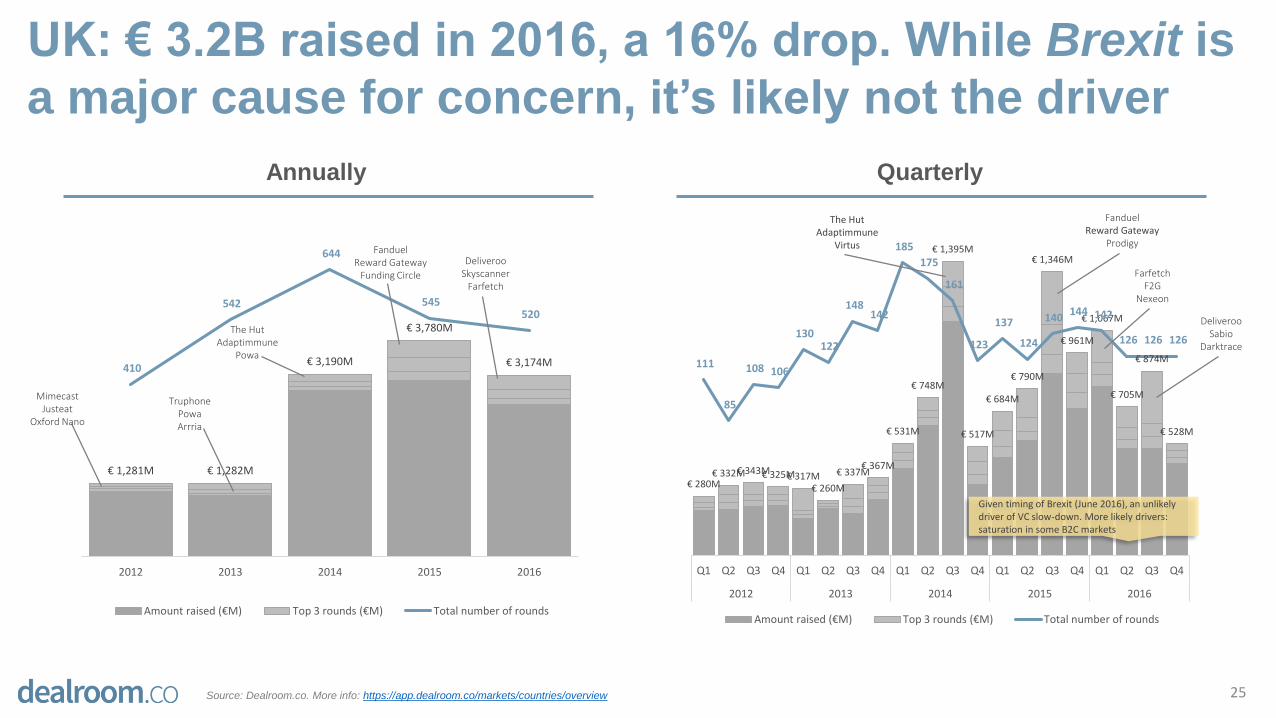
UK: € 3.2B raised in 2016, a 16% drop. While Brexit is
a major cause for concern, it’s likely not the driver
25Source: Dealroom.co. More info: https://app.dealroom.co/markets/countries/overview
€ 1,281M € 1,282M
€ 3,190M
€ 3,780M
€ 3,174M410
542
644
545 520
2012 2013 2014 2015 2016
Amount raised (€M) Top 3 rounds (€M) Total number of rounds
€ 280M€ 332M€ 343M€ 325M€ 317M
€ 260M
€ 337M€ 367M
€ 531M
€ 748M
€ 1,395M
€ 517M
€ 684M
€ 790M
€ 1,346M
€ 961M
€ 1,067M
€ 705M
€ 874M
€ 528M
111
85
108 106
130 122
148 142
185
175
161
123
137
124
140 144 142
126 126 126
Q1 Q2 Q3 Q4 Q1 Q2 Q3 Q4 Q1 Q2 Q3 Q4 Q1 Q2 Q3 Q4 Q1 Q2 Q3 Q4
2012 2013 2014 2015 2016
Amount raised (€M) Top 3 rounds (€M) Total number of rounds
QuarterlyAnnually
Given timing of Brexit (June 2016), an unlikely driver of VC slow-down. More likely drivers: saturation in some B2C markets
TruphonePowaArrria
MimecastJusteat
Oxford Nano
The HutAdaptimmune
Powa
FanduelReward Gateway
Funding Circle
DeliverooSkyscanner
Farfetch
FanduelReward Gateway
Prodigy
DeliverooSabio
Darktrace
FarfetchF2G
Nexeon
The HutAdaptimmune
Virtus
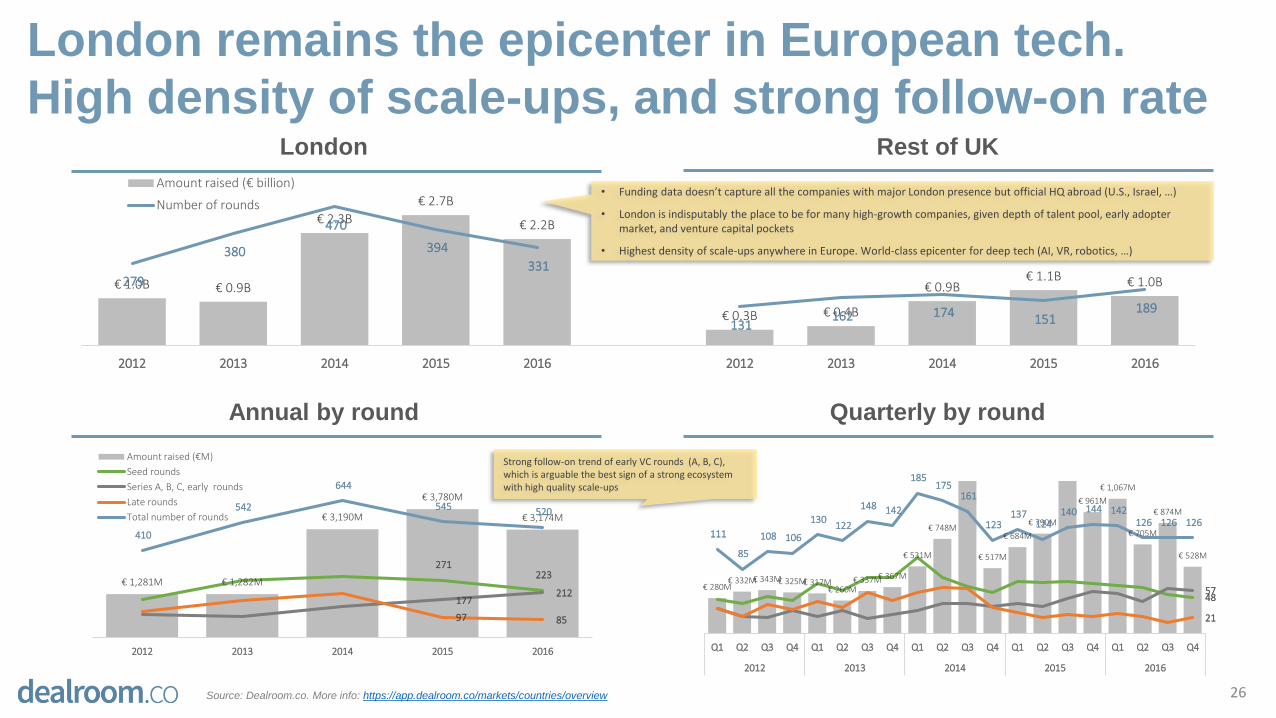
London remains the epicenter in European tech.
High density of scale-ups, and strong follow-on rate
26
Rest of UKLondon
Quarterly by roundAnnual by round
€ 280M€ 332M€ 343M€ 325M€ 317M
€ 260M€ 337M€ 367M
€ 531M
€ 748M
€ 517M
€ 684M
€ 790M
€ 961M
€ 1,067M
€ 705M
€ 874M
€ 528M
48 57
21
111
85
108 106
130 122
148 142
185 175
161
123 137
124 140 144 142
126 126 126
Q1 Q2 Q3 Q4 Q1 Q2 Q3 Q4 Q1 Q2 Q3 Q4 Q1 Q2 Q3 Q4 Q1 Q2 Q3 Q4
2012 2013 2014 2015 2016
€ 1,281M € 1,282M
€ 3,190M
€ 3,780M
€ 3,174M
271 223
177 212
97 85
410
542
644
545 520
2012 2013 2014 2015 2016
Amount raised (€M)
Seed rounds
Series A, B, C, early rounds
Late rounds
Total number of rounds
Strong follow-on trend of early VC rounds (A, B, C), which is arguable the best sign of a strong ecosystem with high quality scale-ups
€ 1.0B € 0.9B
€ 2.3B
€ 2.7B
€ 2.2B
€ 0.3B € 0.4B
€ 0.9B€ 1.1B € 1.0B279
380
470
394
331
131 162 174 151
189
2012 2013 2014 2015 2016 2012 2013 2014 2015 2016
Amount raised (€ billion)
Number of rounds• Funding data doesn’t capture all the companies with major London presence but official HQ abroad (U.S., Israel, …)
• London is indisputably the place to be for many high-growth companies, given depth of talent pool, early adopter market, and venture capital pockets
• Highest density of scale-ups anywhere in Europe. World-class epicenter for deep tech (AI, VR, robotics, …)
Source: Dealroom.co. More info: https://app.dealroom.co/markets/countries/overview
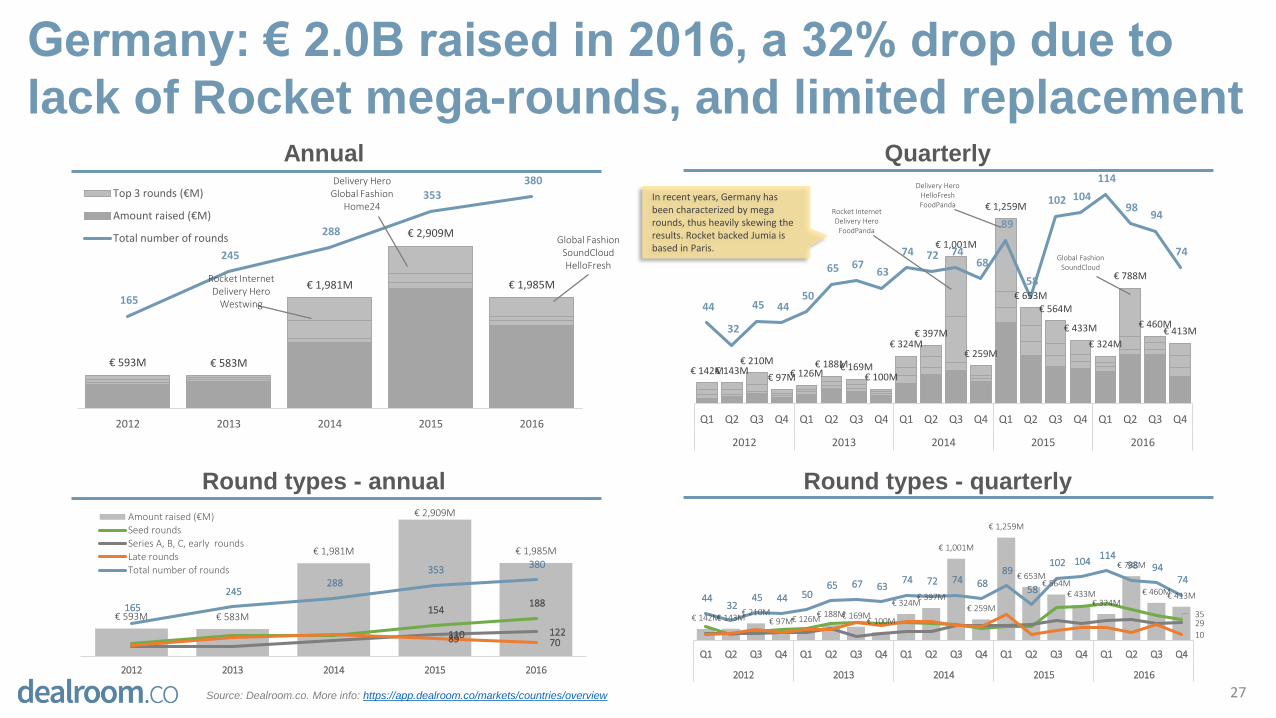
Germany: € 2.0B raised in 2016, a 32% drop due to
lack of Rocket mega-rounds, and limited replacement
27
QuarterlyAnnual
€ 593M € 583M
€ 1,981M
€ 2,909M
€ 1,985M
165
245
288
353 380
2012 2013 2014 2015 2016
Top 3 rounds (€M)
Amount raised (€M)
Total number of rounds
€ 142M€ 143M€ 210M
€ 97M€ 126M€ 188M€ 169M
€ 100M
€ 324M€ 397M
€ 1,001M
€ 259M
€ 1,259M
€ 653M€ 564M
€ 433M
€ 324M
€ 788M
€ 460M€ 413M
44
32
45 44 50
65 67 63
74 72 74 68
89
58
102 104
114
98 94
74
Q1 Q2 Q3 Q4 Q1 Q2 Q3 Q4 Q1 Q2 Q3 Q4 Q1 Q2 Q3 Q4 Q1 Q2 Q3 Q4
2012 2013 2014 2015 2016
Rocket InternetDelivery Hero
Westwing
In recent years, Germany has been characterized by mega rounds, thus heavily skewing the results. Rocket backed Jumia is based in Paris.
Delivery HeroGlobal Fashion
Home24
Round types - quarterlyRound types - annual
€ 142M€ 143M€ 210M
€ 97M€ 126M€ 188M€ 169M
€ 100M
€ 324M€ 397M
€ 1,001M
€ 259M
€ 1,259M
€ 653M€ 564M
€ 433M€ 324M
€ 788M
€ 460M€ 413M
35 29
10
44 32
45 44 50 65 67 63
74 72 74 68 89
58
102 104 114
98 94 74
Q1 Q2 Q3 Q4 Q1 Q2 Q3 Q4 Q1 Q2 Q3 Q4 Q1 Q2 Q3 Q4 Q1 Q2 Q3 Q4
2012 2013 2014 2015 2016
€ 593M € 583M
€ 1,981M
€ 2,909M
€ 1,985M
154 188
110 122 89 70
165
245 288
353 380
2012 2013 2014 2015 2016
Amount raised (€M)Seed roundsSeries A, B, C, early roundsLate roundsTotal number of rounds
Global FashionSoundCloudHelloFresh
Rocket InternetDelivery Hero
FoodPanda
Delivery HeroHelloFreshFoodPanda
Global FashionSoundCloud
Source: Dealroom.co. More info: https://app.dealroom.co/markets/countries/overview
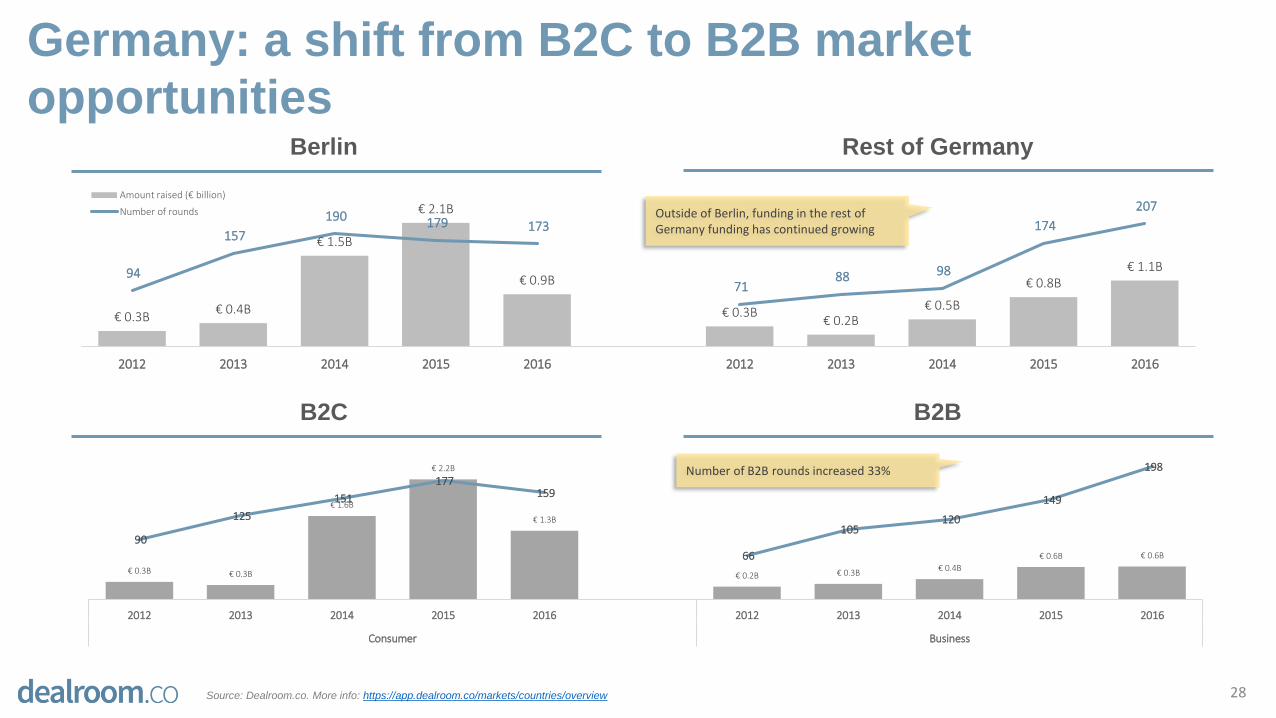
Germany: a shift from B2C to B2B market
opportunities
28
Rest of GermanyBerlin
B2BB2C
€ 0.3B€ 0.4B
€ 1.5B
€ 2.1B
€ 0.9B
€ 0.3B€ 0.2B
€ 0.5B
€ 0.8B€ 1.1B94
157
190 179 173
71 88 98
174
207
2012 2013 2014 2015 2016 2012 2013 2014 2015 2016
Amount raised (€ billion)
Number of rounds Outside of Berlin, funding in the rest of Germany funding has continued growing
€ 0.3B € 0.3B
€ 1.6B
€ 2.2B
€ 1.3B
€ 0.2B € 0.3B€ 0.4B
€ 0.6B € 0.6B
90
125
151
177 159
66
105 120
149
198
2012 2013 2014 2015 2016 2012 2013 2014 2015 2016
Consumer Business
Number of B2B rounds increased 33%
Source: Dealroom.co. More info: https://app.dealroom.co/markets/countries/overview
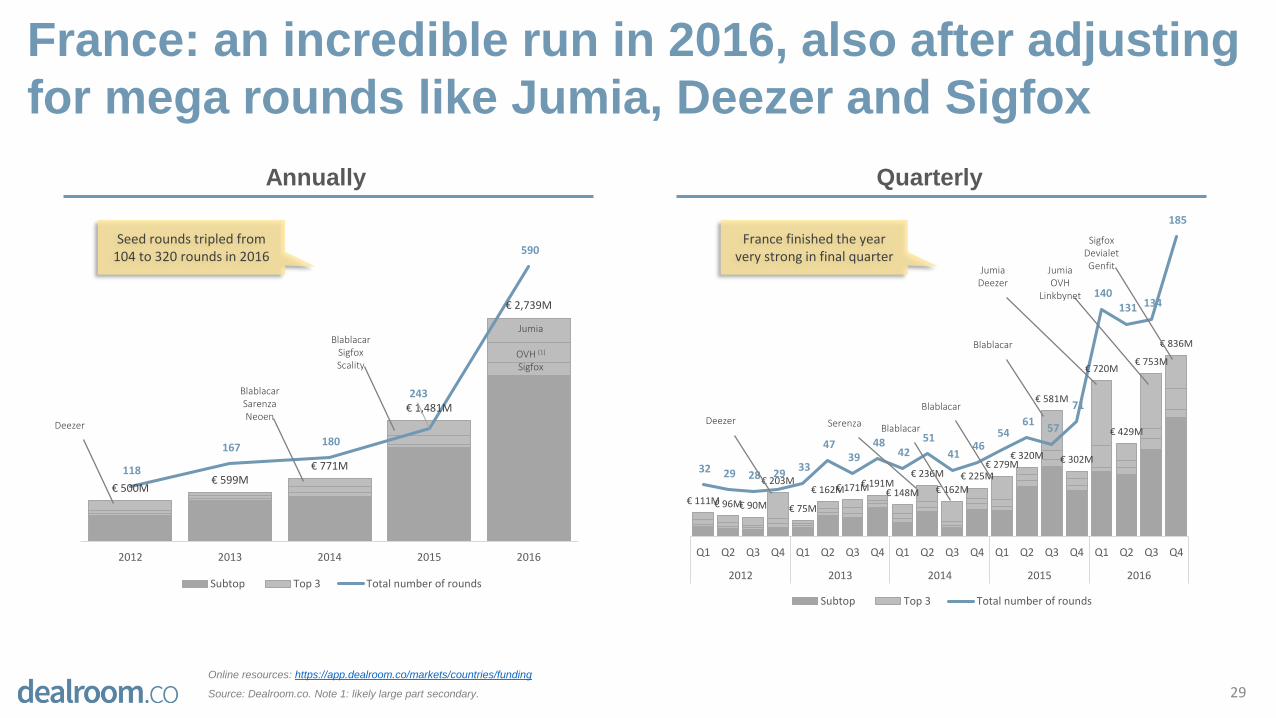
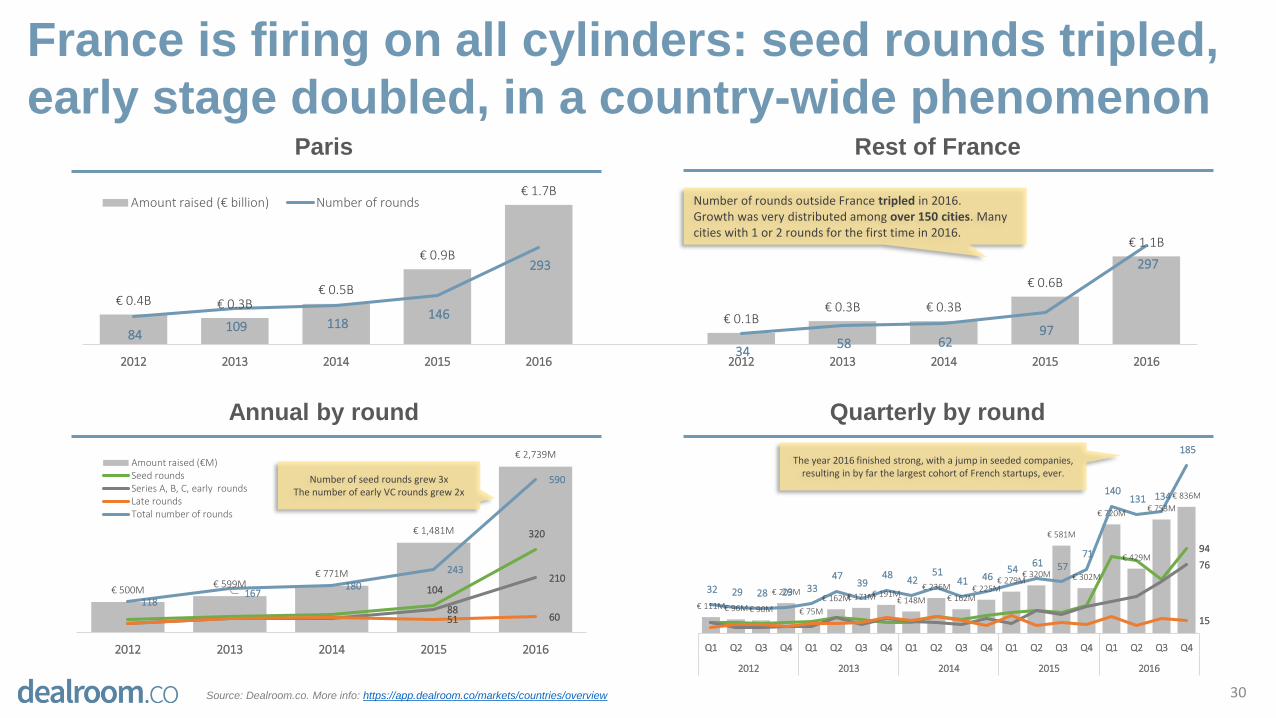
France: an incredible run in 2016, also after adjusting
for mega rounds like Jumia, Deezer and Sigfox
29Online resources: https://app.dealroom.co/markets/countries/funding
Source: Dealroom.co. Note 1: likely large part secondary.
QuarterlyAnnually
€ 500M€ 599M
€ 771M
€ 1,481M
€ 2,739M
118
167 180
243
590
2012 2013 2014 2015 2016
Subtop Top 3 Total number of rounds
€ 111M€ 96M€ 90M
€ 203M
€ 75M
€ 162M€ 171M€ 191M€ 148M
€ 236M
€ 162M
€ 225M€ 279M
€ 320M
€ 581M
€ 302M
€ 720M
€ 429M
€ 753M
€ 836M
32 29 28 29 33
47 39
48 42
51
41 46
54 61
57
71
140 131 134
185
Q1 Q2 Q3 Q4 Q1 Q2 Q3 Q4 Q1 Q2 Q3 Q4 Q1 Q2 Q3 Q4 Q1 Q2 Q3 Q4
2012 2013 2014 2015 2016
Subtop Top 3 Total number of rounds
BlablacarSigfoxScality
Jumia
OVH (1)
Sigfox
BlablacarSarenzaNeoen
Deezer
Blablacar
JumiaDeezer
JumiaOVH
Linkbynet
SigfoxDevialetGenfit
France finished the year very strong in final quarter
Seed rounds tripled from 104 to 320 rounds in 2016
Blablacar
BlablacarDeezer Serenza
€ 0.4B € 0.3B€ 0.5B
€ 0.9B
€ 1.7B
€ 0.1B€ 0.3B € 0.3B
€ 0.6B
€ 1.1B
84 109 118
146
293
34 58 62
97
297
2012 2013 2014 2015 2016 2012 2013 2014 2015 2016
Amount raised (€ billion) Number of rounds
France is firing on all cylinders: seed rounds tripled,
early stage doubled, in a country-wide phenomenon
30
Rest of FranceParis
Number of rounds outside France tripled in 2016.Growth was very distributed among over 150 cities. Many cities with 1 or 2 rounds for the first time in 2016.
€ 111M€ 96M € 90M
€ 203M
€ 75M
€ 162M€ 171M€ 191M€ 148M
€ 236M€ 162M
€ 225M€ 279M
€ 320M
€ 581M
€ 302M
€ 720M
€ 429M
€ 753M
€ 836M
94
76
15
32 29 28 29 33 47
39 48
42 51
41 46 54
61 57 71
140 131 134
185
Q1 Q2 Q3 Q4 Q1 Q2 Q3 Q4 Q1 Q2 Q3 Q4 Q1 Q2 Q3 Q4 Q1 Q2 Q3 Q4
2012 2013 2014 2015 2016
€ 500M€ 599M
€ 771M
€ 1,481M
€ 2,739M
104
320
88
210
51 60
118 167
180
243
590
2012 2013 2014 2015 2016
Amount raised (€M)Seed roundsSeries A, B, C, early roundsLate roundsTotal number of rounds
Quarterly by roundAnnual by round
Number of seed rounds grew 3xThe number of early VC rounds grew 2x
The year 2016 finished strong, with a jump in seeded companies, resulting in by far the largest cohort of French startups, ever.
Source: Dealroom.co. More info: https://app.dealroom.co/markets/countries/overview
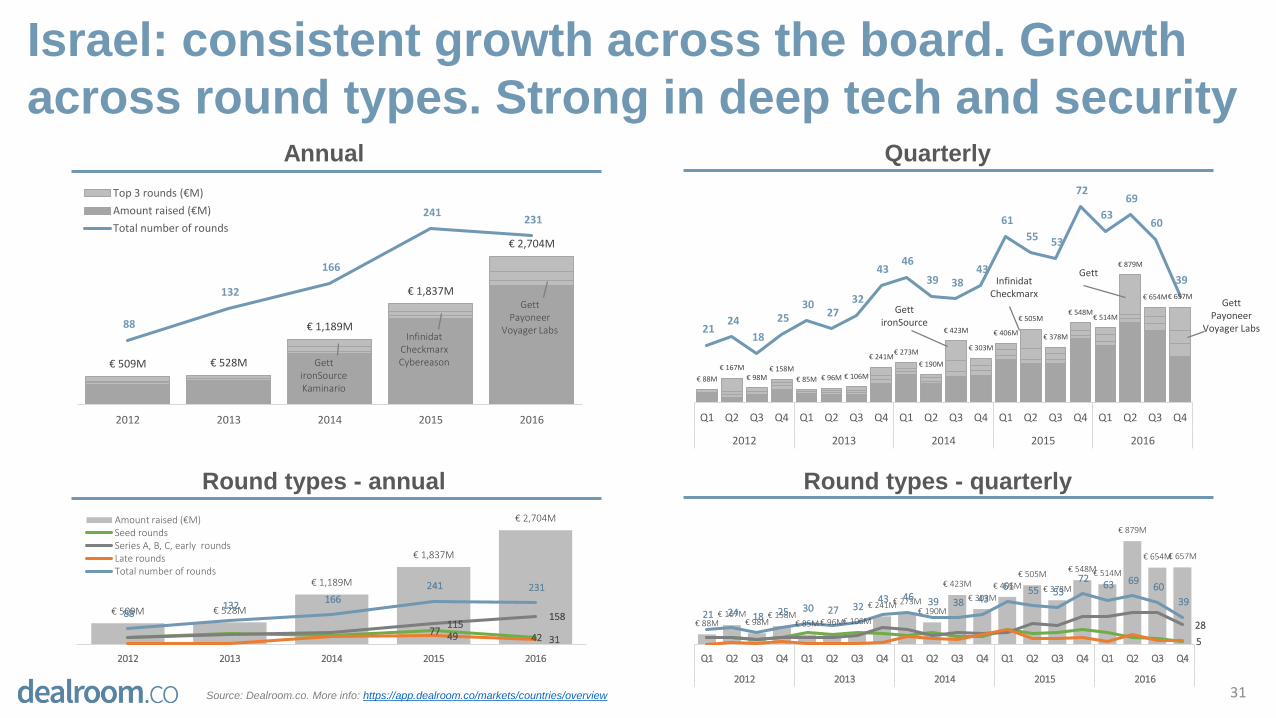
Israel: consistent growth across the board. Growth
across round types. Strong in deep tech and security
31
QuarterlyAnnual
Round types - quarterlyRound types - annual
€ 88M€ 167M
€ 98M€ 158M
€ 85M € 96M€ 106M
€ 241M€ 273M€ 190M
€ 423M
€ 303M
€ 406M
€ 505M
€ 378M
€ 548M€ 514M
€ 879M
€ 654M€ 657M
5
28 21 24 18 25 30 27 32
43 46 39 38 43 61 55 53
72 63 69
60
39
Q1 Q2 Q3 Q4 Q1 Q2 Q3 Q4 Q1 Q2 Q3 Q4 Q1 Q2 Q3 Q4 Q1 Q2 Q3 Q4
2012 2013 2014 2015 2016
€ 509M € 528M
€ 1,189M
€ 1,837M
€ 2,704M
77 42
115 158
49 31
88 132
166
241 231
2012 2013 2014 2015 2016
Amount raised (€M)Seed roundsSeries A, B, C, early roundsLate roundsTotal number of rounds
€ 509M € 528M
€ 1,189M
€ 1,837M
€ 2,704M
88
132
166
241 231
2012 2013 2014 2015 2016
Top 3 rounds (€M)
Amount raised (€M)
Total number of rounds
€ 88M
€ 167M
€ 98M€ 158M
€ 85M € 96M € 106M
€ 241M€ 273M
€ 190M
€ 423M
€ 303M
€ 406M
€ 505M
€ 378M
€ 548M€ 514M
€ 879M
€ 654M€ 657M
21 24
18
25 30
27 32
43 46
39 38 43
61
55 53
72
63
69
60
39
Q1 Q2 Q3 Q4 Q1 Q2 Q3 Q4 Q1 Q2 Q3 Q4 Q1 Q2 Q3 Q4 Q1 Q2 Q3 Q4
2012 2013 2014 2015 2016
GettPayoneer
Voyager LabsInfinidat
CheckmarxCybereasonGett
ironSourceKaminario
GettironSource
InfinidatCheckmarx
Gett
GettPayoneer
Voyager Labs
Source: Dealroom.co. More info: https://app.dealroom.co/markets/countries/overview
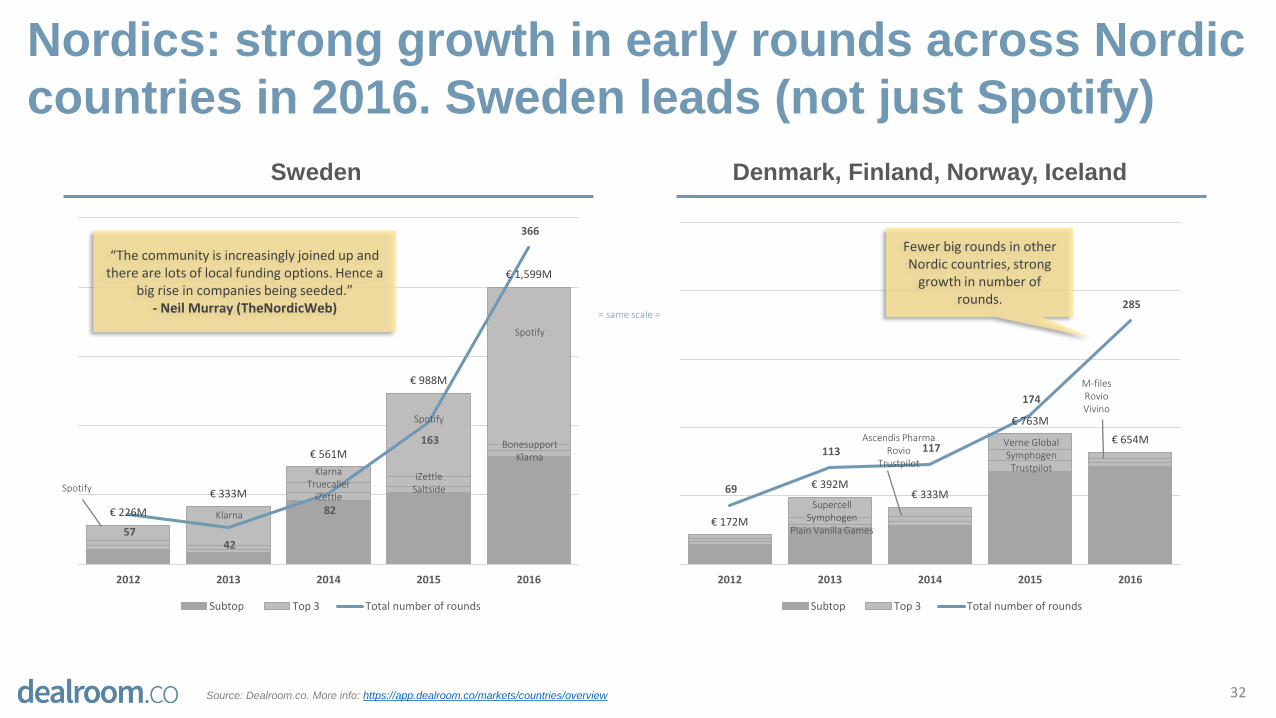
Nordics: strong growth in early rounds across Nordic
countries in 2016. Sweden leads (not just Spotify)
32
Denmark, Finland, Norway, IcelandSweden
€ 226M
€ 333M
€ 561M
€ 988M
€ 1,599M
57 42
82
163
366
2012 2013 2014 2015 2016
Subtop Top 3 Total number of rounds
€ 172M
€ 392M€ 333M
€ 763M
€ 654M
69
113 117
174
285
2012 2013 2014 2015 2016
Subtop Top 3 Total number of rounds
Spotify
Spotify
Spotify
KlarnaTruecaller
iZettle
Klarna
iZettleSaltside
BonesupportKlarna
Verne GlobalSymphogenTrustpilot
M-filesRovioVivino
Ascendis PharmaRovio
Trustpilot
Fewer big rounds in other Nordic countries, strong
growth in number of rounds.
SupercellSymphogen
Plain Vanilla Games
“The community is increasingly joined up and there are lots of local funding options. Hence a
big rise in companies being seeded.”- Neil Murray (TheNordicWeb) = same scale =
Source: Dealroom.co. More info: https://app.dealroom.co/markets/countries/overview
Nordics: the year ended strongly with lot of seed and
series-A rounds in final quarter
33
€ 34M
€ 80M
€ 15M
€ 98M
€ 4M
€ 57M€ 31M
€ 241M
€ 152M€ 182M
€ 118M€ 109M€ 82M
€ 602M
€ 194M
€ 109M
€ 1,053M
€ 197M
€ 119M
€ 230M
14
22
10 11
3
19
9 11
19 23 22
18
26
40 39
58
90
82 82
112
Q1 Q2 Q3 Q4 Q1 Q2 Q3 Q4 Q1 Q2 Q3 Q4 Q1 Q2 Q3 Q4 Q1 Q2 Q3 Q4
2012 2013 2014 2015 2016
Subtop Top 3 Total number of rounds
€ 14M€ 33M
€ 73M€ 52M € 45M
€ 213M
€ 69M € 66M € 62M€ 93M
€ 63M
€ 114M
€ 220M
€ 154M
€ 100M
€ 289M
€ 192M
€ 127M€ 126M
€ 208M19
13
18 19 19
30 30 34
28 28 28
33
42
34
40
58
71
54
61
99
Q1 Q2 Q3 Q4 Q1 Q2 Q3 Q4 Q1 Q2 Q3 Q4 Q1 Q2 Q3 Q4 Q1 Q2 Q3 Q4
2012 2013 2014 2015 2016
Subtop Top 3 Total number of rounds
Denmark, Finland, Norway, IcelandSweden
Spotify
Spotify
Symphogen
Spotify
Verne GlobalSupercell
Trustpilot
KlarnaiZettle Truecaller
Remarkable surge in number of rounds mainly driven by seed rounds in
Mainly driven by surge in both seed and series-A
rounds in 2016= same scale =
Source: Dealroom.co. More info: https://app.dealroom.co/markets/countries/overview
1. Introduction: headline stats in Europe
2. Insights: understanding the key trends and drivers
3. Top verticals and business models
4. Investment sources trends
5. Overviews of top countries
6. Outtakes: additional data
Contents
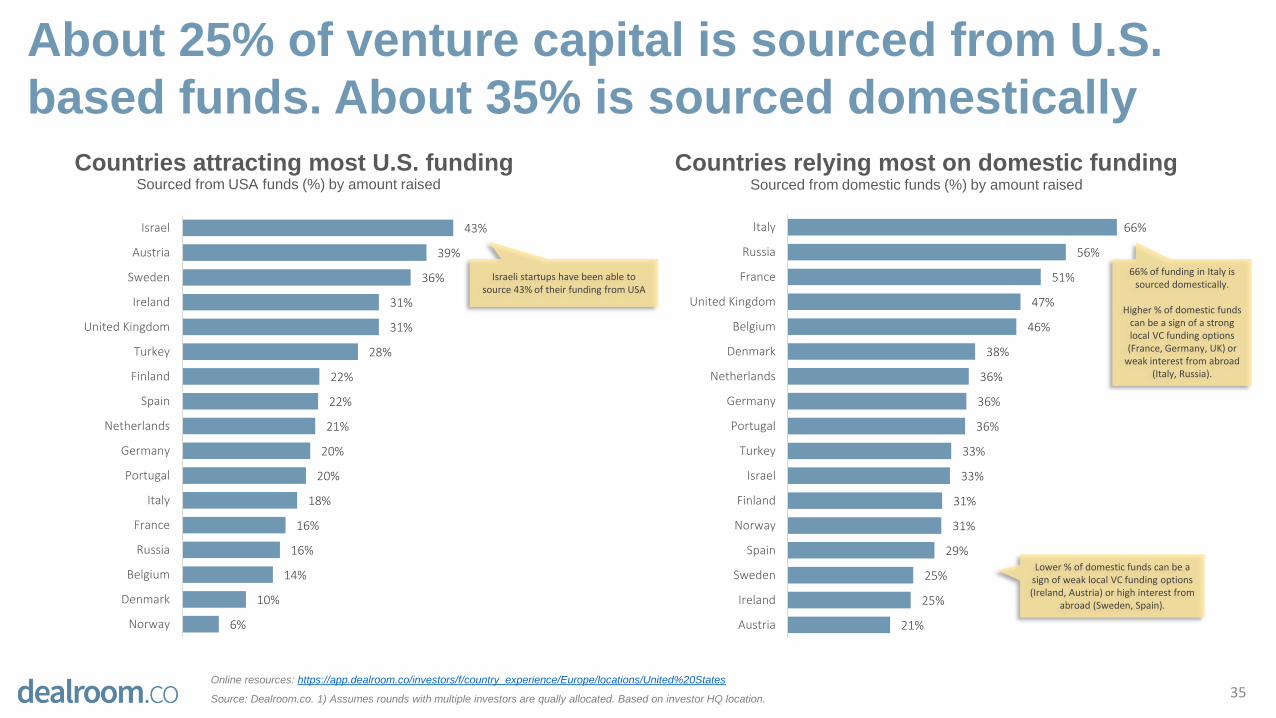
About 25% of venture capital is sourced from U.S.
based funds. About 35% is sourced domestically
35Online resources: https://app.dealroom.co/investors/f/country_experience/Europe/locations/United%20States
Source: Dealroom.co. 1) Assumes rounds with multiple investors are qually allocated. Based on investor HQ location.
Countries attracting most U.S. funding Countries relying most on domestic fundingSourced from USA funds (%) by amount raised Sourced from domestic funds (%) by amount raised
Israeli startups have been able to source 43% of their funding from USA
66% of funding in Italy is sourced domestically.
Higher % of domestic funds can be a sign of a strong local VC funding options (France, Germany, UK) or
weak interest from abroad (Italy, Russia).
43%
39%
36%
31%
31%
28%
22%
22%
21%
20%
20%
18%
16%
16%
14%
10%
6%
Israel
Austria
Sweden
Ireland
United Kingdom
Turkey
Finland
Spain
Netherlands
Germany
Portugal
Italy
France
Russia
Belgium
Denmark
Norway
66%
56%
51%
47%
46%
38%
36%
36%
36%
33%
33%
31%
31%
29%
25%
25%
21%
Italy
Russia
France
United Kingdom
Belgium
Denmark
Netherlands
Germany
Portugal
Turkey
Israel
Finland
Norway
Spain
Sweden
Ireland
Austria
Lower % of domestic funds can be a sign of weak local VC funding options (Ireland, Austria) or high interest from
abroad (Sweden, Spain).
€ 3.2B
€ 2.7B
€ 2.7B
€ 2.0B
€ 1.6B
€ 0.6B
€ 0.4B
€ 0.4B
€ 0.3B
€ 0.3B
€ 0.2B
€ 0.2B
€ 0.2B
€ 0.1B
€ 0.1B
€ 0.0B
€ 0.0B
USA
United Kingdom
France
Israel
Germany
Sweden
Spain
Netherlands
Ireland
Finland
Russia
Belgium
Italy
Norway
Denmark
Austria
Portugal
Turkey
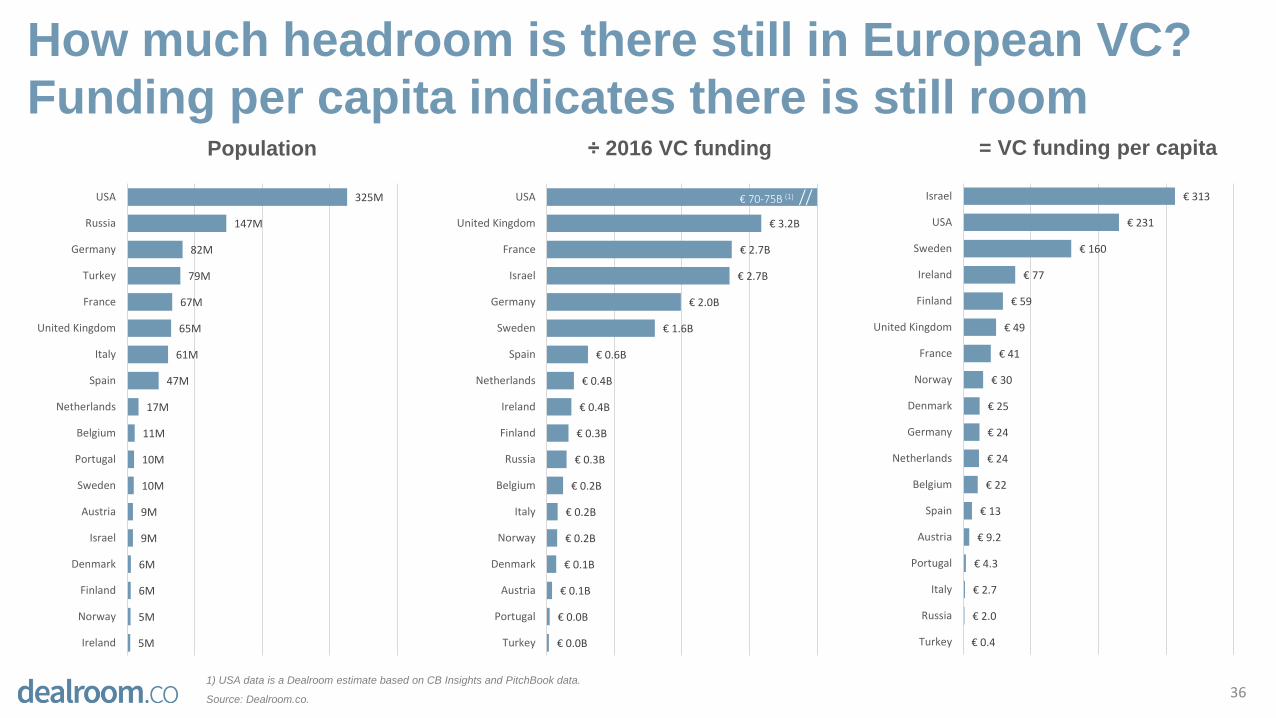
How much headroom is there still in European VC?
Funding per capita indicates there is still room
361) USA data is a Dealroom estimate based on CB Insights and PitchBook data.
Source: Dealroom.co.
325M
147M
82M
79M
67M
65M
61M
47M
17M
11M
10M
10M
9M
9M
6M
6M
5M
5M
USA
Russia
Germany
Turkey
France
United Kingdom
Italy
Spain
Netherlands
Belgium
Portugal
Sweden
Austria
Israel
Denmark
Finland
Norway
Ireland
Population = VC funding per capita÷ 2016 VC funding
€ 70-75B (1) // € 313
€ 231
€ 160
€ 77
€ 59
€ 49
€ 41
€ 30
€ 25
€ 24
€ 24
€ 22
€ 13
€ 9.2
€ 4.3
€ 2.7
€ 2.0
€ 0.4
Israel
USA
Sweden
Ireland
Finland
United Kingdom
France
Norway
Denmark
Germany
Netherlands
Belgium
Spain
Austria
Portugal
Italy
Russia
Turkey
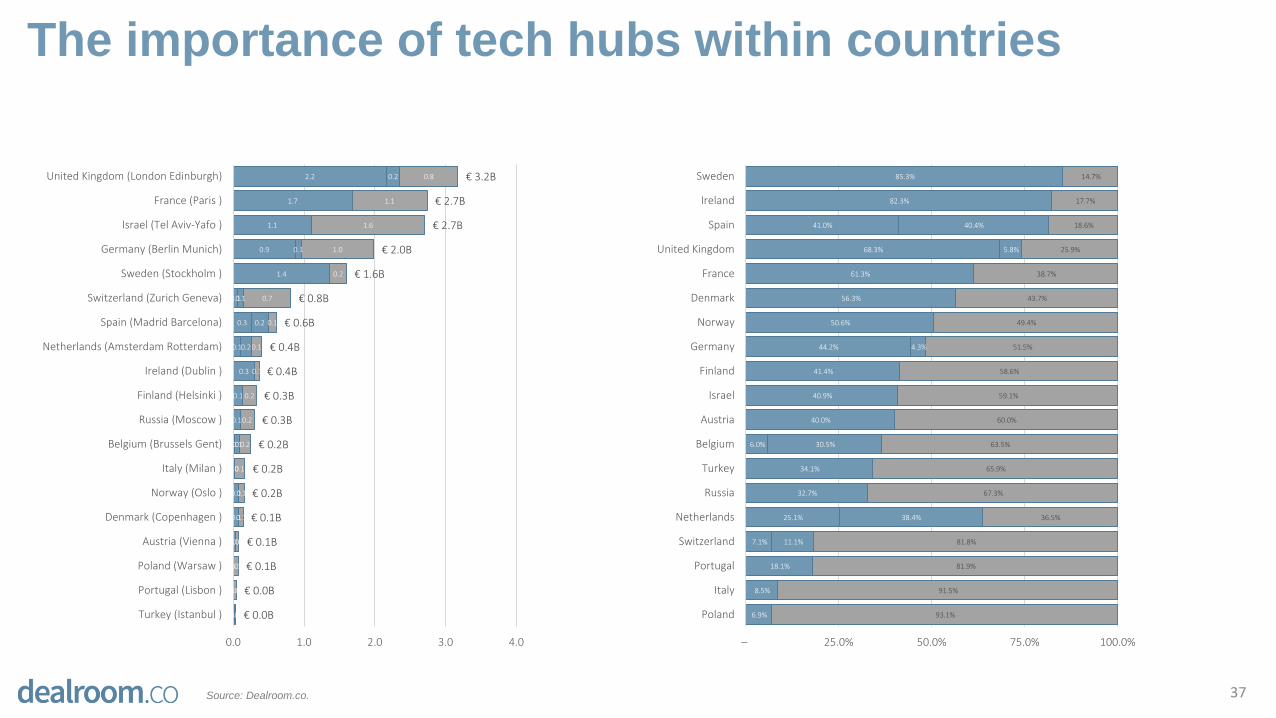
The importance of tech hubs within countries
37Source: Dealroom.co.
85.3%
82.3%
41.0%
68.3%
61.3%
56.3%
50.6%
44.2%
41.4%
40.9%
40.0%
6.0%
34.1%
32.7%
25.1%
7.1%
18.1%
8.5%
6.9%
40.4%
5.8%
4.3%
30.5%
38.4%
11.1%
14.7%
17.7%
18.6%
25.9%
38.7%
43.7%
49.4%
51.5%
58.6%
59.1%
60.0%
63.5%
65.9%
67.3%
36.5%
81.8%
81.9%
91.5%
93.1%
– 25.0% 50.0% 75.0% 100.0%
Sweden
Ireland
Spain
United Kingdom
France
Denmark
Norway
Germany
Finland
Israel
Austria
Belgium
Turkey
Russia
Netherlands
Switzerland
Portugal
Italy
Poland
2.2
1.7
1.1
0.9
1.4
0.1
0.3
0.1
0.3
0.1
0.1
0.0
0.0
0.1
0.1
0.0
0.0
0.0
0.0
0.2
0.1
0.1
0.2
0.2
0.1
0.8
1.1
1.6
1.0
0.2
0.7
0.1
0.1
0.1
0.2
0.2
0.2
0.1
0.1
0.1
0.0
0.1
0.0
0.0
€ 3.2B
€ 2.7B
€ 2.7B
€ 2.0B
€ 1.6B
€ 0.8B
€ 0.6B
€ 0.4B
€ 0.4B
€ 0.3B
€ 0.3B
€ 0.2B
€ 0.2B
€ 0.2B
€ 0.1B
€ 0.1B
€ 0.1B
€ 0.0B
€ 0.0B
0.0 1.0 2.0 3.0 4.0
United Kingdom (London Edinburgh)
France (Paris )
Israel (Tel Aviv-Yafo )
Germany (Berlin Munich)
Sweden (Stockholm )
Switzerland (Zurich Geneva)
Spain (Madrid Barcelona)
Netherlands (Amsterdam Rotterdam)
Ireland (Dublin )
Finland (Helsinki )
Russia (Moscow )
Belgium (Brussels Gent)
Italy (Milan )
Norway (Oslo )
Denmark (Copenhagen )
Austria (Vienna )
Poland (Warsaw )
Portugal (Lisbon )
Turkey (Istanbul )
2016 saw largest ever European cohort of early stage
startups funded. Later stage rounds slowed down
38
€ 0.2B € 0.2B € 0.2B
€ 0.3B€ 0.4B € 0.4B
€ 0.2B€ 0.3B
€ 0.4B
€ 0.6B
€ 0.9B € 0.9B€ 0.8B
€ 0.9B
€ 1.0B
€ 1.2B
€ 0.7B
€ 0.9B
€ 1.2B
€ 0.9B
€ 1.1B
€ 1.3B
€ 0.8B€ 0.8B
€ 1.7B
€ 1.8B
€ 1.7B
€ 1.1B
€ 1.3B
€ 1.6B
€ 1.3B
€ 1.2B
€ 0.5B
€ 0.4B€ 0.3B € 0.3B
€ 1.1B
€ 0.1B
€ 0.2B
€ 0.3B
299 292
340 370
497
451
367
433
106 131
148
182 189 194
231
265
42 52 61 60 70 74 62 60 39 44 45 50 61 52 43 42
150
42 54 59 66 65 83 71
Q1 Q2 Q3 Q4 Q1 Q2 Q3 Q4 Q1 Q2 Q3 Q4 Q1 Q2 Q3 Q4 Q1 Q2 Q3 Q4 Q1 Q2 Q3 Q4 Q1 Q2 Q3 Q4 Q1 Q2 Q3 Q4 Q1 Q2 Q3 Q4 Q1 Q2 Q3 Q4
2015 2016 2015 2016 2015 2016 2015 2016 2015 2016
Angel & Seed Series A / Early VC Series B, C Series D+ Other
Amount raised (€ billion) Number of rounds
Source: Dealroom.co.
Early stage: strong pipeline Later stage: slow-down
Includes €0.9B Spotify convertible.
Seed & angel rounds more lumpy on quarterly scale
On quarterly scale, uptrend in Series B and series C disappears
Largest ever European cohort of new early stage startups funded in 2016.
€ 0.7B
€ 0.8B
€ 1.3B
€ 1.0B
€ 1.1B
€ 0.7B
€ 0.9B
€ 0.5B
€ 1.3B
€ 0.7B
€ 0.6B
€ 0.4B
€ 0.3B
€ 0.8B
€ 0.5B€ 0.4B
€ 0.3B€ 0.3B
€ 0.6B
€ 0.3B
€ 0.7B
€ 0.4B
€ 0.8B
€ 0.8B
€ 0.4B
€ 0.5B
€ 0.4B
€ 0.5B€ 0.5B
€ 0.9B
€ 0.7B€ 0.7B
€ 0.1B
€ 0.6B
€ 0.2B
€ 0.1B
€ 1.1B
€ 0.2B
€ 0.1B
€ 0.2B
€ 0.7B€ 0.7B
€ 1.0B€ 1.0B
€ 0.9B
€ 1.2B
€ 0.7B
€ 1.1B
137 124
140 144 142 126 126 126
89
58
102 104 114 98 94
74 54 61 57
71
140 131 134
185
61 55 53 72 63 69 60
39 26
40 39 58
90 82 82
112
269
223
257 272
334 330
290
335
Q1 Q2 Q3 Q4 Q1 Q2 Q3 Q4 Q1 Q2 Q3 Q4 Q1 Q2 Q3 Q4 Q1 Q2 Q3 Q4 Q1 Q2 Q3 Q4 Q1 Q2 Q3 Q4 Q1 Q2 Q3 Q4 Q1 Q2 Q3 Q4 Q1 Q2 Q3 Q4 Q1 Q2 Q3 Q4 Q1 Q2 Q3 Q4
2015 2016 2015 2016 2015 2016 2015 2016 2015 2016 2015 2016
United Kingdom Germany France Israel Sweden Other
Amount raised (€ billion) Number of rounds
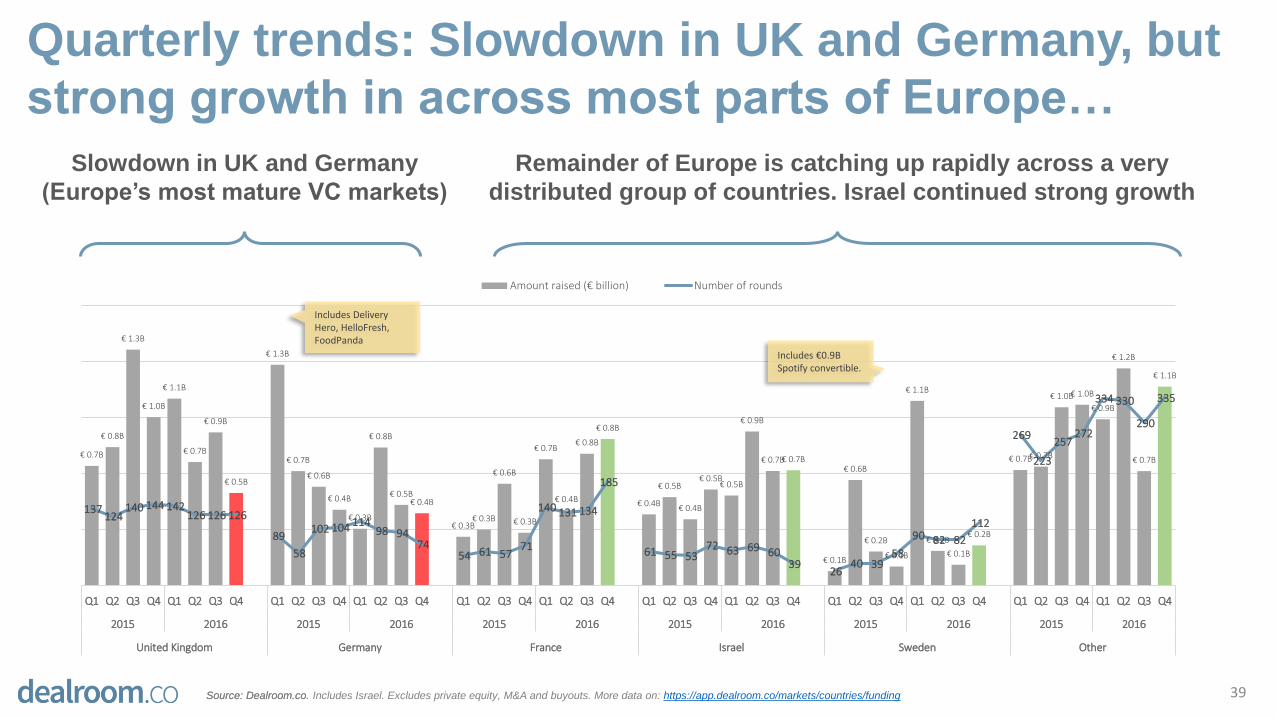
Quarterly trends: Slowdown in UK and Germany, but
strong growth in across most parts of Europe…
39Source: Dealroom.co.
Includes €0.9B Spotify convertible.
Includes Delivery Hero, HelloFresh, FoodPanda
Source: Dealroom.co. Includes Israel. Excludes private equity, M&A and buyouts. More data on: https://app.dealroom.co/markets/countries/funding
Slowdown in UK and Germany
(Europe’s most mature VC markets)
Remainder of Europe is catching up rapidly across a very
distributed group of countries. Israel continued strong growth
![VENTURE CAPITAL FOR SUSTAINABILITY 2007 REPORT [2007] Venture Capital... · growing sector as Venture Capital for Sustainability ... Venture Capitalists’ stake in ... Venture Capital](https://img.pdfslide.net/doc/110x75/5a7926b77f8b9a00168dc540/venture-capital-for-sustainability-2007-2007-venture-capitalgrowing-sector.jpg)