Embed Size (px)
Citation preview

Atento Fourth Quarter and Full Year 2014 Results
April 16th, 2015
2
Disclaimer
This presentation is provided to you on the condition that you agree that you will hold it in strict confidence and not reproduce, disclose, forward or distribute it to any third party in whole or in part without the prior written consent of Atento S.A. (“Atento”).
This presentation has been prepared by Atento. The information contained in this presentation is for informational purposes only. The information contained in this presentation is not investment or financial product advice and is not intended to be used as the basis for making an investment decision. This presentation has been prepared without taking into account the investment objectives, financial situation or particular needs of any particular person.
This presentation contains forward-looking statements within the meaning of the U.S. federal securities laws, that are subject to risks and uncertainties. All statements other than statements of historical fact included in this presentation are forward-looking statements. Forward-looking statements give our current expectations and projections relating to our financial condition, results of operations, plans, objectives, future performance and business. Forward-looking statements can be identified by the use of words such as "may," "should," "expects," "plans," "anticipates," "believes," "estimates," "predicts," "intends," "continue“, the negative thereof and other words and terms of similar meaning in connection with any discussion of the timing or nature of future operating or financial performance or other events. These forward-looking statements are based on assumptions that we have made in light of our industry experience and on our perceptions of historical trends, current conditions, expected future developments and other factors we believe are appropriate under the circumstances. As you consider this presentation, you should understand that these statements are not guarantees of performance or results. They involve risks, uncertainties (some of which are beyond our control) and assumptions. Although we believe that these forward-looking statements are based on reasonable assumptions, you should be aware that many factors could affect our actual financial results and cause them to differ materially from those anticipated in the forward-looking statements.
Because of these factors, we caution that you should not place undue reliance on any of our forward-looking statements. Further, any forward-looking statement speaks only as of the date on which it is made. New risks and uncertainties arise from time to time, and it is impossible for us to predict those events or how they may affect us. We have no duty to, and do not intend to, update or revise the forward-looking statements in this presentation after the date of this presentation.
The historical and projected financial information in this presentation includes financial information that is not presented in accordance with International Financial Reporting Standards (“IFRS”). We refer to these measures as “non-GAAP financial measurers.” The non-GAAP financial measures may not be comparable to other similarly titled measures of other companies and have limitations as analytical tools and should not be considered in isolation or as a substitute for analysis of our operating results as reported under IFRS.

Full Year and Fourth Quarter Review
4
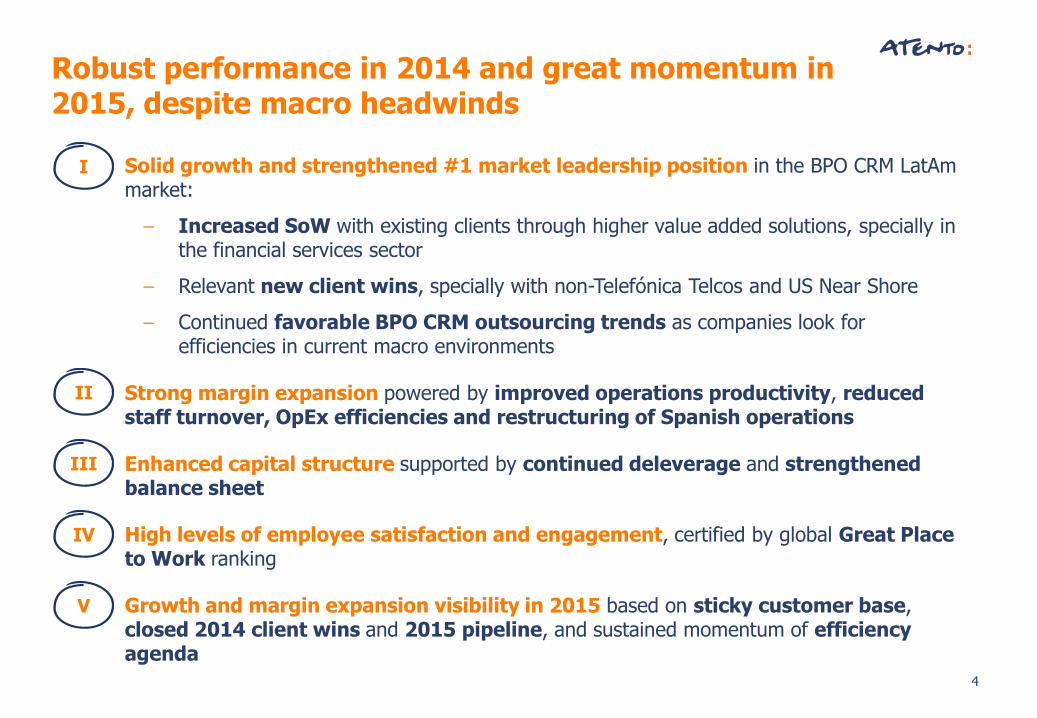
Robust performance in 2014 and great momentum in 2015, despite macro headwinds
Solid growth and strengthened #1 market leadership position in the BPO CRM LatAm market:
— Increased SoW with existing clients through higher value added solutions, specially in the financial services sector
— Relevant new client wins, specially with non-Telefónica Telcos and US Near Shore
— Continued favorable BPO CRM outsourcing trends as companies look for efficiencies in current macro environments
Strong margin expansion powered by improved operations productivity, reduced staff turnover, OpEx efficiencies and restructuring of Spanish operations
Enhanced capital structure supported by continued deleverage and strengthened balance sheet
High levels of employee satisfaction and engagement, certified by global Great Place to Work ranking
Growth and margin expansion visibility in 2015 based on sticky customer base, closed 2014 client wins and 2015 pipeline, and sustained momentum of efficiency agenda
I
II
III
IV
V
5
USDm
Q4
2013
Q4
2014
FY
2013
FY
2014
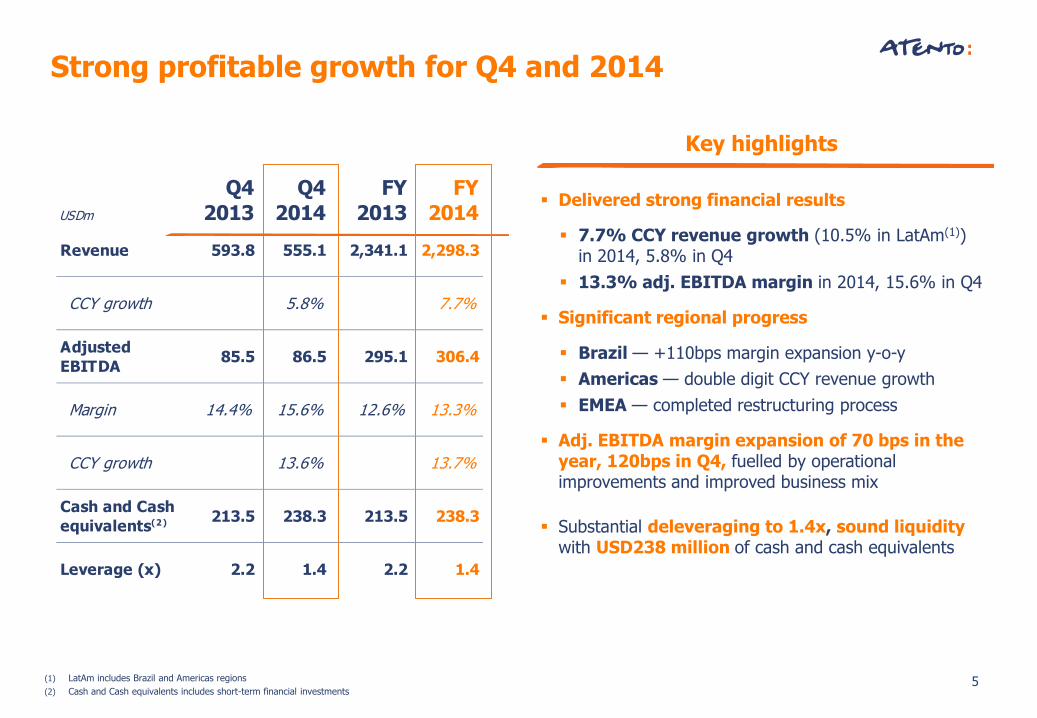
Revenue 593.8 555.1 2,341.1 2,298.3
CCY growth 5.8% 7.7%
Adjusted
EBITDA85.5 86.5 295.1 306.4
Margin 14.4% 15.6% 12.6% 13.3%
CCY growth 13.6% 13.7%
Cash and Cash
equivalents(2) 213.5 238.3 213.5 238.3
Leverage (x) 2.2 1.4 2.2 1.4
Strong profitable growth for Q4 and 2014
Key highlights
Delivered strong financial results
7.7% CCY revenue growth (10.5% in LatAm(1)) in 2014, 5.8% in Q4
13.3% adj. EBITDA margin in 2014, 15.6% in Q4
Significant regional progress
Brazil — +110bps margin expansion y-o-y
Americas — double digit CCY revenue growth
EMEA — completed restructuring process
Adj. EBITDA margin expansion of 70 bps in the year, 120bps in Q4, fuelled by operational improvements and improved business mix
Substantial deleveraging to 1.4x, sound liquidity with USD238 million of cash and cash equivalents
(1) LatAm includes Brazil and Americas regions
(2) Cash and Cash equivalents includes short-term financial investments
6
ST
RA
TE
GIC
P
ILLA
RS
GLO
BA
L
ST
RA
TE
GIC
IN
TIT
IAT
IVE
S Deliver CRM BPO
solutions
Aggressively grow client base
Penetrate U.S. Near-Shore
Enhance operations productivity
Increase HR effectiveness Deploy one procurement
Drive consistent and
efficient IT platform
Optimize site footprint
Distinct culture and values
Strengthen talent
High performance organization
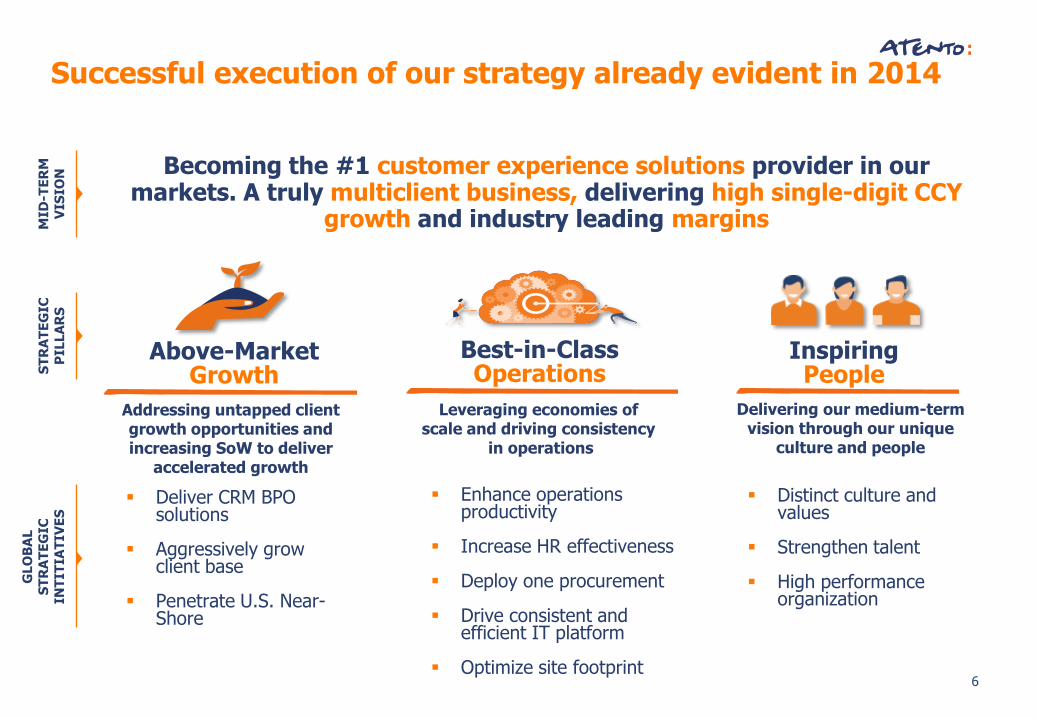
Above-Market Growth
Addressing untapped client growth opportunities and increasing SoW to deliver
accelerated growth
Best-in-Class Operations
Leveraging economies of scale and driving consistency
in operations
Inspiring People
Delivering our medium-term vision through our unique
culture and people
MID
-TE
RM
V
ISIO
N Becoming the #1 customer experience solutions provider in our
markets. A truly multiclient business, delivering high single-digit CCY growth and industry leading margins
Successful execution of our strategy already evident in 2014
7
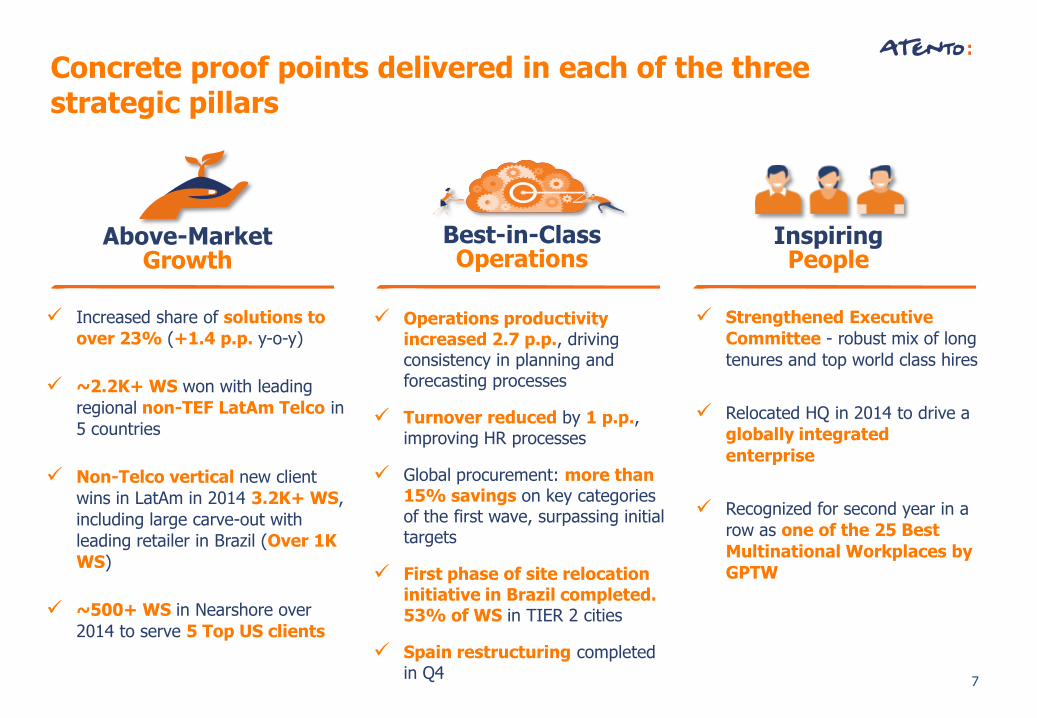
Concrete proof points delivered in each of the three strategic pillars
Above-Market Growth
Best-in-Class Operations
Inspiring People
Increased share of solutions to
over 23% (+1.4 p.p. y-o-y)
~2.2K+ WS won with leading
regional non-TEF LatAm Telco in
5 countries
Non-Telco vertical new client
wins in LatAm in 2014 3.2K+ WS,
including large carve-out with
leading retailer in Brazil (Over 1K
WS)
~500+ WS in Nearshore over
2014 to serve 5 Top US clients
Operations productivity increased 2.7 p.p., driving consistency in planning and forecasting processes
Turnover reduced by 1 p.p., improving HR processes
Global procurement: more than 15% savings on key categories of the first wave, surpassing initial targets
First phase of site relocation initiative in Brazil completed. 53% of WS in TIER 2 cities
Spain restructuring completed in Q4
Strengthened Executive
Committee - robust mix of long
tenures and top world class hires
Relocated HQ in 2014 to drive a
globally integrated
enterprise
Recognized for second year in a
row as one of the 25 Best
Multinational Workplaces by
GPTW
8
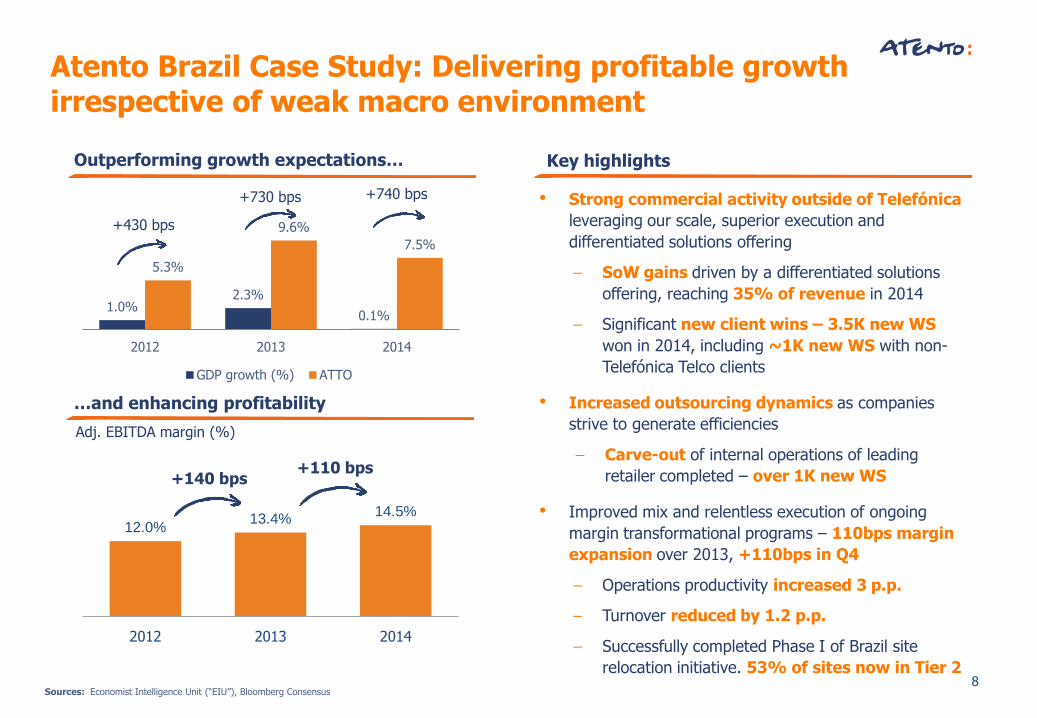
12.0% 13.4%
14.5%
2012 2013 2014
1.0% 2.3%
0.1%
5.3%
9.6%
7.5%
2012 2013 2014
GDP growth (%) ATTO
Atento Brazil Case Study: Delivering profitable growth irrespective of weak macro environment
Key highlights Outperforming growth expectations…
…and enhancing profitability
+430 bps
+740 bps +730 bps
+110 bps
Adj. EBITDA margin (%)
• Strong commercial activity outside of Telefónica
leveraging our scale, superior execution and
differentiated solutions offering
— SoW gains driven by a differentiated solutions
offering, reaching 35% of revenue in 2014
— Significant new client wins – 3.5K new WS
won in 2014, including ~1K new WS with non-
Telefónica Telco clients
• Increased outsourcing dynamics as companies
strive to generate efficiencies
— Carve-out of internal operations of leading
retailer completed – over 1K new WS
• Improved mix and relentless execution of ongoing
margin transformational programs – 110bps margin
expansion over 2013, +110bps in Q4
— Operations productivity increased 3 p.p.
— Turnover reduced by 1.2 p.p.
— Successfully completed Phase I of Brazil site
relocation initiative. 53% of sites now in Tier 2
Sources: Economist Intelligence Unit (“EIU”), Bloomberg Consensus
+140 bps
9
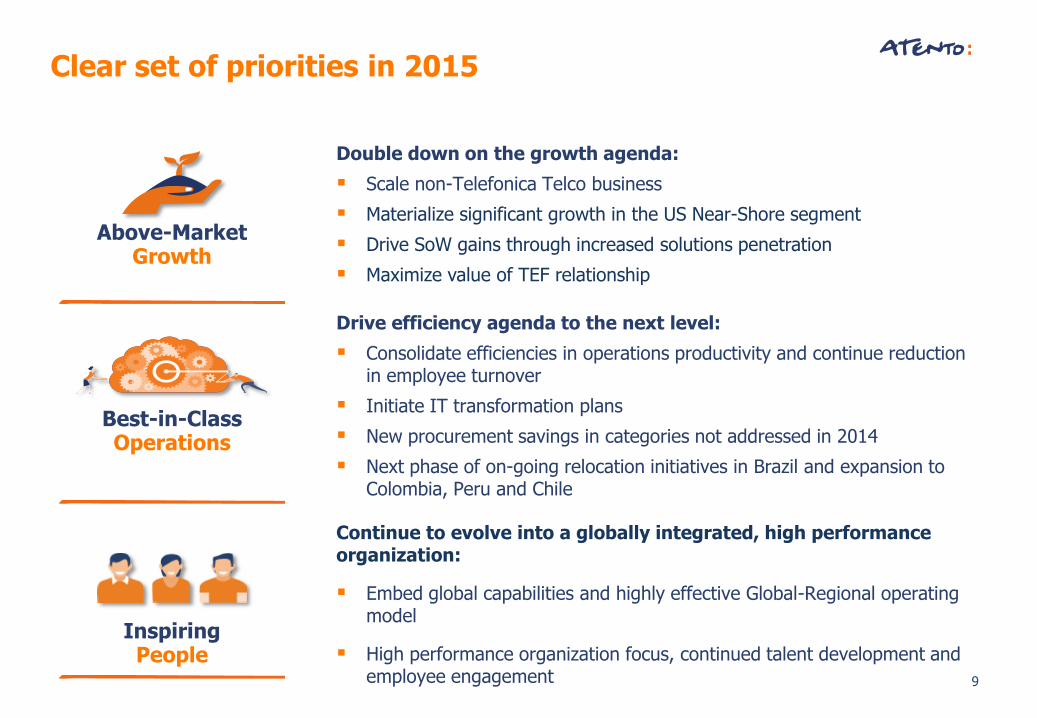
Drive efficiency agenda to the next level:
Consolidate efficiencies in operations productivity and continue reduction in employee turnover
Initiate IT transformation plans
New procurement savings in categories not addressed in 2014
Next phase of on-going relocation initiatives in Brazil and expansion to Colombia, Peru and Chile
Above-Market Growth
Best-in-Class Operations
Inspiring People
Double down on the growth agenda:
Scale non-Telefonica Telco business
Materialize significant growth in the US Near-Shore segment
Drive SoW gains through increased solutions penetration
Maximize value of TEF relationship
Continue to evolve into a globally integrated, high performance organization:
Embed global capabilities and highly effective Global-Regional operating model
High performance organization focus, continued talent development and employee engagement
Clear set of priorities in 2015
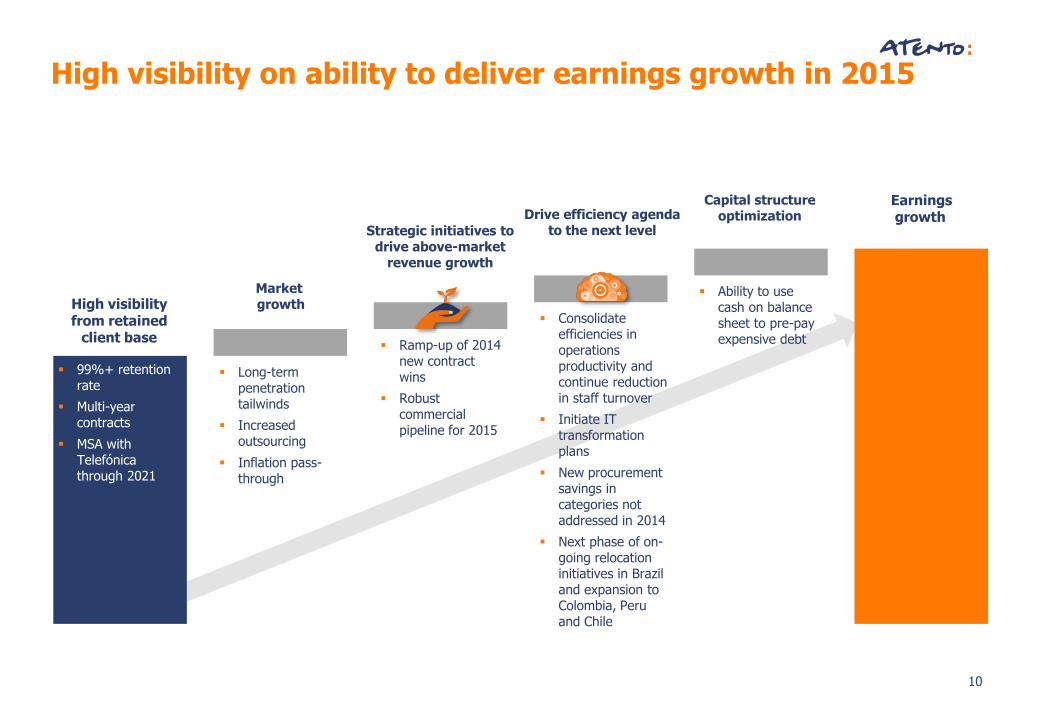
10
Strategic initiatives to drive above-market
revenue growth
Drive efficiency agenda to the next level
Capital structure optimization
Earnings growth
High visibility on ability to deliver earnings growth in 2015
Market growth High visibility
from retained client base
99%+ retention rate
Multi-year contracts
MSA with Telefónica through 2021
Long-term penetration tailwinds
Increased outsourcing
Inflation pass-through
Ramp-up of 2014 new contract wins
Robust commercial pipeline for 2015
Consolidate efficiencies in operations productivity and continue reduction in staff turnover
Initiate IT transformation plans
New procurement savings in categories not addressed in 2014
Next phase of on-going relocation initiatives in Brazil and expansion to Colombia, Peru and Chile
Ability to use cash on balance sheet to pre-pay expensive debt
2014 Group Financial performance
12
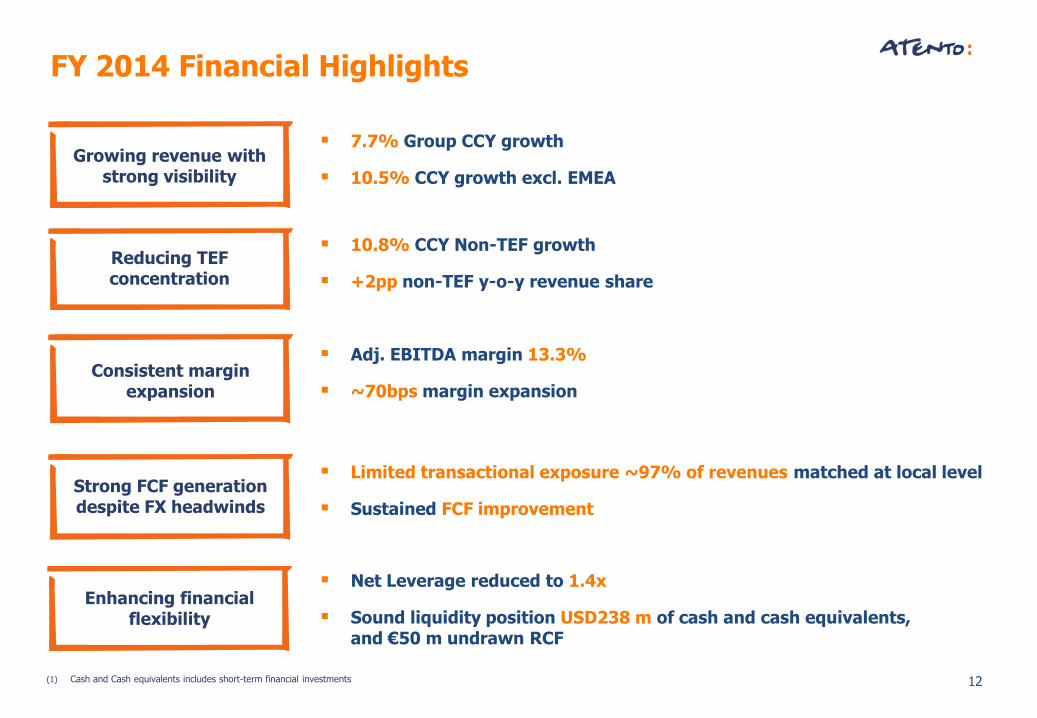
FY 2014 Financial Highlights
7.7% Group CCY growth
10.5% CCY growth excl. EMEA
Growing revenue with strong visibility
Reducing TEF concentration
Enhancing financial flexibility
Strong FCF generation despite FX headwinds
Consistent margin expansion
10.8% CCY Non-TEF growth
+2pp non-TEF y-o-y revenue share
Adj. EBITDA margin 13.3%
~70bps margin expansion
Limited transactional exposure ~97% of revenues matched at local level
Sustained FCF improvement
Net Leverage reduced to 1.4x
Sound liquidity position USD238 m of cash and cash equivalents, and €50 m undrawn RCF
(1) Cash and Cash equivalents includes short-term financial investments
13
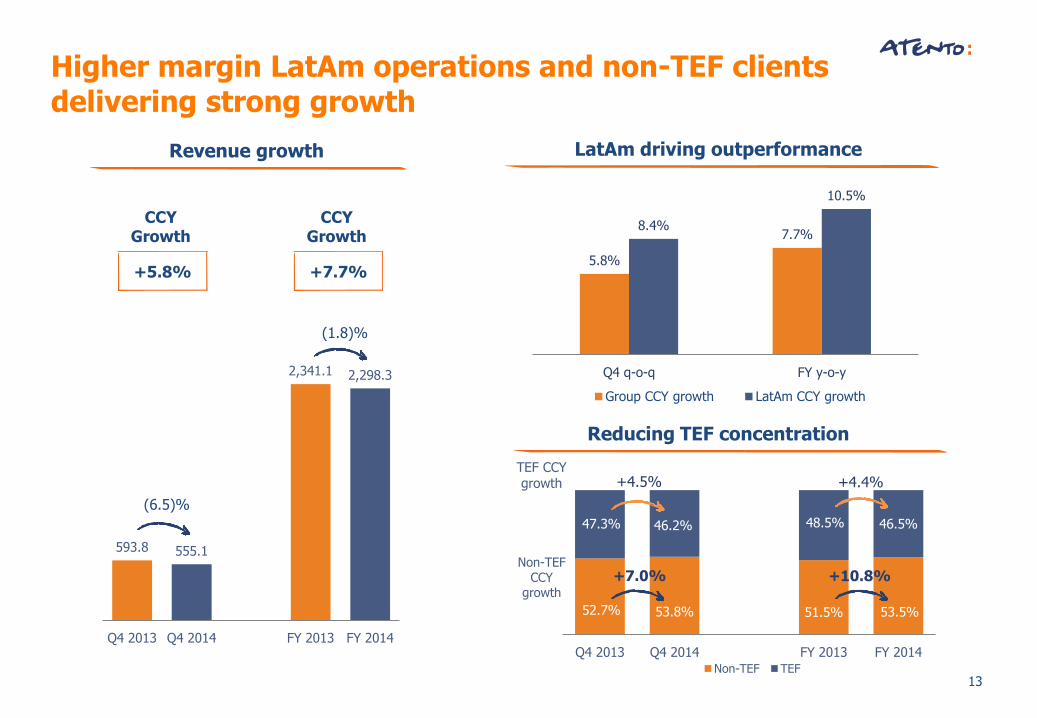
Revenue growth
Higher margin LatAm operations and non-TEF clients delivering strong growth
593.8 555.1
2,341.1 2,298.3
Q4 2013 Q4 2014 FY 2013 FY 2014
CCY Growth
+5.8%
CCY Growth
+7.7%
(6.5)%
(1.8)%
Reducing TEF concentration
52.7% 53.8% 51.5% 53.5%
47.3% 46.2% 48.5% 46.5%
Q4 2013 Q4 2014 FY 2013 FY 2014 Non-TEF TEF
+7.0% +10.8%
TEF CCY growth +4.5% +4.4%
Non-TEF CCY
growth
5.8%
7.7% 8.4%
10.5%
Q4 q-o-q FY y-o-y
Group CCY growth LatAm CCY growth
LatAm driving outperformance
14
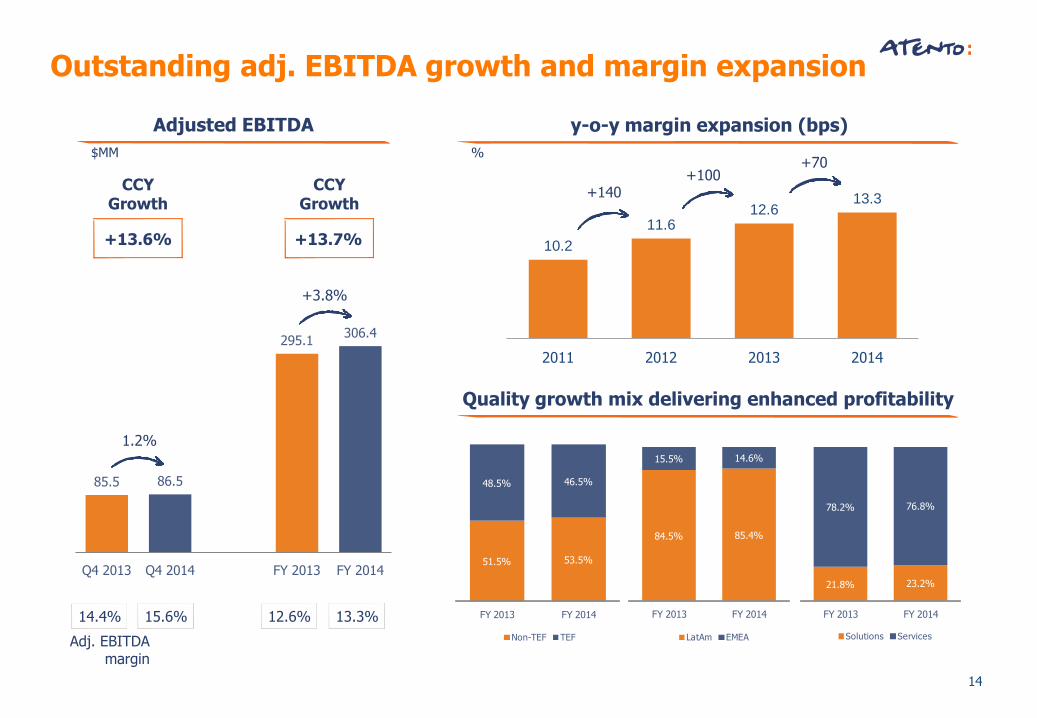
85.5 86.5
295.1 306.4
Q4 2013 Q4 2014 FY 2013 FY 2014
Adjusted EBITDA
Adj. EBITDA margin
CCY Growth
14.4%
$MM
+13.7%
15.6% 12.6% 13.3%
CCY Growth
+13.6%
1.2%
+3.8%
Outstanding adj. EBITDA growth and margin expansion
y-o-y margin expansion (bps)
Quality growth mix delivering enhanced profitability
%
10.2
11.6 12.6
13.3
2011 2012 2013 2014
+140 +100
+70
84.5% 85.4%
15.5% 14.6%
FY 2013 FY 2014
LatAm EMEA
21.8% 23.2%
78.2% 76.8%
FY 2013 FY 2014
Solutions Services
51.5% 53.5%
48.5% 46.5%
FY 2013 FY 2014
Non-TEF TEF
15
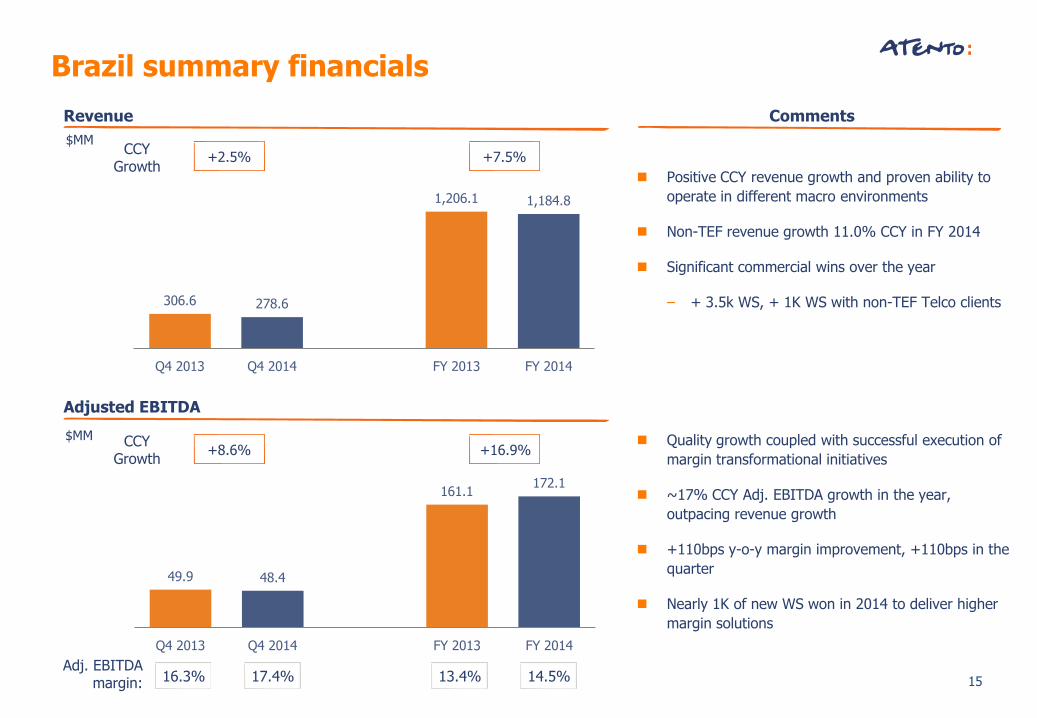
Brazil summary financials
Revenue Comments
Positive CCY revenue growth and proven ability to
operate in different macro environments
Non-TEF revenue growth 11.0% CCY in FY 2014
Significant commercial wins over the year
– + 3.5k WS, + 1K WS with non-TEF Telco clients
Quality growth coupled with successful execution of
margin transformational initiatives
~17% CCY Adj. EBITDA growth in the year,
outpacing revenue growth
+110bps y-o-y margin improvement, +110bps in the
quarter
Nearly 1K of new WS won in 2014 to deliver higher
margin solutions
$MM
306.6 278.6
1,206.1 1,184.8
Q4 2013 Q4 2014 FY 2013 FY 2014
49.9 48.4
161.1 172.1
Q4 2013 Q4 2014 FY 2013 FY 2014
CCY Growth
CCY Growth
+2.5%
+8.6%
+7.5%
+16.9%
Adj. EBITDA margin: 16.3% 17.4% 13.4% 14.5%
Adjusted EBITDA
$MM
16
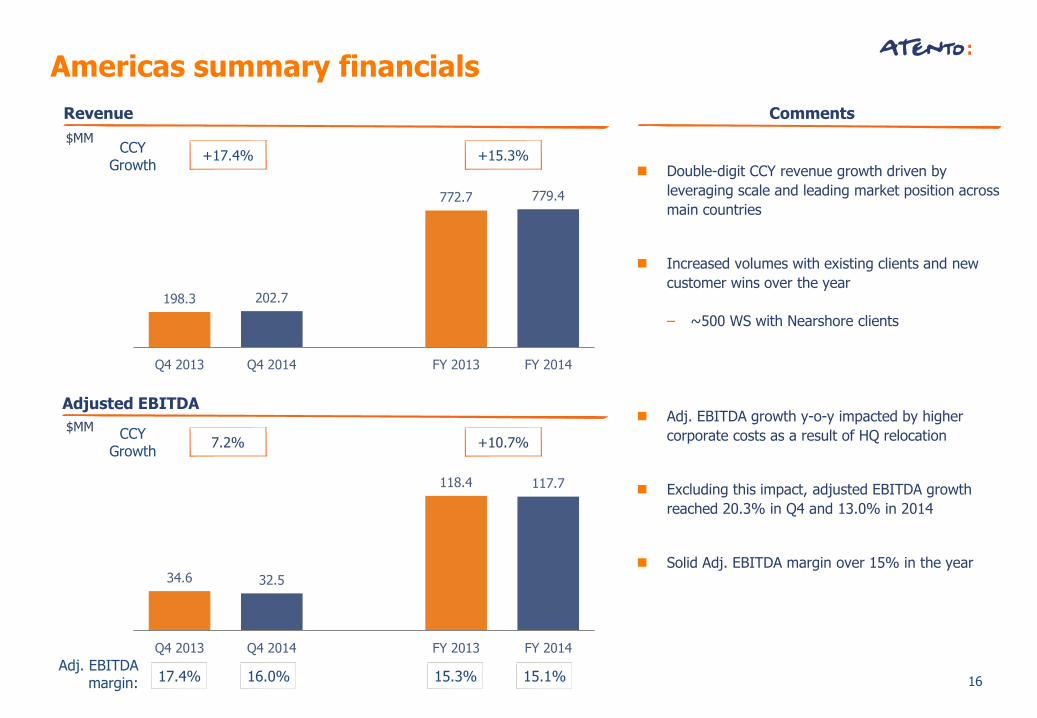
198.3 202.7
772.7 779.4
Q4 2013 Q4 2014 FY 2013 FY 2014
Americas summary financials
Double-digit CCY revenue growth driven by
leveraging scale and leading market position across
main countries
Increased volumes with existing clients and new
customer wins over the year
– ~500 WS with Nearshore clients
Adj. EBITDA growth y-o-y impacted by higher
corporate costs as a result of HQ relocation
Excluding this impact, adjusted EBITDA growth
reached 20.3% in Q4 and 13.0% in 2014
Solid Adj. EBITDA margin over 15% in the year
$MM
Revenue Comments
CCY Growth
CCY Growth
+17.4%
7.2%
+15.3%
+10.7%
34.6 32.5
118.4 117.7
Q4 2013 Q4 2014 FY 2013 FY 2014
Adj. EBITDA margin: 17.4% 16.0% 15.3% 15.1%
Adjusted EBITDA
$MM
17
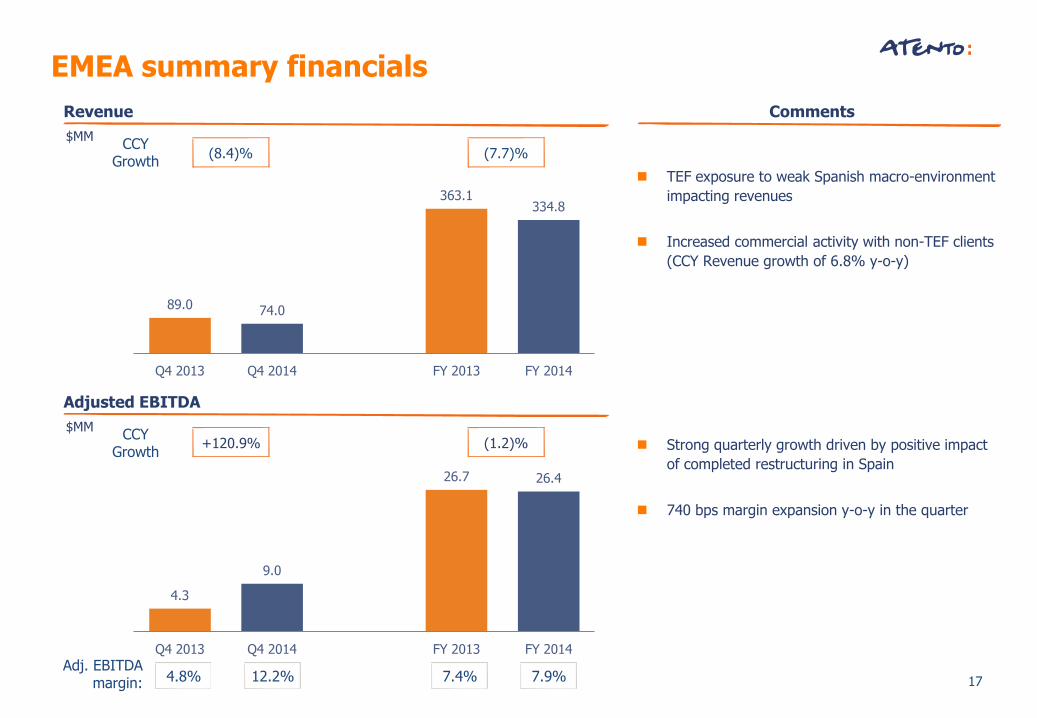
EMEA summary financials
Revenue Comments
TEF exposure to weak Spanish macro-environment
impacting revenues
Increased commercial activity with non-TEF clients
(CCY Revenue growth of 6.8% y-o-y)
Strong quarterly growth driven by positive impact
of completed restructuring in Spain
740 bps margin expansion y-o-y in the quarter
$MM CCY
Growth
CCY Growth
(8.4)%
+120.9%
(7.7)%
(1.2)%
89.0 74.0
363.1 334.8
Q4 2013 Q4 2014 FY 2013 FY 2014
4.3
9.0
26.7 26.4
Q4 2013 Q4 2014 FY 2013 FY 2014
Adj. EBITDA margin: 4.8% 12.2% 7.4% 7.9%
Adjusted EBITDA
$MM
18
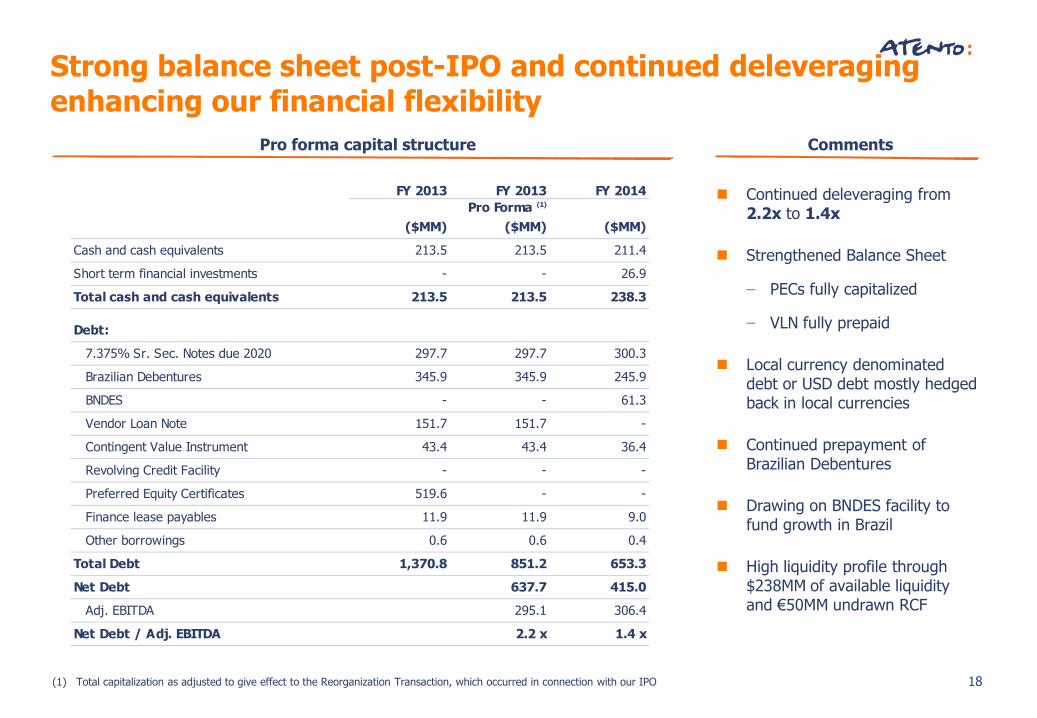
Strong balance sheet post-IPO and continued deleveraging enhancing our financial flexibility
Pro forma capital structure Comments
Continued deleveraging from 2.2x to 1.4x
Strengthened Balance Sheet
– PECs fully capitalized
– VLN fully prepaid
Local currency denominated debt or USD debt mostly hedged back in local currencies
Continued prepayment of Brazilian Debentures
Drawing on BNDES facility to fund growth in Brazil
High liquidity profile through $238MM of available liquidity and €50MM undrawn RCF
(1) Total capitalization as adjusted to give effect to the Reorganization Transaction, which occurred in connection with our IPO
FY 2013 FY 2013 FY 2014
Pro Forma (1)
($MM) ($MM) ($MM)
Cash and cash equivalents 213.5 213.5 211.4
Short term financial investments - - 26.9
Total cash and cash equivalents 213.5 213.5 238.3
Debt:
7.375% Sr. Sec. Notes due 2020 297.7 297.7 300.3
Brazilian Debentures 345.9 345.9 245.9
BNDES - - 61.3
Vendor Loan Note 151.7 151.7 -
Contingent Value Instrument 43.4 43.4 36.4
Revolving Credit Facility - - -
Preferred Equity Certificates 519.6 - -
Finance lease payables 11.9 11.9 9.0
Other borrowings 0.6 0.6 0.4
Total Debt 1,370.8 851.2 653.3
Net Debt 637.7 415.0
Adj. EBITDA 295.1 306.4
Net Debt / Adj. EBITDA 2.2 x 1.4 x
19
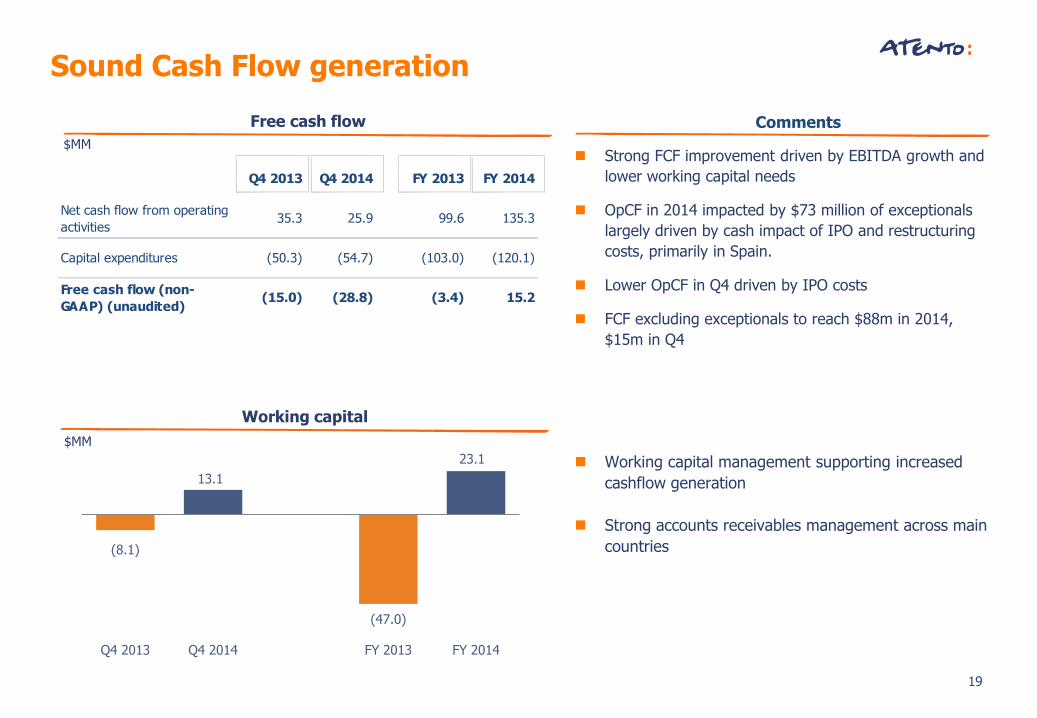
Sound Cash Flow generation
Free cash flow Comments
$MM Strong FCF improvement driven by EBITDA growth and
lower working capital needs
OpCF in 2014 impacted by $73 million of exceptionals
largely driven by cash impact of IPO and restructuring
costs, primarily in Spain.
Lower OpCF in Q4 driven by IPO costs
FCF excluding exceptionals to reach $88m in 2014,
$15m in Q4
Working capital
$MM
Working capital management supporting increased
cashflow generation
Strong accounts receivables management across main
countries
Q4 2013 Q4 2014 FY 2013 FY 2014
Net cash flow from operating
activities35.3 25.9 99.6 135.3
Capital expenditures (50.3) (54.7) (103.0) (120.1)
Free cash flow (non-
GAAP) (unaudited)(15.0) (28.8) (3.4) 15.2
(8.1)
13.1
(47.0)
23.1
Q4 2013 Q4 2014 FY 2013 FY 2014
20
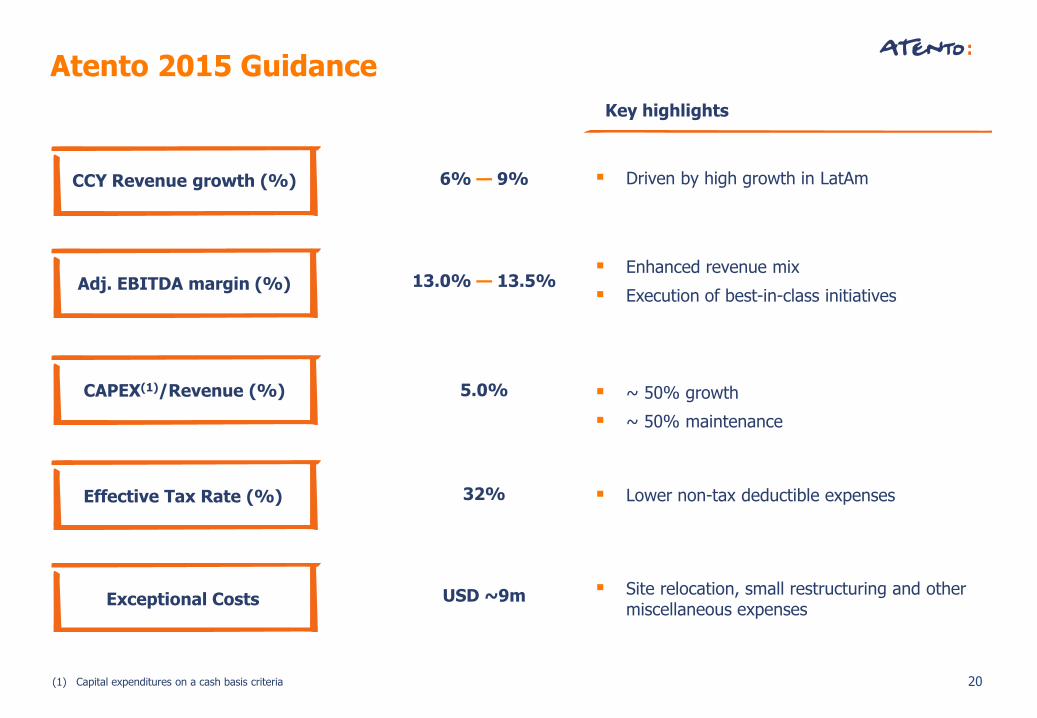
Atento 2015 Guidance
6% — 9%
CCY Revenue growth (%)
Adj. EBITDA margin (%)
CAPEX(1)/Revenue (%)
Effective Tax Rate (%)
Exceptional Costs
13.0% — 13.5%
5.0%
32%
USD ~9m
(1) Capital expenditures on a cash basis criteria
Driven by high growth in LatAm
Enhanced revenue mix
Execution of best-in-class initiatives
Lower non-tax deductible expenses
Site relocation, small restructuring and other miscellaneous expenses
Key highlights
~ 50% growth
~ 50% maintenance
21
Closing remarks
Solid growth performance, strong commercial pipeline and strengthened #1 market leadership, positions us favorably in the fast growing LatAm BPO CRM markets
I
Ability to deliver margin expansion fuelled by increased productivity and efficiencies
III Strengthened capital structure and continued deleverage providing for enhanced financial flexibility
II

Appendix
23
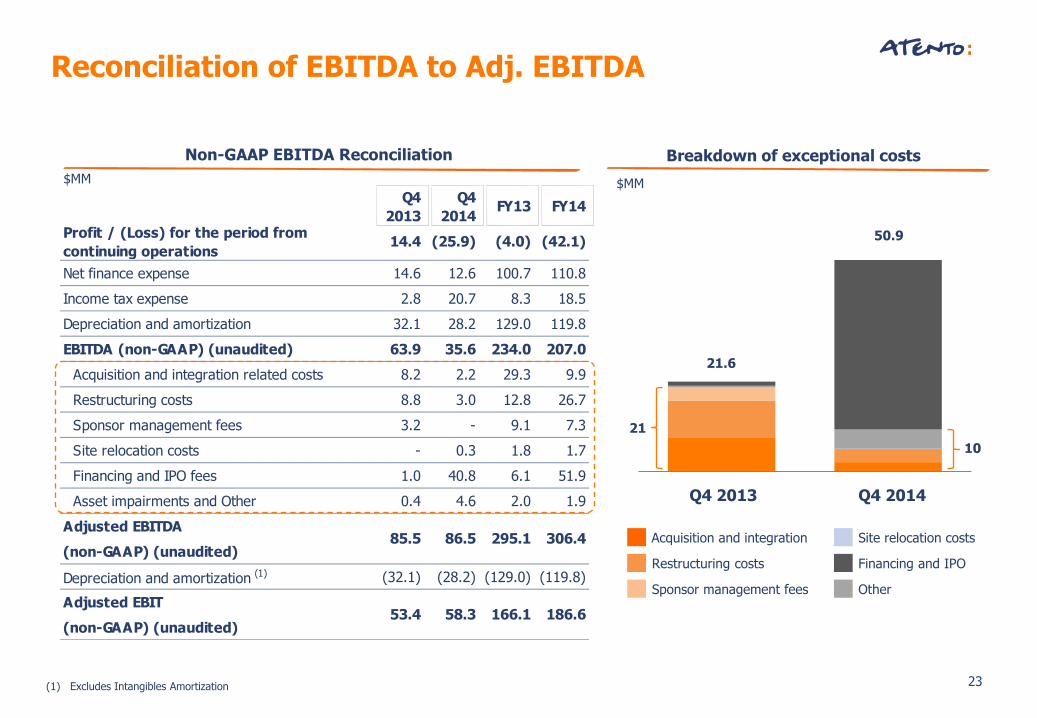
Q4
2013
Q4
2014FY13 FY14
Profit / (Loss) for the period from
continuing operations14.4 (25.9) (4.0) (42.1)
Net finance expense 14.6 12.6 100.7 110.8
Income tax expense 2.8 20.7 8.3 18.5
Depreciation and amortization 32.1 28.2 129.0 119.8
EBITDA (non-GAAP) (unaudited) 63.9 35.6 234.0 207.0
Acquisition and integration related costs 8.2 2.2 29.3 9.9
Restructuring costs 8.8 3.0 12.8 26.7
Sponsor management fees 3.2 - 9.1 7.3
Site relocation costs - 0.3 1.8 1.7
Financing and IPO fees 1.0 40.8 6.1 51.9
Asset impairments and Other 0.4 4.6 2.0 1.9
Adjusted EBITDA
(non-GAAP) (unaudited)
Depreciation and amortization (1) (32.1) (28.2) (129.0) (119.8)
Adjusted EBIT
(non-GAAP) (unaudited)
85.5 86.5 295.1 306.4
53.4 58.3 166.1 186.6
Reconciliation of EBITDA to Adj. EBITDA
Breakdown of exceptional costs
$MM
21.6
50.9
Non-GAAP EBITDA Reconciliation
$MM
(1) Excludes Intangibles Amortization
Acquisition and integration
Restructuring costs
Sponsor management fees
Site relocation costs
Financing and IPO
Other
Q4 2013 Q4 2014
21
10
24
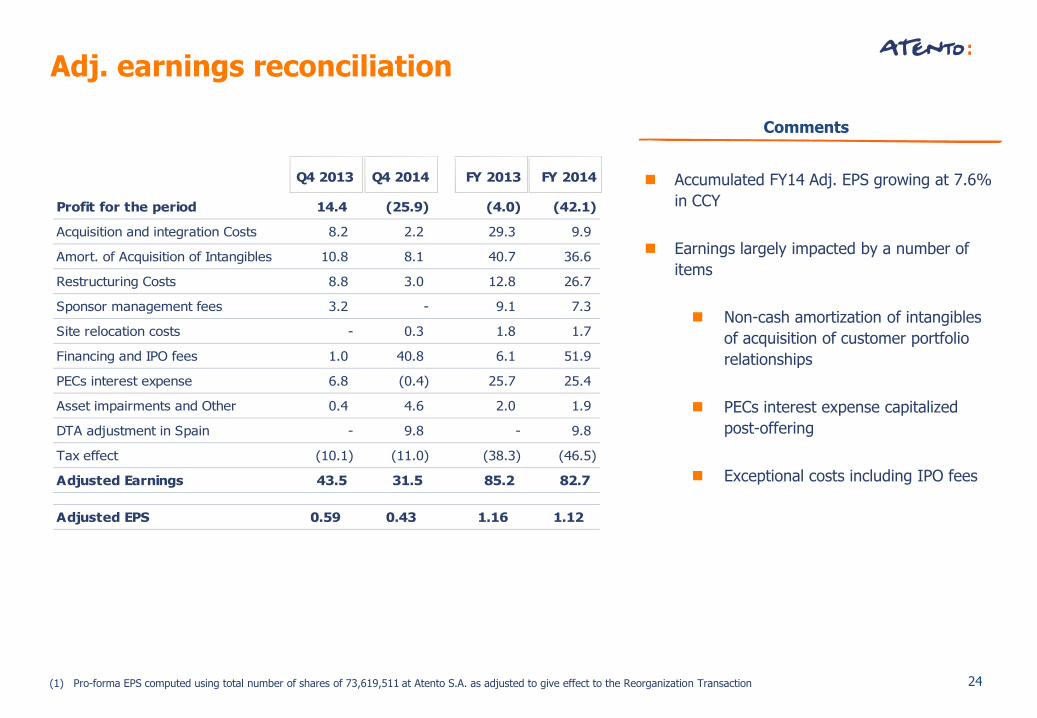
Adj. earnings reconciliation
Comments
Accumulated FY14 Adj. EPS growing at 7.6%
in CCY
Earnings largely impacted by a number of
items
Non-cash amortization of intangibles
of acquisition of customer portfolio
relationships
PECs interest expense capitalized
post-offering
Exceptional costs including IPO fees
(1) Pro-forma EPS computed using total number of shares of 73,619,511 at Atento S.A. as adjusted to give effect to the Reorganization Transaction
Q4 2013 Q4 2014 FY 2013 FY 2014
Profit for the period 14.4 (25.9) (4.0) (42.1)
Acquisition and integration Costs 8.2 2.2 29.3 9.9
Amort. of Acquisition of Intangibles 10.8 8.1 40.7 36.6
Restructuring Costs 8.8 3.0 12.8 26.7
Sponsor management fees 3.2 - 9.1 7.3
Site relocation costs - 0.3 1.8 1.7
Financing and IPO fees 1.0 40.8 6.1 51.9
PECs interest expense 6.8 (0.4) 25.7 25.4
Asset impairments and Other 0.4 4.6 2.0 1.9
DTA adjustment in Spain - 9.8 - 9.8
Tax effect (10.1) (11.0) (38.3) (46.5)
Adjusted Earnings 43.5 31.5 85.2 82.7
Adjusted EPS 0.59 0.43 1.16 1.12