Embed Size (px)
Citation preview
Interim Report January – June 2015Stockholm, July 17, 2015
Highlights of the second quarter of 2015 Read more
• Net sales increased to SEK 31,355m (26,330). 2• Sales increased by 19.1%, of which 7.0% was organic sales growth, 0.1% acquisitions and
12.0% currency translation. 3• Organic sales growth across all business areas. 4• Major Appliances EMEA continued to show strong improvement in earnings. 4• Sequential improvement of results for Major Appliances North America. 4• Good development for Professional Products and Major Appliances Asia/Pacific. 5,6• Strong cash flow of SEK 3.1 billion. 7• Operating income amounted to SEK 921m (63), corresponding to a margin of 2.9% (0.2). 3• Income for the period was SEK 608m (-92), and earnings per share was SEK 2.12 (-0.32). 13
Financial overview1)
SEKm First half 2014 First half 2015 Change, % Q2 2014 Q2 2015 Change, %
Net sales 51,959 60,442 16 26,330 31,355 19Organic growth, % 0.2 3.2 –3.8 7.0Acquired growth, % — 0.1 — 0.1Changes in exchange rates, % –2.2 13.0 –1.1 12.0Operating income 794 1,437 81 63 921 1,362Margin, % 1.5 2.4 0.2 2.9Income after financial items 455 1,265 178 –120 815 n.m.Income for the period 339 947 179 –92 608 n.m.Earnings per share, SEK2) 1.18 3.30 –0.32 2.12Operating cash flow after investments3) 3,184 2,724 -14 3,307 3,107 -6Restructuring costs included above4) –1,122 — –1,104 —
1) As of 2015, the accounting practice of items affecting comparability for restructuring charges is no longer used. Restructuring charges have previously been presented separately in the income statement and excluded in operating income by business area and selective key ratios. For comparability purposes, the figures for 2014 have been restated to include restructuring costs. For a specification, see page 17 and the press release; Restated figures for Electrolux for 2014, March 30, 2015 on www.electroluxgroup.com2) Basic based on an average of 287.4 (286.3) million shares for the second quarter, excluding shares held by Electrolux.3) See page 7.4) Previously reported as items affecting comparability and excluded in this financial overview.
About Electrolux
Electrolux is a global leader in household appliances and appliances for professional use, selling more than 50 million products to customers in more than 150 markets every year. The company makes thoughtfully designed, innovative solutions based on extensive consumer research, meeting the desires of today’s consumers and professionals. Electrolux products include refrigerators, dishwashers, washing machines, cookers, air-conditioners and small appliances such as vacuum cleaners, all sold under esteemed brands like Electrolux, AEG, Zanussi and Frigidaire. In 2014, Electrolux had sales of SEK 112 billion and about 60,000 employees. For more information, go to www.electroluxgroup.com
AB Electrolux (publ) 556009-4178
2INTERIM REPORT JANUARY–JUNE 2015
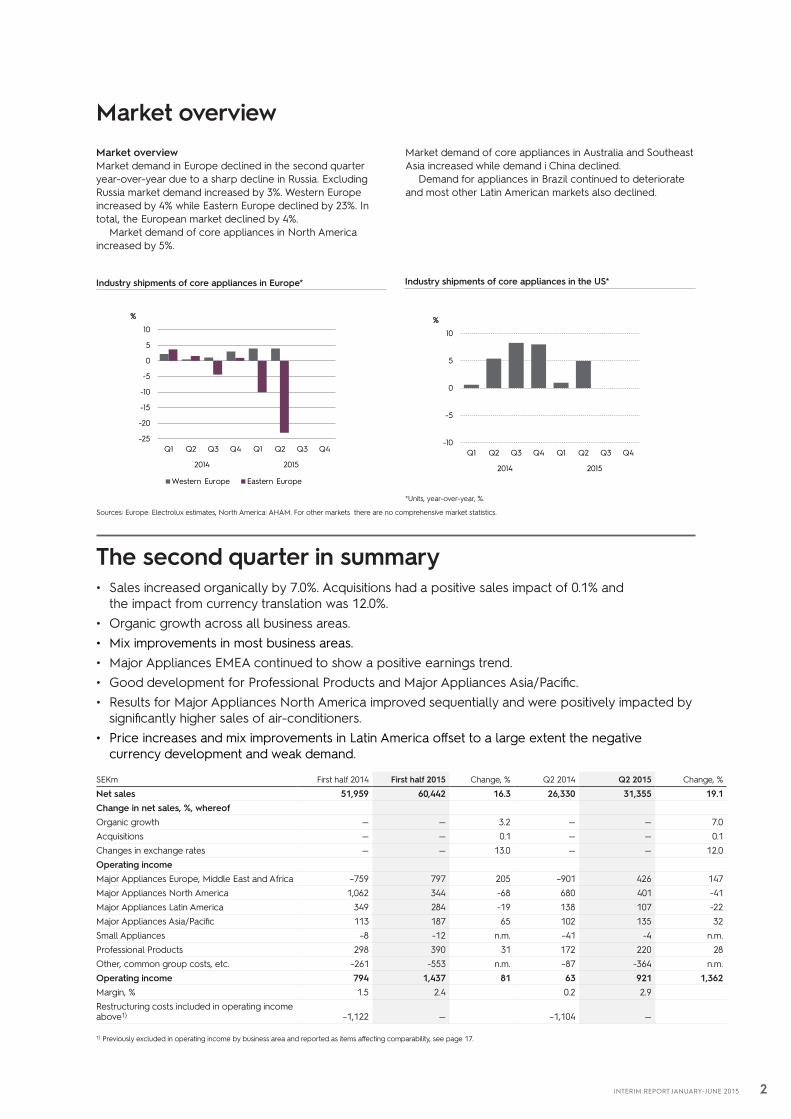
Market overviewMarket overviewMarket demand in Europe declined in the second quarter year-over-year due to a sharp decline in Russia. Excluding Russia market demand increased by 3%. Western Europe increased by 4% while Eastern Europe declined by 23%. In total, the European market declined by 4%.
Market demand of core appliances in North America increased by 5%.
Market demand of core appliances in Australia and Southeast Asia increased while demand i China declined.
Demand for appliances in Brazil continued to deteriorate and most other Latin American markets also declined.
The second quarter in summary• Sales increased organically by 7.0%. Acquisitions had a positive sales impact of 0.1% and
the impact from currency translation was 12.0%.• Organic growth across all business areas. • Mix improvements in most business areas.• Major Appliances EMEA continued to show a positive earnings trend.• Good development for Professional Products and Major Appliances Asia/Pacific.• Results for Major Appliances North America improved sequentially and were positively impacted by
significantly higher sales of air-conditioners. • Price increases and mix improvements in Latin America offset to a large extent the negative
currency development and weak demand.
SEKm First half 2014 First half 2015 Change, % Q2 2014 Q2 2015 Change, %
Net sales 51,959 60,442 16.3 26,330 31,355 19.1Change in net sales, %, whereof Organic growth — — 3.2 — — 7.0Acquisitions — — 0.1 — — 0.1Changes in exchange rates — — 13.0 — — 12.0Operating incomeMajor Appliances Europe, Middle East and Africa –759 797 205 –901 426 147Major Appliances North America 1,062 344 -68 680 401 -41Major Appliances Latin America 349 284 -19 138 107 -22Major Appliances Asia/Pacific 113 187 65 102 135 32Small Appliances –8 -12 n.m. –41 -4 n.m.Professional Products 298 390 31 172 220 28Other, common group costs, etc. –261 -553 n.m. –87 -364 n.m.Operating income 794 1,437 81 63 921 1,362Margin, % 1.5 2.4 0.2 2.9Restructuring costs included in operating income above1) –1,122 — –1,104 —
1) Previously excluded in operating income by business area and reported as items affecting comparability, see page 17.
Industry shipments of core appliances in Europe* Industry shipments of core appliances in the US*
*Units, year-over-year, %.
Sources: Europe: Electrolux estimates, North America: AHAM. For other markets there are no comprehensive market statistics.
-10
-5
0
5
10
Q1 Q2 Q3 Q4 Q1 Q2 Q3 Q4
2014 2015
%
-25
-20
-15
-10
-5
0
5
10
Q1 Q2 Q3 Q4 Q1 Q2 Q3 Q4
2014 2015
%
Western Europe Eastern Europe
3INTERIM REPORT JANUARY–JUNE 2015
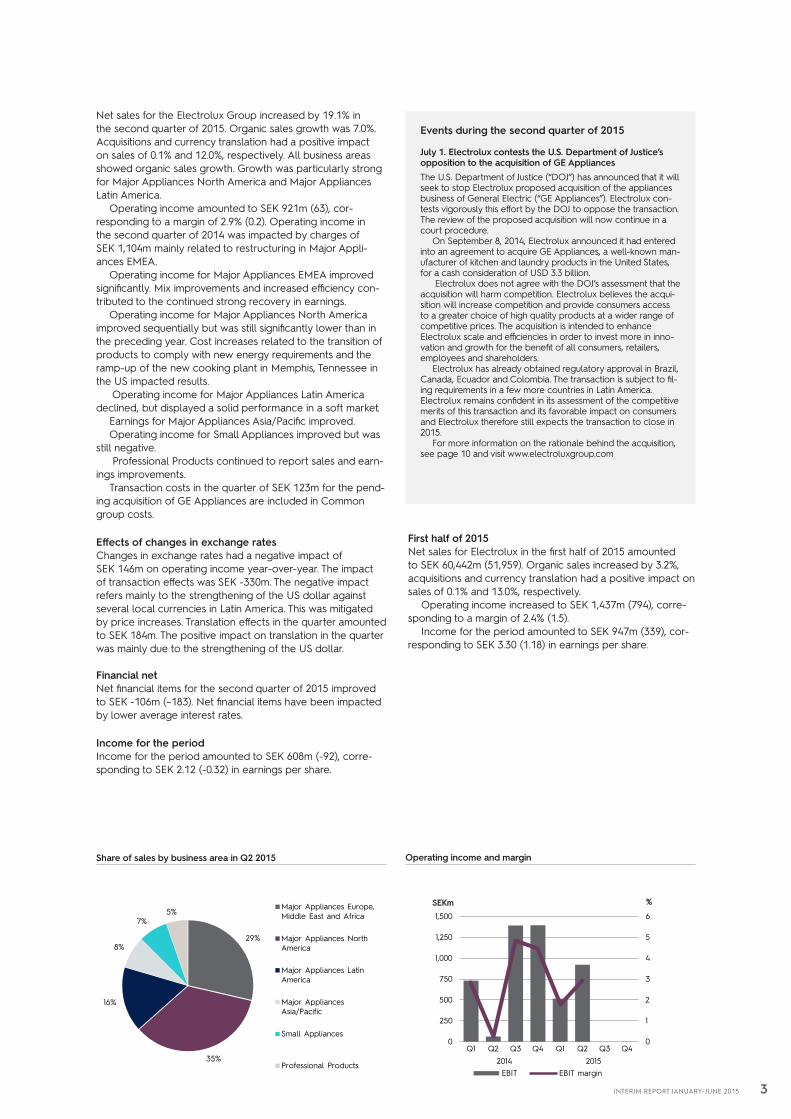
Net sales for the Electrolux Group increased by 19.1% in the second quarter of 2015. Organic sales growth was 7.0%. Acquisitions and currency translation had a positive impact on sales of 0.1% and 12.0%, respectively. All business areas showed organic sales growth. Growth was particularly strong for Major Appliances North America and Major Appliances Latin America.
Operating income amounted to SEK 921m (63), cor-responding to a margin of 2.9% (0.2). Operating income in the second quarter of 2014 was impacted by charges of SEK 1,104m mainly related to restructuring in Major Appli-ances EMEA.
Operating income for Major Appliances EMEA improved significantly. Mix improvements and increased efficiency con-tributed to the continued strong recovery in earnings.
Operating income for Major Appliances North America improved sequentially but was still significantly lower than in the preceding year. Cost increases related to the transition of products to comply with new energy requirements and the ramp-up of the new cooking plant in Memphis, Tennessee in the US impacted results.
Operating income for Major Appliances Latin America declined, but displayed a solid performance in a soft market.
Earnings for Major Appliances Asia/Pacific improved. Operating income for Small Appliances improved but was
still negative. Professional Products continued to report sales and earn-
ings improvements. Transaction costs in the quarter of SEK 123m for the pend-
ing acquisition of GE Appliances are included in Common group costs.
Effects of changes in exchange ratesChanges in exchange rates had a negative impact of SEK 146m on operating income year-over-year. The impact of transaction effects was SEK -330m. The negative impact refers mainly to the strengthening of the US dollar against several local currencies in Latin America. This was mitigated by price increases. Translation effects in the quarter amounted to SEK 184m. The positive impact on translation in the quarter was mainly due to the strengthening of the US dollar.
Financial netNet financial items for the second quarter of 2015 improved to SEK -106m (–183). Net financial items have been impacted by lower average interest rates.
Income for the periodIncome for the period amounted to SEK 608m (-92), corre-sponding to SEK 2.12 (-0.32) in earnings per share.
Share of sales by business area in Q2 2015 Operating income and margin
Events during the second quarter of 2015
July 1. Electrolux contests the U.S. Department of Justice’s opposition to the acquisition of GE AppliancesThe U.S. Department of Justice (“DOJ”) has announced that it will seek to stop Electrolux proposed acquisition of the appliances business of General Electric (“GE Appliances”). Electrolux con-tests vigorously this effort by the DOJ to oppose the transaction. The review of the proposed acquisition will now continue in a court procedure.
On September 8, 2014, Electrolux announced it had entered into an agreement to acquire GE Appliances, a well-known man-ufacturer of kitchen and laundry products in the United States, for a cash consideration of USD 3.3 billion.
Electrolux does not agree with the DOJ’s assessment that the acquisition will harm competition. Electrolux believes the acqui-sition will increase competition and provide consumers access to a greater choice of high quality products at a wider range of competitive prices. The acquisition is intended to enhance Electrolux scale and efficiencies in order to invest more in inno-vation and growth for the benefit of all consumers, retailers, employees and shareholders.
Electrolux has already obtained regulatory approval in Brazil, Canada, Ecuador and Colombia. The transaction is subject to fil-ing requirements in a few more countries in Latin America. Electrolux remains confident in its assessment of the competitive merits of this transaction and its favorable impact on consumers and Electrolux therefore still expects the transaction to close in 2015.
For more information on the rationale behind the acquisition, see page 10 and visit www.electroluxgroup.com
First half of 2015 Net sales for Electrolux in the first half of 2015 amounted to SEK 60,442m (51,959). Organic sales increased by 3.2%, acquisitions and currency translation had a positive impact on sales of 0.1% and 13.0%, respectively.
Operating income increased to SEK 1,437m (794), corre-sponding to a margin of 2.4% (1.5).
Income for the period amounted to SEK 947m (339), cor-responding to SEK 3.30 (1.18) in earnings per share.
29%
35%
16%
8%
7%5%
Major Appliances Europe,Middle East and Africa
Major Appliances NorthAmerica
Major Appliances LatinAmerica
Major AppliancesAsia/Pacific
Small Appliances
Professional Products
0
1
2
3
4
5
6
0
250
500
750
1,000
1,250
1,500
Q1 Q2 Q3 Q4 Q1 Q2 Q3 Q42014 2015
%SEKm
EBIT EBIT margin
4INTERIM REPORT JANUARY–JUNE 2015
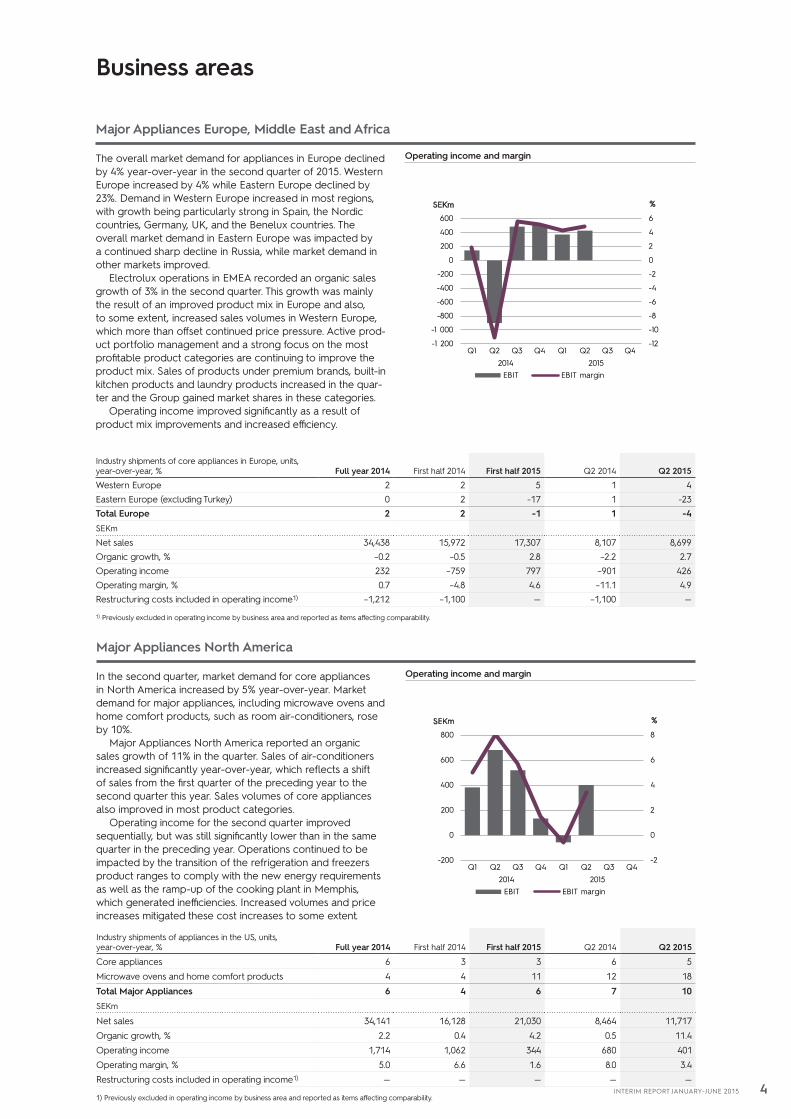
Major Appliances Europe, Middle East and Africa
The overall market demand for appliances in Europe declined by 4% year-over-year in the second quarter of 2015. Western Europe increased by 4% while Eastern Europe declined by 23%. Demand in Western Europe increased in most regions, with growth being particularly strong in Spain, the Nordic countries, Germany, UK, and the Benelux countries. The overall market demand in Eastern Europe was impacted by a continued sharp decline in Russia, while market demand in other markets improved.
Electrolux operations in EMEA recorded an organic sales growth of 3% in the second quarter. This growth was mainly the result of an improved product mix in Europe and also, to some extent, increased sales volumes in Western Europe, which more than offset continued price pressure. Active prod-uct portfolio management and a strong focus on the most profitable product categories are continuing to improve the product mix. Sales of products under premium brands, built-in kitchen products and laundry products increased in the quar-ter and the Group gained market shares in these categories.
Operating income improved significantly as a result of product mix improvements and increased efficiency.
Operating income and margin
Major Appliances North America
In the second quarter, market demand for core appliances in North America increased by 5% year-over-year. Market demand for major appliances, including microwave ovens and home comfort products, such as room air-conditioners, rose by 10%.
Major Appliances North America reported an organic sales growth of 11% in the quarter. Sales of air-conditioners increased significantly year-over-year, which reflects a shift of sales from the first quarter of the preceding year to the second quarter this year. Sales volumes of core appliances also improved in most product categories.
Operating income for the second quarter improved sequentially, but was still significantly lower than in the same quarter in the preceding year. Operations continued to be impacted by the transition of the refrigeration and freezers product ranges to comply with the new energy requirements as well as the ramp-up of the cooking plant in Memphis, which generated inefficiencies. Increased volumes and price increases mitigated these cost increases to some extent.
Operating income and margin
Business areas
Industry shipments of core appliances in Europe, units, year-over-year, % Full year 2014 First half 2014 First half 2015 Q2 2014 Q2 2015
Western Europe 2 2 5 1 4Eastern Europe (excluding Turkey) 0 2 -17 1 -23Total Europe 2 2 -1 1 -4SEKm
Net sales 34,438 15,972 17,307 8,107 8,699Organic growth, % –0.2 –0.5 2.8 –2.2 2.7Operating income 232 –759 797 –901 426Operating margin, % 0.7 –4.8 4.6 –11.1 4.9Restructuring costs included in operating income1) –1,212 –1,100 — –1,100 —
1) Previously excluded in operating income by business area and reported as items affecting comparability.
Industry shipments of appliances in the US, units, year-over-year, % Full year 2014 First half 2014 First half 2015 Q2 2014 Q2 2015
Core appliances 6 3 3 6 5Microwave ovens and home comfort products 4 4 11 12 18Total Major Appliances 6 4 6 7 10SEKm
Net sales 34,141 16,128 21,030 8,464 11,717Organic growth, % 2.2 0.4 4.2 0.5 11.4Operating income 1,714 1,062 344 680 401Operating margin, % 5.0 6.6 1.6 8.0 3.4Restructuring costs included in operating income1) — — — — —
1) Previously excluded in operating income by business area and reported as items affecting comparability.
-12
-10
-8
-6
-4
-2
0
2
4
6
-1 200
-1 000
-800
-600
-400
-200
0
200
400
600
Q1 Q2 Q3 Q4 Q1 Q2 Q3 Q42014 2015
%SEKm
EBIT EBIT margin
-2
0
2
4
6
8
-200
0
200
400
600
800
Q1 Q2 Q3 Q4 Q1 Q2 Q3 Q42014 2015
%SEKm
EBIT EBIT margin
5INTERIM REPORT JANUARY–JUNE 2015
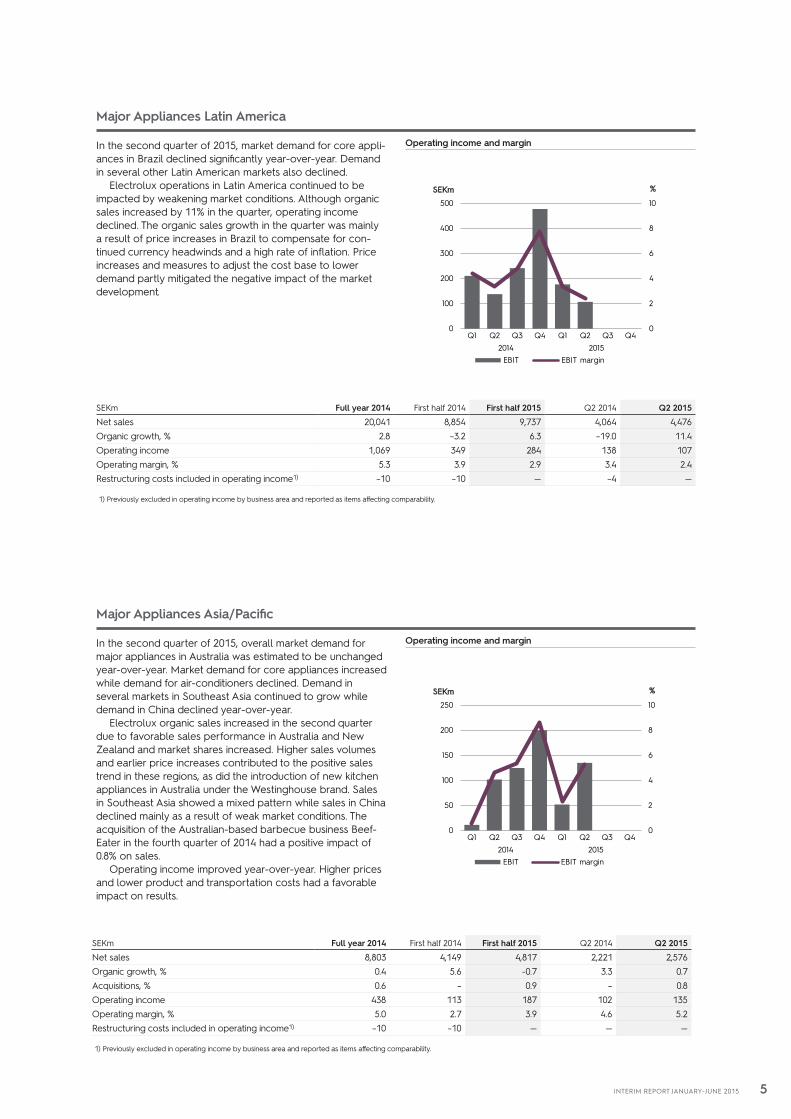
Major Appliances Latin America
In the second quarter of 2015, market demand for core appli-ances in Brazil declined significantly year-over-year. Demand in several other Latin American markets also declined.
Electrolux operations in Latin America continued to be impacted by weakening market conditions. Although organic sales increased by 11% in the quarter, operating income declined. The organic sales growth in the quarter was mainly a result of price increases in Brazil to compensate for con-tinued currency headwinds and a high rate of inflation. Price increases and measures to adjust the cost base to lower demand partly mitigated the negative impact of the market development.
Operating income and margin
Major Appliances Asia/Pacific
In the second quarter of 2015, overall market demand for major appliances in Australia was estimated to be unchanged year-over-year. Market demand for core appliances increased while demand for air-conditioners declined. Demand in several markets in Southeast Asia continued to grow while demand in China declined year-over-year.
Electrolux organic sales increased in the second quarter due to favorable sales performance in Australia and New Zealand and market shares increased. Higher sales volumes and earlier price increases contributed to the positive sales trend in these regions, as did the introduction of new kitchen appliances in Australia under the Westinghouse brand. Sales in Southeast Asia showed a mixed pattern while sales in China declined mainly as a result of weak market conditions. The acquisition of the Australian-based barbecue business Beef-Eater in the fourth quarter of 2014 had a positive impact of 0.8% on sales.
Operating income improved year-over-year. Higher prices and lower product and transportation costs had a favorable impact on results.
Operating income and margin
SEKm Full year 2014 First half 2014 First half 2015 Q2 2014 Q2 2015
Net sales 20,041 8,854 9,737 4,064 4,476Organic growth, % 2.8 –3.2 6.3 –19.0 11.4Operating income 1,069 349 284 138 107Operating margin, % 5.3 3.9 2.9 3.4 2.4Restructuring costs included in operating income1) –10 –10 — –4 —
1) Previously excluded in operating income by business area and reported as items affecting comparability.
SEKm Full year 2014 First half 2014 First half 2015 Q2 2014 Q2 2015
Net sales 8,803 4,149 4,817 2,221 2,576Organic growth, % 0.4 5.6 -0.7 3.3 0.7Acquisitions, % 0.6 – 0.9 – 0.8Operating income 438 113 187 102 135Operating margin, % 5.0 2.7 3.9 4.6 5.2Restructuring costs included in operating income1) –10 –10 — — —
1) Previously excluded in operating income by business area and reported as items affecting comparability.
0
2
4
6
8
10
0
100
200
300
400
500
Q1 Q2 Q3 Q4 Q1 Q2 Q3 Q42014 2015
%SEKm
EBIT EBIT margin
0
2
4
6
8
10
0
50
100
150
200
250
Q1 Q2 Q3 Q4 Q1 Q2 Q3 Q42014 2015
%SEKm
EBIT EBIT margin
6INTERIM REPORT JANUARY–JUNE 2015
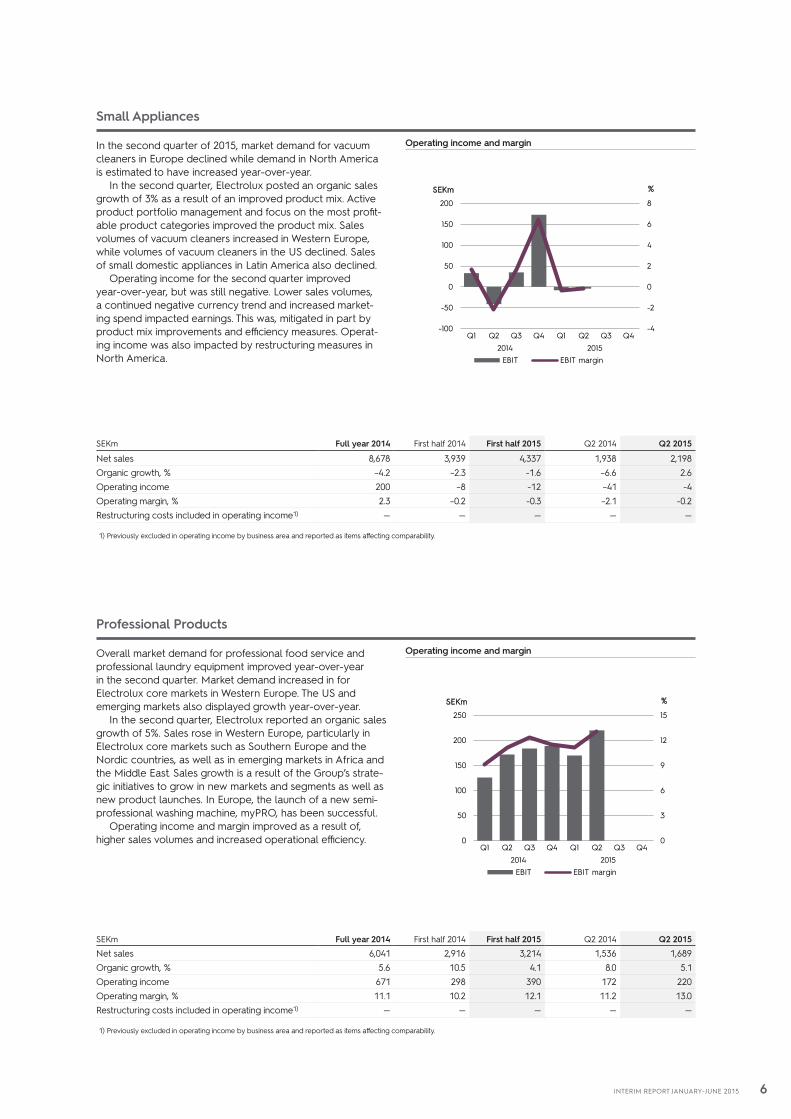
Small Appliances
In the second quarter of 2015, market demand for vacuum cleaners in Europe declined while demand in North America is estimated to have increased year-over-year.
In the second quarter, Electrolux posted an organic sales growth of 3% as a result of an improved product mix. Active product portfolio management and focus on the most profit-able product categories improved the product mix. Sales volumes of vacuum cleaners increased in Western Europe, while volumes of vacuum cleaners in the US declined. Sales of small domestic appliances in Latin America also declined.
Operating income for the second quarter improved year-over-year, but was still negative. Lower sales volumes, a continued negative currency trend and increased market-ing spend impacted earnings. This was, mitigated in part by product mix improvements and efficiency measures. Operat-ing income was also impacted by restructuring measures in North America.
Operating income and margin
Professional Products
Overall market demand for professional food service and professional laundry equipment improved year-over-year in the second quarter. Market demand increased in for Electrolux core markets in Western Europe. The US and emerging markets also displayed growth year-over-year.
In the second quarter, Electrolux reported an organic sales growth of 5%. Sales rose in Western Europe, particularly in Electrolux core markets such as Southern Europe and the Nordic countries, as well as in emerging markets in Africa and the Middle East. Sales growth is a result of the Group’s strate-gic initiatives to grow in new markets and segments as well as new product launches. In Europe, the launch of a new semi-professional washing machine, myPRO, has been successful.
Operating income and margin improved as a result of, higher sales volumes and increased operational efficiency.
Operating income and margin
SEKm Full year 2014 First half 2014 First half 2015 Q2 2014 Q2 2015
Net sales 8,678 3,939 4,337 1,938 2,198Organic growth, % –4.2 –2.3 -1.6 –6.6 2.6Operating income 200 –8 -12 –41 -4Operating margin, % 2.3 –0.2 -0.3 –2.1 -0.2Restructuring costs included in operating income1) — — — — —
1) Previously excluded in operating income by business area and reported as items affecting comparability.
SEKm Full year 2014 First half 2014 First half 2015 Q2 2014 Q2 2015
Net sales 6,041 2,916 3,214 1,536 1,689Organic growth, % 5.6 10.5 4.1 8.0 5.1Operating income 671 298 390 172 220Operating margin, % 11.1 10.2 12.1 11.2 13.0Restructuring costs included in operating income1) — — — — —
1) Previously excluded in operating income by business area and reported as items affecting comparability.
-4
-2
0
2
4
6
8
-100
-50
0
50
100
150
200
Q1 Q2 Q3 Q4 Q1 Q2 Q3 Q42014 2015
%SEKm
EBIT EBIT margin
0
3
6
9
12
15
0
50
100
150
200
250
Q1 Q2 Q3 Q4 Q1 Q2 Q3 Q42014 2015
%SEKm
EBIT EBIT margin
7INTERIM REPORT JANUARY–JUNE 2015
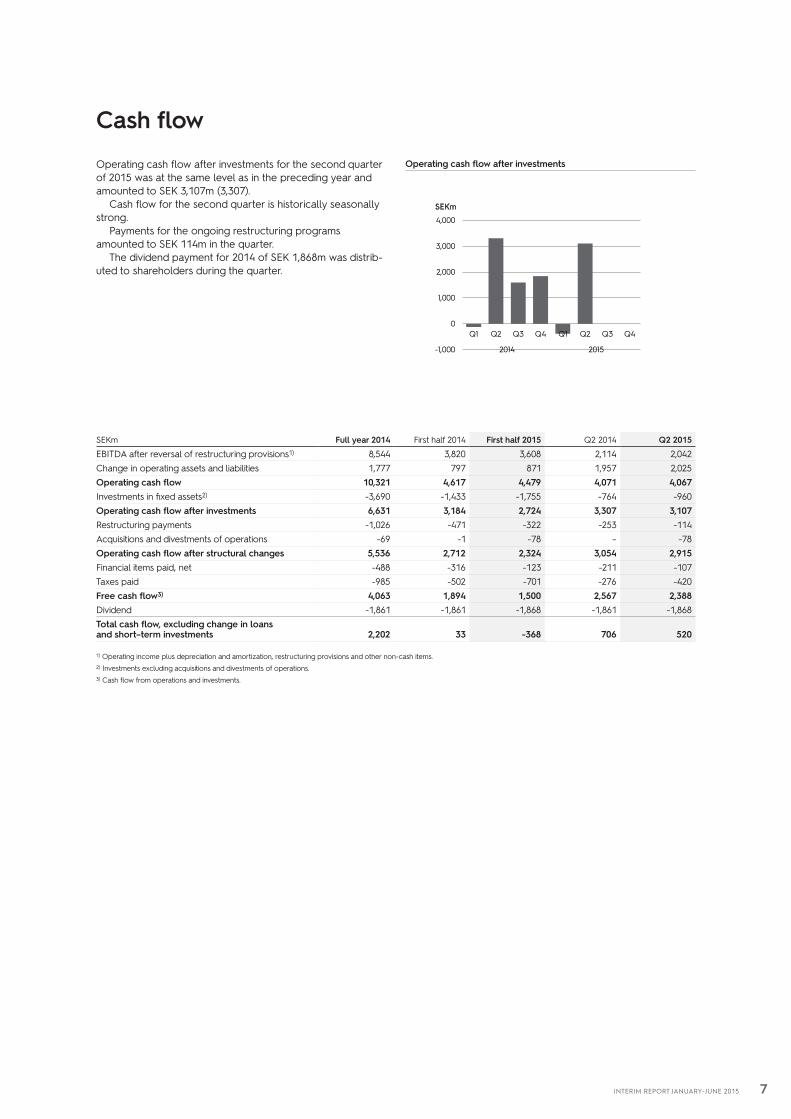
Cash flow
SEKm Full year 2014 First half 2014 First half 2015 Q2 2014 Q2 2015
EBITDA after reversal of restructuring provisions1) 8,544 3,820 3,608 2,114 2,042Change in operating assets and liabilities 1,777 797 871 1,957 2,025Operating cash flow 10,321 4,617 4,479 4,071 4,067Investments in fixed assets2) -3,690 -1,433 -1,755 -764 -960Operating cash flow after investments 6,631 3,184 2,724 3,307 3,107Restructuring payments -1,026 -471 -322 -253 -114Acquisitions and divestments of operations -69 -1 -78 – -78Operating cash flow after structural changes 5,536 2,712 2,324 3,054 2,915Financial items paid, net -488 -316 -123 -211 -107Taxes paid -985 -502 -701 -276 -420Free cash flow3) 4,063 1,894 1,500 2,567 2,388Dividend -1,861 -1,861 -1,868 -1,861 -1,868Total cash flow, excluding change in loans and short–term investments 2,202 33 -368 706 520
1) Operating income plus depreciation and amortization, restructuring provisions and other non-cash items.2) Investments excluding acquisitions and divestments of operations.3) Cash flow from operations and investments.
Operating cash flow after investments for the second quarter of 2015 was at the same level as in the preceding year and amounted to SEK 3,107m (3,307).
Cash flow for the second quarter is historically seasonally strong.
Payments for the ongoing restructuring programs amounted to SEK 114m in the quarter.
The dividend payment for 2014 of SEK 1,868m was distrib-uted to shareholders during the quarter.
Operating cash flow after investments
-1,000
0
1,000
2,000
3,000
4,000
Q1 Q2 Q3 Q4 Q1 Q2 Q3 Q4
2014 2015
SEKm
8INTERIM REPORT JANUARY–JUNE 2015
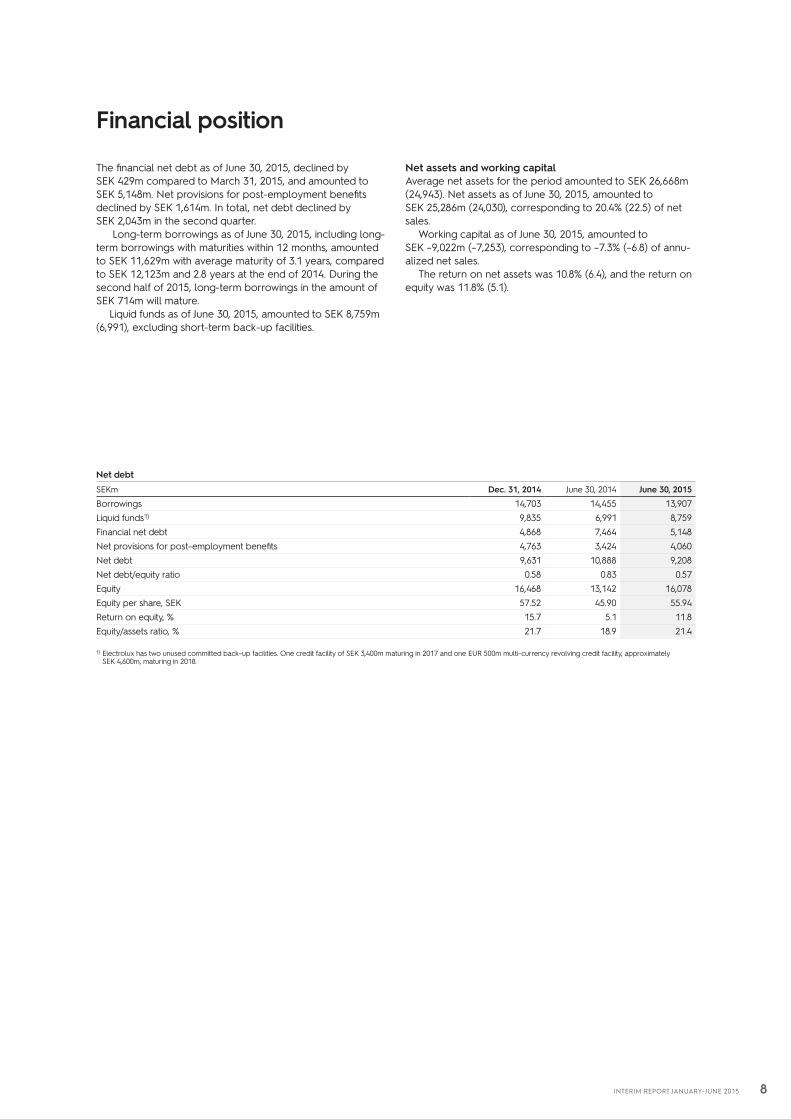
Financial position
The financial net debt as of June 30, 2015, declined by SEK 429m compared to March 31, 2015, and amounted to SEK 5,148m. Net provisions for post-employment benefits declined by SEK 1,614m. In total, net debt declined by SEK 2,043m in the second quarter.
Long-term borrowings as of June 30, 2015, including long-term borrowings with maturities within 12 months, amounted to SEK 11,629m with average maturity of 3.1 years, compared to SEK 12,123m and 2.8 years at the end of 2014. During the second half of 2015, long-term borrowings in the amount of SEK 714m will mature.
Liquid funds as of June 30, 2015, amounted to SEK 8,759m (6,991), excluding short-term back-up facilities.
Net debtSEKm Dec. 31, 2014 June 30, 2014 June 30, 2015
Borrowings 14,703 14,455 13,907Liquid funds1) 9,835 6,991 8,759Financial net debt 4,868 7,464 5,148Net provisions for post– employment benefits 4,763 3,424 4,060Net debt 9,631 10,888 9,208Net debt/equity ratio 0.58 0.83 0.57Equity 16,468 13,142 16,078Equity per share, SEK 57.52 45.90 55.94Return on equity, % 15.7 5.1 11.8Equity/assets ratio, % 21.7 18.9 21.4
1) Electrolux has two unused committed back–up facilities. One credit facility of SEK 3,400m maturing in 2017 and one EUR 500m multi–currency revolving credit facility, approximately SEK 4,600m, maturing in 2018.
Net assets and working capital Average net assets for the period amounted to SEK 26,668m (24,943). Net assets as of June 30, 2015, amounted to SEK 25,286m (24,030), corresponding to 20.4% (22.5) of net sales.
Working capital as of June 30, 2015, amounted to SEK –9,022m (–7,253), corresponding to –7.3% (–6.8) of annu-alized net sales.
The return on net assets was 10.8% (6.4), and the return on equity was 11.8% (5.1).
9INTERIM REPORT JANUARY–JUNE 2015
Asbestos litigation in the US Litigation and claims related to asbestos are pending against the Group in the US. Almost all of the cases refer to exter-nally supplied components used in industrial products man-ufactured by discontinued operations prior to the early 1970s. The cases involve plaintiffs who have made substan-tially identical allegations against other defendants who are not part of the Electrolux Group.
As of June 30, 2015, the Group had a total of 3,201 (2,966) cases pending, representing approximately 3,260 (approxi-mately 3,034) plaintiffs. During the second quarter of 2015, 312 new cases with 312 plaintiffs were filed and 222 pending cases with approximately 222 plaintiffs were resolved.
It is expected that additional lawsuits will be filed against Electrolux. It is not possible to predict the number of future lawsuits.
In addition, the outcome of asbestos lawsuits is difficult to predict and Electrolux cannot provide any assurances that the resolution of these types of lawsuits will not have a material adverse effect on its business or on results of operations in the future.
As an international group with a wide geographic spread, Electrolux is exposed to a number of business and financial risks. The business risks can be divided into strategic, opera-tional and legal risks. The financial risks are related to such factors as exchange rates, interest rates, liquidity, the giving of credit and financial instruments.
Risk management in Electrolux aims to identify, control and reduce risks. This work begins with the description of risks and
risk management, see the 2014 Annual Report on page 66. No significant risks other than the risks described there are judged to have occurred.
Risks, risk management and risk exposure are described in more detail in the Annual Report 2014, www.electrolux.com/annualreport2014
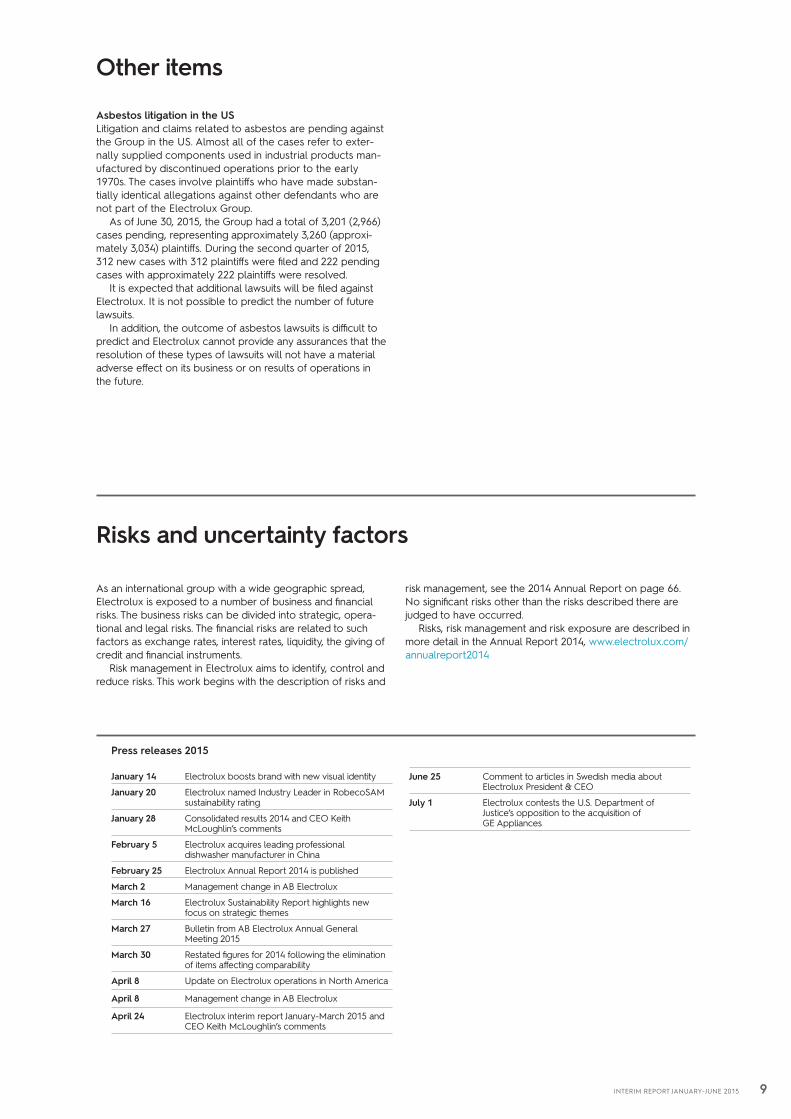
Press releases 2015
January 14 Electrolux boosts brand with new visual identity
January 20 Electrolux named Industry Leader in RobecoSAM sustainability rating
January 28 Consolidated results 2014 and CEO Keith McLoughlin’s comments
February 5 Electrolux acquires leading professional dishwasher manufacturer in China
February 25 Electrolux Annual Report 2014 is published
March 2 Management change in AB Electrolux
March 16 Electrolux Sustainability Report highlights new focus on strategic themes
March 27 Bulletin from AB Electrolux Annual General Meeting 2015
March 30 Restated figures for 2014 following the elimination of items affecting comparability
April 8 Update on Electrolux operations in North America
April 8 Management change in AB Electrolux
April 24 Electrolux interim report January-March 2015 and CEO Keith McLoughlin’s comments
June 25 Comment to articles in Swedish media about Electrolux President & CEO
July 1 Electrolux contests the U.S. Department of Justice’s opposition to the acquisition of GE Appliances
Risks and uncertainty factors
Other items
10INTERIM REPORT JANUARY–JUNE 2015
Acquisition of GE Appliances
On September 8, 2014, Electrolux announced it has entered into an agreement to acquire the appliance business of General Electric (“GE Appliances”), one of the premier manufacturers of kitchen and laundry products in the United States, for a cash consideration of USD 3.3 billion. The acquisi-tion enhances Electrolux position as a global player in home appliances, offering an unparalleled opportunity to invest in innovation and growth, which will benefit consumers, retailers, employees and shareholders.
On July 1, 2015, the U.S. Department of Justice (“DOJ”) announced that it will seek to stop Electrolux proposed acquisition of the appliances business of GE Appliances. Electrolux contests vigorously this effort by the DOJ to oppose the transaction. The review of the proposed acquisi-tion will continue in a court procedure. Electrolux remains confident in its assessment of the competitive merits of this transaction and its favorable impact on consumers and Electrolux therefore still expects the transaction to close in 2015.
Highlights - Attractive strategic fit in North America.- Significant synergies, primarily in sourcing and operations.- Cash consideration of USD 3.3 billion.- Transaction expected to be EPS accretive from year one.- Financing is provided by a committed bridge facility and the transaction is not subject to any financing conditions. A rights issue corresponding to approximately 25% of the consider-ation is planned following completion of the acquisition.- Completion of the acquisition is mainly subject to regulatory approvals.
Transaction rationale and synergies The acquisition of GE Appliances is an important step for Electrolux towards realizing the Group’s vision: to be the best appliance company in the world as measured by customers, employees and shareholders.
The scale and efficiencies from combining the businesses create a solid financial foundation from which to drive growth in the increasingly global and competitive appliance indus-try. The Electrolux Group will further strengthen its capacity to invest in innovation and growth. Electrolux has secured the right to the GE Appliances’ brands through a long term license agreement with GE.
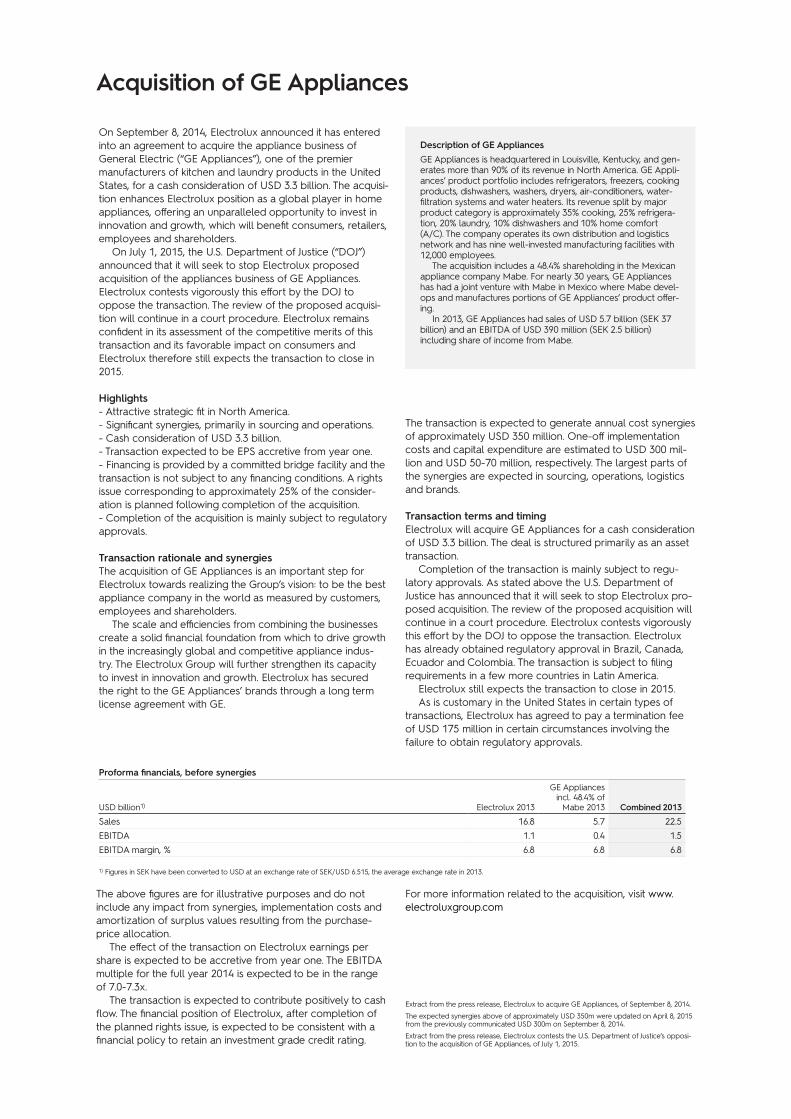
Proforma financials, before synergies
USD billion1) Electrolux 2013
GE Appliances incl. 48.4% of Mabe 2013 Combined 2013
Sales 16.8 5.7 22.5EBITDA 1.1 0.4 1.5EBITDA margin, % 6.8 6.8 6.8
1) Figures in SEK have been converted to USD at an exchange rate of SEK/USD 6.515, the average exchange rate in 2013.
Description of GE Appliances GE Appliances is headquartered in Louisville, Kentucky, and gen-erates more than 90% of its revenue in North America. GE Appli-ances’ product portfolio includes refrigerators, freezers, cooking products, dishwashers, washers, dryers, air-conditioners, water-filtration systems and water heaters. Its revenue split by major product category is approximately 35% cooking, 25% refrigera-tion, 20% laundry, 10% dishwashers and 10% home comfort (A/C). The company operates its own distribution and logistics network and has nine well-invested manufacturing facilities with 12,000 employees.
The acquisition includes a 48.4% shareholding in the Mexican appliance company Mabe. For nearly 30 years, GE Appliances has had a joint venture with Mabe in Mexico where Mabe devel-ops and manufactures portions of GE Appliances’ product offer-ing.
In 2013, GE Appliances had sales of USD 5.7 billion (SEK 37 billion) and an EBITDA of USD 390 million (SEK 2.5 billion) including share of income from Mabe.
The above figures are for illustrative purposes and do not include any impact from synergies, implementation costs and amortization of surplus values resulting from the purchase-price allocation.
The effect of the transaction on Electrolux earnings per share is expected to be accretive from year one. The EBITDA multiple for the full year 2014 is expected to be in the range of 7.0-7.3x.
The transaction is expected to contribute positively to cash flow. The financial position of Electrolux, after completion of the planned rights issue, is expected to be consistent with a financial policy to retain an investment grade credit rating.
For more information related to the acquisition, visit www.electroluxgroup.com
Extract from the press release, Electrolux to acquire GE Appliances, of September 8, 2014.
The expected synergies above of approximately USD 350m were updated on April 8, 2015 from the previously communicated USD 300m on September 8, 2014.
Extract from the press release, Electrolux contests the U.S. Department of Justice’s opposi-tion to the acquisition of GE Appliances, of July 1, 2015.
The transaction is expected to generate annual cost synergies of approximately USD 350 million. One-off implementation costs and capital expenditure are estimated to USD 300 mil-lion and USD 50-70 million, respectively. The largest parts of the synergies are expected in sourcing, operations, logistics and brands.
Transaction terms and timingElectrolux will acquire GE Appliances for a cash consideration of USD 3.3 billion. The deal is structured primarily as an asset transaction.
Completion of the transaction is mainly subject to regu-latory approvals. As stated above the U.S. Department of Justice has announced that it will seek to stop Electrolux pro-posed acquisition. The review of the proposed acquisition will continue in a court procedure. Electrolux contests vigorously this effort by the DOJ to oppose the transaction. Electrolux has already obtained regulatory approval in Brazil, Canada, Ecuador and Colombia. The transaction is subject to filing requirements in a few more countries in Latin America.
Electrolux still expects the transaction to close in 2015. As is customary in the United States in certain types of
transactions, Electrolux has agreed to pay a termination fee of USD 175 million in certain circumstances involving the failure to obtain regulatory approvals.
11INTERIM REPORT JANUARY–JUNE 2015
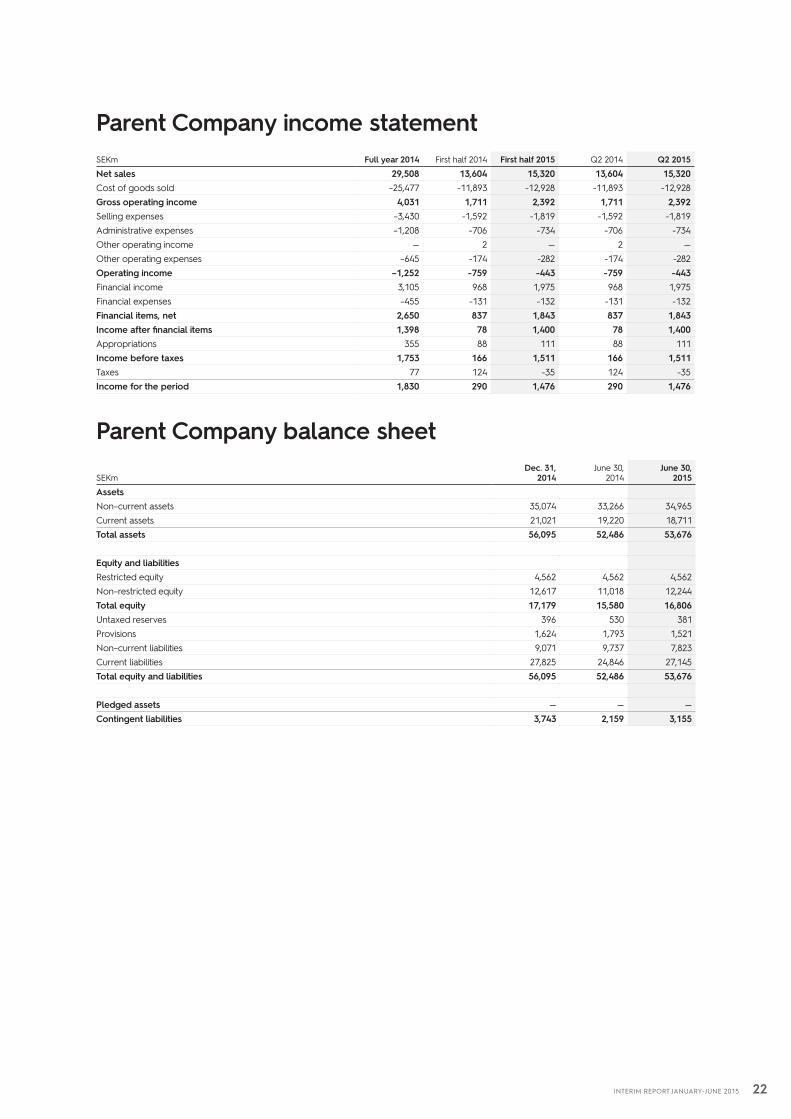
The Parent Company comprises the functions of the Group’s head office, as well as five companies operating on a commis-sion basis for AB Electrolux.
Net sales for the Parent Company AB Electrolux in the first half of 2015 amounted to SEK 15,320m (13,604) of which SEK 12,338m (10,945) referred to sales to Group companies and SEK 2,982m (2,659) to external customers. Income after financial items was SEK 1,843m (837), including dividends from subsidiaries in the amount of SEK 1,708m (774). Income for the period amounted to SEK 1,476m (290).
Capital expenditure in tangible and intangible assets was SEK 101m (166). Liquid funds at the end of the period amounted to SEK 4,632m, as against SEK 4,601m at the start of the year.
Undistributed earnings in the Parent Company at the end of the period amounted to SEK 12,244m, as against SEK 12,617m at the start of the year. Dividend payment to shareholders for 2014 amounted to SEK 1,868m.
The income statement and balance sheet for the Parent Company are presented on page 22.
Accounting and valuation principlesElectrolux applies International Financial Reporting Standards (IFRS) as adopted by the European Union. This report has been prepared in accordance with IAS 34, Interim Financial Reporting, and ÅRL, the Swedish Annual Accounts Act and recommendation RFR 2, Accounting for legal entities, issued by the Swedish Financial Reporting Board. There are no changes in the Group’s accounting and valuation principles com-pared with the accounting and valuation principles described in Note 1 of the Annual Report 2014.
This report has not been audited.
Parent Company AB Electrolux
12INTERIM REPORT JANUARY–JUNE 2015
The Board of Directors and the President and CEO certify that the Interim Report for the period January – June 2015 gives a true and fair overview of the Parent Company AB Electrolux and the Group’s operations, their financial position and results of operations, and describes significant risks and uncertainties facing the Parent Company and other companies in the Group..
Stockholm, July 16, 2015
Ronnie LetenChairman of the Board of Directors
Torben Ballegaard Sørensen Deputy Chairman of the Board of Directors
Lorna Davis Petra Hedengran Hasse Johansson Board member Board member Board member
Keith McLoughlin Bert Nordberg Fredrik Persson Board member, President and CEO Board member Board member
Ulrika Saxon Board member
Ola Bertilsson Gunilla Brandt Ulf Carlsson Board member, Board member, Board member, employee representative employee representative employee representative
13INTERIM REPORT JANUARY–JUNE 2015
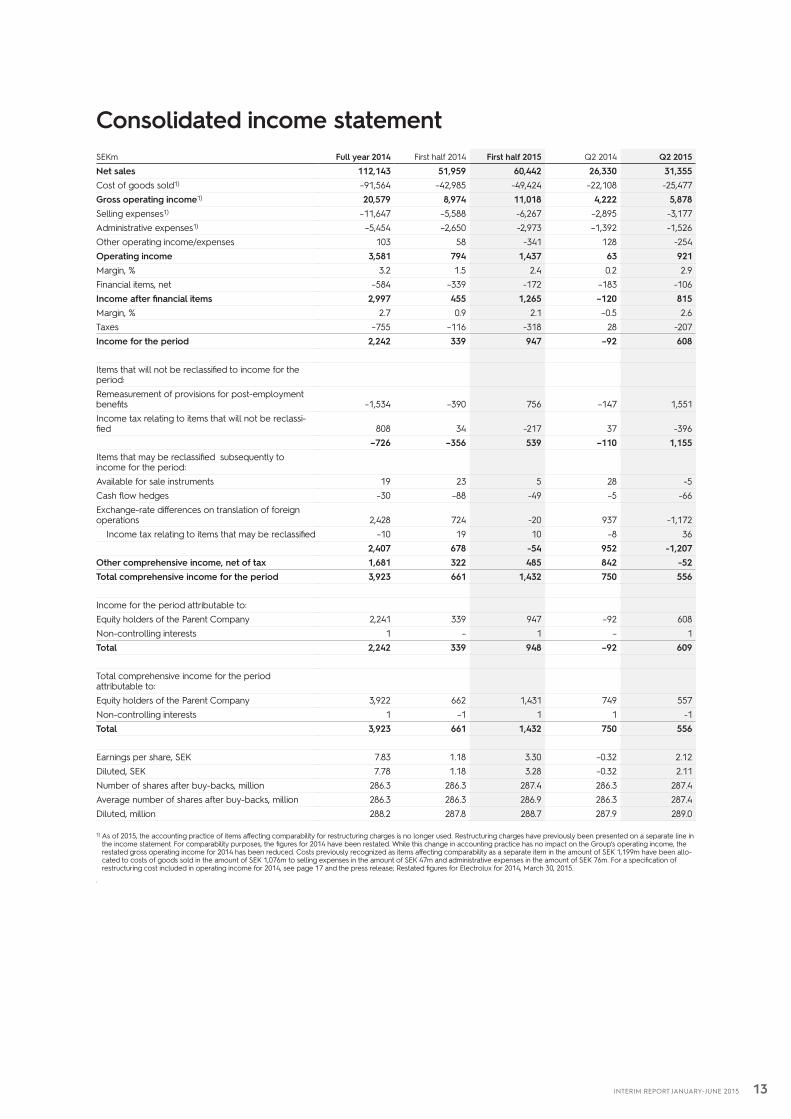
Consolidated income statementSEKm Full year 2014 First half 2014 First half 2015 Q2 2014 Q2 2015
Net sales 112,143 51,959 60,442 26,330 31,355Cost of goods sold1) –91,564 –42,985 -49,424 –22,108 -25,477Gross operating income1) 20,579 8,974 11,018 4,222 5,878Selling expenses1) –11,647 –5,588 -6,267 –2,895 -3,177Administrative expenses1) –5,454 –2,650 -2,973 –1,392 -1,526Other operating income/expenses 103 58 -341 128 -254Operating income 3,581 794 1,437 63 921Margin, % 3.2 1.5 2.4 0.2 2.9Financial items, net –584 –339 -172 –183 -106Income after financial items 2,997 455 1,265 –120 815Margin, % 2.7 0.9 2.1 –0.5 2.6Taxes –755 –116 -318 28 -207Income for the period 2,242 339 947 –92 608
Items that will not be reclassified to income for the period:Remeasurement of provisions for post-employment benefits –1,534 –390 756 –147 1,551Income tax relating to items that will not be reclassi-fied 808 34 -217 37 -396
–726 –356 539 –110 1,155Items that may be reclassified subsequently to income for the period:Available for sale instruments 19 23 5 28 -5Cash flow hedges –30 –88 -49 –5 -66Exchange-rate differences on translation of foreign operations 2,428 724 -20 937 -1,172
Income tax relating to items that may be reclassified –10 19 10 –8 362,407 678 -54 952 -1,207
Other comprehensive income, net of tax 1,681 322 485 842 -52Total comprehensive income for the period 3,923 661 1,432 750 556
Income for the period attributable to:Equity holders of the Parent Company 2,241 339 947 –92 608Non-controlling interests 1 – 1 – 1Total 2,242 339 948 –92 609
Total comprehensive income for the periodattributable to:Equity holders of the Parent Company 3,922 662 1,431 749 557Non-controlling interests 1 –1 1 1 -1Total 3,923 661 1,432 750 556
Earnings per share, SEK 7.83 1.18 3.30 –0.32 2.12Diluted, SEK 7.78 1.18 3.28 –0.32 2.11Number of shares after buy-backs, million 286.3 286.3 287.4 286.3 287.4Average number of shares after buy-backs, million 286.3 286.3 286.9 286.3 287.4Diluted, million 288.2 287.8 288.7 287.9 289.0
1) As of 2015, the accounting practice of items affecting comparability for restructuring charges is no longer used. Restructuring charges have previously been presented on a separate line in the income statement. For comparability purposes, the figures for 2014 have been restated. While this change in accounting practice has no impact on the Group’s operating income, the restated gross operating income for 2014 has been reduced. Costs previously recognized as items affecting comparability as a separate item in the amount of SEK 1,199m have been allo-cated to costs of goods sold in the amount of SEK 1,076m to selling expenses in the amount of SEK 47m and administrative expenses in the amount of SEK 76m. For a specification of restructuring cost included in operating income for 2014, see page 17 and the press release; Restated figures for Electrolux for 2014, March 30, 2015.
.
14INTERIM REPORT JANUARY–JUNE 2015
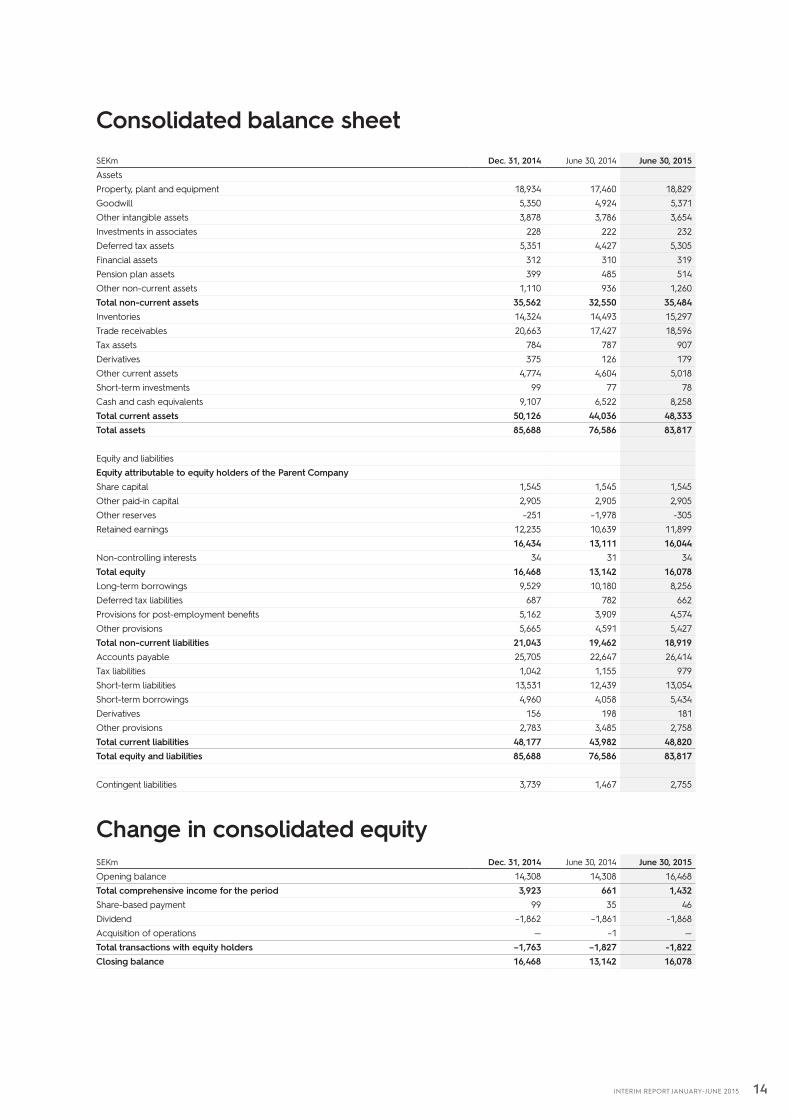
Consolidated balance sheetSEKm Dec. 31, 2014 June 30, 2014 June 30, 2015
AssetsProperty, plant and equipment 18,934 17,460 18,829Goodwill 5,350 4,924 5,371Other intangible assets 3,878 3,786 3,654Investments in associates 228 222 232Deferred tax assets 5,351 4,427 5,305Financial assets 312 310 319Pension plan assets 399 485 514Other non-current assets 1,110 936 1,260Total non-current assets 35,562 32,550 35,484Inventories 14,324 14,493 15,297Trade receivables 20,663 17,427 18,596Tax assets 784 787 907Derivatives 375 126 179Other current assets 4,774 4,604 5,018Short-term investments 99 77 78Cash and cash equivalents 9,107 6,522 8,258Total current assets 50,126 44,036 48,333Total assets 85,688 76,586 83,817
Equity and liabilitiesEquity attributable to equity holders of the Parent CompanyShare capital 1,545 1,545 1,545Other paid-in capital 2,905 2,905 2,905Other reserves –251 –1,978 -305Retained earnings 12,235 10,639 11,899
16,434 13,111 16,044Non-controlling interests 34 31 34Total equity 16,468 13,142 16,078Long-term borrowings 9,529 10,180 8,256Deferred tax liabilities 687 782 662Provisions for post-employment benefits 5,162 3,909 4,574Other provisions 5,665 4,591 5,427Total non-current liabilities 21,043 19,462 18,919Accounts payable 25,705 22,647 26,414Tax liabilities 1,042 1,155 979Short-term liabilities 13,531 12,439 13,054Short-term borrowings 4,960 4,058 5,434Derivatives 156 198 181Other provisions 2,783 3,485 2,758Total current liabilities 48,177 43,982 48,820Total equity and liabilities 85,688 76,586 83,817
Contingent liabilities 3,739 1,467 2,755
Change in consolidated equitySEKm Dec. 31, 2014 June 30, 2014 June 30, 2015
Opening balance 14,308 14,308 16,468Total comprehensive income for the period 3,923 661 1,432Share-based payment 99 35 46Dividend –1,862 –1,861 -1,868Acquisition of operations — –1 —Total transactions with equity holders –1,763 –1,827 -1,822Closing balance 16,468 13,142 16,078
15INTERIM REPORT JANUARY–JUNE 2015
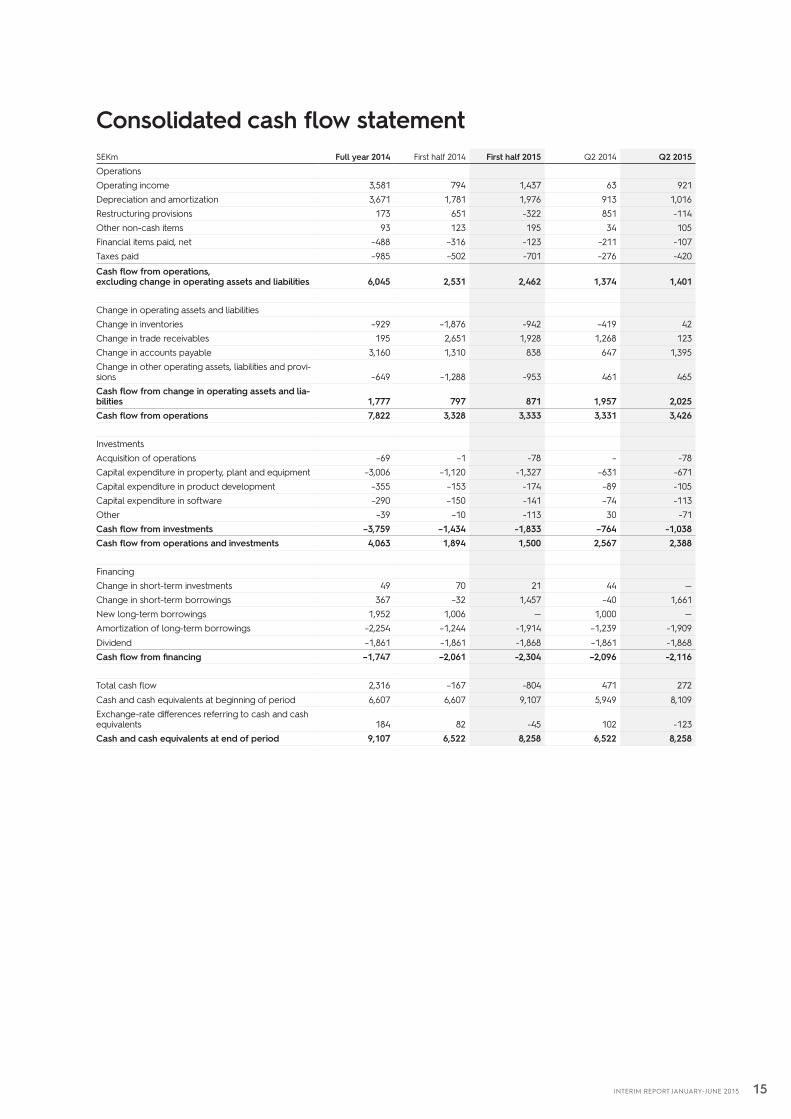
Consolidated cash flow statementSEKm Full year 2014 First half 2014 First half 2015 Q2 2014 Q2 2015
OperationsOperating income 3,581 794 1,437 63 921Depreciation and amortization 3,671 1,781 1,976 913 1,016Restructuring provisions 173 651 -322 851 -114Other non-cash items 93 123 195 34 105Financial items paid, net –488 –316 -123 –211 -107Taxes paid –985 –502 -701 –276 -420
Cash flow from operations, excluding change in operating assets and liabilities 6,045 2,531 2,462 1,374 1,401
Change in operating assets and liabilitiesChange in inventories –929 –1,876 -942 –419 42Change in trade receivables 195 2,651 1,928 1,268 123Change in accounts payable 3,160 1,310 838 647 1,395Change in other operating assets, liabilities and provi-sions –649 –1,288 -953 461 465Cash flow from change in operating assets and lia-bilities 1,777 797 871 1,957 2,025Cash flow from operations 7,822 3,328 3,333 3,331 3,426
InvestmentsAcquisition of operations –69 –1 -78 – -78Capital expenditure in property, plant and equipment –3,006 –1,120 -1,327 –631 -671Capital expenditure in product development –355 –153 -174 –89 -105Capital expenditure in software –290 –150 -141 –74 -113Other –39 –10 -113 30 -71Cash flow from investments –3,759 –1,434 -1,833 –764 -1,038Cash flow from operations and investments 4,063 1,894 1,500 2,567 2,388
FinancingChange in short-term investments 49 70 21 44 —Change in short-term borrowings 367 –32 1,457 –40 1,661New long-term borrowings 1,952 1,006 — 1,000 —Amortization of long-term borrowings –2,254 –1,244 -1,914 –1,239 -1,909Dividend –1,861 –1,861 -1,868 –1,861 -1,868Cash flow from financing –1,747 –2,061 -2,304 –2,096 -2,116
Total cash flow 2,316 –167 -804 471 272Cash and cash equivalents at beginning of period 6,607 6,607 9,107 5,949 8,109Exchange-rate differences referring to cash and cash equivalents 184 82 -45 102 -123Cash and cash equivalents at end of period 9,107 6,522 8,258 6,522 8,258
16INTERIM REPORT JANUARY–JUNE 2015
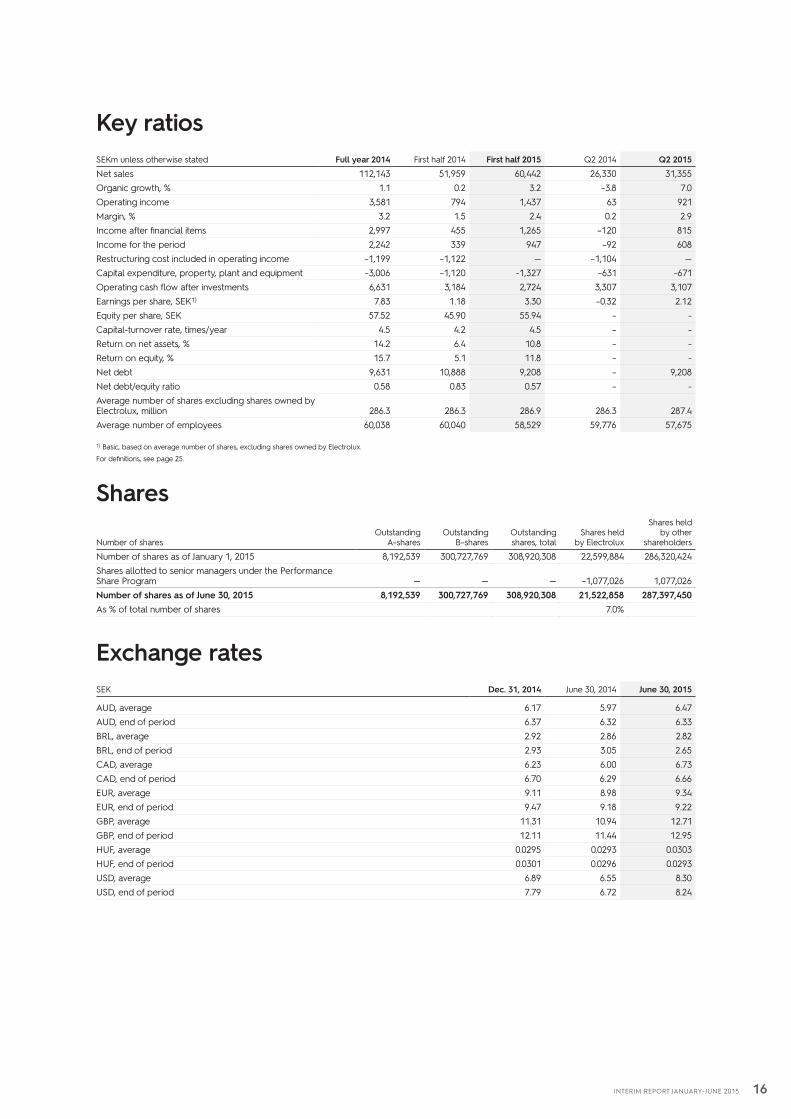
Key ratiosSEKm unless otherwise stated Full year 2014 First half 2014 First half 2015 Q2 2014 Q2 2015
Net sales 112,143 51,959 60,442 26,330 31,355Organic growth, % 1.1 0.2 3.2 –3.8 7.0Operating income 3,581 794 1,437 63 921Margin, % 3.2 1.5 2.4 0.2 2.9Income after financial items 2,997 455 1,265 –120 815Income for the period 2,242 339 947 –92 608Restructuring cost included in operating income –1,199 –1,122 — –1,104 —Capital expenditure, property, plant and equipment –3,006 –1,120 -1,327 –631 -671Operating cash flow after investments 6,631 3,184 2,724 3,307 3,107Earnings per share, SEK1) 7.83 1.18 3.30 –0.32 2.12Equity per share, SEK 57.52 45.90 55.94 – -Capital-turnover rate, times/year 4.5 4.2 4.5 – -Return on net assets, % 14.2 6.4 10.8 – -Return on equity, % 15.7 5.1 11.8 – -Net debt 9,631 10,888 9,208 – 9,208Net debt/equity ratio 0.58 0.83 0.57 – -Average number of shares excluding shares owned by Electrolux, million 286.3 286.3 286.9 286.3 287.4Average number of employees 60,038 60,040 58,529 59,776 57,675
1) Basic, based on average number of shares, excluding shares owned by Electrolux.
For definitions, see page 25.
Shares
Number of sharesOutstanding
A–sharesOutstanding
B–sharesOutstandingshares, total
Shares held by Electrolux
Shares held by other
shareholders
Number of shares as of January 1, 2015 8,192,539 300,727,769 308,920,308 22,599,884 286,320,424Shares allotted to senior managers under the Performance Share Program — — — –1,077,026 1,077,026Number of shares as of June 30, 2015 8,192,539 300,727,769 308,920,308 21,522,858 287,397,450As % of total number of shares 7.0%
Exchange ratesSEK Dec. 31, 2014 June 30, 2014 June 30, 2015
AUD, average 6.17 5.97 6.47AUD, end of period 6.37 6.32 6.33BRL, average 2.92 2.86 2.82BRL, end of period 2.93 3.05 2.65CAD, average 6.23 6.00 6.73CAD, end of period 6.70 6.29 6.66EUR, average 9.11 8.98 9.34EUR, end of period 9.47 9.18 9.22GBP, average 11.31 10.94 12.71GBP, end of period 12.11 11.44 12.95HUF, average 0.0295 0.0293 0.0303HUF, end of period 0.0301 0.0296 0.0293USD, average 6.89 6.55 8.30USD, end of period 7.79 6.72 8.24
17INTERIM REPORT JANUARY–JUNE 2015
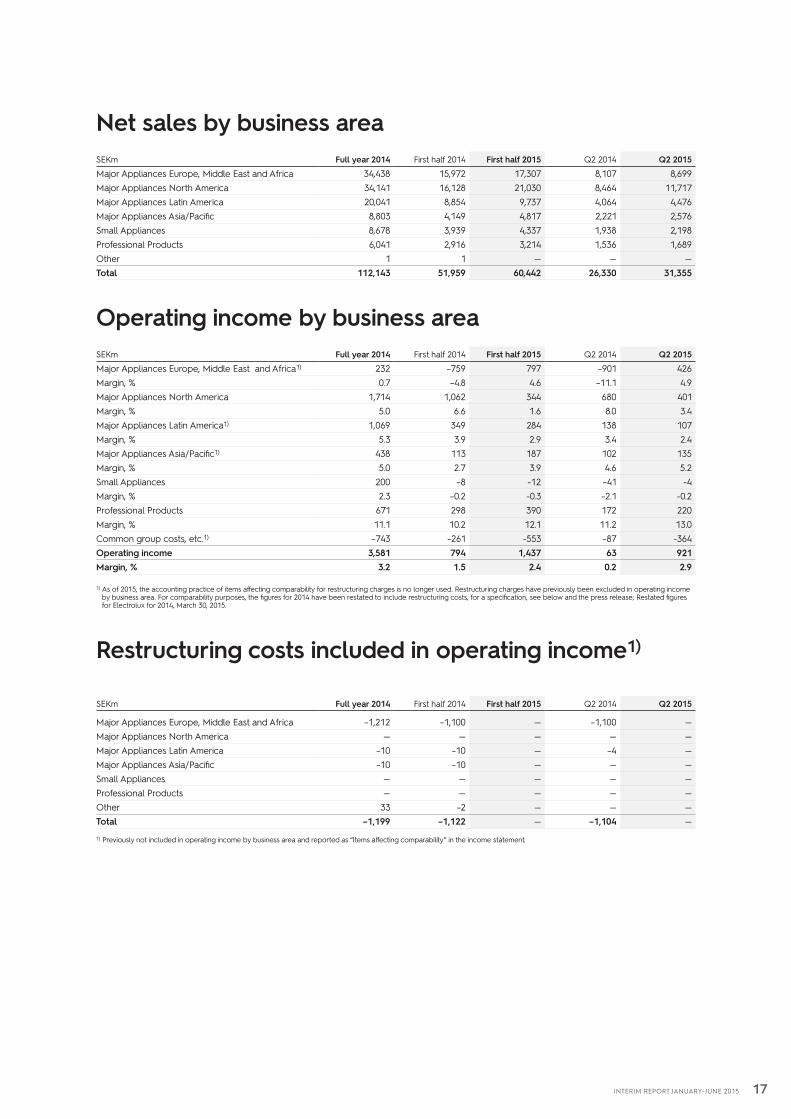
Net sales by business areaSEKm Full year 2014 First half 2014 First half 2015 Q2 2014 Q2 2015
Major Appliances Europe, Middle East and Africa 34,438 15,972 17,307 8,107 8,699Major Appliances North America 34,141 16,128 21,030 8,464 11,717Major Appliances Latin America 20,041 8,854 9,737 4,064 4,476Major Appliances Asia/Pacific 8,803 4,149 4,817 2,221 2,576Small Appliances 8,678 3,939 4,337 1,938 2,198Professional Products 6,041 2,916 3,214 1,536 1,689Other 1 1 — — —Total 112,143 51,959 60,442 26,330 31,355
Operating income by business areaSEKm Full year 2014 First half 2014 First half 2015 Q2 2014 Q2 2015
Major Appliances Europe, Middle East and Africa1) 232 –759 797 –901 426Margin, % 0.7 –4.8 4.6 –11.1 4.9Major Appliances North America 1,714 1,062 344 680 401Margin, % 5.0 6.6 1.6 8.0 3.4Major Appliances Latin America1) 1,069 349 284 138 107Margin, % 5.3 3.9 2.9 3.4 2.4Major Appliances Asia/Pacific1) 438 113 187 102 135Margin, % 5.0 2.7 3.9 4.6 5.2Small Appliances 200 –8 -12 –41 -4Margin, % 2.3 –0.2 -0.3 –2.1 -0.2Professional Products 671 298 390 172 220Margin, % 11.1 10.2 12.1 11.2 13.0Common group costs, etc.1) –743 –261 -553 –87 -364Operating income 3,581 794 1,437 63 921Margin, % 3.2 1.5 2.4 0.2 2.9
1) As of 2015, the accounting practice of items affecting comparability for restructuring charges is no longer used. Restructuring charges have previously been excluded in operating income by business area. For comparability purposes, the figures for 2014 have been restated to include restructuring costs, for a specification, see below and the press release; Restated figures for Electrolux for 2014, March 30, 2015.
Restructuring costs included in operating income1)
SEKm Full year 2014 First half 2014 First half 2015 Q2 2014 Q2 2015
Major Appliances Europe, Middle East and Africa –1,212 –1,100 — –1,100 —Major Appliances North America — — — — —Major Appliances Latin America –10 –10 — –4 —Major Appliances Asia/Pacific –10 –10 — — —Small Appliances — — — — —Professional Products — — — — —Other 33 –2 — — —Total –1,199 –1,122 — –1,104 —
1) Previously not included in operating income by business area and reported as “Items affecting comparability” in the income statement.
18INTERIM REPORT JANUARY–JUNE 2015
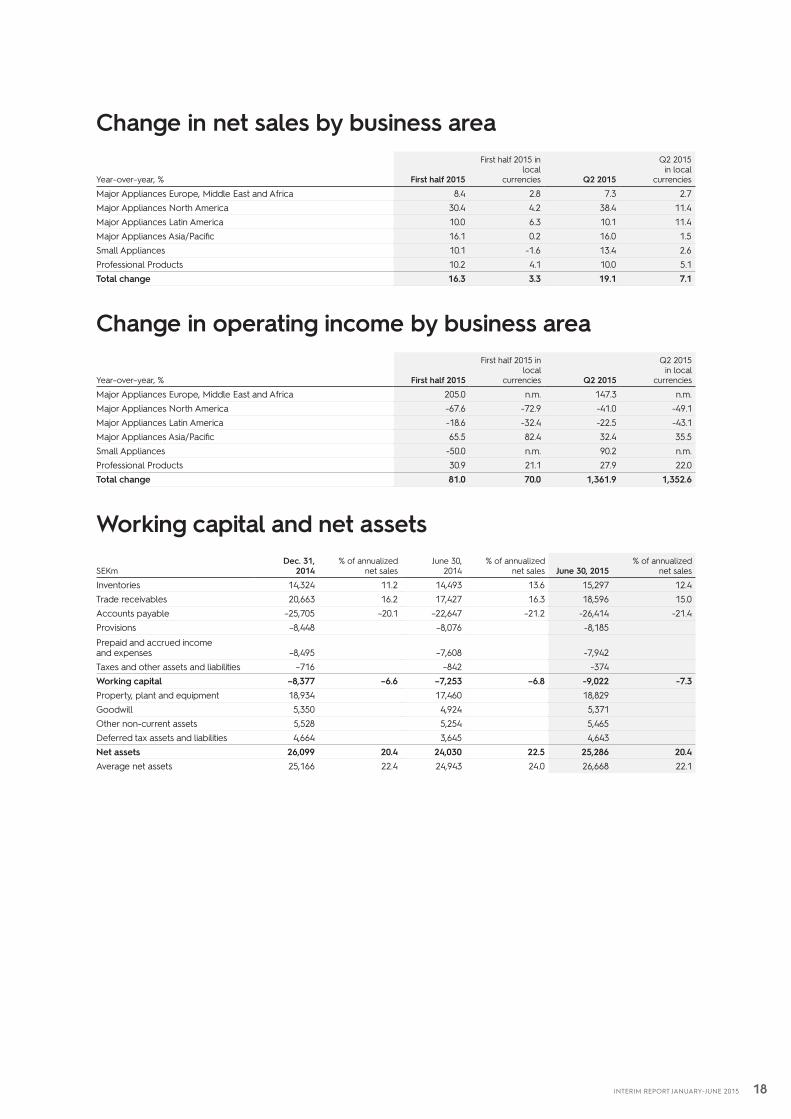
Change in net sales by business area
Year–over–year, % First half 2015
First half 2015 in local
currencies Q2 2015
Q2 2015 in local
currencies
Major Appliances Europe, Middle East and Africa 8.4 2.8 7.3 2.7Major Appliances North America 30.4 4.2 38.4 11.4Major Appliances Latin America 10.0 6.3 10.1 11.4Major Appliances Asia/Pacific 16.1 0.2 16.0 1.5Small Appliances 10.1 -1.6 13.4 2.6Professional Products 10.2 4.1 10.0 5.1Total change 16.3 3.3 19.1 7.1
Change in operating income by business area
Year–over–year, % First half 2015
First half 2015 in local
currencies Q2 2015
Q2 2015 in local
currencies
Major Appliances Europe, Middle East and Africa 205.0 n.m. 147.3 n.m.Major Appliances North America -67.6 -72.9 -41.0 -49.1Major Appliances Latin America -18.6 -32.4 -22.5 -43.1Major Appliances Asia/Pacific 65.5 82.4 32.4 35.5Small Appliances -50.0 n.m. 90.2 n.m.Professional Products 30.9 21.1 27.9 22.0Total change 81.0 70.0 1,361.9 1,352.6
Working capital and net assets
SEKmDec. 31,
2014% of annualized
net salesJune 30,
2014% of annualized
net sales June 30, 2015% of annualized
net sales
Inventories 14,324 11.2 14,493 13.6 15,297 12.4Trade receivables 20,663 16.2 17,427 16.3 18,596 15.0Accounts payable –25,705 –20.1 –22,647 –21.2 -26,414 -21.4Provisions –8,448 –8,076 -8,185
Prepaid and accrued income and expenses –8,495 –7,608 -7,942Taxes and other assets and liabilities –716 –842 -374Working capital –8,377 –6.6 –7,253 –6.8 -9,022 -7.3Property, plant and equipment 18,934 17,460 18,829Goodwill 5,350 4,924 5,371Other non-current assets 5,528 5,254 5,465Deferred tax assets and liabilities 4,664 3,645 4,643Net assets 26,099 20.4 24,030 22.5 25,286 20.4Average net assets 25,166 22.4 24,943 24.0 26,668 22.1
19INTERIM REPORT JANUARY–JUNE 2015
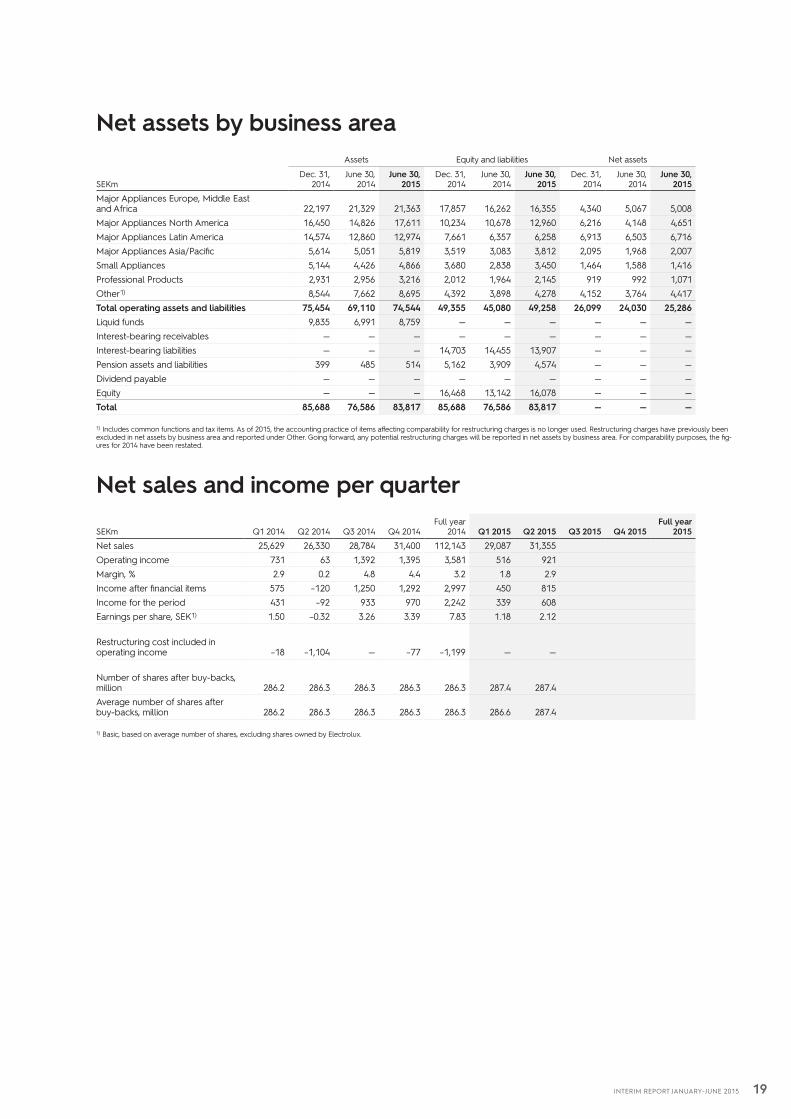
Net assets by business area Assets Equity and liabilities Net assets
SEKmDec. 31,
2014June 30,
2014June 30,
2015Dec. 31,
2014June 30,
2014June 30,
2015Dec. 31,
2014June 30,
2014June 30,
2015
Major Appliances Europe, Middle East and Africa 22,197 21,329 21,363 17,857 16,262 16,355 4,340 5,067 5,008Major Appliances North America 16,450 14,826 17,611 10,234 10,678 12,960 6,216 4,148 4,651Major Appliances Latin America 14,574 12,860 12,974 7,661 6,357 6,258 6,913 6,503 6,716Major Appliances Asia/Pacific 5,614 5,051 5,819 3,519 3,083 3,812 2,095 1,968 2,007Small Appliances 5,144 4,426 4,866 3,680 2,838 3,450 1,464 1,588 1,416Professional Products 2,931 2,956 3,216 2,012 1,964 2,145 919 992 1,071Other1) 8,544 7,662 8,695 4,392 3,898 4,278 4,152 3,764 4,417Total operating assets and liabilities 75,454 69,110 74,544 49,355 45,080 49,258 26,099 24,030 25,286Liquid funds 9,835 6,991 8,759 — — — — — —Interest-bearing receivables — — — — — — — — —Interest-bearing liabilities — — — 14,703 14,455 13,907 — — —Pension assets and liabilities 399 485 514 5,162 3,909 4,574 — — —Dividend payable — — — — — — — — —Equity — — — 16,468 13,142 16,078 — — —Total 85,688 76,586 83,817 85,688 76,586 83,817 — — —
1) Includes common functions and tax items. As of 2015, the accounting practice of items affecting comparability for restructuring charges is no longer used. Restructuring charges have previously been excluded in net assets by business area and reported under Other. Going forward, any potential restructuring charges will be reported in net assets by business area. For comparability purposes, the fig-ures for 2014 have been restated.
Net sales and income per quarter
SEKm Q1 2014 Q2 2014 Q3 2014 Q4 2014Full year
2014 Q1 2015 Q2 2015 Q3 2015 Q4 2015Full year
2015
Net sales 25,629 26,330 28,784 31,400 112,143 29,087 31,355Operating income 731 63 1,392 1,395 3,581 516 921Margin, % 2.9 0.2 4.8 4.4 3.2 1.8 2.9Income after financial items 575 –120 1,250 1,292 2,997 450 815Income for the period 431 –92 933 970 2,242 339 608Earnings per share, SEK1) 1.50 –0.32 3.26 3.39 7.83 1.18 2.12
Restructuring cost included in operating income –18 –1,104 — –77 –1,199 — —
Number of shares after buy-backs, million 286.2 286.3 286.3 286.3 286.3 287.4 287.4Average number of shares after buy-backs, million 286.2 286.3 286.3 286.3 286.3 286.6 287.4
1) Basic, based on average number of shares, excluding shares owned by Electrolux.
20INTERIM REPORT JANUARY–JUNE 2015
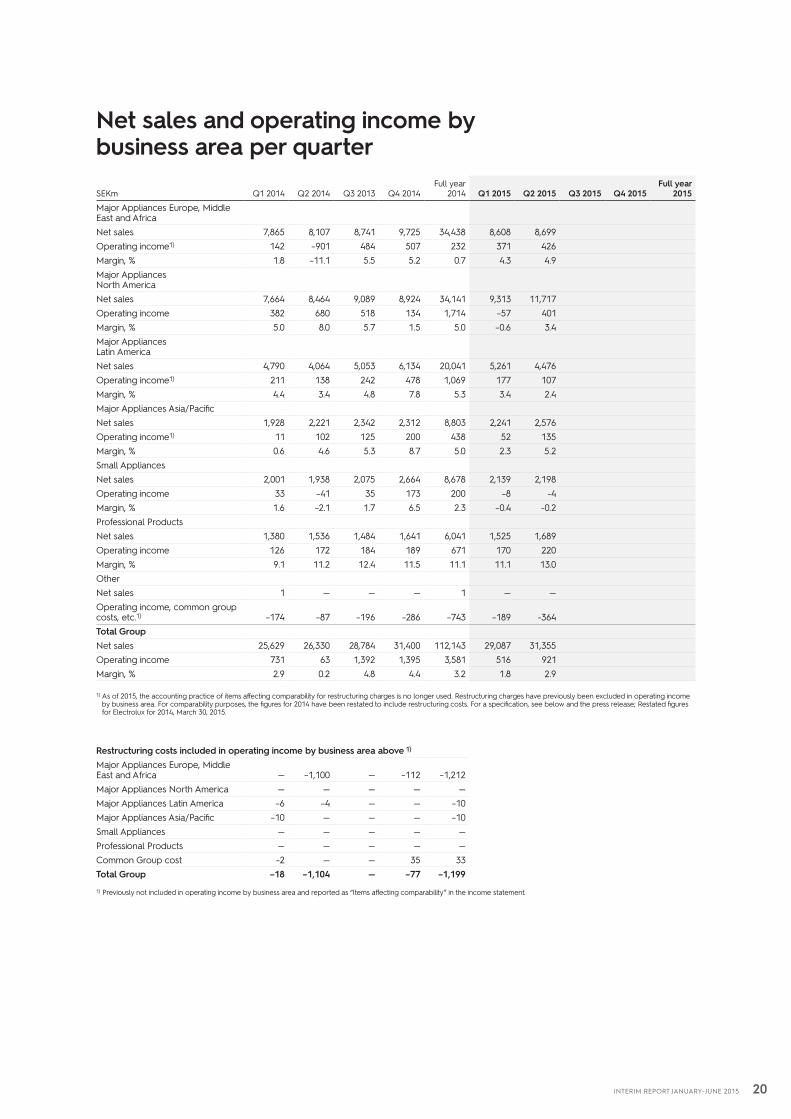
Net sales and operating income by business area per quarter
SEKm Q1 2014 Q2 2014 Q3 2013 Q4 2014Full year
2014 Q1 2015 Q2 2015 Q3 2015 Q4 2015Full year
2015
Major Appliances Europe, Middle East and AfricaNet sales 7,865 8,107 8,741 9,725 34,438 8,608 8,699Operating income1) 142 –901 484 507 232 371 426Margin, % 1.8 –11.1 5.5 5.2 0.7 4.3 4.9Major Appliances North AmericaNet sales 7,664 8,464 9,089 8,924 34,141 9,313 11,717Operating income 382 680 518 134 1,714 –57 401Margin, % 5.0 8.0 5.7 1.5 5.0 –0.6 3.4Major Appliances Latin AmericaNet sales 4,790 4,064 5,053 6,134 20,041 5,261 4,476Operating income1) 211 138 242 478 1,069 177 107Margin, % 4.4 3.4 4.8 7.8 5.3 3.4 2.4Major Appliances Asia/PacificNet sales 1,928 2,221 2,342 2,312 8,803 2,241 2,576Operating income1) 11 102 125 200 438 52 135Margin, % 0.6 4.6 5.3 8.7 5.0 2.3 5.2Small AppliancesNet sales 2,001 1,938 2,075 2,664 8,678 2,139 2,198Operating income 33 –41 35 173 200 –8 -4Margin, % 1.6 –2.1 1.7 6.5 2.3 –0.4 -0.2Professional ProductsNet sales 1,380 1,536 1,484 1,641 6,041 1,525 1,689Operating income 126 172 184 189 671 170 220Margin, % 9.1 11.2 12.4 11.5 11.1 11.1 13.0OtherNet sales 1 — — — 1 — —Operating income, common group costs, etc.1) –174 –87 –196 –286 –743 –189 -364Total GroupNet sales 25,629 26,330 28,784 31,400 112,143 29,087 31,355Operating income 731 63 1,392 1,395 3,581 516 921Margin, % 2.9 0.2 4.8 4.4 3.2 1.8 2.9
1) As of 2015, the accounting practice of items affecting comparability for restructuring charges is no longer used. Restructuring charges have previously been excluded in operating income by business area. For comparability purposes, the figures for 2014 have been restated to include restructuring costs. For a specification, see below and the press release; Restated figures for Electrolux for 2014, March 30, 2015.
Restructuring costs included in operating income by business area above 1)
Major Appliances Europe, Middle East and Africa — –1,100 — –112 –1,212Major Appliances North America — — — — —Major Appliances Latin America –6 –4 — — –10Major Appliances Asia/Pacific –10 — — — –10Small Appliances — — — — —Professional Products — — — — —Common Group cost –2 — — 35 33Total Group –18 –1,104 — –77 –1,199
1) Previously not included in operating income by business area and reported as “Items affecting comparability” in the income statement.
21INTERIM REPORT JANUARY–JUNE 2015
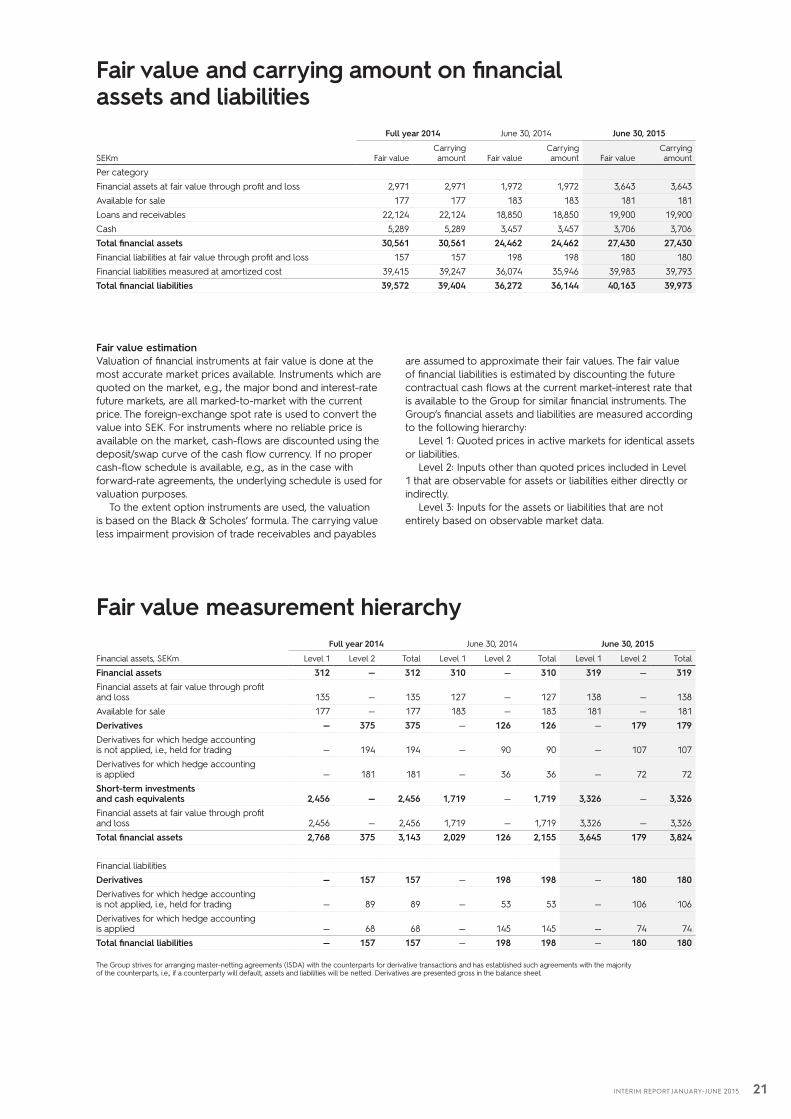
Fair value and carrying amount on financial assets and liabilities
Full year 2014 June 30, 2014 June 30, 2015
SEKm Fair valueCarrying amount Fair value
Carrying amount Fair value
Carrying amount
Per categoryFinancial assets at fair value through profit and loss 2,971 2,971 1,972 1,972 3,643 3,643Available for sale 177 177 183 183 181 181Loans and receivables 22,124 22,124 18,850 18,850 19,900 19,900Cash 5,289 5,289 3,457 3,457 3,706 3,706Total financial assets 30,561 30,561 24,462 24,462 27,430 27,430Financial liabilities at fair value through profit and loss 157 157 198 198 180 180Financial liabilities measured at amortized cost 39,415 39,247 36,074 35,946 39,983 39,793Total financial liabilities 39,572 39,404 36,272 36,144 40,163 39,973
Fair value estimationValuation of financial instruments at fair value is done at the most accurate market prices available. Instruments which are quoted on the market, e.g., the major bond and interest-rate future markets, are all marked-to-market with the current price. The foreign-exchange spot rate is used to convert the value into SEK. For instruments where no reliable price is available on the market, cash-flows are discounted using the deposit/swap curve of the cash flow currency. If no proper cash-flow schedule is available, e.g., as in the case with forward-rate agreements, the underlying schedule is used for valuation purposes.
To the extent option instruments are used, the valuation is based on the Black & Scholes’ formula. The carrying value less impairment provision of trade receivables and payables
are assumed to approximate their fair values. The fair value of financial liabilities is estimated by discounting the future contractual cash flows at the current market-interest rate that is available to the Group for similar financial instruments. The Group’s financial assets and liabilities are measured according to the following hierarchy:
Level 1: Quoted prices in active markets for identical assets or liabilities.
Level 2: Inputs other than quoted prices included in Level 1 that are observable for assets or liabilities either directly or indirectly.
Level 3: Inputs for the assets or liabilities that are not entirely based on observable market data.
Fair value measurement hierarchyFull year 2014 June 30, 2014 June 30, 2015
Financial assets, SEKm Level 1 Level 2 Total Level 1 Level 2 Total Level 1 Level 2 Total
Financial assets 312 — 312 310 — 310 319 — 319Financial assets at fair value through profit and loss 135 — 135 127 — 127 138 — 138Available for sale 177 — 177 183 — 183 181 — 181Derivatives — 375 375 — 126 126 — 179 179Derivatives for which hedge accounting is not applied, i.e., held for trading — 194 194 — 90 90 — 107 107Derivatives for which hedge accounting is applied — 181 181 — 36 36 — 72 72Short-term investments and cash equivalents 2,456 — 2,456 1,719 — 1,719 3,326 — 3,326Financial assets at fair value through profit and loss 2,456 — 2,456 1,719 — 1,719 3,326 — 3,326Total financial assets 2,768 375 3,143 2,029 126 2,155 3,645 179 3,824
Financial liabilitiesDerivatives — 157 157 — 198 198 — 180 180Derivatives for which hedge accounting is not applied, i.e., held for trading — 89 89 — 53 53 — 106 106Derivatives for which hedge accounting is applied — 68 68 — 145 145 — 74 74Total financial liabilities — 157 157 — 198 198 — 180 180
The Group strives for arranging master-netting agreements (ISDA) with the counterparts for derivative transactions and has established such agreements with the majority of the counterparts, i.e., if a counterparty will default, assets and liabilities will be netted. Derivatives are presented gross in the balance sheet.
22INTERIM REPORT JANUARY–JUNE 2015
Parent Company income statementSEKm Full year 2014 First half 2014 First half 2015 Q2 2014 Q2 2015
Net sales 29,508 13,604 15,320 13,604 15,320Cost of goods sold –25,477 -11,893 -12,928 -11,893 -12,928Gross operating income 4,031 1,711 2,392 1,711 2,392Selling expenses –3,430 -1,592 -1,819 -1,592 -1,819Administrative expenses –1,208 -706 -734 -706 -734Other operating income — 2 — 2 —Other operating expenses –645 -174 -282 -174 -282Operating income –1,252 -759 -443 -759 -443Financial income 3,105 968 1,975 968 1,975Financial expenses –455 -131 -132 -131 -132Financial items, net 2,650 837 1,843 837 1,843Income after financial items 1,398 78 1,400 78 1,400Appropriations 355 88 111 88 111Income before taxes 1,753 166 1,511 166 1,511Taxes 77 124 -35 124 -35Income for the period 1,830 290 1,476 290 1,476
Parent Company balance sheet
SEKmDec. 31,
2014June 30,
2014June 30,
2015
AssetsNon–current assets 35,074 33,266 34,965Current assets 21,021 19,220 18,711Total assets 56,095 52,486 53,676
Equity and liabilitiesRestricted equity 4,562 4,562 4,562Non–restricted equity 12,617 11,018 12,244Total equity 17,179 15,580 16,806Untaxed reserves 396 530 381Provisions 1,624 1,793 1,521Non–current liabilities 9,071 9,737 7,823Current liabilities 27,825 24,846 27,145Total equity and liabilities 56,095 52,486 53,676
Pledged assets — — —Contingent liabilities 3,743 2,159 3,155
23INTERIM REPORT JANUARY–JUNE 2015
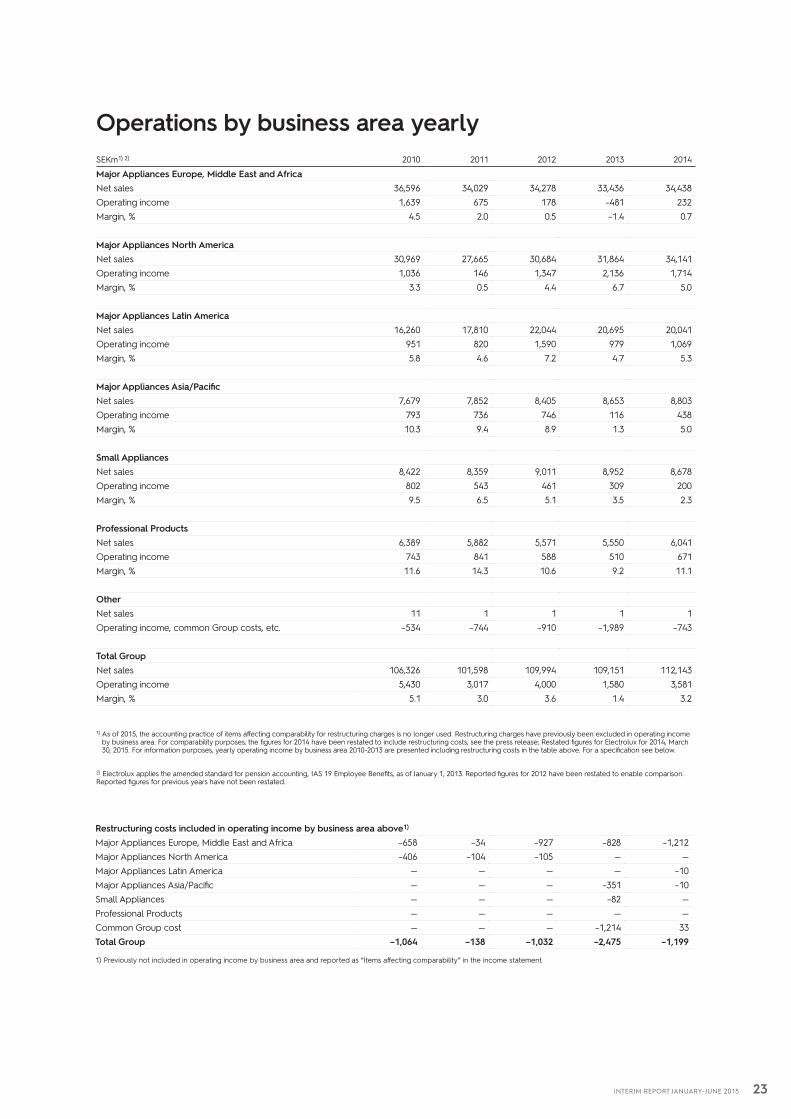
Operations by business area yearlySEKm1) 2) 2010 2011 2012 2013 2014
Major Appliances Europe, Middle East and AfricaNet sales 36,596 34,029 34,278 33,436 34,438Operating income 1,639 675 178 –481 232Margin, % 4.5 2.0 0.5 –1.4 0.7
Major Appliances North AmericaNet sales 30,969 27,665 30,684 31,864 34,141Operating income 1,036 146 1,347 2,136 1,714Margin, % 3.3 0.5 4.4 6.7 5.0
Major Appliances Latin AmericaNet sales 16,260 17,810 22,044 20,695 20,041Operating income 951 820 1,590 979 1,069Margin, % 5.8 4.6 7.2 4.7 5.3
Major Appliances Asia/PacificNet sales 7,679 7,852 8,405 8,653 8,803Operating income 793 736 746 116 438Margin, % 10.3 9.4 8.9 1.3 5.0
Small AppliancesNet sales 8,422 8,359 9,011 8,952 8,678Operating income 802 543 461 309 200Margin, % 9.5 6.5 5.1 3.5 2.3
Professional ProductsNet sales 6,389 5,882 5,571 5,550 6,041Operating income 743 841 588 510 671Margin, % 11.6 14.3 10.6 9.2 11.1
OtherNet sales 11 1 1 1 1Operating income, common Group costs, etc. –534 –744 –910 –1,989 –743
Total GroupNet sales 106,326 101,598 109,994 109,151 112,143Operating income 5,430 3,017 4,000 1,580 3,581Margin, % 5.1 3.0 3.6 1.4 3.2
1) As of 2015, the accounting practice of items affecting comparability for restructuring charges is no longer used. Restructuring charges have previously been excluded in operating income by business area. For comparability purposes, the figures for 2014 have been restated to include restructuring costs, see the press release; Restated figures for Electrolux for 2014, March 30, 2015. For information purposes, yearly operating income by business area 2010-2013 are presented including restructuring costs in the table above. For a specification see below.
2) Electrolux applies the amended standard for pension accounting, IAS 19 Employee Benefits, as of January 1, 2013. Reported figures for 2012 have been restated to enable comparison. Reported figures for previous years have not been restated.
Restructuring costs included in operating income by business area above1)
Major Appliances Europe, Middle East and Africa –658 –34 –927 –828 –1,212Major Appliances North America –406 –104 –105 — —Major Appliances Latin America — — — — –10Major Appliances Asia/Pacific — — — –351 –10Small Appliances — — — –82 —Professional Products — — — — —Common Group cost — — — –1,214 33Total Group –1,064 –138 –1,032 –2,475 –1,199
1) Previously not included in operating income by business area and reported as “Items affecting comparability” in the income statement.
24INTERIM REPORT JANUARY–JUNE 2015
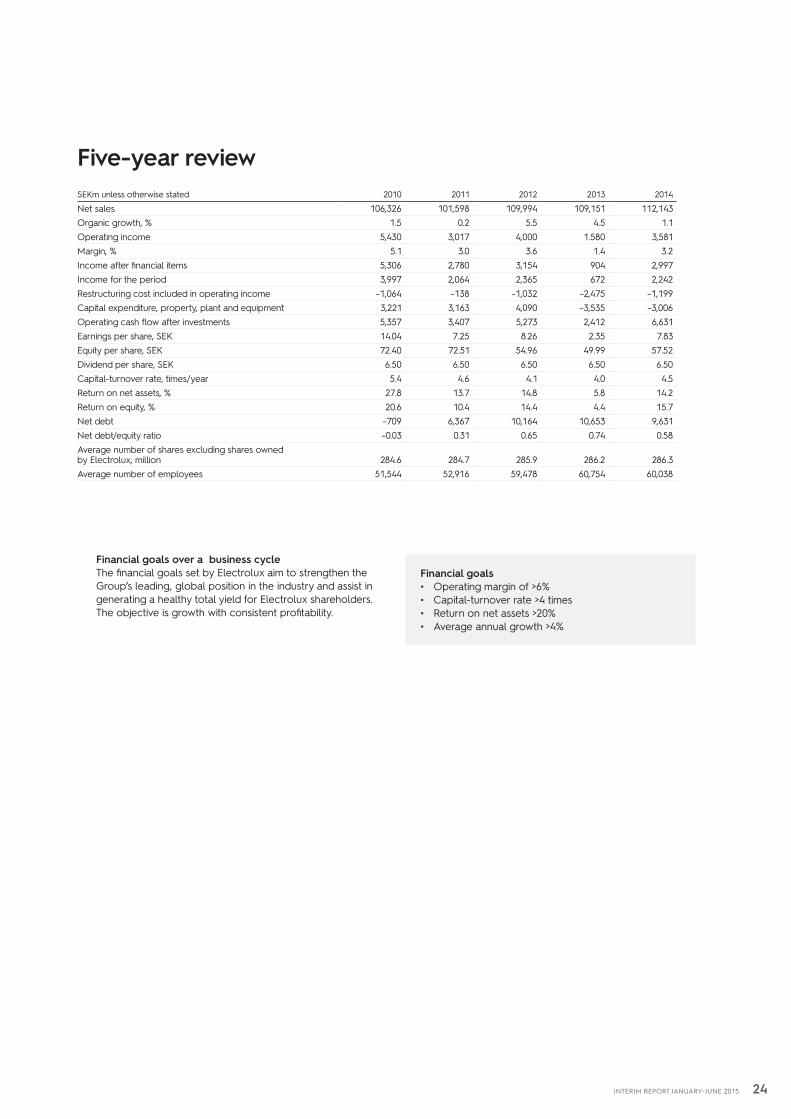
Financial goals over a business cycleThe financial goals set by Electrolux aim to strengthen the Group’s leading, global position in the industry and assist in generating a healthy total yield for Electrolux shareholders. The objective is growth with consistent profitability.
Five-year reviewSEKm unless otherwise stated 2010 2011 2012 2013 2014
Net sales 106,326 101,598 109,994 109,151 112,143Organic growth, % 1.5 0.2 5.5 4.5 1.1Operating income 5,430 3,017 4,000 1.580 3,581Margin, % 5.1 3.0 3.6 1.4 3.2Income after financial items 5,306 2,780 3,154 904 2,997Income for the period 3,997 2,064 2,365 672 2,242Restructuring cost included in operating income –1,064 –138 –1,032 –2,475 –1,199Capital expenditure, property, plant and equipment 3,221 3,163 4,090 –3,535 –3,006Operating cash flow after investments 5,357 3,407 5,273 2,412 6,631Earnings per share, SEK 14.04 7.25 8.26 2.35 7.83Equity per share, SEK 72.40 72.51 54.96 49.99 57.52Dividend per share, SEK 6.50 6.50 6.50 6.50 6.50Capital-turnover rate, times/year 5.4 4.6 4.1 4.0 4.5Return on net assets, % 27.8 13.7 14.8 5.8 14.2Return on equity, % 20.6 10.4 14.4 4.4 15.7Net debt –709 6,367 10,164 10,653 9,631Net debt/equity ratio –0.03 0.31 0.65 0.74 0.58Average number of shares excluding shares owned by Electrolux, million 284.6 284.7 285.9 286.2 286.3Average number of employees 51,544 52,916 59,478 60,754 60,038
Financial goals• Operating margin of >6% • Capital-turnover rate >4 times• Return on net assets >20% • Average annual growth >4%
25INTERIM REPORT JANUARY–JUNE 2015
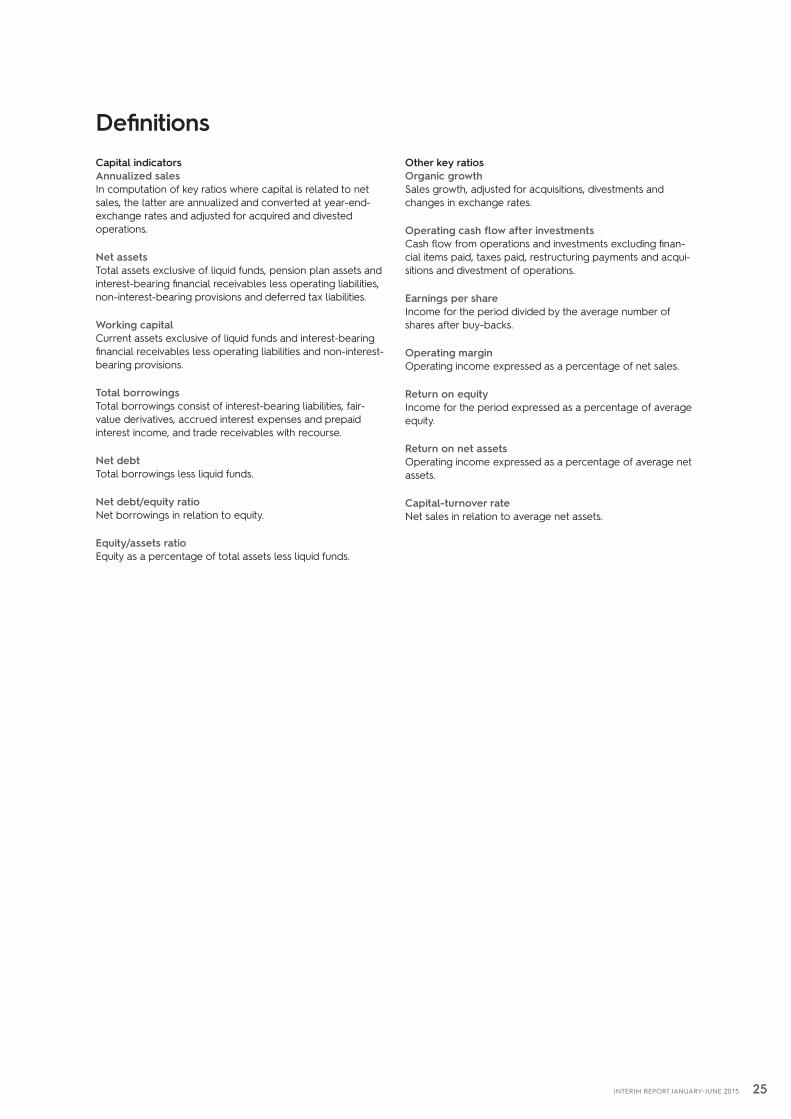
DefinitionsCapital indicatorsAnnualized salesIn computation of key ratios where capital is related to net sales, the latter are annualized and converted at year-end-exchange rates and adjusted for acquired and divested operations.
Net assetsTotal assets exclusive of liquid funds, pension plan assets and interest-bearing financial receivables less operating liabilities, non-interest-bearing provisions and deferred tax liabilities.
Working capitalCurrent assets exclusive of liquid funds and interest-bearing financial receivables less operating liabilities and non-interest-bearing provisions.
Total borrowingsTotal borrowings consist of interest-bearing liabilities, fair-value derivatives, accrued interest expenses and prepaid interest income, and trade receivables with recourse.
Net debtTotal borrowings less liquid funds.
Net debt/equity ratioNet borrowings in relation to equity.
Equity/assets ratioEquity as a percentage of total assets less liquid funds.
Other key ratiosOrganic growthSales growth, adjusted for acquisitions, divestments and changes in exchange rates.
Operating cash flow after investmentsCash flow from operations and investments excluding finan-cial items paid, taxes paid, restructuring payments and acqui-sitions and divestment of operations.
Earnings per shareIncome for the period divided by the average number of shares after buy-backs.
Operating marginOperating income expressed as a percentage of net sales.
Return on equityIncome for the period expressed as a percentage of average equity.
Return on net assetsOperating income expressed as a percentage of average net assets.
Capital-turnover rateNet sales in relation to average net assets.
26INTERIM REPORT JANUARY–JUNE 2015
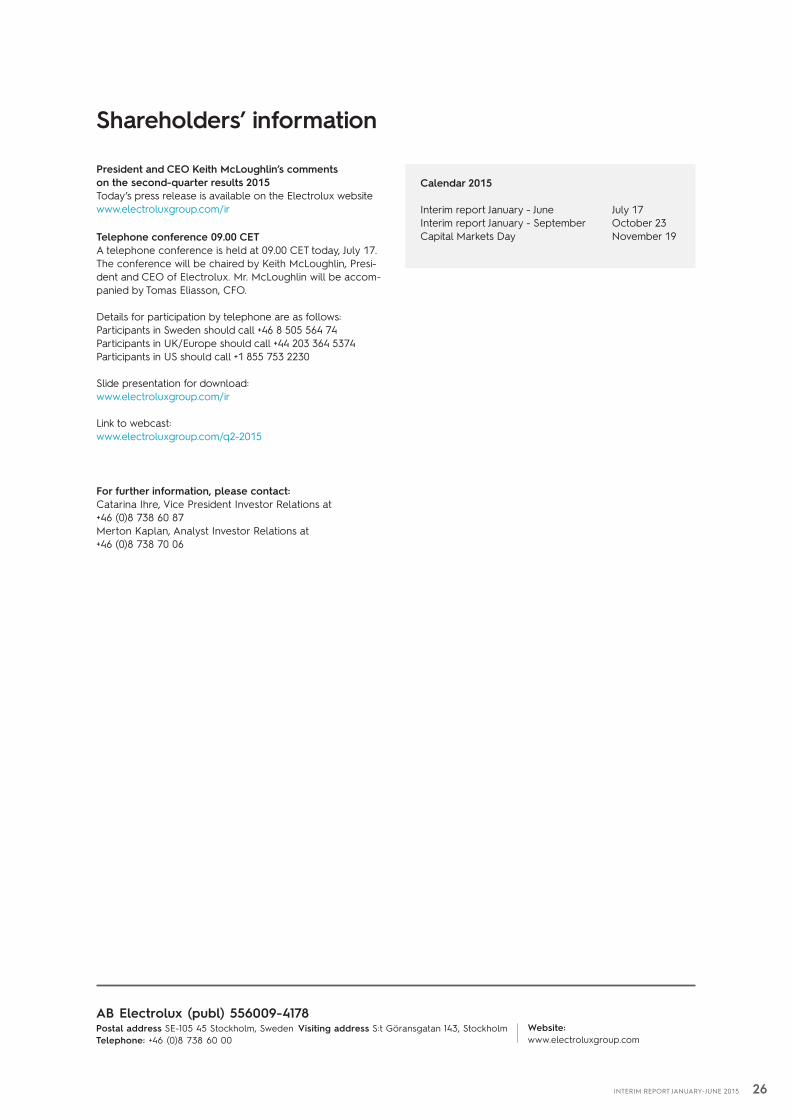
President and CEO Keith McLoughlin’s comments on the second-quarter results 2015Today’s press release is available on the Electrolux website www.electroluxgroup.com/ir
Telephone conference 09.00 CET A telephone conference is held at 09.00 CET today, July 17. The conference will be chaired by Keith McLoughlin, Presi-dent and CEO of Electrolux. Mr. McLoughlin will be accom-panied by Tomas Eliasson, CFO.
Details for participation by telephone are as follows:Participants in Sweden should call +46 8 505 564 74Participants in UK/Europe should call +44 203 364 5374Participants in US should call +1 855 753 2230
Slide presentation for download: www.electroluxgroup.com/ir
Link to webcast: www.electroluxgroup.com/q2-2015
For further information, please contact:Catarina Ihre, Vice President Investor Relations at +46 (0)8 738 60 87Merton Kaplan, Analyst Investor Relations at+46 (0)8 738 70 06
Website: www.electroluxgroup.com
AB Electrolux (publ) 556009-4178Postal address SE-105 45 Stockholm, Sweden Visiting address S:t Göransgatan 143, StockholmTelephone: +46 (0)8 738 60 00
Shareholders’ information
Calendar 2015
Interim report January - June July 17Interim report January - September October 23Capital Markets Day November 19