Embed Size (px)
Citation preview
Q2-16 Results
Jonas Samuelson, President and CEO
Anna Ohlsson-Leijon, CFO
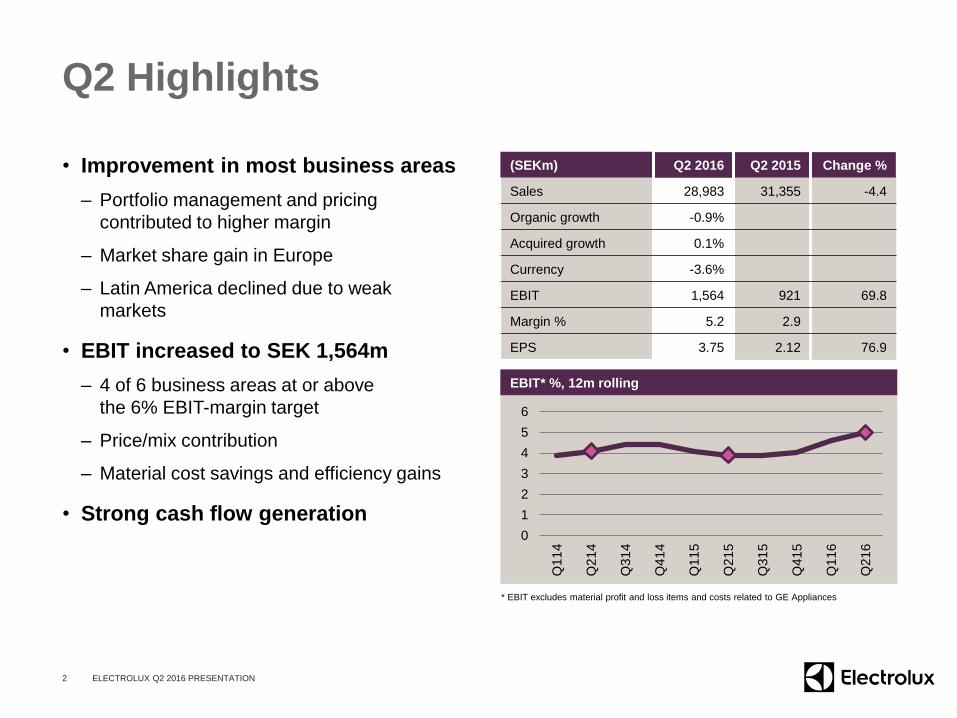
(SEKm) Q2 2016 Q2 2015 Change %
Sales 28,983 31,355 -4.4
Organic growth -0.9%
Acquired growth 0.1%
Currency -3.6%
EBIT 1,564 921 69.8
Margin % 5.2 2.9
EPS 3.75 2.12 76.9
Q2 Highlights
• Improvement in most business areas
– Portfolio management and pricing
contributed to higher margin
– Market share gain in Europe
– Latin America declined due to weak
markets
• EBIT increased to SEK 1,564m
– 4 of 6 business areas at or above
the 6% EBIT-margin target
– Price/mix contribution
– Material cost savings and efficiency gains
• Strong cash flow generation
2
EBIT* %, 12m rolling
0
1
2
3
4
5
6
Q11
4
Q21
4
Q31
4
Q41
4
Q11
5
Q21
5
Q31
5
Q41
5
Q11
6
Q21
6
ELECTROLUX Q2 2016 PRESENTATION
* EBIT excludes material profit and loss items and costs related to GE Appliances
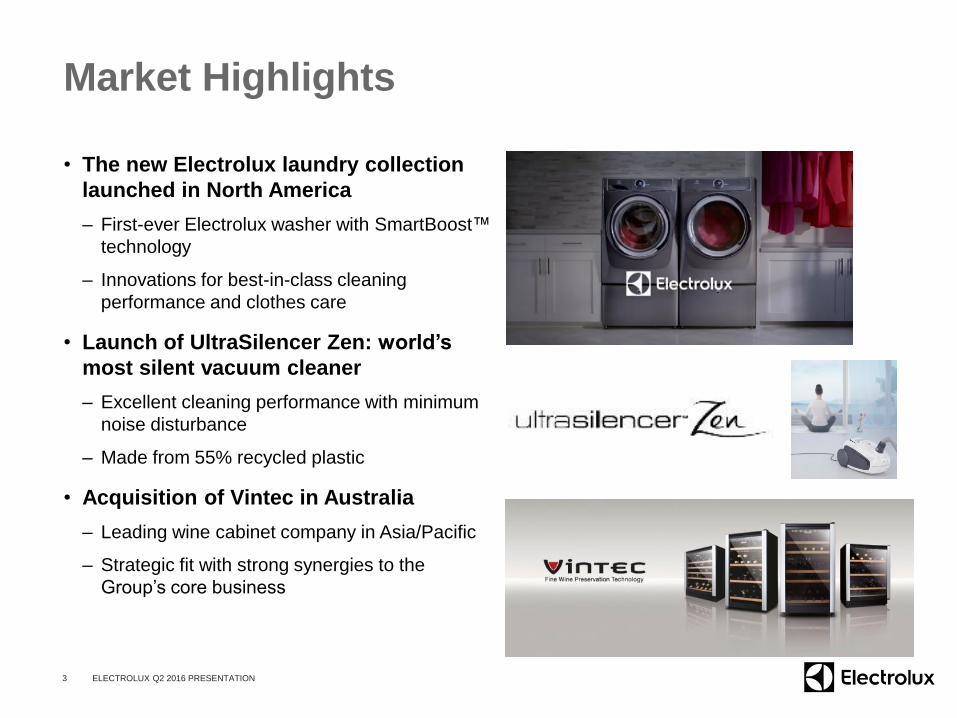
Market Highlights
• The new Electrolux laundry collection
launched in North America
– First-ever Electrolux washer with SmartBoost™
technology
– Innovations for best-in-class cleaning
performance and clothes care
• Launch of UltraSilencer Zen: world’s
most silent vacuum cleaner
– Excellent cleaning performance with minimum
noise disturbance
– Made from 55% recycled plastic
• Acquisition of Vintec in Australia
– Leading wine cabinet company in Asia/Pacific
– Strategic fit with strong synergies to the
Group’s core business
3 ELECTROLUX Q2 2016 PRESENTATION
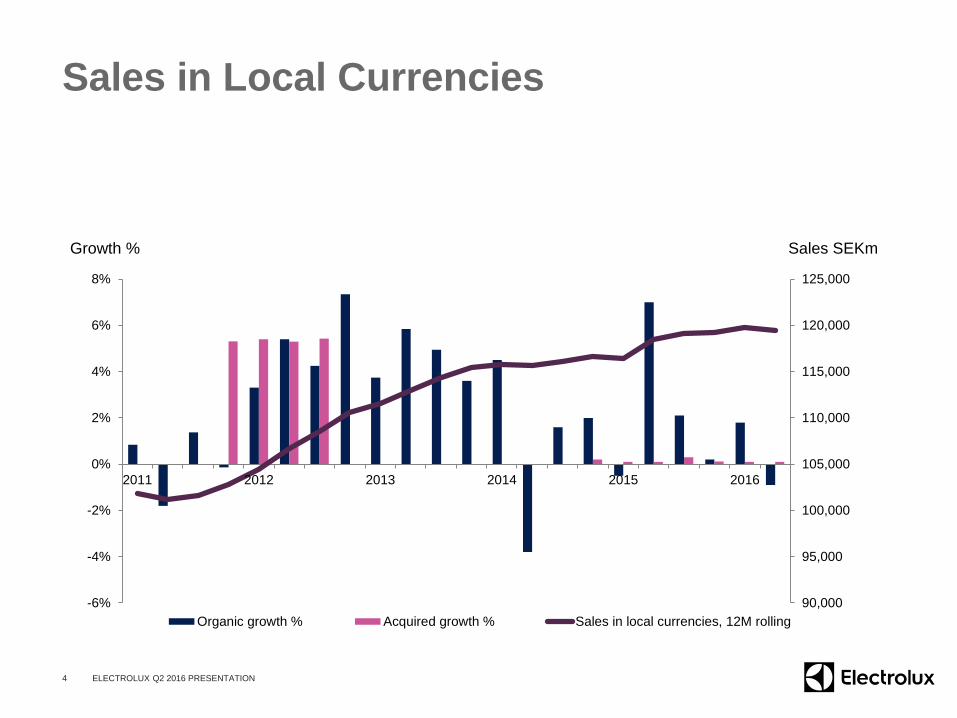
Sales in Local Currencies
90,000
95,000
100,000
105,000
110,000
115,000
120,000
125,000
-6%
-4%
-2%
0%
2%
4%
6%
8%
2011 2012 2013 2014 2015 2016
Sales SEKmGrowth %
Organic growth % Acquired growth % Sales in local currencies, 12M rolling
4 ELECTROLUX Q2 2016 PRESENTATION
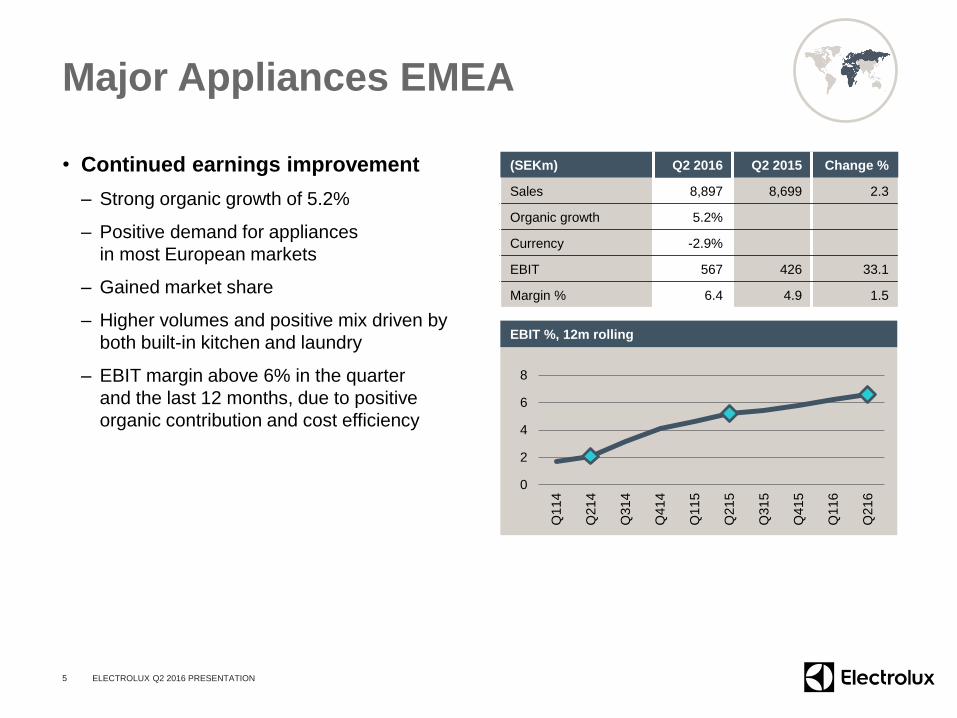
Major Appliances EMEA
• Continued earnings improvement
– Strong organic growth of 5.2%
– Positive demand for appliances
in most European markets
– Gained market share
– Higher volumes and positive mix driven by
both built-in kitchen and laundry
– EBIT margin above 6% in the quarter
and the last 12 months, due to positive
organic contribution and cost efficiency
5
(SEKm) Q2 2016 Q2 2015 Change %
Sales 8,897 8,699 2.3
Organic growth 5.2%
Currency -2.9%
EBIT 567 426 33.1
Margin % 6.4 4.9 1.5
0
2
4
6
8
Q11
4
Q21
4
Q31
4
Q41
4
Q11
5
Q21
5
Q31
5
Q41
5
Q11
6
Q21
6
EBIT %, 12m rolling
ELECTROLUX Q2 2016 PRESENTATION
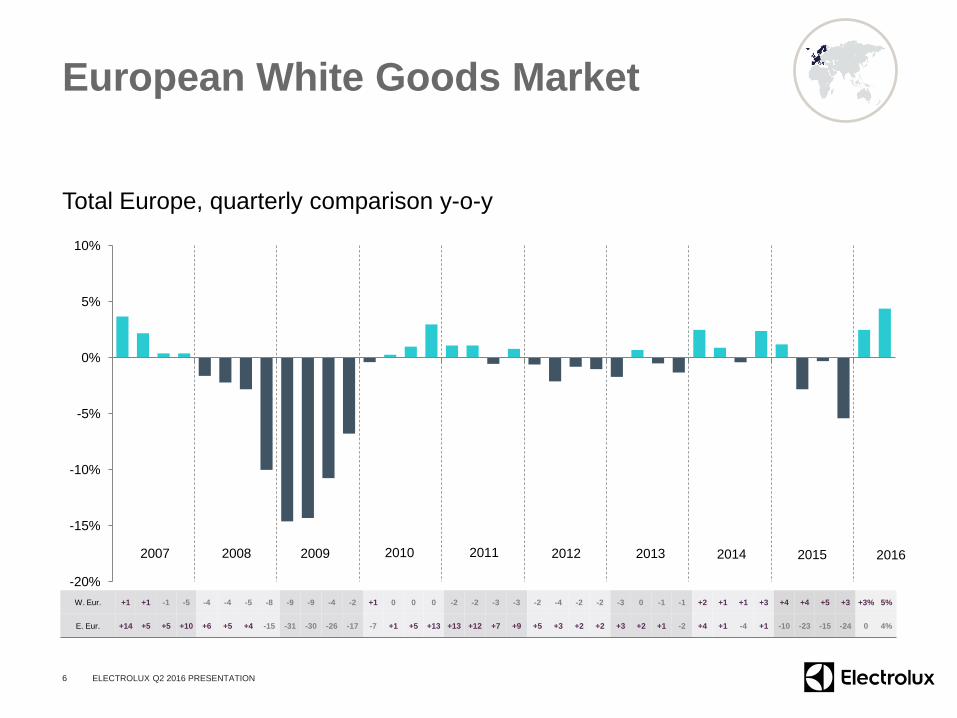
European White Goods Market
Total Europe, quarterly comparison y-o-y
-20%
-15%
-10%
-5%
0%
5%
10%
6
2007 2008 2009 2010 2011 2012 2013
W. Eur. +1 +1 -1 -5 -4 -4 -5 -8 -9 -9 -4 -2 +1 0 0 0 -2 -2 -3 -3 -2 -4 -2 -2 -3 0 -1 -1 +2 +1 +1 +3 +4 +4 +5 +3 +3% 5%
E. Eur. +14 +5 +5 +10 +6 +5 +4 -15 -31 -30 -26 -17 -7 +1 +5 +13 +13 +12 +7 +9 +5 +3 +2 +2 +3 +2 +1 -2 +4 +1 -4 +1 -10 -23 -15 -24 0 4%
2014 2015
ELECTROLUX Q2 2016 PRESENTATION
2016
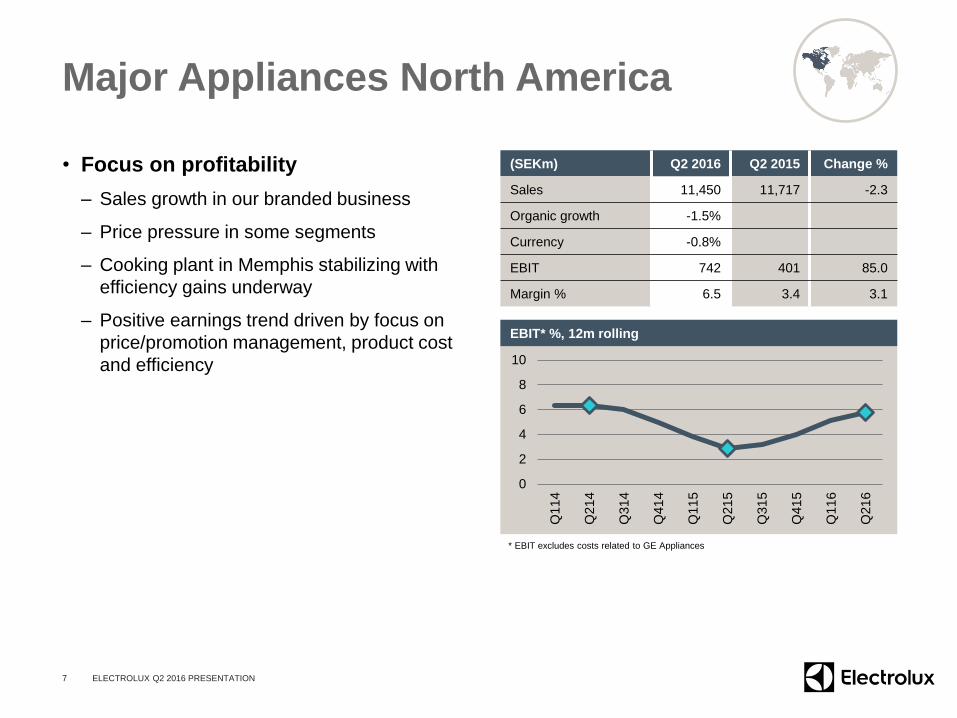
Major Appliances North America
• Focus on profitability
– Sales growth in our branded business
– Price pressure in some segments
– Cooking plant in Memphis stabilizing with
efficiency gains underway
– Positive earnings trend driven by focus on
price/promotion management, product cost
and efficiency
7
(SEKm) Q2 2016 Q2 2015 Change %
Sales 11,450 11,717 -2.3
Organic growth -1.5%
Currency -0.8%
EBIT 742 401 85.0
Margin % 6.5 3.4 3.1
0
2
4
6
8
10
Q11
4
Q21
4
Q31
4
Q41
4
Q11
5
Q21
5
Q31
5
Q41
5
Q11
6
Q21
6
EBIT* %, 12m rolling
ELECTROLUX Q2 2016 PRESENTATION
* EBIT excludes costs related to GE Appliances
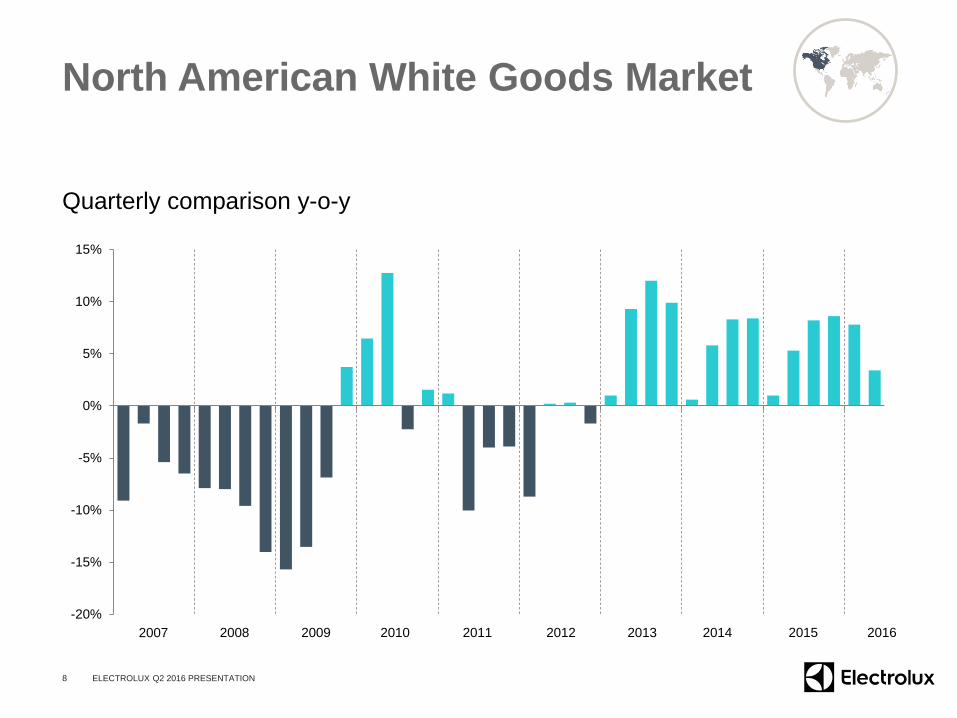
North American White Goods Market
Quarterly comparison y-o-y
-20%
-15%
-10%
-5%
0%
5%
10%
15%
8
2007 2008 2009 2010 2011 2012 2013 2014 2015 2016
ELECTROLUX Q2 2016 PRESENTATION
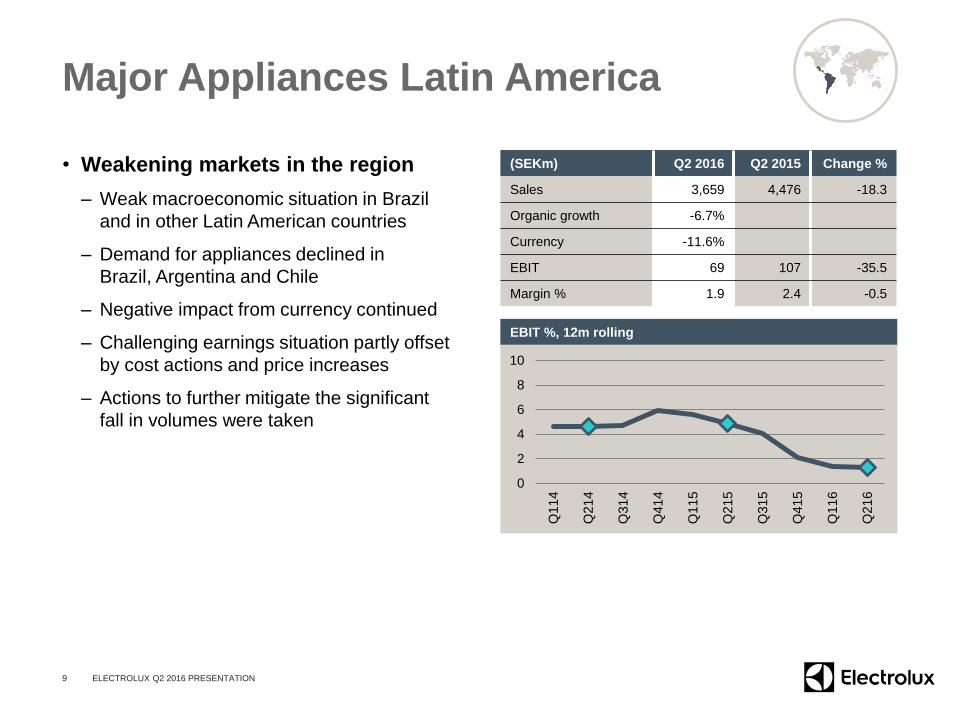
Major Appliances Latin America
• Weakening markets in the region
– Weak macroeconomic situation in Brazil
and in other Latin American countries
– Demand for appliances declined in
Brazil, Argentina and Chile
– Negative impact from currency continued
– Challenging earnings situation partly offset
by cost actions and price increases
– Actions to further mitigate the significant
fall in volumes were taken
9
(SEKm) Q2 2016 Q2 2015 Change %
Sales 3,659 4,476 -18.3
Organic growth -6.7%
Currency -11.6%
EBIT 69 107 -35.5
Margin % 1.9 2.4 -0.5
0
2
4
6
8
10
Q11
4
Q21
4
Q31
4
Q41
4
Q11
5
Q21
5
Q31
5
Q41
5
Q11
6
Q21
6
EBIT %, 12m rolling
ELECTROLUX Q2 2016 PRESENTATION
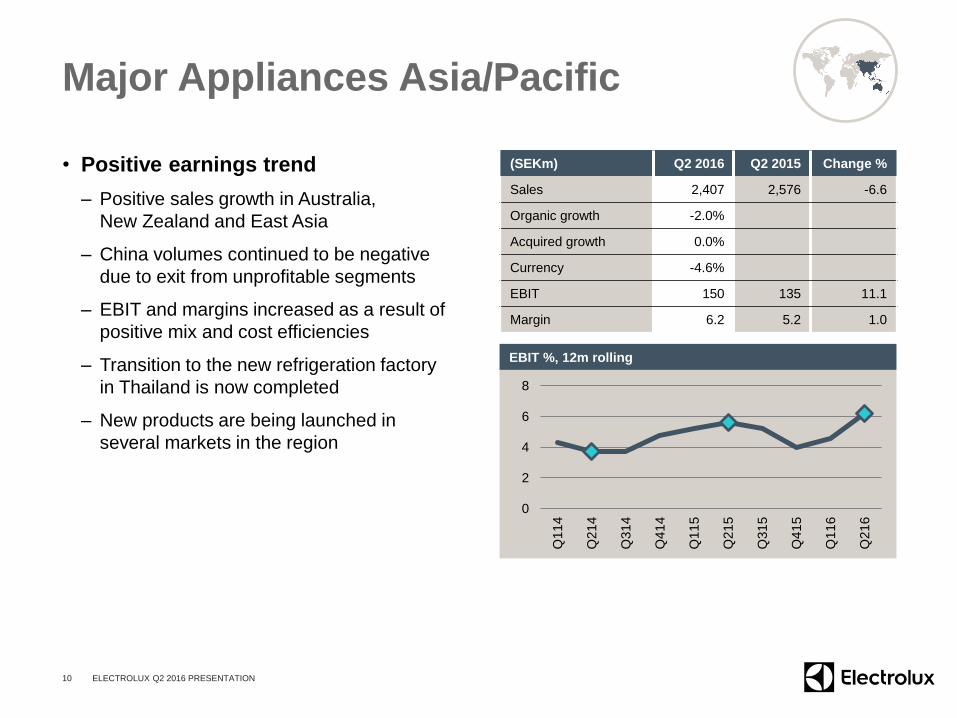
Major Appliances Asia/Pacific
• Positive earnings trend
– Positive sales growth in Australia,
New Zealand and East Asia
– China volumes continued to be negative
due to exit from unprofitable segments
– EBIT and margins increased as a result of
positive mix and cost efficiencies
– Transition to the new refrigeration factory
in Thailand is now completed
– New products are being launched in
several markets in the region
10
(SEKm) Q2 2016 Q2 2015 Change %
Sales 2,407 2,576 -6.6
Organic growth -2.0%
Acquired growth 0.0%
Currency -4.6%
EBIT 150 135 11.1
Margin 6.2 5.2 1.0
0
2
4
6
8
Q11
4
Q21
4
Q31
4
Q41
4
Q11
5
Q21
5
Q31
5
Q41
5
Q11
6
Q21
6
EBIT %, 12m rolling
ELECTROLUX Q2 2016 PRESENTATION
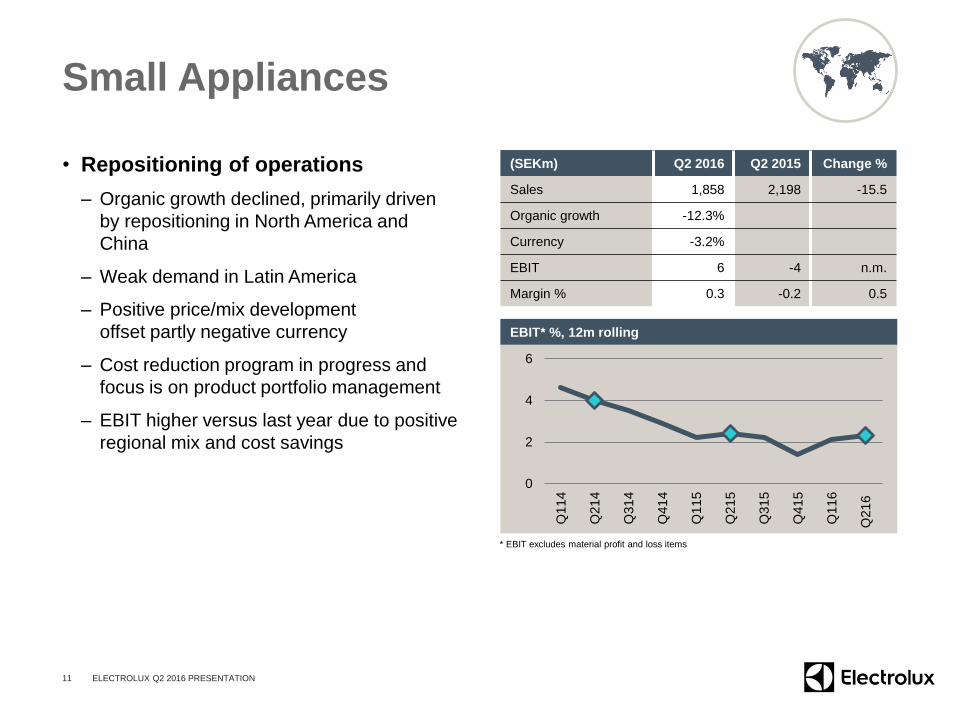
Small Appliances
• Repositioning of operations
– Organic growth declined, primarily driven
by repositioning in North America and
China
– Weak demand in Latin America
– Positive price/mix development
offset partly negative currency
– Cost reduction program in progress and
focus is on product portfolio management
– EBIT higher versus last year due to positive
regional mix and cost savings
11
(SEKm) Q2 2016 Q2 2015 Change %
Sales 1,858 2,198 -15.5
Organic growth -12.3%
Currency -3.2%
EBIT 6 -4 n.m.
Margin % 0.3 -0.2 0.5
0
2
4
6
Q11
4
Q21
4
Q31
4
Q41
4
Q11
5
Q21
5
Q31
5
Q41
5
Q11
6
Q21
6
EBIT* %, 12m rolling
ELECTROLUX Q2 2016 PRESENTATION
* EBIT excludes material profit and loss items
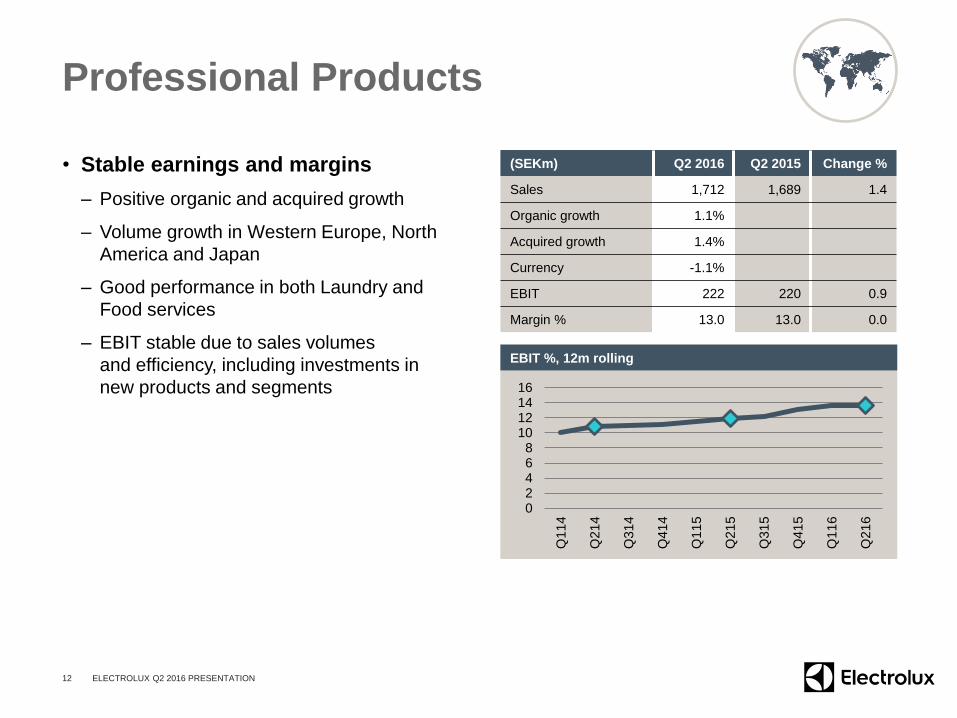
Professional Products
• Stable earnings and margins
– Positive organic and acquired growth
– Volume growth in Western Europe, North
America and Japan
– Good performance in both Laundry and
Food services
– EBIT stable due to sales volumes
and efficiency, including investments in
new products and segments
12
(SEKm) Q2 2016 Q2 2015 Change %
Sales 1,712 1,689 1.4
Organic growth 1.1%
Acquired growth 1.4%
Currency -1.1%
EBIT 222 220 0.9
Margin % 13.0 13.0 0.0
02468
10121416
Q11
4
Q21
4
Q31
4
Q41
4
Q11
5
Q21
5
Q31
5
Q41
5
Q11
6
Q21
6
EBIT %, 12m rolling
ELECTROLUX Q2 2016 PRESENTATION
Financials Q2-16
Anna Ohlsson-Leijon, CFO
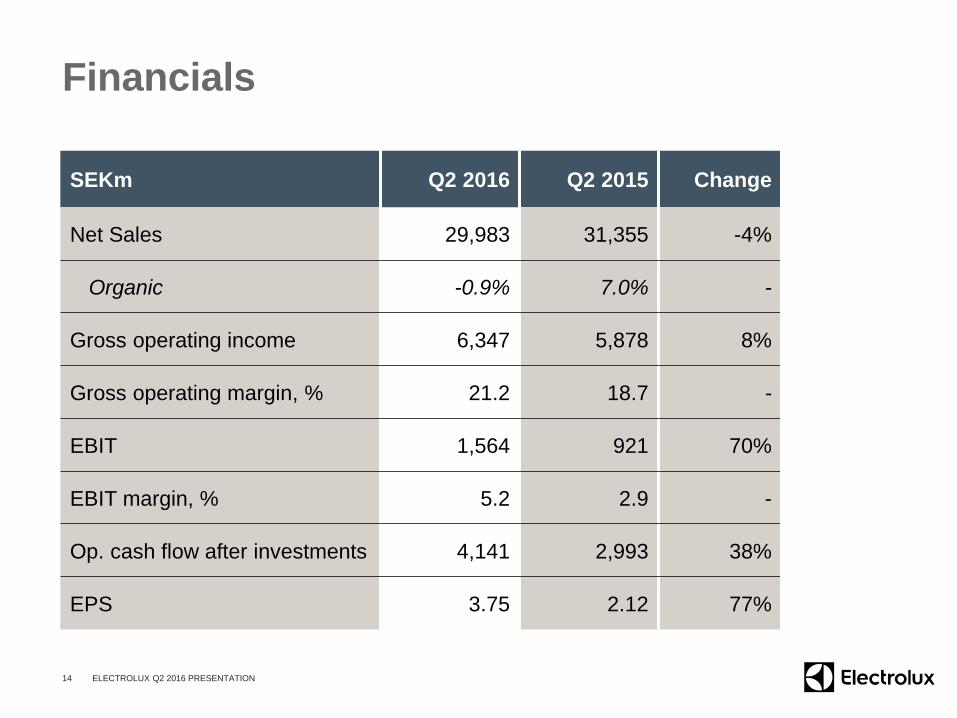
Financials
SEKm Q2 2016 Q2 2015 Change
Net Sales 29,983 31,355 -4%
Organic -0.9% 7.0% -
Gross operating income 6,347 5,878 8%
Gross operating margin, % 21.2 18.7 -
EBIT 1,564 921 70%
EBIT margin, % 5.2 2.9 -
Op. cash flow after investments 4,141 2,993 38%
EPS 3.75 2.12 77%
14 ELECTROLUX Q2 2016 PRESENTATION
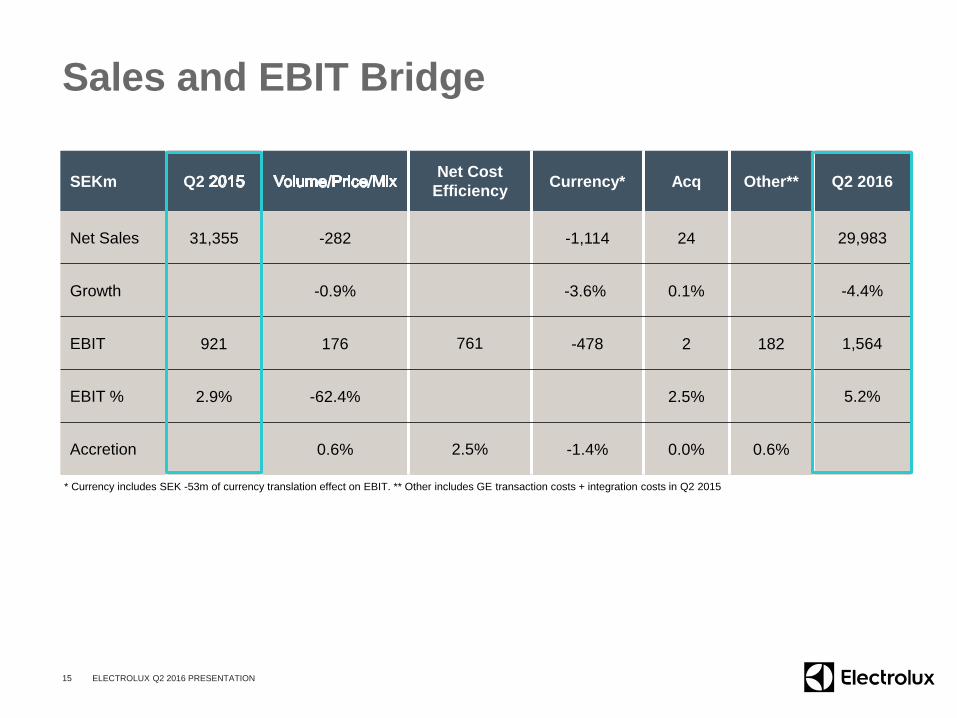
Sales and EBIT Bridge
SEKm Q2 Net Cost
EfficiencyCurrency* Acq Other** Q2 2016
Net Sales 31,355 -282 -1,114 24 29,983
Growth -0.9% -3.6% 0.1% -4.4%
EBIT 921 176 761 -478 2 182 1,564
EBIT % 2.9% -62.4% 2.5% 5.2%
Accretion 0.6% 2.5% -1.4% 0.0% 0.6%
15 ELECTROLUX Q2 2016 PRESENTATION
* Currency includes SEK -53m of currency translation effect on EBIT. ** Other includes GE transaction costs + integration costs in Q2 2015
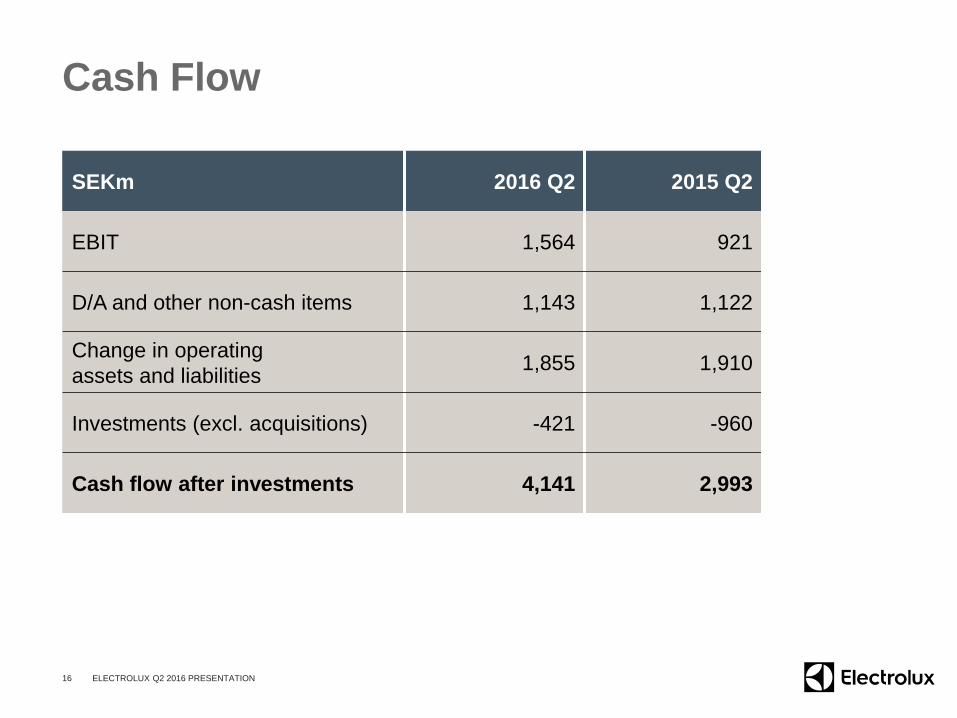
Cash Flow
SEKm 2016 Q2 2015 Q2
EBIT 1,564 921
D/A and other non-cash items 1,143 1,122
Change in operating
assets and liabilities1,855 1,910
Investments (excl. acquisitions) -421 -960
Cash flow after investments 4,141 2,993
16 ELECTROLUX Q2 2016 PRESENTATION
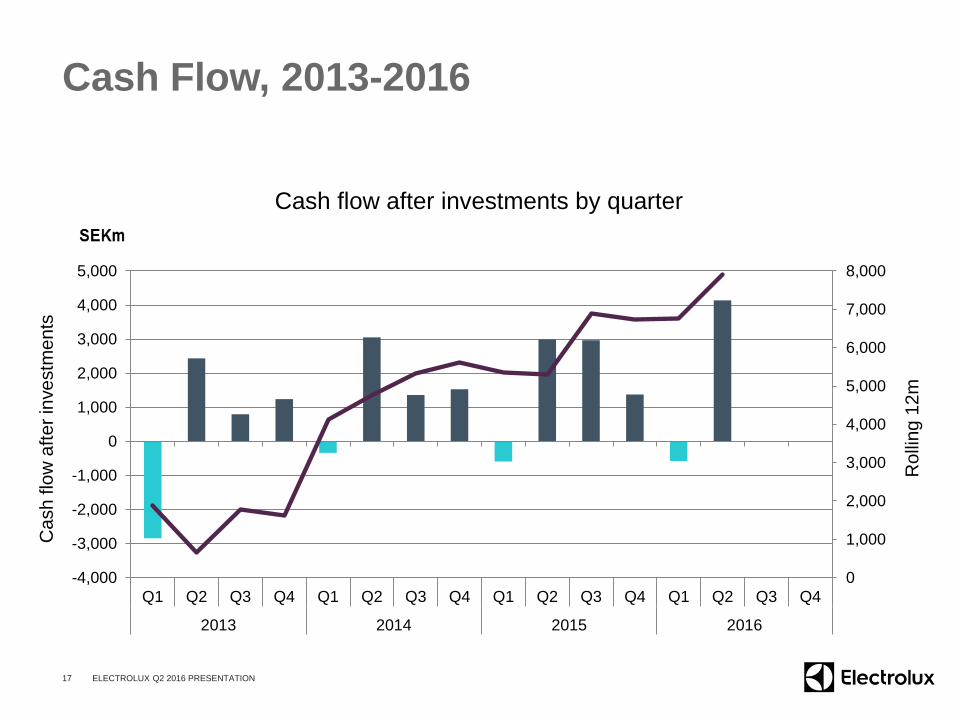
Cash Flow, 2013-2016
Cash flow after investments by quarter
17 ELECTROLUX Q2 2016 PRESENTATION
Cash flo
w a
fter
investm
ents
Ro
llin
g 1
2m
0
1,000
2,000
3,000
4,000
5,000
6,000
7,000
8,000
-4,000
-3,000
-2,000
-1,000
0
1,000
2,000
3,000
4,000
5,000
Q1 Q2 Q3 Q4 Q1 Q2 Q3 Q4 Q1 Q2 Q3 Q4 Q1 Q2 Q3 Q4
2013 2014 2015 2016
Outlook and
Summary
Jonas Samuelson, President and CEO
Anna Ohlsson-Leijon, CFO
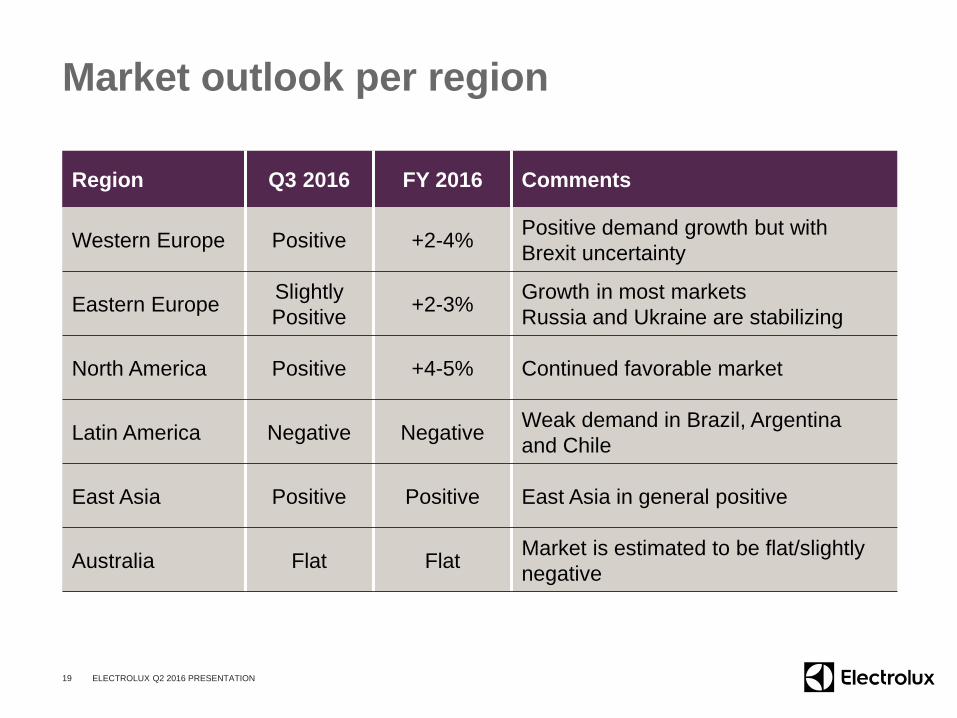
Market outlook per region
Region Q3 2016 FY 2016 Comments
Western Europe Positive +2-4%Positive demand growth but with
Brexit uncertainty
Eastern EuropeSlightly
Positive+2-3%
Growth in most markets
Russia and Ukraine are stabilizing
North America Positive +4-5% Continued favorable market
Latin America Negative NegativeWeak demand in Brazil, Argentina
and Chile
East Asia Positive Positive East Asia in general positive
Australia Flat FlatMarket is estimated to be flat/slightly
negative
19 ELECTROLUX Q2 2016 PRESENTATION
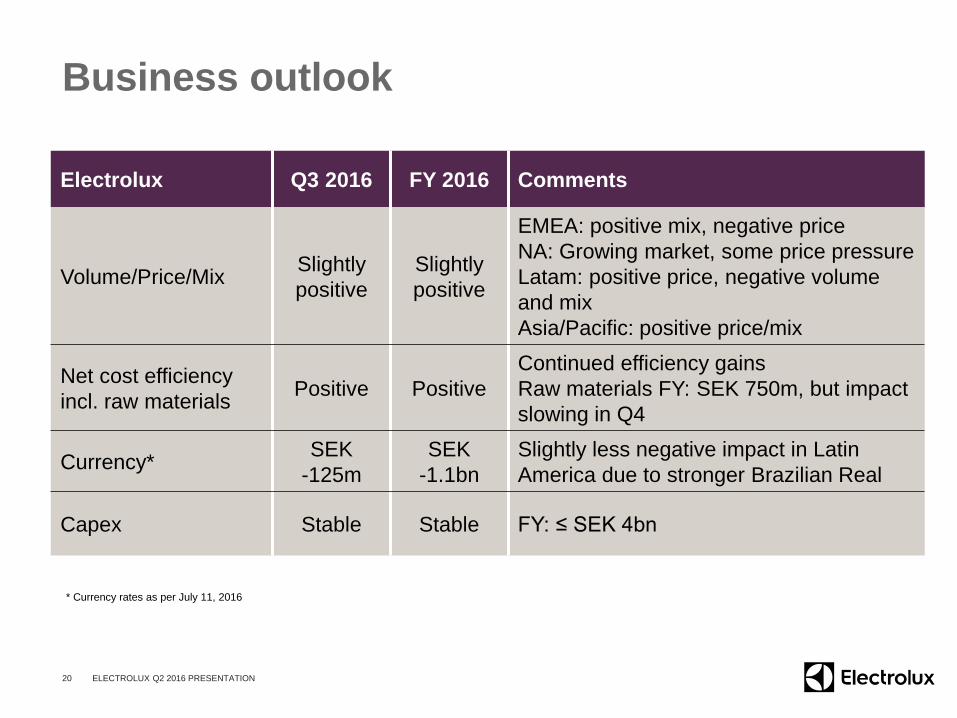
Business outlook
Electrolux Q3 2016 FY 2016 Comments
Volume/Price/MixSlightly
positive
Slightly
positive
EMEA: positive mix, negative price
NA: Growing market, some price pressure
Latam: positive price, negative volume
and mix
Asia/Pacific: positive price/mix
Net cost efficiency
incl. raw materialsPositive Positive
Continued efficiency gains
Raw materials FY: SEK 750m, but impact
slowing in Q4
Currency*SEK
-125m
SEK
-1.1bn
Slightly less negative impact in Latin
America due to stronger Brazilian Real
Capex Stable Stable FY: ≤ SEK 4bn
20 ELECTROLUX Q2 2016 PRESENTATION
* Currency rates as per July 11, 2016
21
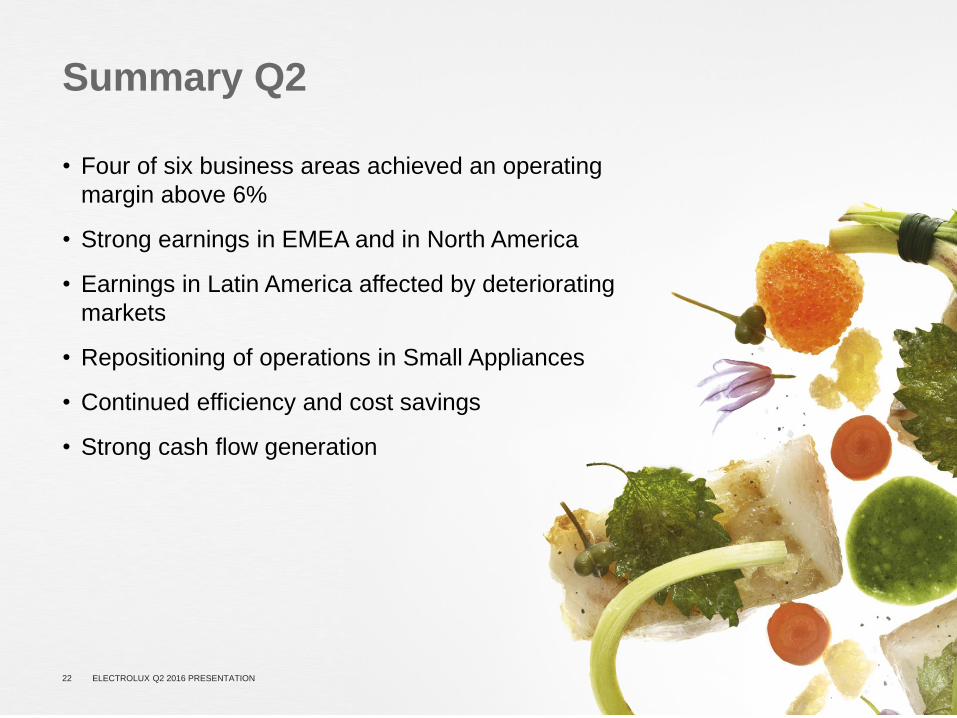
Summary Q2
• Four of six business areas achieved an operating
margin above 6%
• Strong earnings in EMEA and in North America
• Earnings in Latin America affected by deteriorating
markets
• Repositioning of operations in Small Appliances
• Continued efficiency and cost savings
• Strong cash flow generation
22 ELECTROLUX Q2 2016 PRESENTATION
Factors affecting forward-looking
statements
Factors affecting forward-looking statements
This presentation contains “forward-looking” statements within the meaning of the US Private
Securities Litigation Reform Act of 1995. Such statements include, among others, the financial goals
and targets of Electrolux for future periods and future business and financial plans. These statements
are based on current expectations and are subject to risks and uncertainties that could cause actual
results to differ materially due to a variety of factors. These factors include, but may not be limited to
the following: consumer demand and market conditions in the geographical areas and industries in
which Electrolux operates, effects of currency fluctuations, competitive pressures to reduce prices,
significant loss of business from major retailers, the success in developing new products and
marketing initiatives, developments in product liability litigation, progress in achieving operational and
capital efficiency goals, the success in identifying growth opportunities and acquisition candidates
and the integration of these opportunities with existing businesses, progress in achieving structural
and supply-chain reorganization goals.
23 ELECTROLUX Q2 2016 PRESENTATION