Embed Size (px)
Citation preview
Elmos half-year report January 1 − June 30, 2016 | 1
Products on the cutting edgeHalf-year report HY1 2016H
H
2
Elmos interim report HY1 2016
Overview
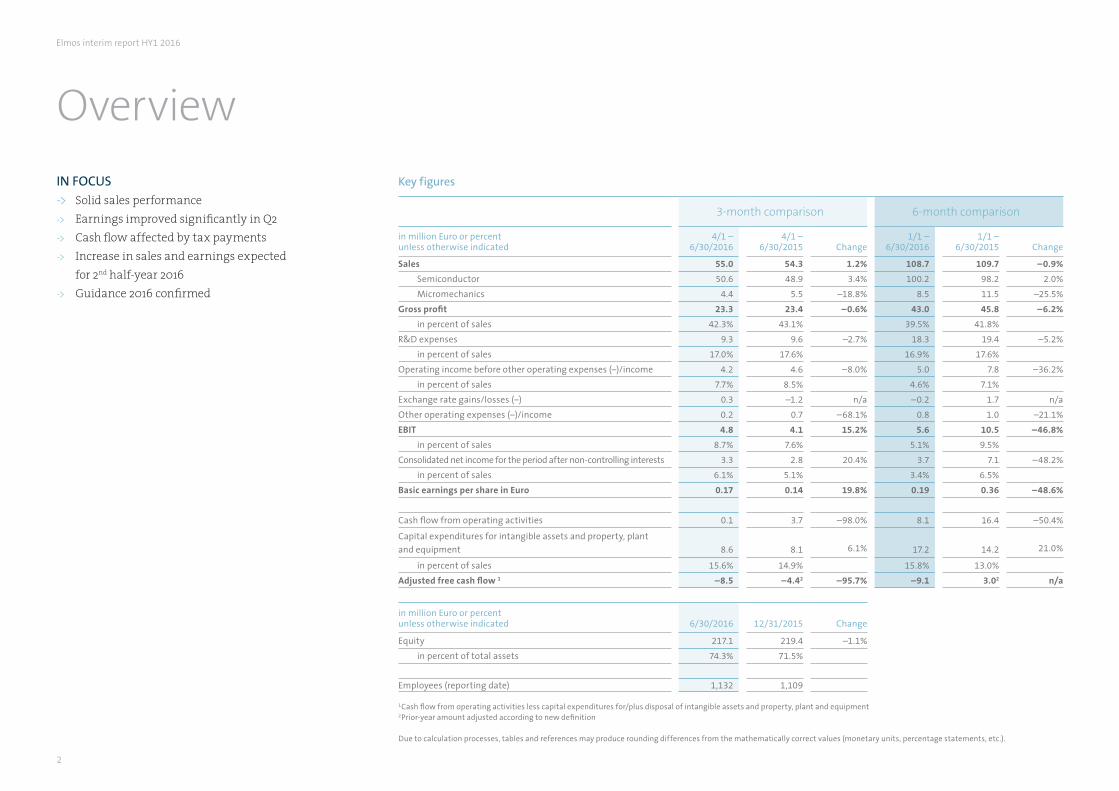
IN FOCUS-> Solid sales performance -> Earnings improved significantly in Q2 -> Cash flow affected by tax payments -> Increase in sales and earnings expected for 2nd half-year 2016 -> Guidance 2016 confirmed
1Cash flow from operating activities less capital expenditures for/plus disposal of intangible assets and property, plant and equipment 2Prior-year amount adjusted according to new definition
Due to calculation processes, tables and references may produce rounding differences from the mathematically correct values (monetary units, percentage statements, etc.).
Key figures
3-month comparison 6-month comparison
in million Euro or percentunless otherwise indicated
4/1 – 6/30/2016
4/1 – 6/30/2015 Change
1/1 – 6/30/2016
1/1 – 6/30/2015 Change
Sales 55.0 54.3 1.2% 108.7 109.7 –0.9%
Semiconductor 50.6 48.9 3.4% 100.2 98.2 2.0%
Micromechanics 4.4 5.5 –18.8% 8.5 11.5 –25.5%
Gross profit 23.3 23.4 –0.6% 43.0 45.8 –6.2%
in percent of sales 42.3% 43.1% 39.5% 41.8%
R&D expenses 9.3 9.6 –2.7% 18.3 19.4 –5.2%
in percent of sales 17.0% 17.6% 16.9% 17.6%
Operating income before other operating expenses (–)/income 4.2 4.6 –8.0% 5.0 7.8 –36.2%
in percent of sales 7.7% 8.5% 4.6% 7.1%
Exchange rate gains/losses (–) 0.3 –1.2 n/a –0.2 1.7 n/a
Other operating expenses (–)/income 0.2 0.7 –68.1% 0.8 1.0 –21.1%
EBIT 4.8 4.1 15.2% 5.6 10.5 –46.8%
in percent of sales 8.7% 7.6% 5.1% 9.5%
Consolidated net income for the period after non-controlling interests 3.3 2.8 20.4% 3.7 7.1 –48.2%
in percent of sales 6.1% 5.1% 3.4% 6.5%
Basic earnings per share in Euro 0.17 0.14 19.8% 0.19 0.36 –48.6%
Cash flow from operating activities 0.1 3.7 –98.0% 8.1 16.4 –50.4%
Capital expenditures for intangible assets and property, plant and equipment 8.6 8.1 6.1% 17.2 14.2 21.0%
in percent of sales 15.6% 14.9% 15.8% 13.0%
Adjusted free cash flow 1 –8.5 –4.42 –95.7% –9.1 3.02 n/a
in million Euro or percentunless otherwise indicated 6/30/2016 12/31/2015 Change
Equity 217.1 219.4 –1.1%
in percent of total assets 74.3% 71.5%
Employees (reporting date) 1,132 1,109
Elmos half-year report January 1 − June 30, 2016 | 3
Interim group management report
BUSINESS PERFORMANCESales performance and order situation
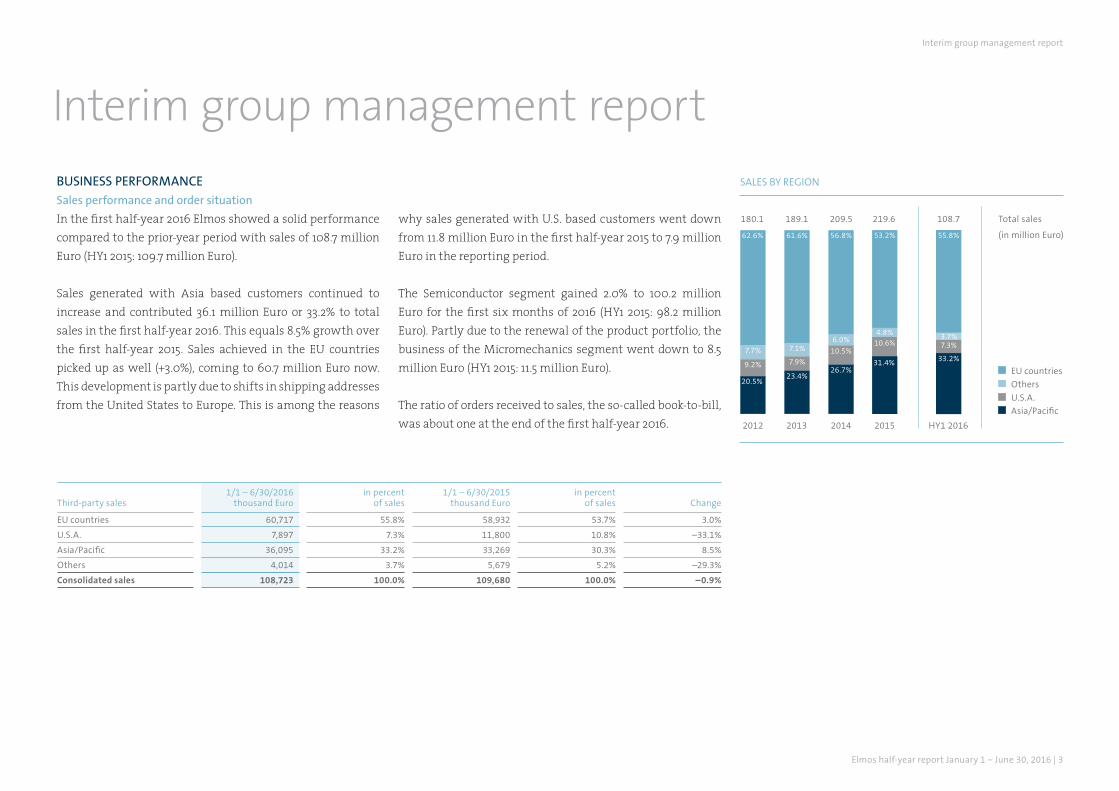
In the first half-year 2016 Elmos showed a solid performance compared to the prior-year period with sales of 108.7 million Euro (HY1 2015: 109.7 million Euro).
Sales generated with Asia based customers continued to increase and contributed 36.1 million Euro or 33.2% to total sales in the first half-year 2016. This equals 8.5% growth over the first half-year 2015. Sales achieved in the EU countries picked up as well (+3.0%), coming to 60.7 million Euro now. This development is partly due to shifts in shipping addresses from the United States to Europe. This is among the reasons
why sales generated with U.S. based customers went down from 11.8 million Euro in the first half-year 2015 to 7.9 million Euro in the reporting period.
The Semiconductor segment gained 2.0% to 100.2 million Euro for the first six months of 2016 (HY1 2015: 98.2 million Euro). Partly due to the renewal of the product portfolio, the business of the Micromechanics segment went down to 8.5 million Euro (HY1 2015: 11.5 million Euro).
The ratio of orders received to sales, the so-called book-to-bill, was about one at the end of the first half-year 2016.
Third-party sales1/1 – 6/30/2016
thousand Euroin percent
of sales1/1 – 6/30/2015
thousand Euroin percent
of sales Change
EU countries 60,717 55.8% 58,932 53.7% 3.0%
U.S.A. 7,897 7.3% 11,800 10.8% –33.1%
Asia/Pacific 36,095 33.2% 33,269 30.3% 8.5%
Others 4,014 3.7% 5,679 5.2% –29.3%
Consolidated sales 108,723 100.0% 109,680 100.0% –0.9%
EU countries
Others
U.S.A.
Asia/Pacific
SALES BY REGION
Total sales
(in million Euro)62.6% 61.6% 56.8%
7.7% 7.1%6.0%
9.2% 7.9%10.5%
20.5%23.4%
26.7%
HY1 2016
33.2%
7.3%3.7%
55.8%
108.7
2012
180.1
2013
189.1
2014 2015
209.5
31.4%
10.6%4.8%
53.2%
219.6
Interim group management report
4
Elmos interim report HY1 2016
Profit and financial position as well as assets and liabilities
The gross profit dropped by 6.2% in the first half-year 2016 to 43.0 million Euro (HY1 2015: 45.8 million Euro) due to temporary shortfalls in production efficiency as well as dynamic project ramp-ups in the first quarter of 2016. The gross margin thus came to 39.5% of sales in the first six months of 2016 (HY1 2015: 41.8%).
Research and development expenses went down in the half-year under review from 19.4 million Euro to 18.3 million Euro or rather from 17.6% to 16.9% of sales. Distribution expenses in the first half-year 2016 remained almost constant at 9.9 million Euro or 9.1% of sales (HY1 2015: 9.8 million Euro or 8.9%). Administrative expenses went up to 9.7 million Euro and thus came to 9.0% in relation to sales (HY1 2015: 8.9 million Euro or 8.1%). Accordingly the operating income before other operating expenses and income amounted to 5.0 million Euro for the first half-year 2016 compared to 7.8 million Euro for the prior-year period.
Earnings before interest and taxes (EBIT) went down from 10.5 million Euro to 5.6 million Euro in the reporting period. This reflects an EBIT margin of 5.1% (HY1 2015: 9.5%). It has to be considered here that the prior-year period’s EBIT benefited from exchange rate gains in the amount of 1.7 million Euro as compared to exchange rate losses of 0.2 million Euro incurred in the first half-year 2016.
After taxes, Elmos achieved a consolidated net income attributable to owners of the parent in the amount of 3.7 million Euro in the first six months of 2016 (HY1 2015: 7.1 million Euro). The consolidated net income equals basic earnings per share (EPS) of 0.19 Euro for the first half-year 2016 (HY1 2015: 0.36 Euro).
The cash flow from operating activities came to 8.1 million Euro in the first six months of 2016 and thus fell short of the prior-year amount (HY1 2015: 16.4 million Euro). This development is caused by tax payments in the amount of 8.0 million Euro on the one hand (HY1 2015: 2.0 million Euro) and a decrease in trade payables in the amount of 5.8 million Euro on the other hand (HY1 2015: increase by 0.3 million Euro).
Capital expenditures for intangible assets and property, plant and equipment came to 17.2 million Euro or 15.8% of sales in the first half-year 2016 (HY1 2015: 14.2 million Euro or 13.0% of sales). Due to these cash-effective payments, the adjusted free cash flow (cash flow from operating activities less capital expenditures for/plus disposal of intangible assets and property, plant and equipment) for the reporting period was –9.1 million Euro as compared to 3.0 million Euro1 for the prior-year period.
Cash, cash equivalents and marketable securities went down from 90.5 million Euro as of December 31, 2015 to 72.1 million Euro as of June 30, 2016. This is due primarily to the dividend payment in the amount of 6.5 million Euro, tax payments, and the decrease in trade payables. Accordingly net cash dropped from 53.7 million Euro as of December 31, 2015 to 35.7 million Euro as of June 30, 2016. The equity ratio was 74.3% as of June 30, 2016 (December 31, 2015: 71.5%).
Economic environment
The global car markets did not indicate a consistent trend in the first half-year 2016. While Western Europe and China recorded growth, the number of new vehicles stagnates in the U.S.A., and in Japan the number of new registrations dropped once more, according to the German Association of the Automotive Industry (VDA).
Compared to the prior-year period, the automotive market in Western Europe gained 8.5% in the first six months of 2016 to 7.5 million new vehicles, according to the European Automobile Manufacturers’ Association (ACEA). Above-average growth rates were achieved by Italy (+19.2%) and Spain (+12.2%), among others. France (+8.3%) and Germany (+7.1%) reported pleasant growth figures as well while Great Britain registered below-average growth at +3.2%. “The course of this year so far indicates that 2016 will become another year of growth,” says Matthias Wissmann, President of the German Association of the Automotive Industry (VDA) with respect to Western Europe.
1 Prior-year amount adjusted according to new definition
Elmos half-year report January 1 − June 30, 2016 | 5
The U.S.A. market for light vehicles (passenger cars and light trucks) stagnates at a high level with a 1% gain to 8.6 million new vehicles, according to the VDA.
China’s automotive economy continues to be the global growth driver. In the first half-year 2016 passenger car sales of 10.6 million vehicles were about 12% above the mark of the prior-year period.
Car demand in Japan continues to be weak. Sales of 2.1 million units in the first six months of 2016 fell short of the prior-year level by more than 5% .
Significant events
Dr. Anton Mindl, CEO, and Dr. Arne Schneider, CFO, explained the past fiscal year and the forecast for 2016 within the framework of annual press conference and analysts’ conference held in March 2016. At the Annual General Meeting in May, the Management Board also explained the business situation to the shareholders in attendance. Furthermore, the shareholders agreed to the proposed dividend of 0.33 Euro per share.
The Elmos Supervisory Board has appointed Guido Meyer (49) new member of the Management Board effective January 1, 2017. He will be responsible for Production and Logistics. Acting Management Board member for Production Reinhard Senf (64) will retire as of December 31, 2016 and will therefore leave the Management Board.
In January 2016 Elmos acquired shares in a company concerned with sensor technology. This company is included in the consolidated financial statements as an associated company.
In the first half-year 2016 Elmos presented its products at the trade shows “embedded world 2016” in Nuremberg, “electronica China” in Shanghai, and “Sensor+Test” in Nuremberg and received highly positive customer feedback.
Furthermore, Elmos has presented its new product catalog, added a new distributor for subsidiary SMI and provided the option, together with distributor MEV, for direct orders of Elmos ASSPs. Moreover, SMI introduced a high-precision pressure sensor for medical applications and other fields of use.
OTHER DISCLOSURESStaff development
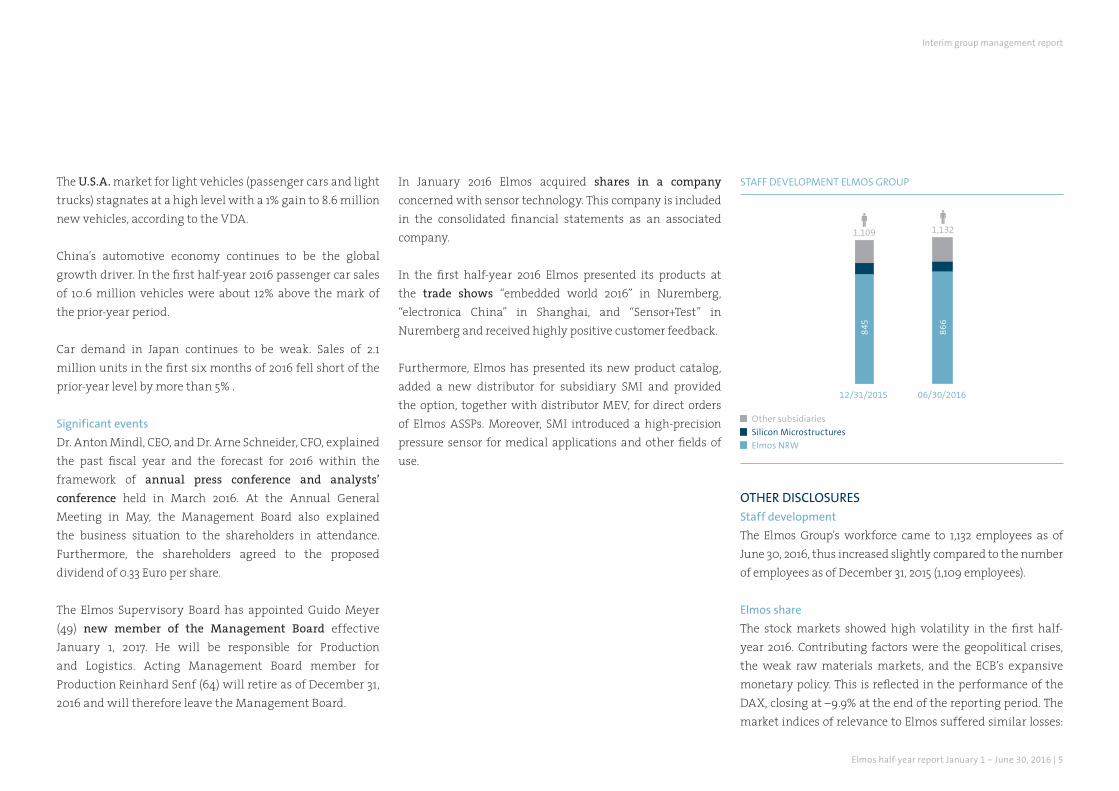
The Elmos Group’s workforce came to 1,132 employees as of June 30, 2016, thus increased slightly compared to the number of employees as of December 31, 2015 (1,109 employees).
Elmos share
The stock markets showed high volatility in the first half-year 2016. Contributing factors were the geopolitical crises, the weak raw materials markets, and the ECB’s expansive monetary policy. This is reflected in the performance of the DAX, closing at –9.9% at the end of the reporting period. The market indices of relevance to Elmos suffered similar losses:
Interim group management report
STAFF DEVELOPMENT ELMOS GROUP
12/31/2015 06/30/2016
1,109
845
1,132
Other subsidiaries
Silicon Microstructures
Elmos NRW
866
6
Elmos interim report HY1 2016
COMPANY BOARDS Supervisory Board
Prof. Dr. Günter Zimmer, chairmanGraduate physicist | Duisburg
Dr. Burkhard Dreher, deputy chairmanGraduate economist | DortmundMember and deputy chairman of theSupervisory Board until May 11, 2016
Dr. Klaus Weyer, deputy chairmanGraduate physicist | PenzbergDeputy chairman as of May 11, 2016
Dr. Gottfried Dutiné Graduate engineer | KleveMember of the Supervisory Board as of May 11, 2016
Dr. Klaus EggerGraduate engineer | Steyr-Gleink, Austria
Thomas Lehner1
Graduate engineer | Dortmund
Sven-Olaf Schellenberg1
Graduate physicist | Dortmund
1 Employee representatives
Management Board
Dr. Anton Mindl, chairmanGraduate physicist | Lüdenscheid
Dr. Arne SchneiderGraduate economist | Munich
Reinhard SenfGraduate engineer | Iserlohn
Dr. Peter GeiselhartGraduate physicist | Ettlingen
TecDAX, DAXsector Technology and Technology All Share dropped 12.5%, 4.4% and 12.9% respectively in the first half-year 2016.
The Elmos share did not manage to disconnect from this negative environment. The share price reached its high on January 4, 2016 at 15.035 Euro and its low on February 25, 2016 at 10.20 Euro. The share price dropped altogether by 30.8% over the first half-year 2016. Market capitalization amounted to 221.0 million Euro as of June 30, 2016, based on 19.9 million shares issued and a closing price of 11.08 Euro (Xetra closing prices).
The daily trading volume of the first half-year 2016 was 23.4 thousand shares on average (Xetra and Frankfurt floor) and thus at the level of the 2015 average of 22.9 thousand shares. The treasury stock was reduced by servicing stock options with treasury shares, among other factors, to 180,880 shares as of June 30, 2016 (December 31, 2015: 214,587 treasury shares).
On June 6, 2016, Internationale Kapitalanlagegesellschaft mbH (Germany) exceeded the voting rights threshold of 3% and held 3.01% or 599,826 voting rights as of that date.
Elmos half-year report January 1 − June 30, 2016 | 7
OUTLOOKOpportunities and risks
Risk management and the individual corporate risks and opportunities are described in our Annual Report 2015. No material changes of the Company’s risks and opportunities as detailed therein have occurred in the first six months of 2016.
Economic framework
The Bundesbank sees the German economy continue on a growth path. The basic economic trend remains rather strong in spite of the Brexit, according to the Bundesbank in its recent monthly report of July 2016. A significant increase in the macroeconomic performance can be expected for the summer quarter. As reasons for their optimism, the experts cited the good situation in the job market, rising real income, and the monetary policy of the European Central Bank. However, the effects of the Brexit vote on the German economy are hardly assessable at the moment. Germany’s central bank anticipates a 1.7% increase for the gross domestic product in the current year.
The International Monetary Fund (IMF) anticipates a slightly weaker global economic performance compared to the forecast of April 2016 (3.2% growth) due to the Brexit. The fund now expects global economic growth of 3.1% for 2016 (as of July 2016). The effects of the Brexit will be felt primarily in Great Britain but also in the rest of Europe, according to the IMF, yet only to a smaller extent in other countries. However, there were encouraging signals in the first half-year, the IMF reports. The EU member states and Japan showed stronger growth than expected by the fund.
The VDA is optimistic for the remainder of the year 2016. “If the economy is in a rather good state, the auto industry will be okay, too.” If among other favorable factors the interest rates are low as we are experiencing in Germany and Europe right now, the momentum is high. The VDA offered this view when presenting the 6-month figures in July 2016. The VDA expects that more than 80 million vehicles will be sold worldwide in 2016.
Outlook for the Elmos Group
Based on the currently available information and the performance of the first six months of 2016, the Management Board presents the following outlook for the full year 2016.
Elmos continues to expect a sales increase from 2% to 6% for 2016 compared to the previous year. The EBIT margin is anticipated to come to about 10%. For 2016, capital expenditures for intangible assets and property, plant and equipment are scheduled not to exceed 12% of sales. We expect that Elmos will generate a positive adjusted free cash flow in 2016 once more. The forecast is based on an exchange rate of 1.10 USD/EUR.
The underlying premise of this forecast is the assumption of a stable macroeconomic situation. In that case Elmos will participate in the positive development of the automotive semiconductor market in 2016. The electrification of these markets will continue. At the same time it holds true that such expectations can be affected by market turbulence. Particularly the consequences of the political and economic developments and crises in the international markets cannot be foreseen with respect to their effects on the global economy and our core market.
Interim group management report
8
Elmos interim report HY1 2016
Interim consolidated financial statements
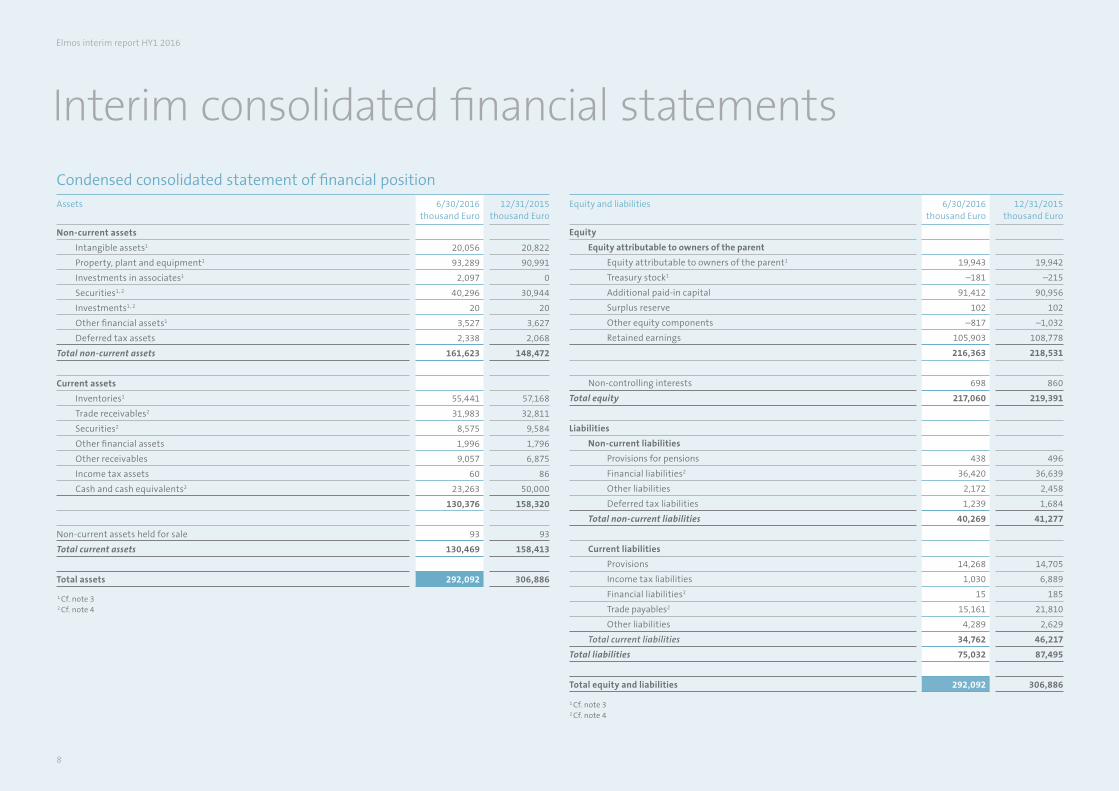
Condensed consolidated statement of financial positionAssets 6/30/2016
thousand Euro12/31/2015
thousand Euro
Non-current assets
Intangible assets1 20,056 20,822
Property, plant and equipment1 93,289 90,991
Investments in associates1 2,097 0
Securities1, 2 40,296 30,944
Investments1, 2 20 20
Other financial assets1 3,527 3,627
Deferred tax assets 2,338 2,068
Total non-current assets 161,623 148,472
Current assets
Inventories1 55,441 57,168
Trade receivables2 31,983 32,811
Securities2 8,575 9,584
Other financial assets 1,996 1,796
Other receivables 9,057 6,875
Income tax assets 60 86
Cash and cash equivalents2 23,263 50,000
130,376 158,320
Non-current assets held for sale 93 93
Total current assets 130,469 158,413
Total assets 292,092 306,886
Equity and liabilities 6/30/2016thousand Euro
12/31/2015thousand Euro
Equity
Equity attributable to owners of the parent
Equity attributable to owners of the parent1 19,943 19,942
Treasury stock1 –181 –215
Additional paid-in capital 91,412 90,956
Surplus reserve 102 102
Other equity components –817 –1,032
Retained earnings 105,903 108,778
216,363 218,531
Non-controlling interests 698 860
Total equity 217,060 219,391
Liabilities
Non-current liabilities
Provisions for pensions 438 496
Financial liabilities2 36,420 36,639
Other liabilities 2,172 2,458
Deferred tax liabilities 1,239 1,684
Total non-current liabilities 40,269 41,277
Current liabilities
Provisions 14,268 14,705
Income tax liabilities 1,030 6,889
Financial liabilities2 15 185
Trade payables2 15,161 21,810
Other liabilities 4,289 2,629
Total current liabilities 34,762 46,217
Total liabilities 75,032 87,495
Total equity and liabilities 292,092 306,886
1 Cf. note 32 Cf. note 4
1 Cf. note 32 Cf. note 4
Elmos half-year report January 1 − June 30, 2016 | 9
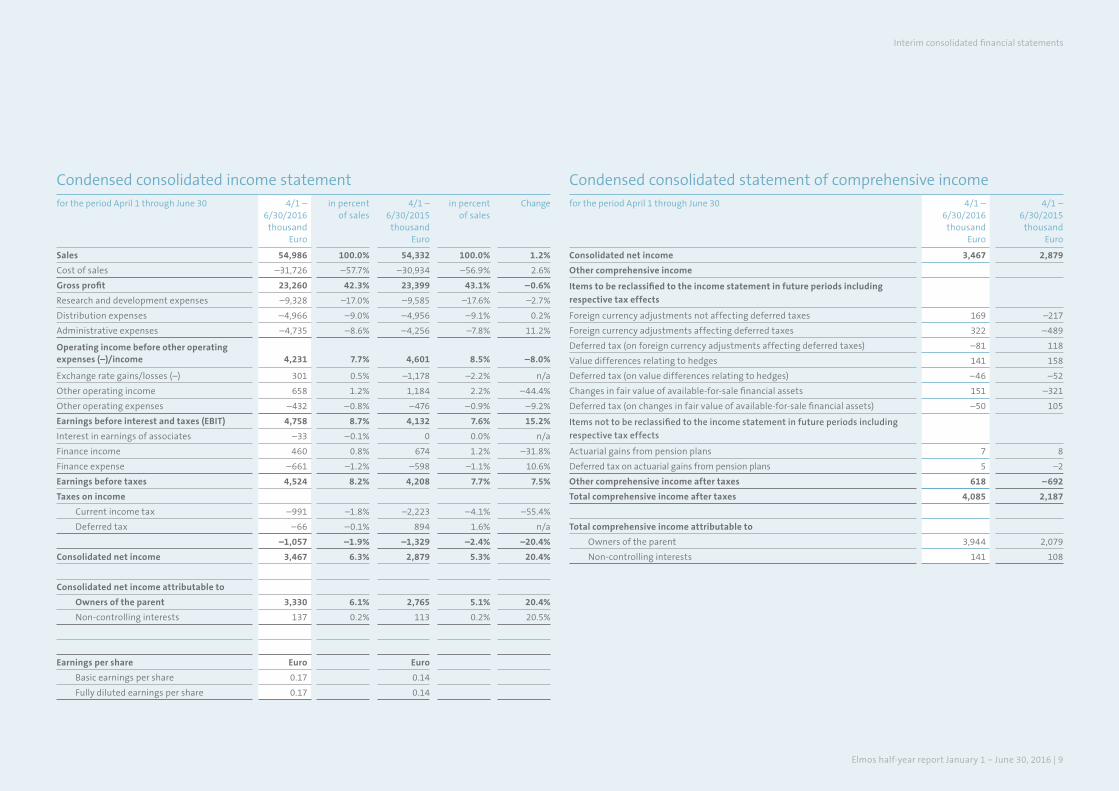
Condensed consolidated income statementfor the period April 1 through June 30 4/1 –
6/30/2016thousand
Euro
in percent of sales
4/1 – 6/30/2015
thousand Euro
in percent of sales
Change
Sales 54,986 100.0% 54,332 100.0% 1.2%
Cost of sales –31,726 –57.7% –30,934 –56.9% 2.6%
Gross profit 23,260 42.3% 23,399 43.1% –0.6%
Research and development expenses –9,328 –17.0% –9,585 –17.6% –2.7%
Distribution expenses –4,966 –9.0% –4,956 –9.1% 0.2%
Administrative expenses –4,735 –8.6% –4,256 –7.8% 11.2%
Operating income before other operating expenses (–)/income 4,231 7.7% 4,601 8.5% –8.0%
Exchange rate gains/losses (–) 301 0.5% –1,178 –2.2% n/a
Other operating income 658 1.2% 1,184 2.2% –44.4%
Other operating expenses –432 –0.8% –476 –0.9% –9.2%
Earnings before interest and taxes (EBIT) 4,758 8.7% 4,132 7.6% 15.2%
Interest in earnings of associates –33 –0.1% 0 0.0% n/a
Finance income 460 0.8% 674 1.2% –31.8%
Finance expense –661 –1.2% –598 –1.1% 10.6%
Earnings before taxes 4,524 8.2% 4,208 7.7% 7.5%
Taxes on income
Current income tax –991 –1.8% –2,223 –4.1% –55.4%
Deferred tax –66 –0.1% 894 1.6% n/a
–1,057 –1.9% –1,329 –2.4% –20.4%
Consolidated net income 3,467 6.3% 2,879 5.3% 20.4%
Consolidated net income attributable to
Owners of the parent 3,330 6.1% 2,765 5.1% 20.4%
Non-controlling interests 137 0.2% 113 0.2% 20.5%
Earnings per share Euro Euro
Basic earnings per share 0.17 0.14
Fully diluted earnings per share 0.17 0.14
Condensed consolidated statement of comprehensive incomefor the period April 1 through June 30 4/1 –
6/30/2016thousand
Euro
4/1 – 6/30/2015
thousand Euro
Consolidated net income 3,467 2,879
Other comprehensive income
Items to be reclassified to the income statement in future periods including
respective tax effects
Foreign currency adjustments not affecting deferred taxes 169 –217
Foreign currency adjustments affecting deferred taxes 322 –489
Deferred tax (on foreign currency adjustments affecting deferred taxes) –81 118
Value differences relating to hedges 141 158
Deferred tax (on value differences relating to hedges) –46 –52
Changes in fair value of available-for-sale financial assets 151 –321
Deferred tax (on changes in fair value of available-for-sale financial assets) –50 105
Items not to be reclassified to the income statement in future periods including
respective tax effects
Actuarial gains from pension plans 7 8
Deferred tax on actuarial gains from pension plans 5 –2
Other comprehensive income after taxes 618 –692
Total comprehensive income after taxes 4,085 2,187
Total comprehensive income attributable to
Owners of the parent 3,944 2,079
Non-controlling interests 141 108
Interim consolidated financial statements
10
Elmos interim report HY1 2016
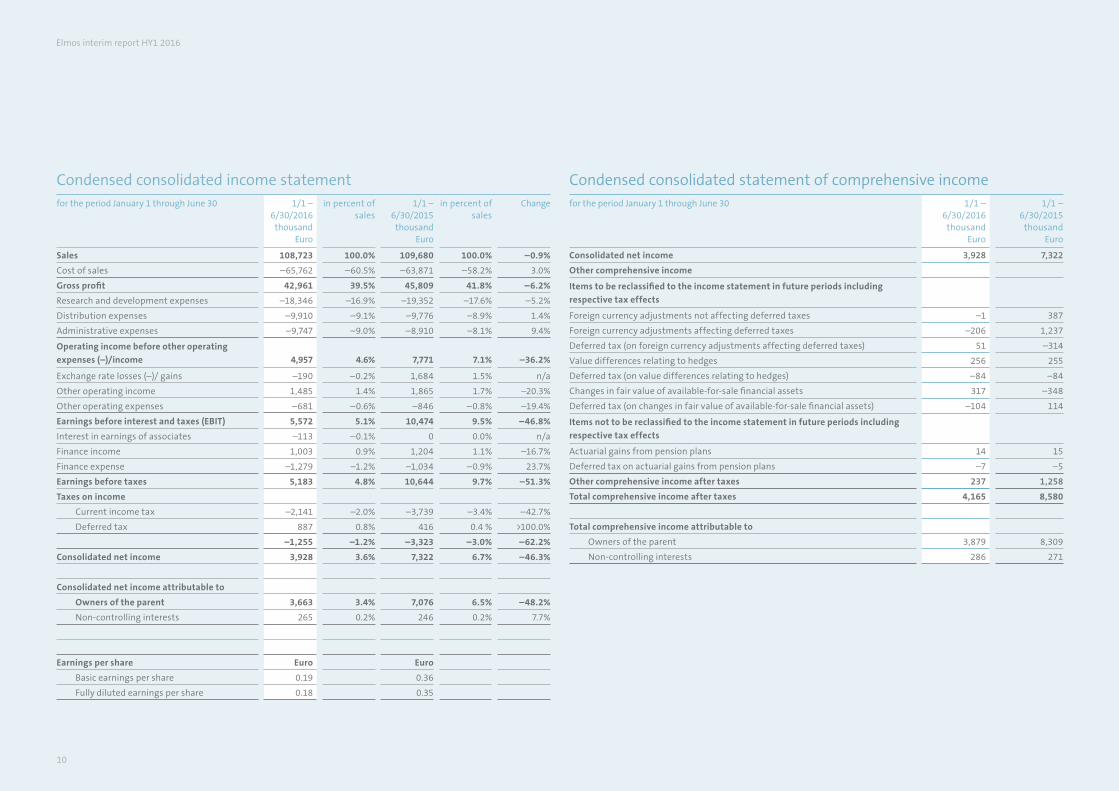
Condensed consolidated income statementfor the period January 1 through June 30 1/1 –
6/30/2016thousand
Euro
in percent of sales
1/1 – 6/30/2015
thousand Euro
in percent of sales
Change
Sales 108,723 100.0% 109,680 100.0% –0.9%
Cost of sales –65,762 –60.5% –63,871 –58.2% 3.0%
Gross profit 42,961 39.5% 45,809 41.8% –6.2%
Research and development expenses –18,346 –16.9% –19,352 –17.6% –5.2%
Distribution expenses –9,910 –9.1% –9,776 –8.9% 1.4%
Administrative expenses –9,747 –9.0% –8,910 –8.1% 9.4%
Operating income before other operating
expenses (–)/income 4,957 4.6% 7,771 7.1% –36.2%
Exchange rate losses (–)/ gains –190 –0.2% 1,684 1.5% n/a
Other operating income 1,485 1.4% 1,865 1.7% –20.3%
Other operating expenses –681 –0.6% –846 –0.8% –19.4%
Earnings before interest and taxes (EBIT) 5,572 5.1% 10,474 9.5% –46.8%
Interest in earnings of associates –113 –0.1% 0 0.0% n/a
Finance income 1,003 0.9% 1,204 1.1% –16.7%
Finance expense –1,279 –1.2% –1,034 –0.9% 23.7%
Earnings before taxes 5,183 4.8% 10,644 9.7% –51.3%
Taxes on income
Current income tax –2,141 –2.0% –3,739 –3.4% –42.7%
Deferred tax 887 0.8% 416 0.4 % >100.0%
–1,255 –1.2% –3,323 –3.0% –62.2%
Consolidated net income 3,928 3.6% 7,322 6.7% –46.3%
Consolidated net income attributable to
Owners of the parent 3,663 3.4% 7,076 6.5% –48.2%
Non-controlling interests 265 0.2% 246 0.2% 7.7%
Earnings per share Euro Euro
Basic earnings per share 0.19 0.36
Fully diluted earnings per share 0.18 0.35
Condensed consolidated statement of comprehensive incomefor the period January 1 through June 30 1/1 –
6/30/2016thousand
Euro
1/1 – 6/30/2015
thousand Euro
Consolidated net income 3,928 7,322
Other comprehensive income
Items to be reclassified to the income statement in future periods including
respective tax effects
Foreign currency adjustments not affecting deferred taxes –1 387
Foreign currency adjustments affecting deferred taxes –206 1,237
Deferred tax (on foreign currency adjustments affecting deferred taxes) 51 –314
Value differences relating to hedges 256 255
Deferred tax (on value differences relating to hedges) –84 –84
Changes in fair value of available-for-sale financial assets 317 –348
Deferred tax (on changes in fair value of available-for-sale financial assets) –104 114
Items not to be reclassified to the income statement in future periods including
respective tax effects
Actuarial gains from pension plans 14 15
Deferred tax on actuarial gains from pension plans –7 –5
Other comprehensive income after taxes 237 1,258
Total comprehensive income after taxes 4,165 8,580
Total comprehensive income attributable to
Owners of the parent 3,879 8,309
Non-controlling interests 286 271
Elmos half-year report January 1 − June 30, 2016 | 11
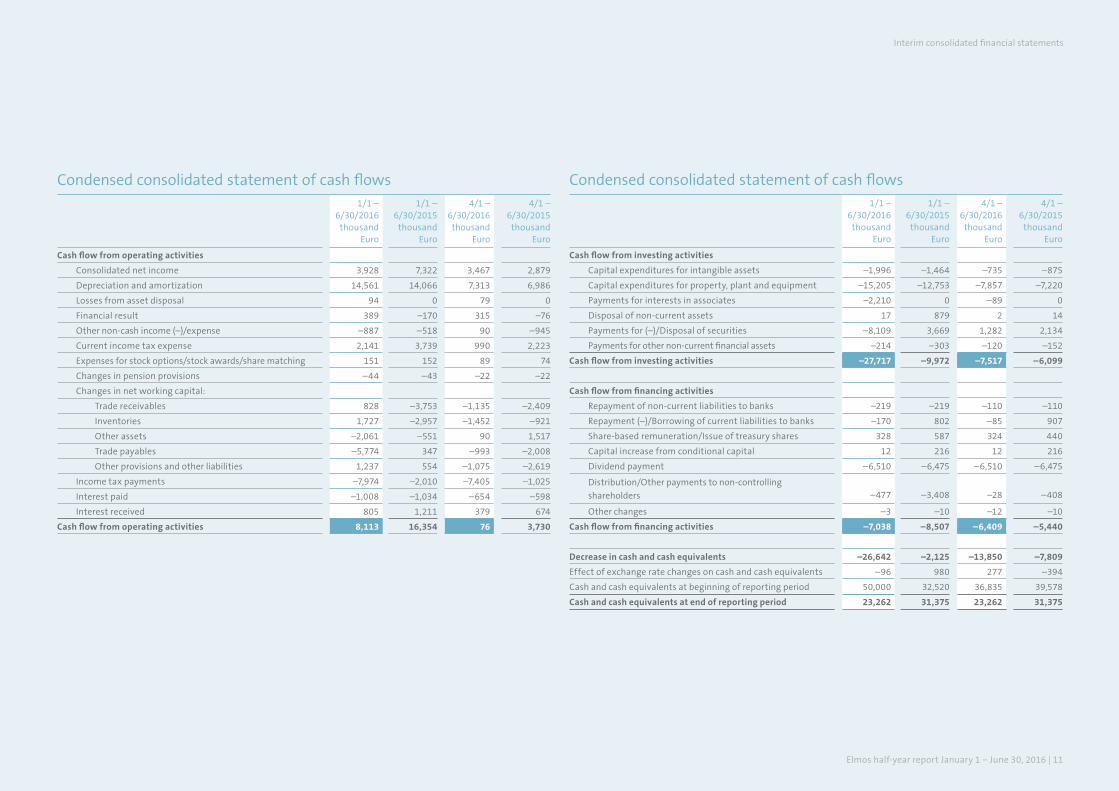
Condensed consolidated statement of cash flows1/1 –
6/30/2016thousand
Euro
1/1 – 6/30/2015
thousand Euro
4/1 – 6/30/2016
thousand Euro
4/1 – 6/30/2015
thousand Euro
Cash flow from operating activities
Consolidated net income 3,928 7,322 3,467 2,879
Depreciation and amortization 14,561 14,066 7,313 6,986
Losses from asset disposal 94 0 79 0
Financial result 389 –170 315 –76
Other non-cash income (–)/expense –887 –518 90 –945
Current income tax expense 2,141 3,739 990 2,223
Expenses for stock options/stock awards/share matching 151 152 89 74
Changes in pension provisions –44 –43 –22 –22
Changes in net working capital:
Trade receivables 828 –3,753 –1,135 –2,409
Inventories 1,727 –2,957 –1,452 –921
Other assets –2,061 –551 90 1,517
Trade payables –5,774 347 –993 –2,008
Other provisions and other liabilities 1,237 554 –1,075 –2,619
Income tax payments –7,974 –2,010 –7,405 –1,025
Interest paid –1,008 –1,034 –654 –598
Interest received 805 1,211 379 674
Cash flow from operating activities 8,113 16,354 76 3,730
Condensed consolidated statement of cash flows1/1 –
6/30/2016thousand
Euro
1/1 – 6/30/2015
thousand Euro
4/1 – 6/30/2016
thousand Euro
4/1 – 6/30/2015
thousand Euro
Cash flow from investing activities
Capital expenditures for intangible assets –1,996 –1,464 –735 –875
Capital expenditures for property, plant and equipment –15,205 –12,753 –7,857 –7,220
Payments for interests in associates –2,210 0 –89 0
Disposal of non-current assets 17 879 2 14
Payments for (–)/Disposal of securities –8,109 3,669 1,282 2,134
Payments for other non-current financial assets –214 –303 –120 –152
Cash flow from investing activities –27,717 –9,972 –7,517 –6,099
Cash flow from financing activities
Repayment of non-current liabilities to banks –219 –219 –110 –110
Repayment (–)/Borrowing of current liabilities to banks –170 802 –85 907
Share-based remuneration/Issue of treasury shares 328 587 324 440
Capital increase from conditional capital 12 216 12 216
Dividend payment –6,510 –6,475 –6,510 –6,475
Distribution/Other payments to non-controlling
shareholders –477 –3,408 –28 –408
Other changes –3 –10 –12 –10
Cash flow from financing activities –7,038 –8,507 –6,409 –5,440
Decrease in cash and cash equivalents –26,642 –2,125 –13,850 –7,809
Effect of exchange rate changes on cash and cash equivalents –96 980 277 –394
Cash and cash equivalents at beginning of reporting period 50,000 32,520 36,835 39,578
Cash and cash equivalents at end of reporting period 23,262 31,375 23,262 31,375
Interim consolidated financial statements
12
Elmos interim report HY1 2016
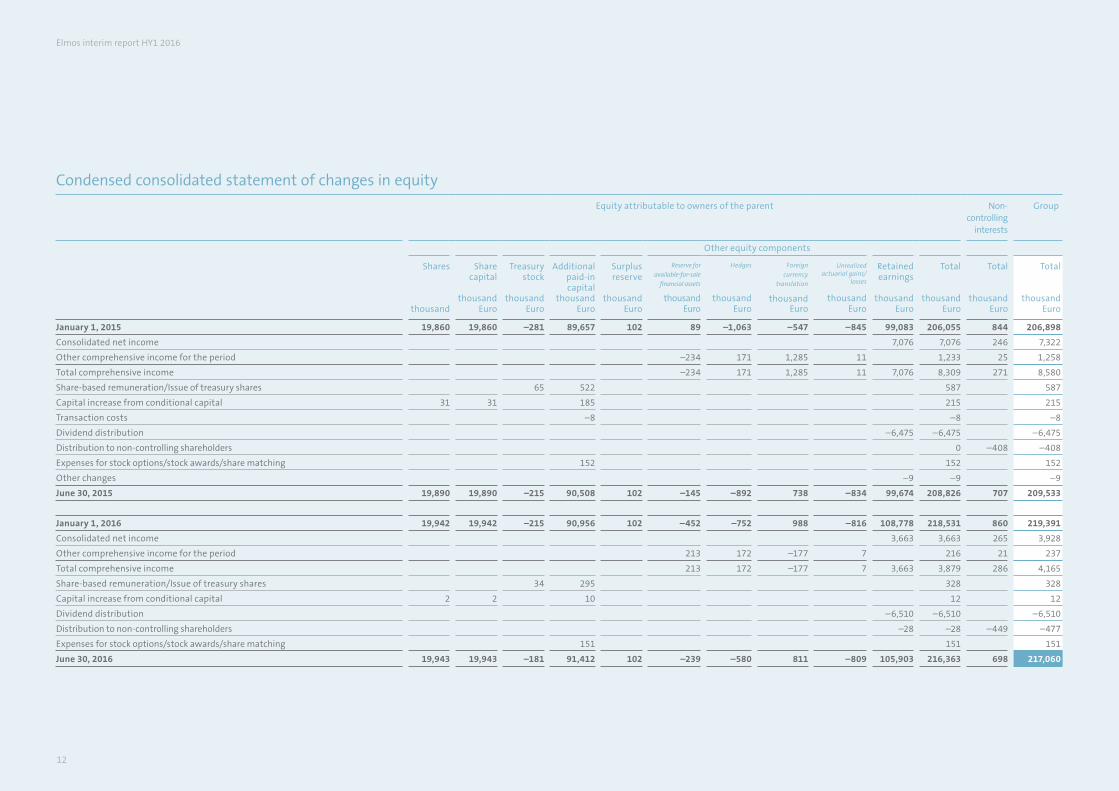
Condensed consolidated statement of changes in equity
Equity attributable to owners of the parent Non-controlling
interests
Group
Other equity components
Shares
thousand
Share capital
thousand
Euro
Treasury stock
thousand
Euro
Additional paid-in capital
thousand Euro
Surplus reserve
thousand Euro
Reserve for available-for-sale
financial assets
thousand Euro
Hedges
thousand Euro
Foreign currency
translation
thousand Euro
Unrealized actuarial gains/
losses
thousand Euro
Retained earnings
thousand Euro
Total
thousand Euro
Total
thousand Euro
Total
thousand Euro
January 1, 2015 19,860 19,860 –281 89,657 102 89 –1,063 –547 –845 99,083 206,055 844 206,898
Consolidated net income 7,076 7,076 246 7,322
Other comprehensive income for the period –234 171 1,285 11 1,233 25 1,258
Total comprehensive income –234 171 1,285 11 7,076 8,309 271 8,580
Share-based remuneration/Issue of treasury shares 65 522 587 587
Capital increase from conditional capital 31 31 185 215 215
Transaction costs –8 –8 –8
Dividend distribution –6,475 –6,475 –6,475
Distribution to non-controlling shareholders 0 –408 –408
Expenses for stock options/stock awards/share matching 152 152 152
Other changes –9 –9 –9
June 30, 2015 19,890 19,890 –215 90,508 102 –145 –892 738 –834 99,674 208,826 707 209,533
January 1, 2016 19,942 19,942 –215 90,956 102 –452 –752 988 –816 108,778 218,531 860 219,391
Consolidated net income 3,663 3,663 265 3,928
Other comprehensive income for the period 213 172 –177 7 216 21 237
Total comprehensive income 213 172 –177 7 3,663 3,879 286 4,165
Share-based remuneration/Issue of treasury shares 34 295 328 328
Capital increase from conditional capital 2 2 10 12 12
Dividend distribution –6,510 –6,510 –6,510
Distribution to non-controlling shareholders –28 –28 –449 –477
Expenses for stock options/stock awards/share matching 151 151 151
June 30, 2016 19,943 19,943 –181 91,412 102 –239 –580 811 –809 105,903 216,363 698 217,060
Elmos half-year report January 1 − June 30, 2016 | 13
The condensed interim consolidated financial statements for the 1st half-year 2016 were released for publication pursuant to Management Board resolution in August 2016.
1 – GENERAL INFORMATIONElmos Semiconductor Aktiengesellschaft (“the Company” or “Elmos”) has its registered office in Dortmund (Germany) and is entered in the register of companies maintained at Dortmund District Court (Amtsgericht), section B, no. 13698. The Articles of Incorporation are in effect in the version of March 26, 1999, last amended by resolution of the Annual General Meeting of May 11, 2016.
The Company’s business is the development, manufacture and distribution of microelectronic components and system parts (application specific integrated circuits, or in short: ASICs, and application specific standard products, or in short: ASSPs) as well as technological devices with similar functions. The Company may conduct all transactions suitable for serving the object of business directly or indirectly. The Company may establish branches, acquire or lease businesses of the same or a similar kind or invest in them, and conduct all business transactions that are beneficial to the Articles of Association. The Company is authorized to conduct business in Germany as well as abroad.
In addition to its domestic branches, the Company has sales companies and business locations in Europe, Asia, South Africa and the United States and cooperates with other German and international companies in the development and production of semiconductor chips.
The Company is a listed stock corporation and its shares are traded in the Prime Standard segment in Frankfurt/Main (Germany).
The address of the Company’s registered office is:44227 Dortmund/Germany, Heinrich-Hertz-Straße 1
Basic principles of the preparation of financial statements
The condensed interim consolidated financial statements for the period January 1 through June 30, 2016 have been prepared in accordance with IAS 34 “Interim Financial Reporting”. These financial statements do therefore not contain all the information and disclosures required for consolidated financial statements and should therefore be read in conjunction with the consolidated financial statements for the fiscal year ended December 31, 2015.
Essential accounting policies and valuation methods
For the preparation of the condensed interim consolidated financial statements, the same accounting policies and valuation methods have been adopted as were applied for the preparation of the consolidated financial statements for the fiscal year ended December 31, 2015, with the exception of the following amended IFRS standards and improvements listed below.
-> Amendments to IAS 1 – Disclosure Initiative-> Amendments to IAS 16 – Property, Plant and Equipment and IAS 38 – Intangible Assets: Clarification of Acceptable Methods of Depreciation and Amortization -> Amendments to IAS 16 – Property, Plant and Equipment and IAS 41 – Agriculture: Bearer Plants-> Amendments to IAS 19 – Employee Benefits: Employee Contributions-> Amendments to IAS 27 – Separate Financial Statements: Equity Method in Separate Financial Statements -> Amendments to IFRS 11 – Joint Arrangements: Accounting for Acquisitions of Interests in Joint Operations-> Improvements to IFRS 2010-2012-> Improvements to IFRS 2012-2014
First-time application of these amended standards or improvements had no effect on the Group’s profit and financial position and assets and liabilities.
Condensed notes to consolidated financial statements
Interim consolidated financial statements/Condensed notes to the consolidated financial statements
14
Elmos interim report HY1 2016
Estimates and assumptions
The Company recognizes provisions for pension obligations pursuant to IAS 19. For 2016 an actuarial interest rate of 1.95% has been applied, unchanged from December 31, 2015.
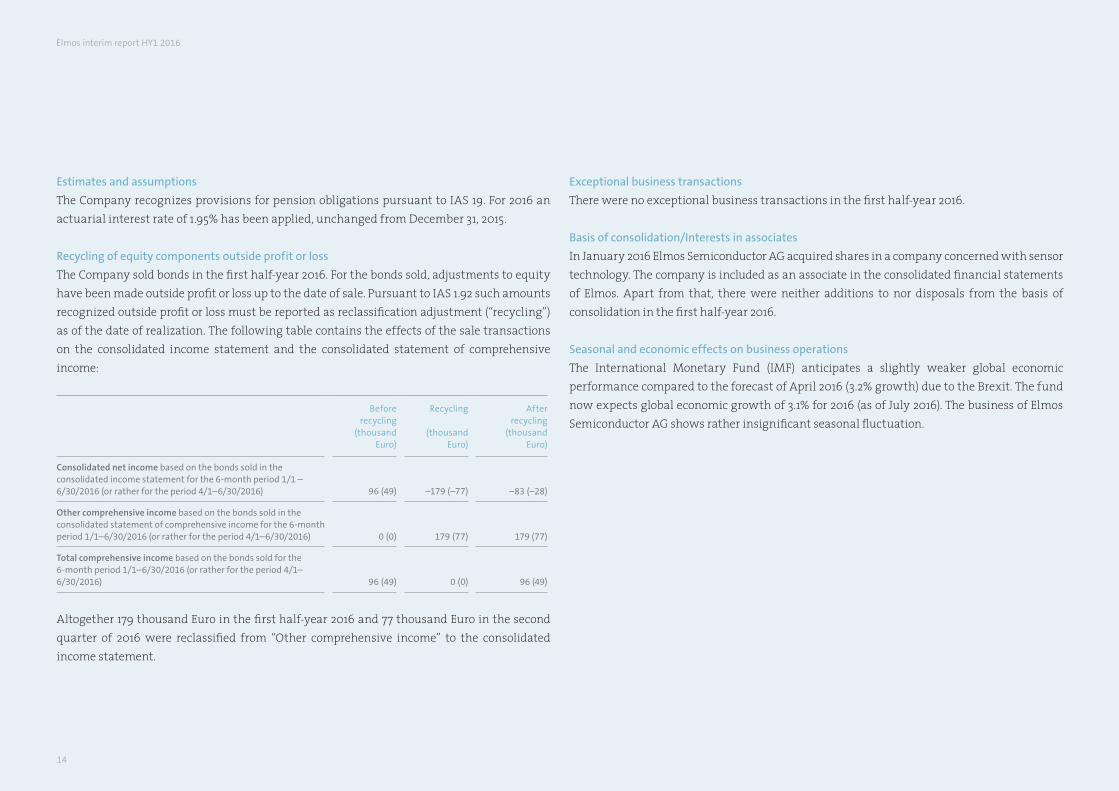
Recycling of equity components outside profit or loss
The Company sold bonds in the first half-year 2016. For the bonds sold, adjustments to equity have been made outside profit or loss up to the date of sale. Pursuant to IAS 1.92 such amounts recognized outside profit or loss must be reported as reclassification adjustment (“recycling”) as of the date of realization. The following table contains the effects of the sale transactions on the consolidated income statement and the consolidated statement of comprehensive income:
Before recycling
(thousand Euro)
Recycling
(thousand Euro)
After recycling
(thousand Euro)
Consolidated net income based on the bonds sold in the consolidated income statement for the 6-month period 1/1 – 6/30/2016 (or rather for the period 4/1–6/30/2016) 96 (49) –179 (–77) –83 (–28)
Other comprehensive income based on the bonds sold in the consolidated statement of comprehensive income for the 6-month period 1/1–6/30/2016 (or rather for the period 4/1–6/30/2016) 0 (0) 179 (77) 179 (77)
Total comprehensive income based on the bonds sold for the 6-month period 1/1–6/30/2016 (or rather for the period 4/1–6/30/2016) 96 (49) 0 (0) 96 (49)
Altogether 179 thousand Euro in the first half-year 2016 and 77 thousand Euro in the second quarter of 2016 were reclassified from “Other comprehensive income” to the consolidated income statement.
Exceptional business transactions
There were no exceptional business transactions in the first half-year 2016.
Basis of consolidation/Interests in associates
In January 2016 Elmos Semiconductor AG acquired shares in a company concerned with sensor technology. The company is included as an associate in the consolidated financial statements of Elmos. Apart from that, there were neither additions to nor disposals from the basis of consolidation in the first half-year 2016.
Seasonal and economic effects on business operations
The International Monetary Fund (IMF) anticipates a slightly weaker global economic performance compared to the forecast of April 2016 (3.2% growth) due to the Brexit. The fund now expects global economic growth of 3.1% for 2016 (as of July 2016). The business of Elmos Semiconductor AG shows rather insignificant seasonal fluctuation.
Elmos half-year report January 1 − June 30, 2016 | 15
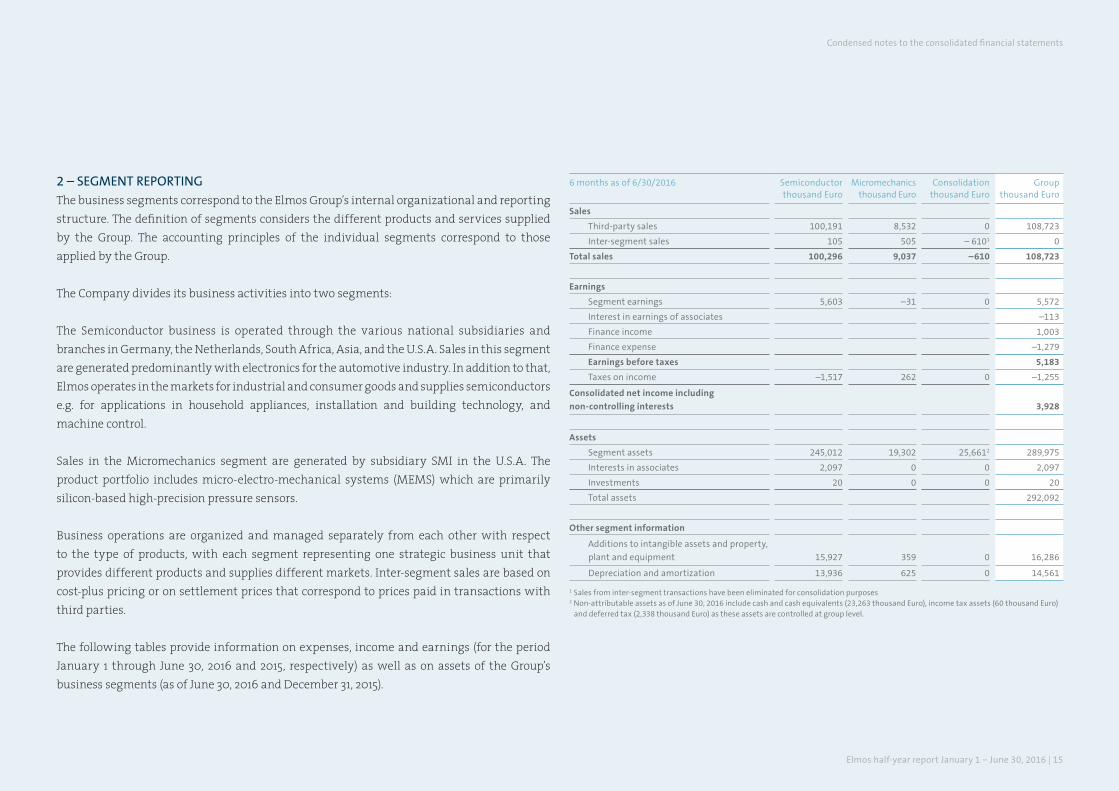
2 – SEGMENT REPORTINGThe business segments correspond to the Elmos Group’s internal organizational and reporting structure. The definition of segments considers the different products and services supplied by the Group. The accounting principles of the individual segments correspond to those applied by the Group.
The Company divides its business activities into two segments:
The Semiconductor business is operated through the various national subsidiaries and branches in Germany, the Netherlands, South Africa, Asia, and the U.S.A. Sales in this segment are generated predominantly with electronics for the automotive industry. In addition to that, Elmos operates in the markets for industrial and consumer goods and supplies semiconductors e.g. for applications in household appliances, installation and building technology, and machine control.
Sales in the Micromechanics segment are generated by subsidiary SMI in the U.S.A. The product portfolio includes micro-electro-mechanical systems (MEMS) which are primarily silicon-based high-precision pressure sensors.
Business operations are organized and managed separately from each other with respect to the type of products, with each segment representing one strategic business unit that provides different products and supplies different markets. Inter-segment sales are based on cost-plus pricing or on settlement prices that correspond to prices paid in transactions with third parties.
The following tables provide information on expenses, income and earnings (for the period January 1 through June 30, 2016 and 2015, respectively) as well as on assets of the Group’s business segments (as of June 30, 2016 and December 31, 2015).
6 months as of 6/30/2016 Semiconductorthousand Euro
Micromechanicsthousand Euro
Consolidationthousand Euro
Groupthousand Euro
Sales
Third-party sales 100,191 8,532 0 108,723
Inter-segment sales 105 505 – 6101 0
Total sales 100,296 9,037 –610 108,723
Earnings
Segment earnings 5,603 –31 0 5,572
Interest in earnings of associates –113
Finance income 1,003
Finance expense –1,279
Earnings before taxes 5,183
Taxes on income –1,517 262 0 –1,255
Consolidated net income including
non-controlling interests 3,928
Assets
Segment assets 245,012 19,302 25,6612 289,975
Interests in associates 2,097 0 0 2,097
Investments 20 0 0 20
Total assets 292,092
Other segment information
Additions to intangible assets and property,
plant and equipment 15,927 359 0 16,286
Depreciation and amortization 13,936 625 0 14,561
1 Sales from inter-segment transactions have been eliminated for consolidation purposes2 Non-attributable assets as of June 30, 2016 include cash and cash equivalents (23,263 thousand Euro), income tax assets (60 thousand Euro)
and deferred tax (2,338 thousand Euro) as these assets are controlled at group level.
Condensed notes to the consolidated financial statements
16
Elmos interim report HY1 2016
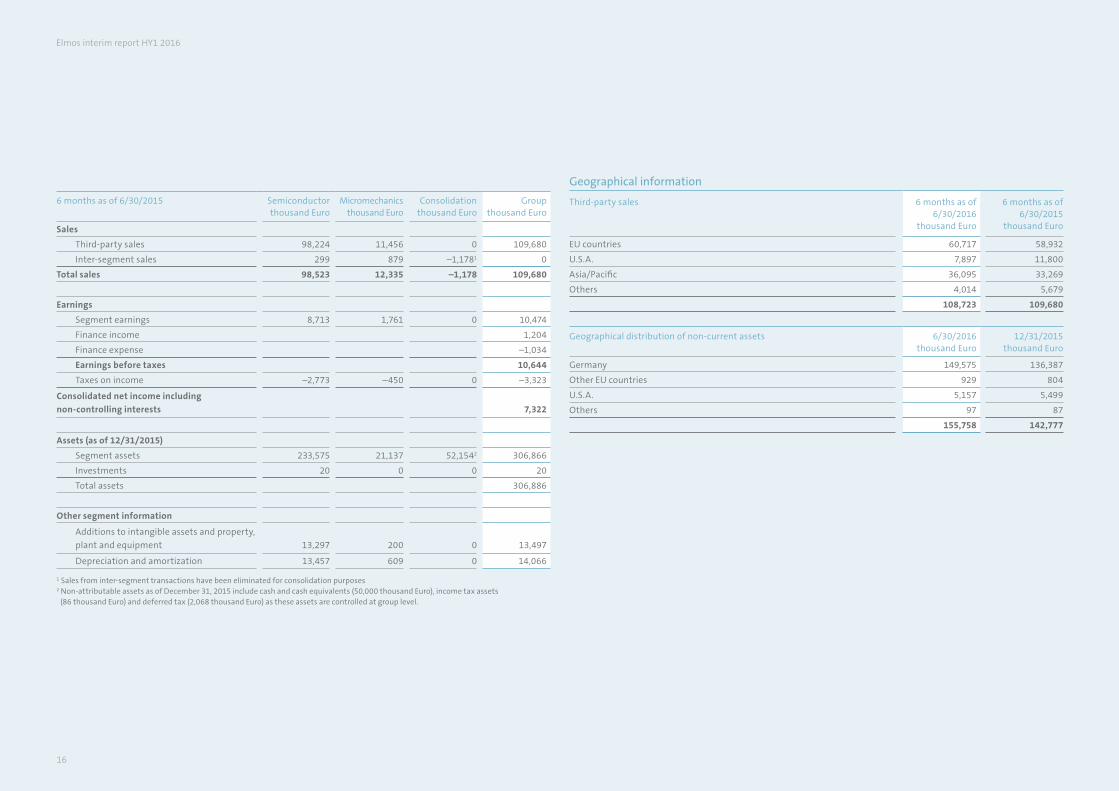
6 months as of 6/30/2015 Semiconductorthousand Euro
Micromechanicsthousand Euro
Consolidationthousand Euro
Groupthousand Euro
Sales
Third-party sales 98,224 11,456 0 109,680
Inter-segment sales 299 879 –1,1781 0
Total sales 98,523 12,335 –1,178 109,680
Earnings
Segment earnings 8,713 1,761 0 10,474
Finance income 1,204
Finance expense –1,034
Earnings before taxes 10,644
Taxes on income –2,773 –450 0 –3,323
Consolidated net income including
non-controlling interests 7,322
Assets (as of 12/31/2015)
Segment assets 233,575 21,137 52,1542 306,866
Investments 20 0 0 20
Total assets 306,886
Other segment information
Additions to intangible assets and property,
plant and equipment 13,297 200 0 13,497
Depreciation and amortization 13,457 609 0 14,066
1 Sales from inter-segment transactions have been eliminated for consolidation purposes2 Non-attributable assets as of December 31, 2015 include cash and cash equivalents (50,000 thousand Euro), income tax assets (86 thousand Euro) and deferred tax (2,068 thousand Euro) as these assets are controlled at group level.
Geographical information
Third-party sales 6 months as of 6/30/2016
thousand Euro
6 months as of 6/30/2015
thousand Euro
EU countries 60,717 58,932
U.S.A. 7,897 11,800
Asia/Pacific 36,095 33,269
Others 4,014 5,679
108,723 109,680
Geographical distribution of non-current assets 6/30/2016thousand Euro
12/31/2015thousand Euro
Germany 149,575 136,387
Other EU countries 929 804
U.S.A. 5,157 5,499
Others 97 87
155,758 142,777
Elmos half-year report January 1 − June 30, 2016 | 17
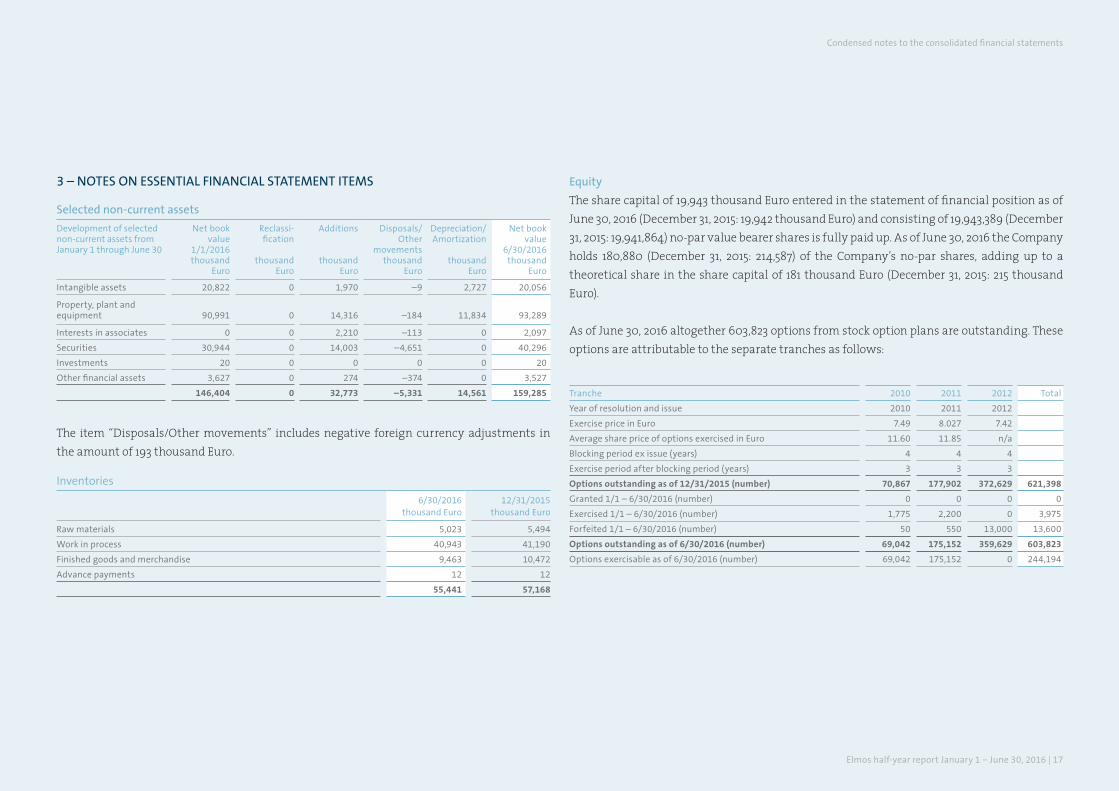
3 – NOTES ON ESSENTIAL FINANCIAL STATEMENT ITEMS
Selected non-current assets
Development of selected non-current assets from January 1 through June 30
Net book value
1/1/2016thousand
Euro
Reclassi-fication
thousand Euro
Additions
thousand Euro
Disposals/Other
movementsthousand
Euro
Depreciation/Amortization
thousand Euro
Net book value
6/30/2016thousand
Euro
Intangible assets 20,822 0 1,970 –9 2,727 20,056
Property, plant and equipment 90,991 0 14,316 –184 11,834 93,289
Interests in associates 0 0 2,210 –113 0 2,097
Securities 30,944 0 14,003 –4,651 0 40,296
Investments 20 0 0 0 0 20
Other financial assets 3,627 0 274 –374 0 3,527
146,404 0 32,773 –5,331 14,561 159,285
The item “Disposals/Other movements” includes negative foreign currency adjustments in the amount of 193 thousand Euro.
Inventories
6/30/2016thousand Euro
12/31/2015thousand Euro
Raw materials 5,023 5,494
Work in process 40,943 41,190
Finished goods and merchandise 9,463 10,472
Advance payments 12 12
55,441 57,168
Equity
The share capital of 19,943 thousand Euro entered in the statement of financial position as of June 30, 2016 (December 31, 2015: 19,942 thousand Euro) and consisting of 19,943,389 (December 31, 2015: 19,941,864) no-par value bearer shares is fully paid up. As of June 30, 2016 the Company holds 180,880 (December 31, 2015: 214,587) of the Company’s no-par shares, adding up to a theoretical share in the share capital of 181 thousand Euro (December 31, 2015: 215 thousand Euro).
As of June 30, 2016 altogether 603,823 options from stock option plans are outstanding. These options are attributable to the separate tranches as follows:
Tranche 2010 2011 2012 Total
Year of resolution and issue 2010 2011 2012
Exercise price in Euro 7.49 8.027 7.42
Average share price of options exercised in Euro 11.60 11.85 n/a
Blocking period ex issue (years) 4 4 4
Exercise period after blocking period (years) 3 3 3
Options outstanding as of 12/31/2015 (number) 70,867 177,902 372,629 621,398
Granted 1/1 – 6/30/2016 (number) 0 0 0 0
Exercised 1/1 – 6/30/2016 (number) 1,775 2,200 0 3,975
Forfeited 1/1 – 6/30/2016 (number) 50 550 13,000 13,600
Options outstanding as of 6/30/2016 (number) 69,042 175,152 359,629 603,823
Options exercisable as of 6/30/2016 (number) 69,042 175,152 0 244,194
Condensed notes to the consolidated financial statements
18
Elmos interim report HY1 2016
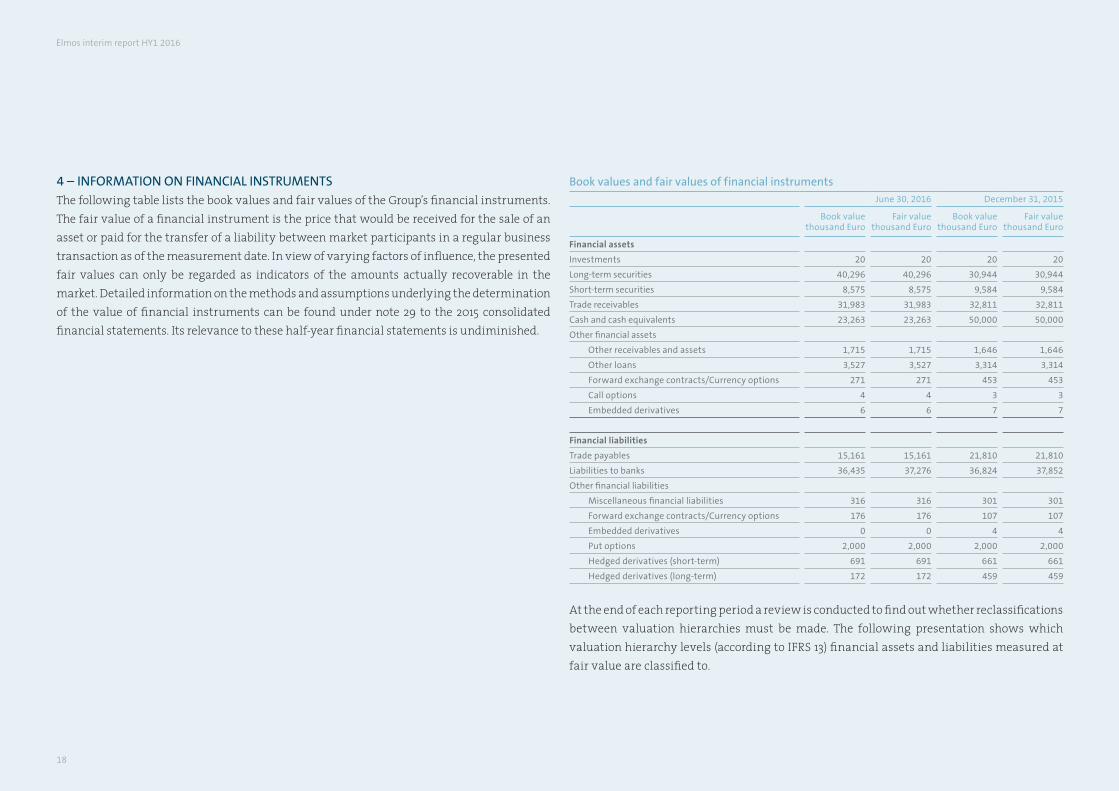
4 – INFORMATION ON FINANCIAL INSTRUMENTSThe following table lists the book values and fair values of the Group’s financial instruments. The fair value of a financial instrument is the price that would be received for the sale of an asset or paid for the transfer of a liability between market participants in a regular business transaction as of the measurement date. In view of varying factors of influence, the presented fair values can only be regarded as indicators of the amounts actually recoverable in the market. Detailed information on the methods and assumptions underlying the determination of the value of financial instruments can be found under note 29 to the 2015 consolidated financial statements. Its relevance to these half-year financial statements is undiminished.
Book values and fair values of financial instrumentsJune 30, 2016 December 31, 2015
Book value thousand Euro
Fair valuethousand Euro
Book valuethousand Euro
Fair value thousand Euro
Financial assets
Investments 20 20 20 20
Long-term securities 40,296 40,296 30,944 30,944
Short-term securities 8,575 8,575 9,584 9,584
Trade receivables 31,983 31,983 32,811 32,811
Cash and cash equivalents 23,263 23,263 50,000 50,000
Other financial assets
Other receivables and assets 1,715 1,715 1,646 1,646
Other loans 3,527 3,527 3,314 3,314
Forward exchange contracts/Currency options 271 271 453 453
Call options 4 4 3 3
Embedded derivatives 6 6 7 7
Financial liabilities
Trade payables 15,161 15,161 21,810 21,810
Liabilities to banks 36,435 37,276 36,824 37,852
Other financial liabilities
Miscellaneous financial liabilities 316 316 301 301
Forward exchange contracts/Currency options 176 176 107 107
Embedded derivatives 0 0 4 4
Put options 2,000 2,000 2,000 2,000
Hedged derivatives (short-term) 691 691 661 661
Hedged derivatives (long-term) 172 172 459 459
At the end of each reporting period a review is conducted to find out whether reclassifications between valuation hierarchies must be made. The following presentation shows which valuation hierarchy levels (according to IFRS 13) financial assets and liabilities measured at fair value are classified to.
Elmos half-year report January 1 − June 30, 2016 | 19
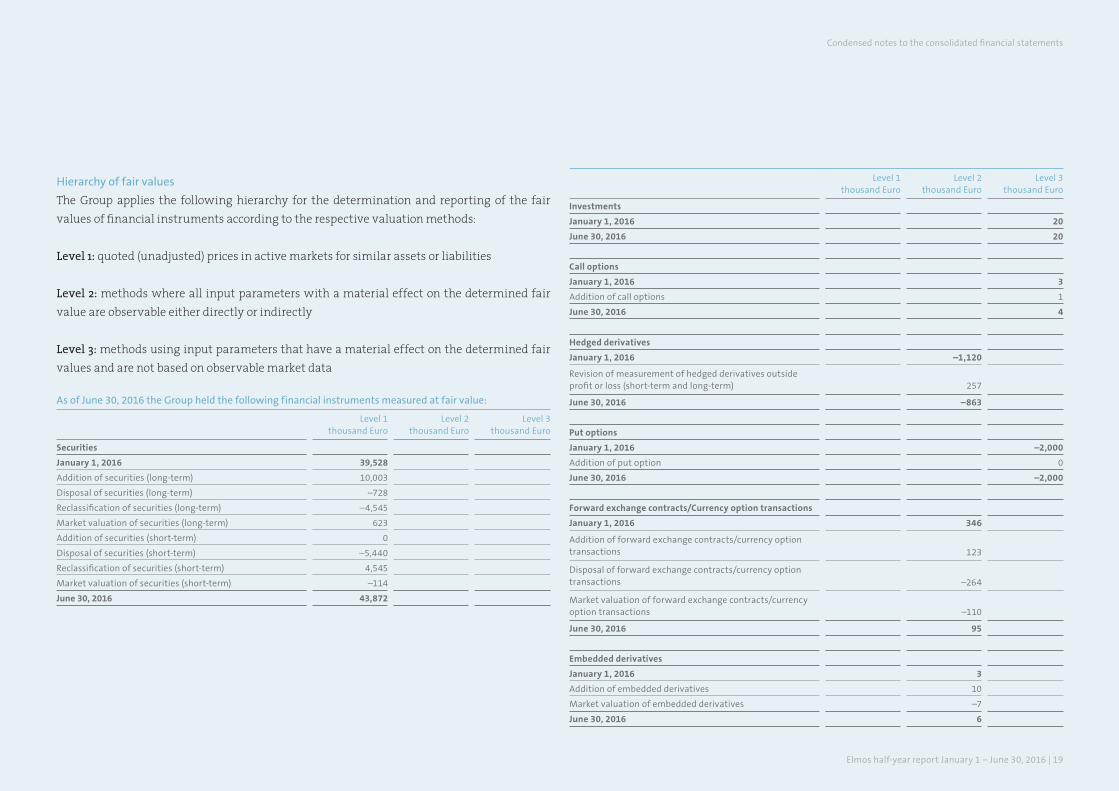
Hierarchy of fair values
The Group applies the following hierarchy for the determination and reporting of the fair values of financial instruments according to the respective valuation methods:
Level 1: quoted (unadjusted) prices in active markets for similar assets or liabilities
Level 2: methods where all input parameters with a material effect on the determined fair value are observable either directly or indirectly
Level 3: methods using input parameters that have a material effect on the determined fair values and are not based on observable market data
As of June 30, 2016 the Group held the following financial instruments measured at fair value:
Level 1thousand Euro
Level 2 thousand Euro
Level 3 thousand Euro
Securities
January 1, 2016 39,528
Addition of securities (long-term) 10,003
Disposal of securities (long-term) –728
Reclassification of securities (long-term) –4,545
Market valuation of securities (long-term) 623
Addition of securities (short-term) 0
Disposal of securities (short-term) –5,440
Reclassification of securities (short-term) 4,545
Market valuation of securities (short-term) –114
June 30, 2016 43,872
Level 1thousand Euro
Level 2 thousand Euro
Level 3 thousand Euro
Investments
January 1, 2016 20
June 30, 2016 20
Call options
January 1, 2016 3
Addition of call options 1
June 30, 2016 4
Hedged derivatives
January 1, 2016 –1,120
Revision of measurement of hedged derivatives outside profit or loss (short-term and long-term) 257
June 30, 2016 –863
Put options
January 1, 2016 –2,000
Addition of put option 0
June 30, 2016 –2,000
Forward exchange contracts/Currency option transactions
January 1, 2016 346
Addition of forward exchange contracts/currency option transactions 123
Disposal of forward exchange contracts/currency option transactions –264
Market valuation of forward exchange contracts/currency option transactions –110
June 30, 2016 95
Embedded derivatives
January 1, 2016 3
Addition of embedded derivatives 10
Market valuation of embedded derivatives –7
June 30, 2016 6
Condensed notes to the consolidated financial statements
20
Elmos interim report HY1 2016
The securities reported under hierarchy level 1 are bonds classified by Elmos as available for sale.
The hedged derivatives allocated to hierarchy level 2 comprise the Company’s interest rate swaps. In addition to that, foreign currency transactions (USD) and credit linked notes (embedded derivatives) of various issuers are also reported under this hierarchy level.
The available-for-sale financial assets reported under hierarchy level 3 are investments in various companies, among other assets. In this regard, the book value essentially corresponds to the market value. The call and put options agreed on with a non-controlling shareholder are measured annually at fair value, most recently as of December 31, 2015, in application of the DCF method and in consideration of the terms and conditions of the respective contract. In the course of the measurement process, the required publicly available market data are collected and the input parameters that cannot be observed are reviewed on the basis of internally available current information and updated if necessary. Material changes of the input parameters and their respective effect on the book value are subject to routine reporting to management.
5 – RELATED PARTY DISCLOSURES As reported in the consolidated financial statements for the fiscal year ended December 31, 2015, the Elmos Group maintains business relationships with related companies and individuals in the context of the ordinary course of business.
These supply and performance relationships continue to be transacted at market prices.
Directors’ dealings according to Section 15a WpHG (Securities Trading Act)
The following securities transactions (directors’ dealings) were made in the reporting period January 1 through June 30, 2016:
Date Place
Name Function Transaction Number Price/Basic price (Euro)
Total volume (Euro)
6/15/2016Xetra
Dr. Klaus Egger
Supervisory Board member
Purchase of Elmos shares 2,487 11.26
28,015
6 – SIGNIFICANT EVENTS AFTER THE END OF THE FIRST SIX MONTHS OF 2016There have been no reportable significant events or transactions after the end of the first six months of 2016.
RESPONSIBILITY STATEMENTTo the best of our knowledge, and in accordance with the accounting principles applicable to interim financial reporting, the consolidated interim financial statements give a true and fair view of the assets, liabilities, financial position and profit or loss of the Group, and the consolidated interim management report includes a fair review of the development and performance of the business and the position of the Group, together with a description of the principal opportunities and risks associated with the expected development of the Group in the remaining fiscal year.
Dortmund, August 3, 2016
Dr. Anton Mindl Dr. Arne Schneider Reinhard Senf Dr. Peter Geiselhart
Elmos half-year report January 1 − June 30, 2016 | 21
REVIEW REPORTTo Elmos Semiconductor AG, DortmundWe have reviewed the condensed interim consolidated financial statements – comprising condensed statement of financial position, condensed statement of comprehensive income, condensed statement of cash flows, condensed statement of changes in equity, and selected explanatory notes – and the interim group management report of Elmos Semiconductor AG that are required components of a half-year financial report pursuant to Section 37w WpHG (Securities Trading Act) for the period from January 1 to June 30, 2016.
The preparation of the condensed interim consolidated financial statements in accordance with the IFRS applicable to interim financial reporting as adopted by the European Union and of the interim group management report in accordance with the regulations of the WpHG applicable to interim group management reports is the responsibility of the Company’s management. It is our responsibility to issue a report on the condensed interim consolidated financial statements and the interim group management report based on our review.
We have performed our review of the condensed interim consolidated financial statements and the interim group management report in accordance with the German generally accepted standards for the review of financial statements as defined by the Institut der Wirtschaftsprüfer (IDW). Those standards require the review to be planned and conducted in such a way that allows us to rule out the possibility with reasonable assurance that the condensed interim consolidated financial statements have not been prepared in material respects in accordance with the IFRS applicable to interim financial reporting
as adopted by the European Union and that the interim group management report has not been prepared in material respects in accordance with the regulations of the WpHG applicable to interim group management reports. A review is limited primarily to inquiries of company employees and analytical assessments and therefore does not provide the degree of assurance attainable in a financial statement audit. As we have not performed a financial statement audit in accordance with our engagement, we cannot issue an audit opinion.
No matters have come to our attention on the basis of our review that lead us to presume that the condensed interim consolidated financial statements have not been prepared in all material respects in accordance with the IFRS applicable to interim financial reporting as adopted by the European Union or that the interim group management report has not been prepared in all material respects in accordance with the regulations of the WpHG applicable to interim group management reports.
Düsseldorf, August 3, 2016
Warth & Klein Grant Thornton AGWirtschaftsprüfungsgesellschaft
Dr. Thomas Senger Ulrich DierschWirtschaftsprüfer Wirtschaftsprüfer
Condensed notes to the consolidated financial statements/Review report
22
Elmos interim report HY1 2016
Financial calendar 20166-month results Q2/20161 August 3, 2016
9-month results Q3/20161 November 8, 2016
Equity Forum in Frankfurt November 21-22, 2016
1 The German Securities Trading Act (Wertpapierhandelsgesetz) obliges issuers to announce any information that may have a sub-stantial price impact immediately, irrespective of the financial calendar. It is therefore possible that we will announce key figures of quarterly and annual results ahead of the dates mentioned above. As we can never rule out changes of dates, we recommend checking dates and news ahead of schedule on the Company’s website (www.elmos.com).
ContactJanina Rosenbaum | Investor Relations
Phone: + 49 (0) 231-75 49-287Fax: + 49 (0) 231-75 [email protected]
Forward-looking statements
This report contains forward-looking statements that are based on assumptions and estimates made by the Elmos manage-ment. Even though we assume the underlying expectations of our statements to be realistic, we cannot guarantee these expectations will prove right. The assumptions may carry risks and uncertainties, and as a result actual events may differ materially from the forward-looking statements. Among the factors that could cause such differences are changes in gene-ral economic and business conditions, fluctuations of exchange rates and interest rates, the introduction of competing pro-ducts, lack of acceptance of new products, and changes in business strategy. Elmos neither intends nor assumes any obliga-tion to update its statements with respect to future events.
This English translation is for convenience purposes only.
Elmos Semiconductor AG
Heinrich-Hertz-Straße 144227 Dortmund | GermanyPhone: + 49 (0) 231-75 49-0Fax: + 49 (0) 231-75 [email protected] | www.elmos.com