Embed Size (px)
Citation preview
Continuing operations:RevenueOther operating incomeTotal incomeOperating expensesCost of services soldOperating profit / (loss) Finance costsIncome from associates and joint venturesImpairment losses on investment in associatesImpairment of goodwillProfit /(loss) from continuing operations before taxIncome tax expenseLoss for the year from continuing operations after tax
Discontinued Operations:(Loss) / profit after tax from discontinued operationsLoss arising from recycling of Foreign Currency Translation Reserve on disposal of subsidiary(Loss) / profit after tax and foreign currency losses from discontinued operationsLoss for the yearOther comprehensive income for the year - net of taxTotal comprehensive loss for the year
Loss for the year: Attributable to equity holders of the parent (all operations):Non - controlling interestsLoss for the year
Total comprehensive loss for the year: Attributable to equity holders of the parent (all operations)Non - controlling interestsLoss for the year
Earnings per share for the year (Equity holders of the parent):Continuing operations -basic thebeContinuing operations -diluted thebeAll operations - basic thebeAll operations - diluted thebe
(14.86)(14.52) (34.84) (34.04)
Group2016Pula
95 056 877 39 841 828
134 898 705 (114 545 785)
(3 550 699)16 802 221
(57) 356 176
(330 780 )-
16 827 560 (22 757 742)
(5 930 182)
(170 954 )(11 708 794 )
(11 879 748 )
(17 809 930)8 079 652
(9 730 278)
(20 718 507)2 908 577
(17 809 930)
(13 419 067)3 688 789
(9 730 278)
Group2015Pula
121 219 648 7 325 400
128 545 048 (130 012 503)
(5 348 372)(6 815 827)
(7 357) 770 464
(110 704 )(12 266 118) (18 429 542 )
(5 002 800) (23 432 342)
11 182 430 -
11 182 430
(12 249 912) 3 423 527
(8 826 385)
(15 252 166 )3 002 254
(12 249 912)
(12 776 894)3 950 509
(8 826 385)
%Change
(22%)444%
5%(12%)(34%)
(347%)(99%)(54%)199%
(100%)(191%)(355%)
75%
(102%)(100%)
(206%)
(45%)
(23%)
(36%)(3%)
(45%)
(14%)6%
(23%)
ASSETSNon-current assetsEquipmentGoodwillIntangible assetsInvestment in associates and joint venturesInvestment in deferred units – long termAvailable-for-sale financial assets – long termFixed deposit – Investment - long termDeferred tax assets
Current assetsInvestment in deferred units – short termListed trading securitiesTrade and other receivablesCash and cash equivalentsFixed deposit – Investment - short termTax refundable
Non -current assets held for sale
TOTAL ASSETS
EQUITY AND LIABILITIESEquity Stated capital Non-distributable reserves Equity associated with non-current assets Distributable reserves Equity attributable to owners of the parent
Non-controlling interestTotal equity
Non-current liabilitiesRetirement benefit obligation - long termDeferred tax liabilities
Current liabilitiesIncome tax payableTrade and other payablesBank overdraft
Liabilities directly associated with non-current assets held for sale
Total liabilities
TOTAL EQUITY & LIABILITIES
Group2016Pula
3 699 222448 746112 622
1 888 0131 723 7877 698 794
-764 332
16 335 516
757 2751 736 158
24 173 383121 575 316
488 051764 862
149 495 045
-
165 830 561
51 637 66114 948 234
-48 973 400
115 559 295
12 167 525127 726 820
946 053319 534
1 265 587
638 35136 030 720
169 08336 838 154
-
38 103 741
165 830 561
Group2015Pula
3 799 492448 746176 128
1 890 350-
6 890 069538 515248 041
13 991 341
-1 547 551
81 710 55170 158 197
-162 192
153 578 491
165 904 403
333 474 235
51 489 1616 007 5925 177 489
60 347 051123 021 293
14 108 153137 129 446
761 5411 700 1502 461 691
1 131 49598 975 977
-100 107 472
93 775 626
196 344 789
333 474 235
ABRIDGED CONSOLIDATED STATEMENT OF FINANCIAL POSITION As at 30 April
%Change
17%
(3%)
(50%)
(7%)
(49%)
(63%)
(50%)
ABRIDGED CONSOLIDATED STATEMENT OF CASH FLOWS
Profit / (Loss) from operating activities, before tax Adjustment to operating profit / (loss)Operating cash flows before working capital changesWorking capital changesCash generated from operationsIncome tax paidNet interest received Net cash flows from operating activities Cash flows from investing activitiesCash flows from financing activities Net cash in cash and cash equivalentsCash and cash equivalents at the beginning of the yearExchange rate differences on cash and cash equivalentsCash and cash equivalents at the end of yearComprising : Cash and cash equivalentsCash components of non-current assets held for sale (See Note)Bank overdraftNet cash and cash equivalents
Group2016Pula
16 420 059(29 337 020)
(12 916 961)(6 402 188)
(19 319 149)(24 049 890)
3 154 683(40 214 356)
68 386 654(4 832 836)23 33946293 582 251
4 484 520121 406 233121 575 316
-(169 083)
121 406 233
Group2015Pula
(4 507 537)10 975 8196 468 282
13 229 11119 697 393(6 957 637)
6 766 56319 506 319(2 311 468)(7 386 367)9 808 484
83 752 41221 355
93 582 25170 158 19723 424 054
-93 582 251
RevenueAttributable (loss) / earningsDiluted earnings per shareAttributable shareholder’ equityTotal assetsReturn on equityNet asset value per share (basic)Net asset value per share (diluted)
FIVE YEAR FINANCIAL HISTORY 2016 2015 2014 2013 2012
122 4835 635
9.20137 731199 921
4.092.352.25
145 9194 305
7.34129 209252 471
(3.33)2.202.08
197 53910 005
16.01138 973344 222
7.122.352.22
121 220(15 252)
(24.77)123 021333 474
(12.40)2.082.00
95 057(20.718)
21.66115 559165 831
(17.93)1.941.90
P000’sP000’sthebeP000’sP000’s
%PulaPula
152 937 900
(12 249 912)3 423 527
(8 826 385)
144 111 515558 150435 581
(671 986)61 700
(2 957 590)(4 407 924)
137 129 446
137 129 446
(6 101 136)(11 708 794)
8 079 652(9 730 278)
127 399 168148 500109 397
-61 699
(950 096)(212 894)
-5 044 244
(3 793 539)(79 659)
127 726 820
138 972 968
(15 252 166)2 475 273
(12 776 893)
126 196 075558 150435 581
(1 210 923)-
(2 957 590)-
123 021 293
123 021 293
(9 009 713)(11 708 794)
6 203 601(14 514 906)
108 506 387148 500109 397
1 491 545--
167 684171 197
5 044 244
(79 659)
115 559 295
13 964 932
3 002 254948 254
3 950 508
17 915 440--
538 93761 700
-(4 407 924)
14 108 153
14 108 153
2 908 577 -
1 876 0514 784 628
18 892781--
(1 491 545)61 699
(950 096)(380 578)(171 197)
-(3 793 539)
-
12 167 525
79 242 797
(15 252 166)524 933
(14 727 233)
64 515 564-
(1 210 923)-
(2 957 590)-
60 347 051
60 347 051
(9 009 713)(11 708 794)
62 545 (20 655 962)
39 691 089--
1 491 545--
167 684319 101
7 303 981--
48 973 400
8 799 160
-1 950 3401 950 340
10 749 500-
435 581----
11 185 081
11 185 081
--
6 141 0566 141 056
16 379 405-
109 397
--
(147 904)(2 259 737)
-(79 659)
14 948 234
50 931 011
---
50 931 011558 150
-----
51 489 161
51 489 161
----
51 489 161148 500
---------
51 637 661
Balance - 1 May 2014
Profit for the yearOther comprehensive (loss) / incomeTotal comprehensive (loss) / income
Sub-totalIssue of new shares - ordinary shares Share based payment expense- share options (net)Acquisition of minority interest in subsidiary companySale of minority interest in subsidiary companyDividends paid Dividends paid – non controlling shareholders
Balance - 30 April 2015
Balance - 1 May 2015
(Loss) / profit for the yearRecycling of Foreign Currency Translation Reserve on disposal on subsidiaryOther comprehensive incomeTotal comprehensive (loss) / income
Sub-totalIssue of new shares - ordinary shares (see note 1 below)Share based payment expense- share options (net)Acquisition of minority interest in subsidiary companyDisposal of minority interest in subsidiary companyPreference shares redeemedCapital reduction in subsidiaryDiscontinued operationsDividends paid – non controlling shareholdersRevaluation of deferred units
Balance - 30 April 2016
StatedCapital
Pula
NonDistributable
reservesPula
Distributablereserves
PulaTotalPula
Non- controlling
InterestPula
TOTALPula
ABRIDGED STATEMENT OF CHANGES IN EQUITY:
Total segmental revenueOther material items:• Interest revenue- non group• Interest expense• Depreciation expense• Amortisation expense• Capital expenditure
Profit or loss:Segment profit before taxationShare of income/(losses) from associatesImpairment uplift/ (losses)Consolidated profit / (loss) before taxationTaxation (expense)/creditProfit/(loss) after taxation
Assets:Segment assetsGoodwill & other tangiblesInvestments in associatesTotal assets
Liabilities:Total liabilities
Net segmental assets
121 219 648
1 500 3187 357
1 986 24072 838
1 352 093
(19 089 305)770 465
(110 701)(18 429 542)
(5 002 800)(23 432 342)
330 867 911715 972
1 890 350333 474 235
196 344 789
140 129 446
(33 130 802)
-----
---
--
----
-
-
17 602 538
214 3037 338
318 773-
197 909
(42 783 906)--
(42 783 906)(458 315)
(42 768 109)
35 360 954--
35 360 954
6 488 262
28 872 692
15 666 875
--
158 78672 838
131 719
5 286 777--
5 286 777(906 925)4 379 852
11 890 352176 128
-12 066 480
8 261 833
3 804 647
8 396 690
268 286-
675 792-
295 643
2 361 2151 114 284(181 386)3 294 113(635 479)2 658 634
245 773 081422 816
1 980 587248 176 484
165 936 897
82 239 586
47 077 837
344 28019
206 946-
27 110
(926 378)--
(926 378)(65 293)
(991 671)
12 378 328-
56012 378 888
5 617 357
6 761 531
65 606 510
673 449-
625 943-
669 712
16 972 986(343 820)
70 68516 699 852(2 936 788)13 763 064
25 465 198117 028(90 796)
25 491 429
10 040 440
15 450 989
58 145 9567 460 554
34 362 75912 715 078
8 396 690-
15 666 875-
4 647 36812 955 170
-(33 130 802)
121 219 648-
StockbrokingPula
CorporateFinance
Pula
AssetManagement
Pula
Trust Administration
PulaOther
PulaAdjustment
PulaTOTAL
Pula
ABRIDGED SEGMENTAL REPORT
Revenue:External customersInter segment revenue
Total segmental revenueOther material items:• Interest revenue- non group• Interest expense• Depreciation expense• Amortisation expense• Capital expenditure
Profit or loss:Segment profit before taxationShare of income/(losses) from associatesImpairment uplift (losses)Consolidated profit / (loss) before taxationTaxation (expense)/creditProfit/(loss) after taxation
Assets:Segment assetsGoodwill & other tangiblesInvestments in associatesTotal assets
Liabilities:Total liabilities
Net segmental assets
95 056 877
2 948 62213 881
2 194 37479 437
2 097 126
16 802 164356 176
(330 780)16 827 560
(22 757 742)(5 930 182
163 381 180561 368
1 888 013165 830 561
38 103 741
127 699 311
(83 536 656)
-----
---
--
----
-
-
74 650 280
1 623 774134
451 721-
1 040 007
3 977 566-
(260 604)3 716 962
(16 037 094)(12 320 132)
93 079 909-
56193 080 471
4 886 341
88 194 129
18 161 043
58 680-
233 49679 437
335 954
5 568 162--
5 568 162(1 161 409)
4 406 753
15 165 860112 622
-15 278 482
6 751 110
8 499 863
19 828 999
389 87313 747
695 999-
476 303
257 528634 409(84 010)807 927
(1 001 895)(193 968)
25 098 847422 816
2 242 64527 764 308
17 745 264
10 019 044
5 934 285
145 749-
179 323-
42 781
(4 665 590)--
(4 665 590)(28 596)
(4 694 186)
2 653 312--
2 653 312
797 484
1 855 828
60 018 926
730 556-
633 835-
202 081
11 664 498(278 233)
13 83411 400 099(4 528 748)
6 871 351
27 383 25225 930
(355 193)27 053 989
7 923 542
19 130 447
51 368 0998 650 827
4 094 5821 839 703
19 828 999-
18 161 043-
1 604 15473 046 126
-(83 536 656)
95 056 877-
StockbrokingPula
CorporateFinance
Pula
AssetManagement
Pula
Trust Administration
PulaOther
PulaAdjustment
PulaTOTAL
Pula
ABRIDGED SEGMENTAL REPORTFor the year ended 30 April 2016
Revenue:External customersInter segment revenue
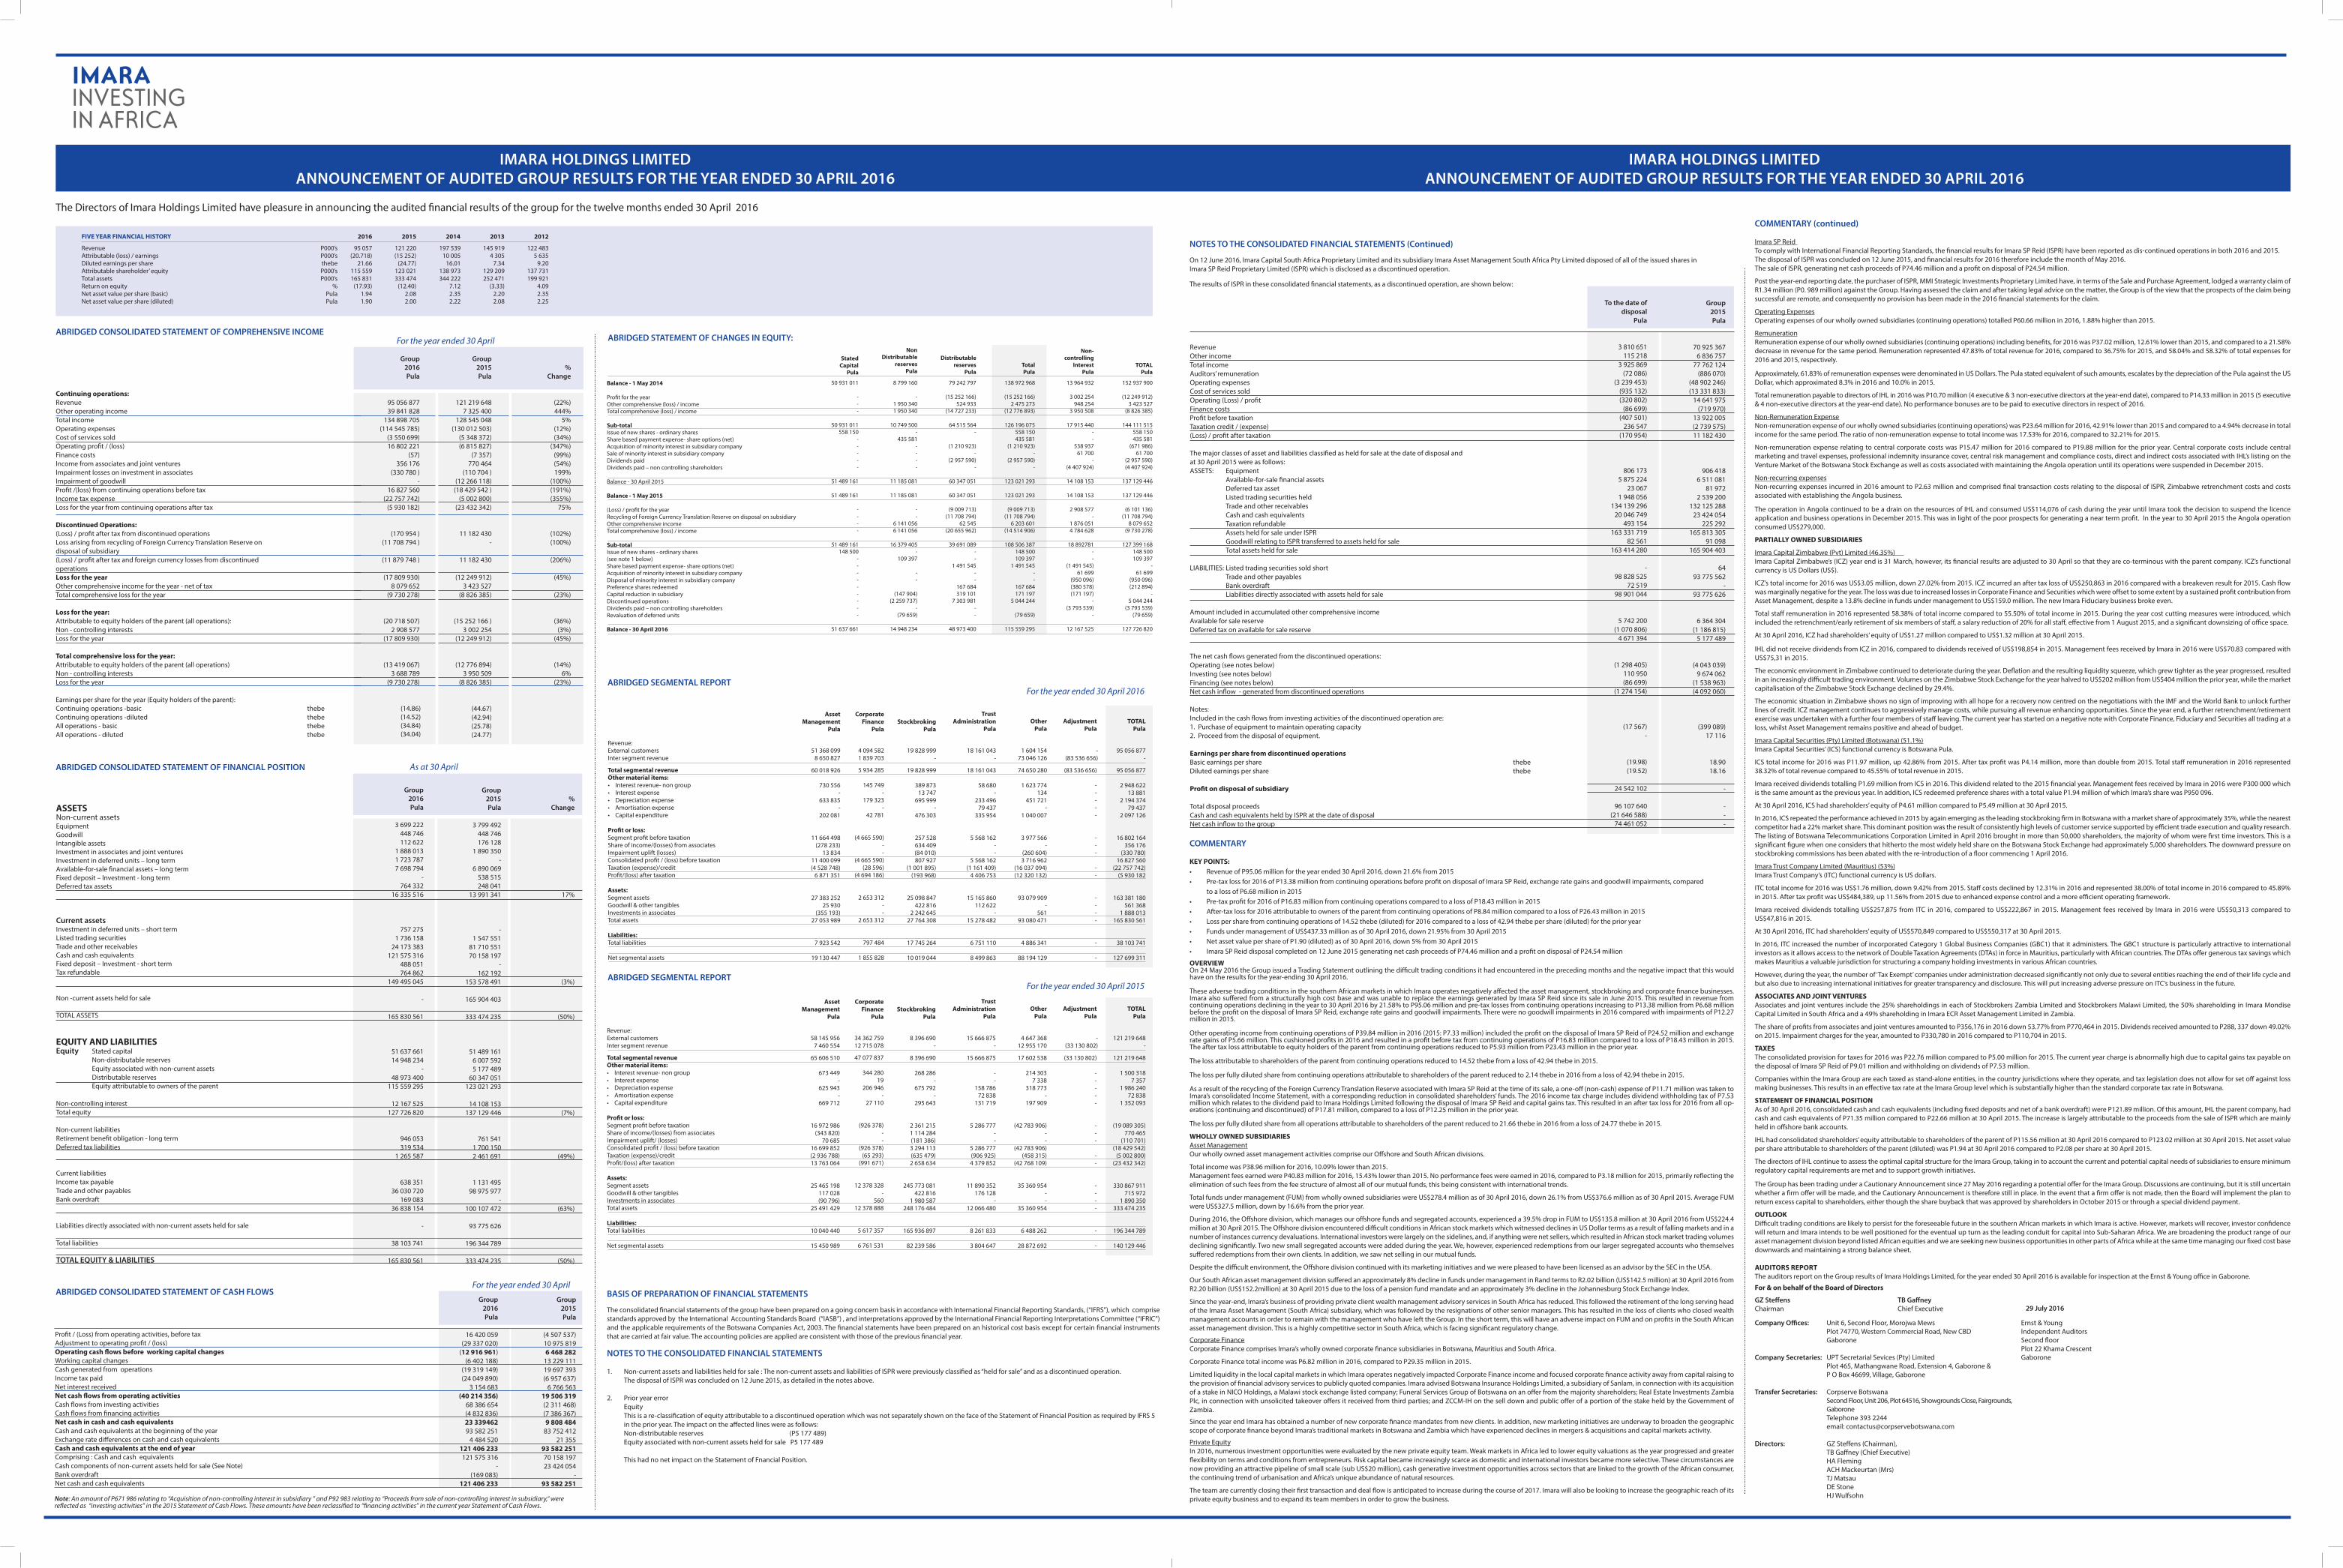
The Directors of Imara Holdings Limited have pleasure in announcing the audited financial results of the group for the twelve months ended 30 April 2016
ABRIDGED CONSOLIDATED STATEMENT OF COMPREHENSIVE INCOME
NOTES TO THE CONSOLIDATED FINANCIAL STATEMENTS (Continued)
RevenueOther incomeTotal incomeAuditors’ remunerationOperating expensesCost of services soldOperating (Loss) / profitFinance costsProfit before taxationTaxation credit / (expense)(Loss) / profit after taxation
The major classes of asset and liabilities classified as held for sale at the date of disposal and at 30 April 2015 were as follows:ASSETS: Equipment Available-for-sale financial assets Deferred tax asset Listed trading securities held Trade and other receivables Cash and cash equivalents Taxation refundable Assets held for sale under ISPR Goodwill relating to ISPR transferred to assets held for sale Total assets held for sale LIABILITIES: Listed trading securities sold short Trade and other payables Bank overdraft Liabilities directly associated with assets held for sale
Amount included in accumulated other comprehensive incomeAvailable for sale reserveDeferred tax on available for sale reserve
The net cash flows generated from the discontinued operations:Operating (see notes below)Investing (see notes below)Financing (see notes below)Net cash inflow - generated from discontinued operations
Notes:Included in the cash flows from investing activities of the discontinued operation are:1. Purchase of equipment to maintain operating capacity 2. Proceed from the disposal of equipment. Earnings per share from discontinued operationsBasic earnings per share thebeDiluted earnings per share thebe
Profit on disposal of subsidiary
Total disposal proceedsCash and cash equivalents held by ISPR at the date of disposalNet cash inflow to the group
To the date of disposal
Pula
3 810 651115 218
3 925 869(72 086)
(3 239 453)(935 132)(320 802)
(86 699)(407 501)
236 547(170 954)
806 1735 875 224
23 0671 948 056
134 139 29620 046 749
493 154163 331 719
82 561163 414 280
-98 828 525
72 51998 901 044
5 742 200(1 070 806)
4 671 394
(1 298 405)110 950(86 699)
(1 274 154)
(17 567)-
(19.98)(19.52)
24 542 102
96 107 640(21 646 588)
74 461 052
Group2015Pula
70 925 3676 836 757
77 762 124(886 070)
(48 902 246)(13 331 833)
14 641 975(719 970)
13 922 005(2 739 575)11 182 430
906 4186 511 081
81 9722 539 200
132 125 28823 424 054
225 292165 813 305
91 098165 904 403
6493 775 562
-93 775 626
6 364 304(1 186 815)
5 177 489
(4 043 039)9 674 062
(1 538 963)(4 092 060)
(399 089)17 116
18.9018.16
-
---
On 12 June 2016, Imara Capital South Africa Proprietary Limited and its subsidiary Imara Asset Management South Africa Pty Limited disposed of all of the issued shares in Imara SP Reid Proprietary Limited (ISPR) which is disclosed as a discontinued operation.
The results of ISPR in these consolidated financial statements, as a discontinued operation, are shown below:
IMARA HOLDINGS LIMITEDANNOUNCEMENT OF AUDITED GROUP RESULTS FOR THE YEAR ENDED 30 APRIL 2016
IMARA HOLDINGS LIMITEDANNOUNCEMENT OF AUDITED GROUP RESULTS FOR THE YEAR ENDED 30 APRIL 2016
(44.67)(42.94)(25.78)(24.77)
For the year ended 30 April
For the year ended 30 April
For the year ended 30 April 2015
COMMENTARY
KEY POINTS:• Revenue of P95.06 million for the year ended 30 April 2016, down 21.6% from 2015• Pre-tax loss for 2016 of P13.38 million from continuing operations before profit on disposal of Imara SP Reid, exchange rate gains and goodwill impairments, compared to a loss of P6.68 million in 2015• Pre-tax profit for 2016 of P16.83 million from continuing operations compared to a loss of P18.43 million in 2015• After-tax loss for 2016 attributable to owners of the parent from continuing operations of P8.84 million compared to a loss of P26.43 million in 2015• Loss per share from continuing operations of 14.52 thebe (diluted) for 2016 compared to a loss of 42.94 thebe per share (diluted) for the prior year• Funds under management of US$437.33 million as of 30 April 2016, down 21.95% from 30 April 2015• Net asset value per share of P1.90 (diluted) as of 30 April 2016, down 5% from 30 April 2015 • Imara SP Reid disposal completed on 12 June 2015 generating net cash proceeds of P74.46 million and a profit on disposal of P24.54 million
OVERVIEWOn 24 May 2016 the Group issued a Trading Statement outlining the difficult trading conditions it had encountered in the preceding months and the negative impact that this would have on the results for the year-ending 30 April 2016.
These adverse trading conditions in the southern African markets in which Imara operates negatively affected the asset management, stockbroking and corporate finance businesses. Imara also suffered from a structurally high cost base and was unable to replace the earnings generated by Imara SP Reid since its sale in June 2015. This resulted in revenue from continuing operations declining in the year to 30 April 2016 by 21.58% to P95.06 million and pre-tax losses from continuing operations increasing to P13.38 million from P6.68 million before the profit on the disposal of Imara SP Reid, exchange rate gains and goodwill impairments. There were no goodwill impairments in 2016 compared with impairments of P12.27 million in 2015.
Other operating income from continuing operations of P39.84 million in 2016 (2015: P7.33 million) included the profit on the disposal of Imara SP Reid of P24.52 million and exchange rate gains of P5.66 million. This cushioned profits in 2016 and resulted in a profit before tax from continuing operations of P16.83 million compared to a loss of P18.43 million in 2015. The after tax loss attributable to equity holders of the parent from continuing operations reduced to P5.93 million from P23.43 million in the prior year.
The loss attributable to shareholders of the parent from continuing operations reduced to 14.52 thebe from a loss of 42.94 thebe in 2015.
The loss per fully diluted share from continuing operations attributable to shareholders of the parent reduced to 2.14 thebe in 2016 from a loss of 42.94 thebe in 2015.
As a result of the recycling of the Foreign Currency Translation Reserve associated with Imara SP Reid at the time of its sale, a one-off (non-cash) expense of P11.71 million was taken to Imara’s consolidated Income Statement, with a corresponding reduction in consolidated shareholders’ funds. The 2016 income tax charge includes dividend withholding tax of P7.53 million which relates to the dividend paid to Imara Holdings Limited following the disposal of Imara SP Reid and capital gains tax. This resulted in an after tax loss for 2016 from all op-erations (continuing and discontinued) of P17.81 million, compared to a loss of P12.25 million in the prior year.
The loss per fully diluted share from all operations attributable to shareholders of the parent reduced to 21.66 thebe in 2016 from a loss of 24.77 thebe in 2015.
WHOLLY OWNED SUBSIDIARIESAsset ManagementOur wholly owned asset management activities comprise our Offshore and South African divisions.
Total income was P38.96 million for 2016, 10.09% lower than 2015.Management fees earned were P40.83 million for 2016, 15.43% lower than 2015. No performance fees were earned in 2016, compared to P3.18 million for 2015, primarily reflecting the elimination of such fees from the fee structure of almost all of our mutual funds, this being consistent with international trends.
Total funds under management (FUM) from wholly owned subsidiaries were US$278.4 million as of 30 April 2016, down 26.1% from US$376.6 million as of 30 April 2015. Average FUM were US$327.5 million, down by 16.6% from the prior year.
During 2016, the Offshore division, which manages our offshore funds and segregated accounts, experienced a 39.5% drop in FUM to US$135.8 million at 30 April 2016 from US$224.4 million at 30 April 2015. The Offshore division encountered difficult conditions in African stock markets which witnessed declines in US Dollar terms as a result of falling markets and in a number of instances currency devaluations. International investors were largely on the sidelines, and, if anything were net sellers, which resulted in African stock market trading volumes declining significantly. Two new small segregated accounts were added during the year. We, however, experienced redemptions from our larger segregated accounts who themselves suffered redemptions from their own clients. In addition, we saw net selling in our mutual funds.
Despite the difficult environment, the Offshore division continued with its marketing initiatives and we were pleased to have been licensed as an advisor by the SEC in the USA.
Our South African asset management division suffered an approximately 8% decline in funds under management in Rand terms to R2.02 billion (US$142.5 million) at 30 April 2016 from R2.20 billion (US$152.2million) at 30 April 2015 due to the loss of a pension fund mandate and an approximately 3% decline in the Johannesburg Stock Exchange Index.
Since the year-end, Imara’s business of providing private client wealth management advisory services in South Africa has reduced. This followed the retirement of the long serving head of the Imara Asset Management (South Africa) subsidiary, which was followed by the resignations of other senior managers. This has resulted in the loss of clients who closed wealth management accounts in order to remain with the management who have left the Group. In the short term, this will have an adverse impact on FUM and on profits in the South African asset management division. This is a highly competitive sector in South Africa, which is facing significant regulatory change.
Corporate FinanceCorporate Finance comprises Imara’s wholly owned corporate finance subsidiaries in Botswana, Mauritius and South Africa.
Corporate Finance total income was P6.82 million in 2016, compared to P29.35 million in 2015.
Limited liquidity in the local capital markets in which Imara operates negatively impacted Corporate Finance income and focused corporate finance activity away from capital raising to the provision of financial advisory services to publicly quoted companies. Imara advised Botswana Insurance Holdings Limited, a subsidiary of Sanlam, in connection with its acquisition of a stake in NICO Holdings, a Malawi stock exchange listed company; Funeral Services Group of Botswana on an offer from the majority shareholders; Real Estate Investments Zambia Plc, in connection with unsolicited takeover offers it received from third parties; and ZCCM-IH on the sell down and public offer of a portion of the stake held by the Government of Zambia.
Since the year end Imara has obtained a number of new corporate finance mandates from new clients. In addition, new marketing initiatives are underway to broaden the geographic scope of corporate finance beyond Imara’s traditional markets in Botswana and Zambia which have experienced declines in mergers & acquisitions and capital markets activity.
Private EquityIn 2016, numerous investment opportunities were evaluated by the new private equity team. Weak markets in Africa led to lower equity valuations as the year progressed and greater flexibility on terms and conditions from entrepreneurs. Risk capital became increasingly scarce as domestic and international investors became more selective. These circumstances are now providing an attractive pipeline of small scale (sub US$20 million), cash generative investment opportunities across sectors that are linked to the growth of the African consumer, the continuing trend of urbanisation and Africa’s unique abundance of natural resources. The team are currently closing their first transaction and deal flow is anticipated to increase during the course of 2017. Imara will also be looking to increase the geographic reach of its private equity business and to expand its team members in order to grow the business.
COMMENTARY (continued)
Imara SP Reid To comply with International Financial Reporting Standards, the financial results for Imara SP Reid (ISPR) have been reported as dis-continued operations in both 2016 and 2015. The disposal of ISPR was concluded on 12 June 2015, and financial results for 2016 therefore include the month of May 2016.The sale of ISPR, generating net cash proceeds of P74.46 million and a profit on disposal of P24.54 million.
Post the year-end reporting date, the purchaser of ISPR, MMI Strategic Investments Proprietary Limited have, in terms of the Sale and Purchase Agreement, lodged a warranty claim of R1.34 million (P0. 989 million) against the Group. Having assessed the claim and after taking legal advice on the matter, the Group is of the view that the prospects of the claim being successful are remote, and consequently no provision has been made in the 2016 financial statements for the claim.
Operating ExpensesOperating expenses of our wholly owned subsidiaries (continuing operations) totalled P60.66 million in 2016, 1.88% higher than 2015.
RemunerationRemuneration expense of our wholly owned subsidiaries (continuing operations) including benefits, for 2016 was P37.02 million, 12.61% lower than 2015, and compared to a 21.58% decrease in revenue for the same period. Remuneration represented 47.83% of total revenue for 2016, compared to 36.75% for 2015, and 58.04% and 58.32% of total expenses for 2016 and 2015, respectively.
Approximately, 61.83% of remuneration expenses were denominated in US Dollars. The Pula stated equivalent of such amounts, escalates by the depreciation of the Pula against the US Dollar, which approximated 8.3% in 2016 and 10.0% in 2015.
Total remuneration payable to directors of IHL in 2016 was P10.70 million (4 executive & 3 non-executive directors at the year-end date), compared to P14.33 million in 2015 (5 executive & 4 non-executive directors at the year-end date). No performance bonuses are to be paid to executive directors in respect of 2016.
Non-Remuneration ExpenseNon-remuneration expense of our wholly owned subsidiaries (continuing operations) was P23.64 million for 2016, 42.91% lower than 2015 and compared to a 4.94% decrease in total income for the same period. The ratio of non-remuneration expense to total income was 17.53% for 2016, compared to 32.21% for 2015.
Non-remuneration expense relating to central corporate costs was P15.47 million for 2016 compared to P19.88 million for the prior year. Central corporate costs include central marketing and travel expenses, professional indemnity insurance cover, central risk management and compliance costs, direct and indirect costs associated with IHL’s listing on the Venture Market of the Botswana Stock Exchange as well as costs associated with maintaining the Angola operation until its operations were suspended in December 2015.
Non-recurring expenses Non-recurring expenses incurred in 2016 amount to P2.63 million and comprised final transaction costs relating to the disposal of ISPR, Zimbabwe retrenchment costs and costs associated with establishing the Angola business. The operation in Angola continued to be a drain on the resources of IHL and consumed US$114,076 of cash during the year until Imara took the decision to suspend the licence application and business operations in December 2015. This was in light of the poor prospects for generating a near term profit. In the year to 30 April 2015 the Angola operation consumed US$279,000.
PARTIALLY OWNED SUBSIDIARIES
Imara Capital Zimbabwe (Pvt) Limited (46.35%) Imara Capital Zimbabwe’s (ICZ) year end is 31 March, however, its financial results are adjusted to 30 April so that they are co-terminous with the parent company. ICZ’s functional currency is US Dollars (US$).
ICZ’s total income for 2016 was US$3.05 million, down 27.02% from 2015. ICZ incurred an after tax loss of US$250,863 in 2016 compared with a breakeven result for 2015. Cash flow was marginally negative for the year. The loss was due to increased losses in Corporate Finance and Securities which were offset to some extent by a sustained profit contribution from Asset Management, despite a 13.8% decline in funds under management to US$159.0 million. The new Imara Fiduciary business broke even.
Total staff remuneration in 2016 represented 58.38% of total income compared to 55.50% of total income in 2015. During the year cost cutting measures were introduced, which included the retrenchment/early retirement of six members of staff, a salary reduction of 20% for all staff, effective from 1 August 2015, and a significant downsizing of office space.
At 30 April 2016, ICZ had shareholders’ equity of US$1.27 million compared to US$1.32 million at 30 April 2015.
IHL did not receive dividends from ICZ in 2016, compared to dividends received of US$198,854 in 2015. Management fees received by Imara in 2016 were US$70.83 compared with US$75,31 in 2015.
The economic environment in Zimbabwe continued to deteriorate during the year. Deflation and the resulting liquidity squeeze, which grew tighter as the year progressed, resulted in an increasingly difficult trading environment. Volumes on the Zimbabwe Stock Exchange for the year halved to US$202 million from US$404 million the prior year, while the market capitalisation of the Zimbabwe Stock Exchange declined by 29.4%.
The economic situation in Zimbabwe shows no sign of improving with all hope for a recovery now centred on the negotiations with the IMF and the World Bank to unlock further lines of credit. ICZ management continues to aggressively manage costs, while pursuing all revenue enhancing opportunities. Since the year end, a further retrenchment/retirement exercise was undertaken with a further four members of staff leaving. The current year has started on a negative note with Corporate Finance, Fiduciary and Securities all trading at a loss, whilst Asset Management remains positive and ahead of budget.
Imara Capital Securities (Pty) Limited (Botswana) (51.1%)Imara Capital Securities’ (ICS) functional currency is Botswana Pula.
ICS total income for 2016 was P11.97 million, up 42.86% from 2015. After tax profit was P4.14 million, more than double from 2015. Total staff remuneration in 2016 represented 38.32% of total revenue compared to 45.55% of total revenue in 2015.
Imara received dividends totalling P1.69 million from ICS in 2016. This dividend related to the 2015 financial year. Management fees received by Imara in 2016 were P300 000 which is the same amount as the previous year. In addition, ICS redeemed preference shares with a total value P1.94 million of which Imara’s share was P950 096.
At 30 April 2016, ICS had shareholders’ equity of P4.61 million compared to P5.49 million at 30 April 2015.
In 2016, ICS repeated the performance achieved in 2015 by again emerging as the leading stockbroking firm in Botswana with a market share of approximately 35%, while the nearest competitor had a 22% market share. This dominant position was the result of consistently high levels of customer service supported by efficient trade execution and quality research. The listing of Botswana Telecommunications Corporation Limited in April 2016 brought in more than 50,000 shareholders, the majority of whom were first time investors. This is a significant figure when one considers that hitherto the most widely held share on the Botswana Stock Exchange had approximately 5,000 shareholders. The downward pressure on stockbroking commissions has been abated with the re-introduction of a floor commencing 1 April 2016.
Imara Trust Company Limited (Mauritius) (53%)Imara Trust Company’s (ITC) functional currency is US dollars.
ITC total income for 2016 was US$1.76 million, down 9.42% from 2015. Staff costs declined by 12.31% in 2016 and represented 38.00% of total income in 2016 compared to 45.89% in 2015. After tax profit was US$484,389, up 11.56% from 2015 due to enhanced expense control and a more efficient operating framework.
Imara received dividends totalling US$257,875 from ITC in 2016, compared to US$222,867 in 2015. Management fees received by Imara in 2016 were US$50,313 compared to US$47,816 in 2015.
At 30 April 2016, ITC had shareholders’ equity of US$570,849 compared to US$550,317 at 30 April 2015.
In 2016, ITC increased the number of incorporated Category 1 Global Business Companies (GBC1) that it administers. The GBC1 structure is particularly attractive to international investors as it allows access to the network of Double Taxation Agreements (DTAs) in force in Mauritius, particularly with African countries. The DTAs offer generous tax savings which makes Mauritius a valuable jurisdiction for structuring a company holding investments in various African countries.
However, during the year, the number of ‘Tax Exempt’ companies under administration decreased significantly not only due to several entities reaching the end of their life cycle and but also due to increasing international initiatives for greater transparency and disclosure. This will put increasing adverse pressure on ITC’s business in the future.
ASSOCIATES AND JOINT VENTURESAssociates and joint ventures include the 25% shareholdings in each of Stockbrokers Zambia Limited and Stockbrokers Malawi Limited, the 50% shareholding in Imara Mondise Capital Limited in South Africa and a 49% shareholding in Imara ECR Asset Management Limited in Zambia.
The share of profits from associates and joint ventures amounted to P356,176 in 2016 down 53.77% from P770,464 in 2015. Dividends received amounted to P288, 337 down 49.02% on 2015. Impairment charges for the year, amounted to P330,780 in 2016 compared to P110,704 in 2015.
TAXESThe consolidated provision for taxes for 2016 was P22.76 million compared to P5.00 million for 2015. The current year charge is abnormally high due to capital gains tax payable on the disposal of Imara SP Reid of P9.01 million and withholding on dividends of P7.53 million.
Companies within the Imara Group are each taxed as stand-alone entities, in the country jurisdictions where they operate, and tax legislation does not allow for set off against loss making businesses. This results in an effective tax rate at the Imara Group level which is substantially higher than the standard corporate tax rate in Botswana.
STATEMENT OF FINANCIAL POSITIONAs of 30 April 2016, consolidated cash and cash equivalents (including fixed deposits and net of a bank overdraft) were P121.89 million. Of this amount, IHL the parent company, had cash and cash equivalents of P71.35 million compared to P22.66 million at 30 April 2015. The increase is largely attributable to the proceeds from the sale of ISPR which are mainly held in offshore bank accounts.
IHL had consolidated shareholders’ equity attributable to shareholders of the parent of P115.56 million at 30 April 2016 compared to P123.02 million at 30 April 2015. Net asset value per share attributable to shareholders of the parent (diluted) was P1.94 at 30 April 2016 compared to P2.08 per share at 30 April 2015.
The directors of IHL continue to assess the optimal capital structure for the Imara Group, taking in to account the current and potential capital needs of subsidiaries to ensure minimum regulatory capital requirements are met and to support growth initiatives.
The Group has been trading under a Cautionary Announcement since 27 May 2016 regarding a potential offer for the Imara Group. Discussions are continuing, but it is still uncertain whether a firm offer will be made, and the Cautionary Announcement is therefore still in place. In the event that a firm offer is not made, then the Board will implement the plan to return excess capital to shareholders, either though the share buyback that was approved by shareholders in October 2015 or through a special dividend payment.
OUTLOOKDifficult trading conditions are likely to persist for the foreseeable future in the southern African markets in which Imara is active. However, markets will recover, investor confidence will return and Imara intends to be well positioned for the eventual up turn as the leading conduit for capital into Sub-Saharan Africa. We are broadening the product range of our asset management division beyond listed African equities and we are seeking new business opportunities in other parts of Africa while at the same time managing our fixed cost base downwards and maintaining a strong balance sheet.
AUDITORS REPORTThe auditors report on the Group results of Imara Holdings Limited, for the year ended 30 April 2016 is available for inspection at the Ernst & Young office in Gaborone.
BASIS OF PREPARATION OF FINANCIAL STATEMENTS
The consolidated financial statements of the group have been prepared on a going concern basis in accordance with International Financial Reporting Standards, (“IFRS”), which comprise standards approved by the International Accounting Standards Board (“IASB”) , and interpretations approved by the International Financial Reporting Interpretations Committee (“IFRIC”) and the applicable requirements of the Botswana Companies Act, 2003. The financial statements have been prepared on an historical cost basis except for certain financial instruments that are carried at fair value. The accounting policies are applied are consistent with those of the previous financial year.
NOTES TO THE CONSOLIDATED FINANCIAL STATEMENTS 1. Non-current assets and liabilities held for sale : The non-current assets and liabilities of ISPR were previously classified as “held for sale” and as a discontinued operation. The disposal of ISPR was concluded on 12 June 2015, as detailed in the notes above.
2. Prior year error Equity This is a re-classification of equity attributable to a discontinued operation which was not separately shown on the face of the Statement of Financial Position as required by IFRS 5 in the prior year. The impact on the affected lines were as follows: Non-distributable reserves (P5 177 489) Equity associated with non-current assets held for sale P5 177 489
This had no net impact on the Statement of Fnancial Position.
Company Offices: Unit 6, Second Floor, Morojwa Mews Plot 74770, Western Commercial Road, New CBD Gaborone Company Secretaries: UPT Secretarial Sevices (Pty) Limited Plot 465, Mathangwane Road, Extension 4, Gaborone & P O Box 46699, Village, Gaborone Transfer Secretaries: Corpserve Botswana Second Floor, Unit 206, Plot 64516, Showgrounds Close, Fairgrounds, Gaborone Telephone 393 2244 email: [email protected] Directors: GZ Steffens (Chairman), TB Gaffney (Chief Executive) HA Fleming ACH Mackeurtan (Mrs) TJ Matsau DE Stone HJ Wulfsohn
For & on behalf of the Board of Directors
GZ SteffensChairman
TB GaffneyChief Executive 29 July 2016
Note: An amount of P671 986 relating to “Acquisition of non-controlling interest in subsidiary ” and P92 983 relating to “Proceeds from sale of non-controlling interest in subsidiary,“ were reflected as “investing activities” in the 2015 Statement of Cash Flows. These amounts have been reclassified to “financing activities” in the current year Statement of Cash Flows.
Ernst & YoungIndependent AuditorsSecond floorPlot 22 Khama Crescent Gaborone