Embed Size (px)
Citation preview
Magnit at a Glance
Magnit at a Glance
As of December 31, 2014 Source: Company, Bloomberg, IFRS accounts for FY2014 2
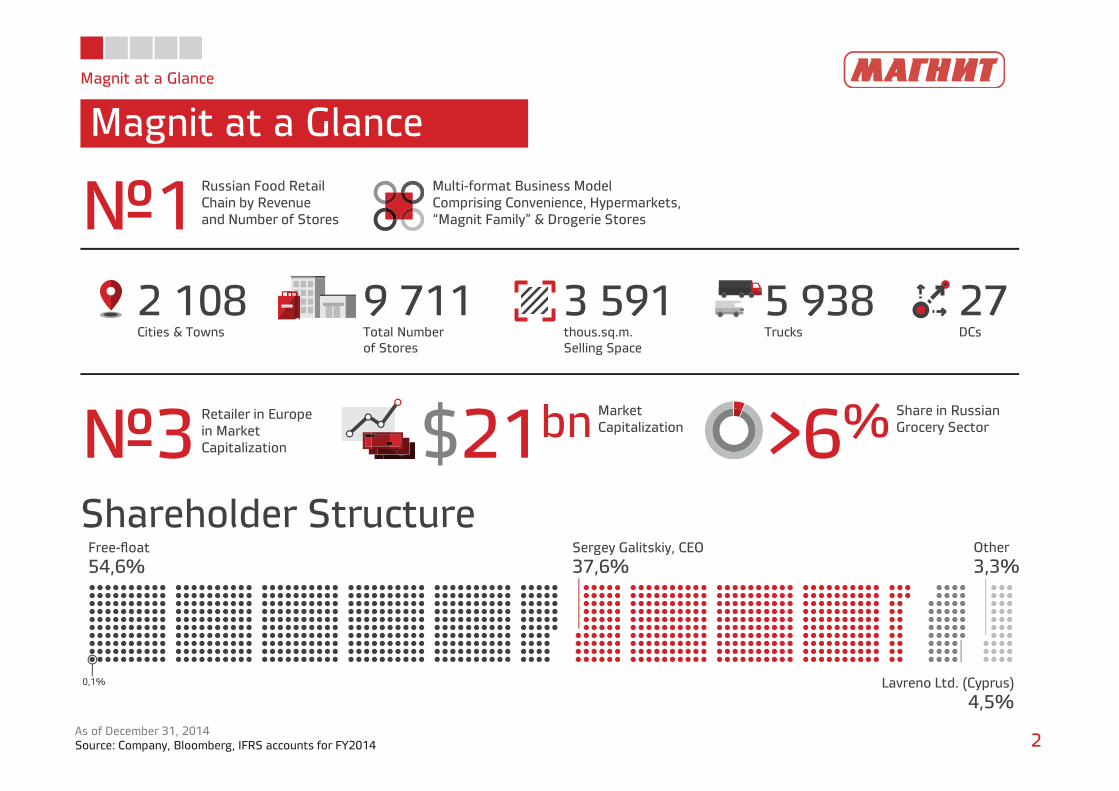
2 108Cities & Towns
№1Russian Food RetailChain by Revenueand Number of Stores
9 711Total Numberof Stores
3 591thous.sq.m.Selling Space
27DCs
5 938Trucks
Multi-format Business ModelComprising Convenience, Hypermarkets,“Magnit Family” & Drogerie Stores
№3Retailer in Europein MarketCapitalization $21bn Market
Capitalization >6% Share in RussianGrocery Sector
Shareholder Structure54,6%Free-float
37,6%Sergey Galitskiy, CEO
3,3%Other
4,5%Lavreno Ltd. (Cyprus)0,1%
Magnit at a Glance
Key Metrics
3Source: IFRS accounts for FY2014, Company’s Estimates
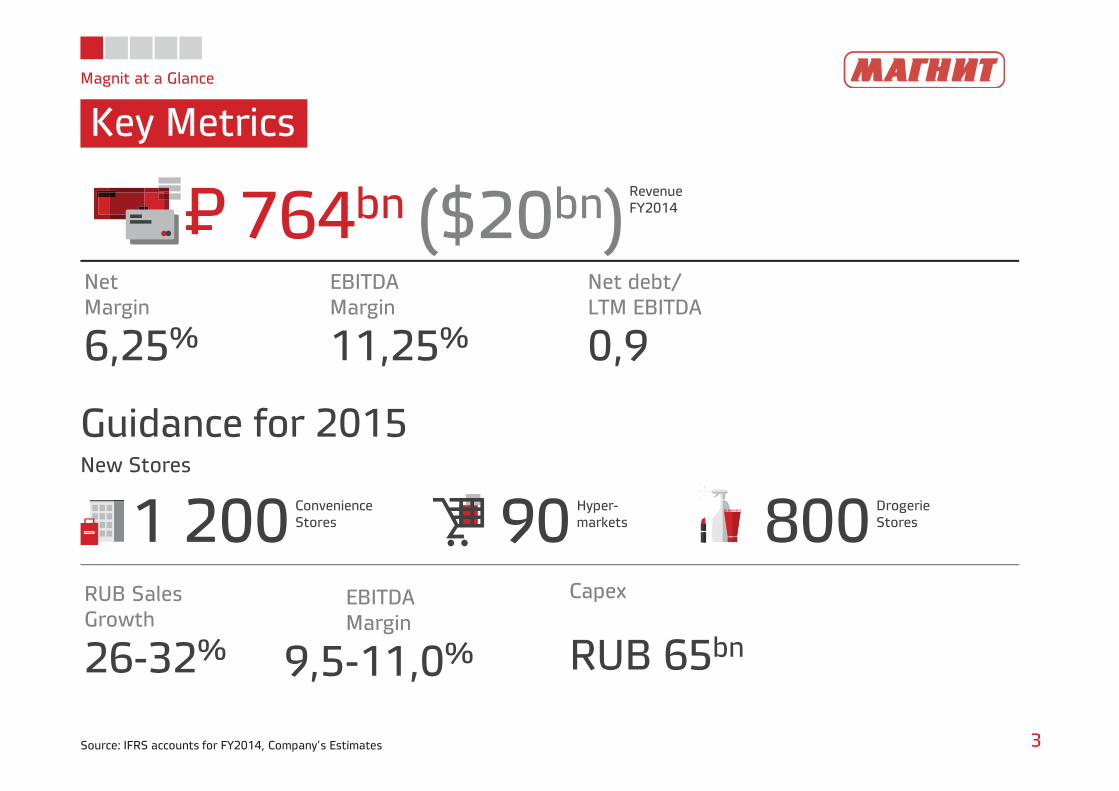
Guidance for 2015New Stores
764bn ($20bn)RevenueFY2014
6,25%
NetMargin
11,25%
EBITDAMargin
0,9
Net debt/LTM EBITDA
1 200 ConvenienceStores 90 Hyper-
markets 800 DrogerieStores
26-32%
RUB SalesGrowth
9,5-11,0%
EBITDAMargin
RUB 65bn
Capex
P=
Magnit at a Glance
Strategy
4
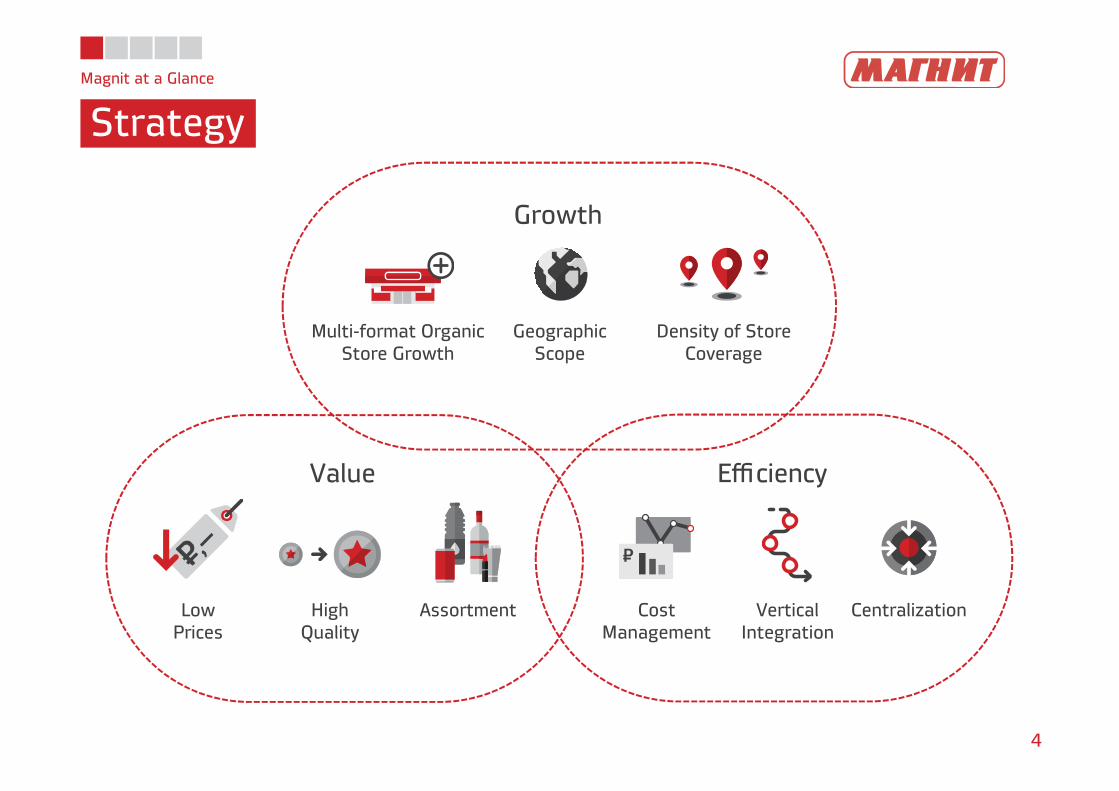
Growth
Value Efficiency
Multi-format OrganicStore Growth
GeographicScope
Density of StoreCoverage
LowPrices
HighQuality
Assortment CostManagement
VerticalIntegration
Centralization
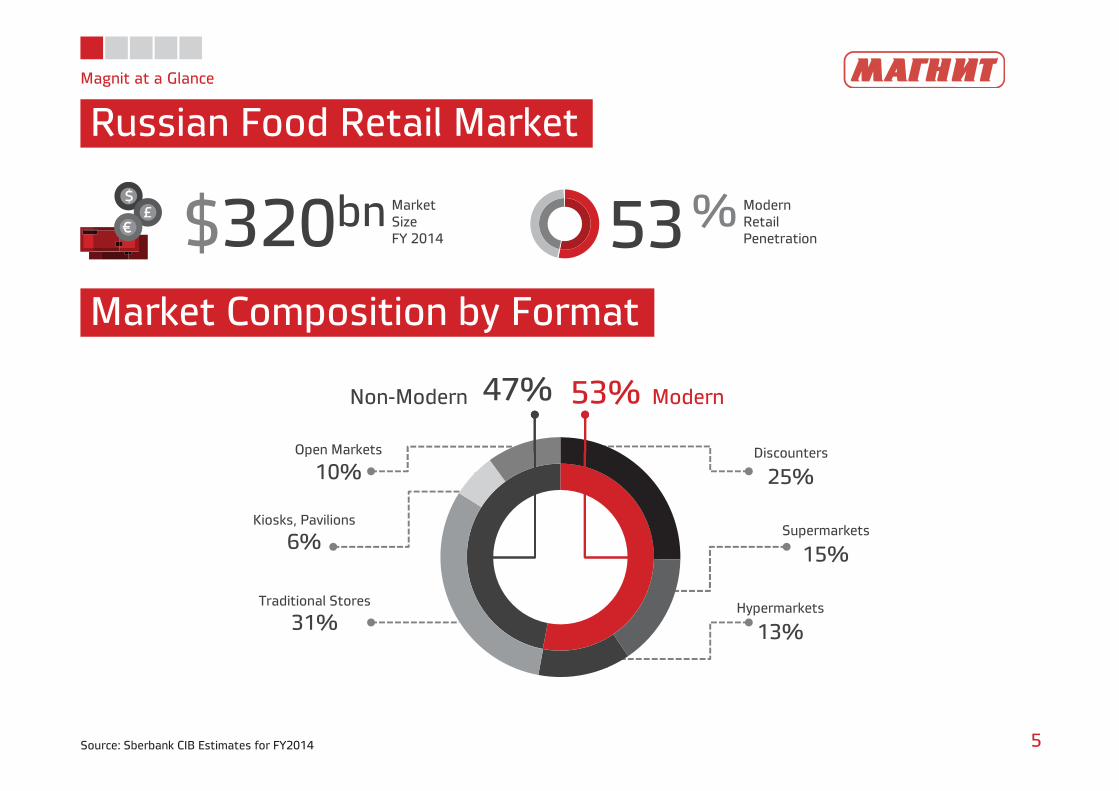
53
53%47%
Discounters
25%
Supermarkets
15%
Hypermarkets
13%
Traditional Stores
31%
Kiosks, Pavilions
6%
Open Markets
10%
Magnit at a Glance
Russian Food Retail Market
5
Market Composition by Format
$320bn MarketSizeFY 2014
% ModernRetailPenetration
Non-Modern Modern
Source: Sberbank CIB Estimates for FY2014
Magnit at a Glance
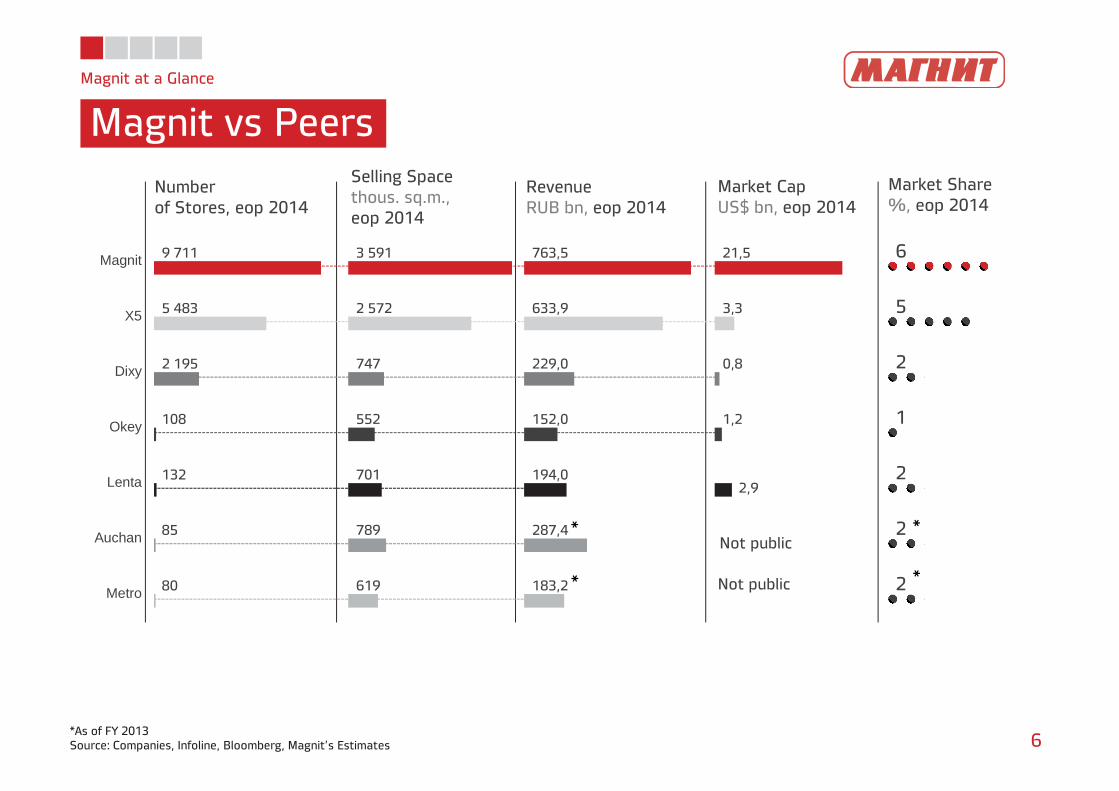
Magnit vs Peers
6*As of FY 2013Source: Companies, Infoline, Bloomberg, Magnit’s Estimates
Numberof Stores, eop 2014
Selling Spacethous. sq.m., eop 2014
RevenueRUB bn, eop 2014
Market CapUS$ bn, eop 2014
Market Share%, eop 2014
9 711
5 483
2 195
108
132
85
80
Magnit
X5
Dixy
Okey
Lenta
Auchan
Metro
3 591
2 572
747
552
701
789
619
763,5
633,9
229,0
152,0
194,0
287,4
183,2
21,5
3,3
0,8
1,2
2,9
6
5
2
1
2
2
2
Not public
Not public
*
*
*
*
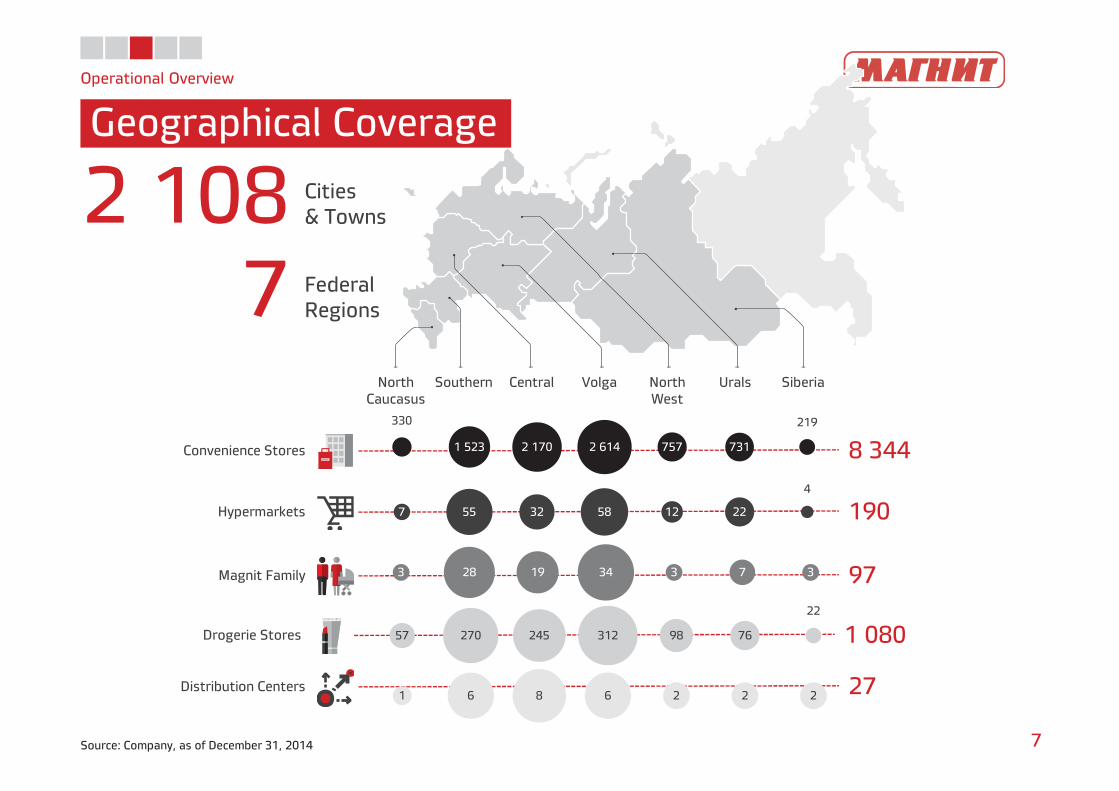
1 080Drogerie Stores
8 344Convenience Stores
190Hypermarkets
97Magnit Family
27Distribution Centers1 6 8 6 2 2 2
57 270 245 312 98 76
22
3 28 19 34 3 7 3
7 55 32 58 12 22
4
330
1 523 2 170 2 614 757 731
219
Operational Overview
Geographical Coverage
7Source: Company, as of December 31, 2014
2 108 Cities& Towns
7 FederalRegions
North Caucasus
Southern Volga North West
Urals SiberiaCentral
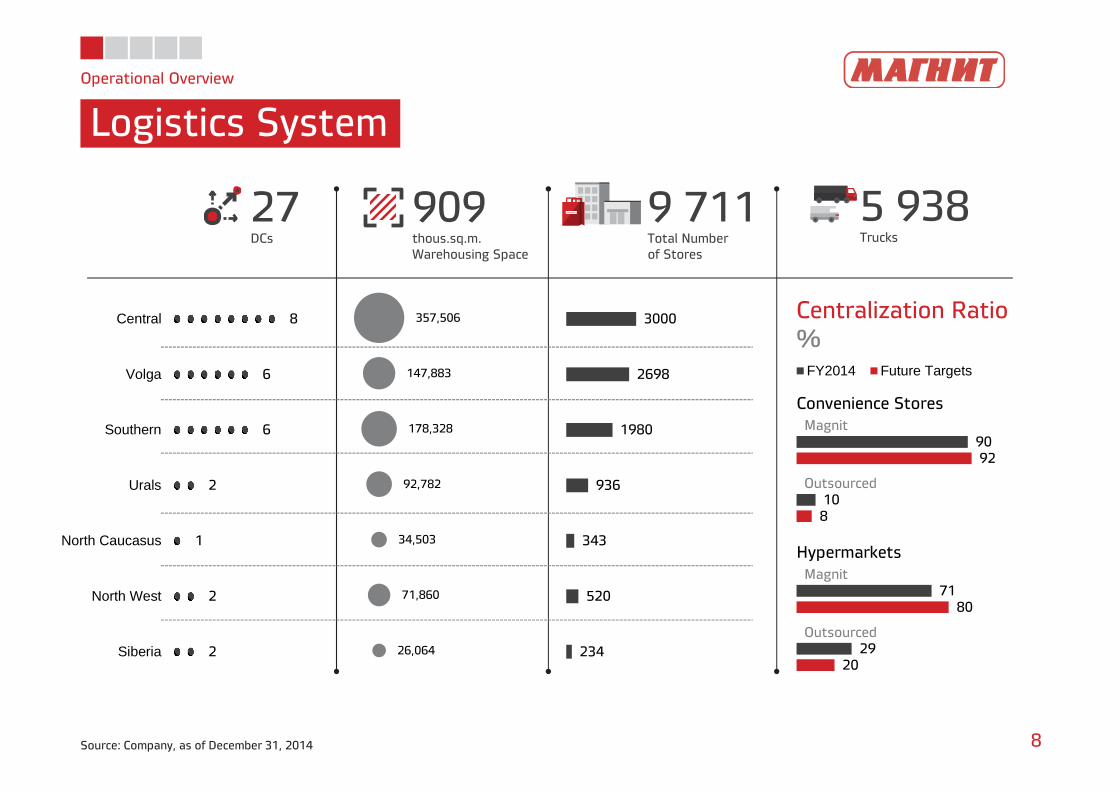
Operational Overview
Logistics System
8Source: Company, as of December 31, 2014
9 711Total Numberof Stores
909thous.sq.m.Warehousing Space
27DCs
5 938Trucks
8
6
6
2
1
2
2
Central
Volga
Southern
Urals
North Caucasus
North West
Siberia
3000
2698
1980
936
343
520
234
357,506
147,883
178,328
92,782
34,503
71,860
26,064
Centralization Ratio%
Magnit
Outsourced
90
10
92
8
Convenience Stores
FY2014 Future Targets
Magnit
Outsourced
71
29
80
20
Hypermarkets
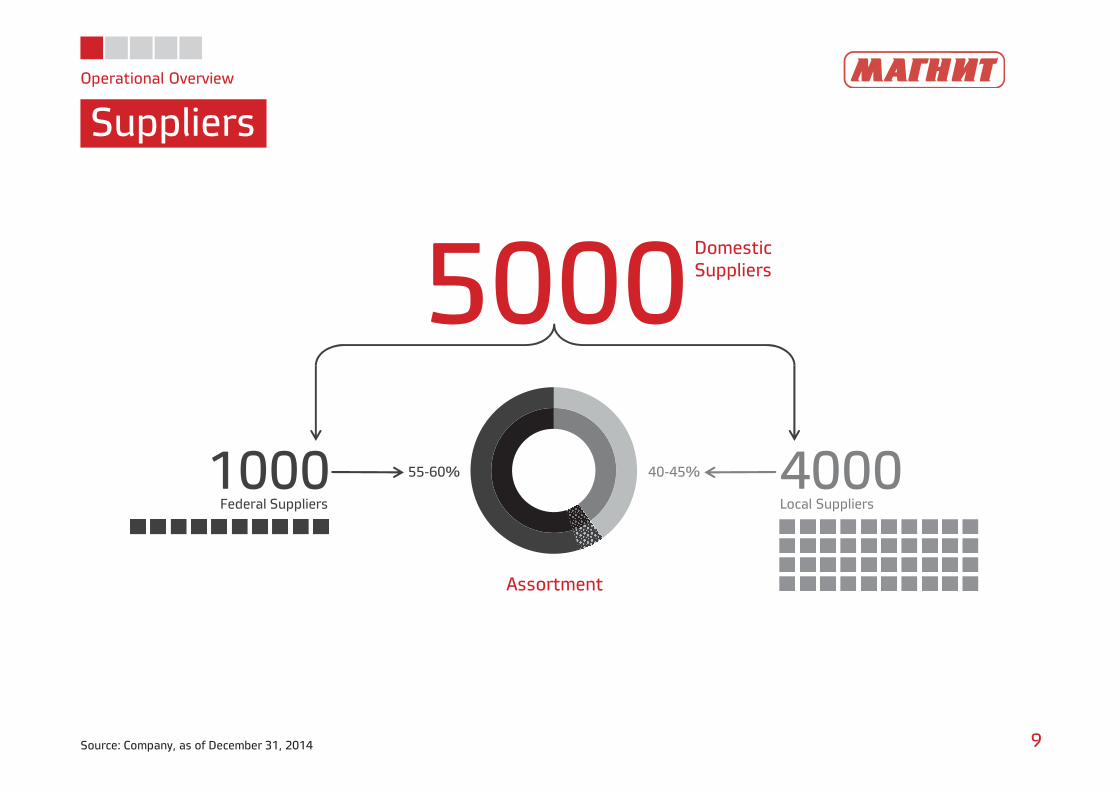
Operational Overview
Suppliers
9Source: Company, as of December 31, 2014
5000DomesticSuppliers
4000Local Suppliers
1000Federal Suppliers
Assortment
55-60% 40-45%
Operational Overview
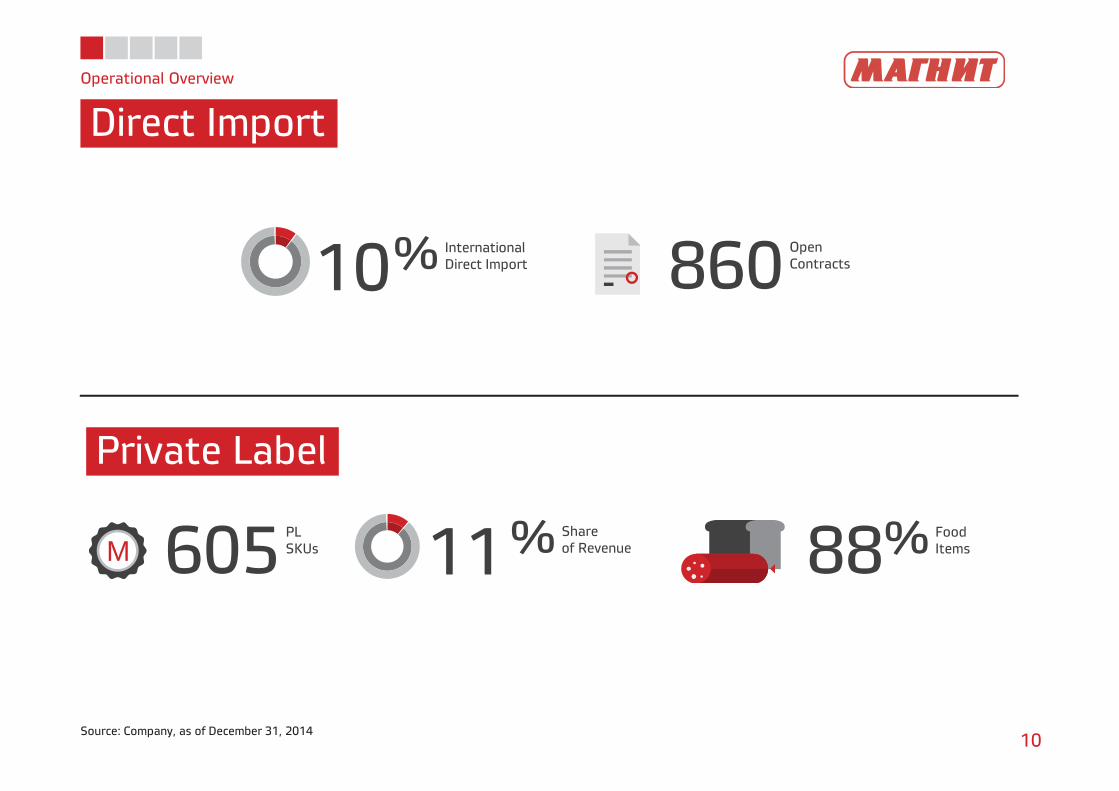
Direct Import
10Source: Company, as of December 31, 2014
11% Shareof Revenue605
PLSKUsM 88% Food
Items
Private Label
10% InternationalDirect Import 860
OpenContracts
Operational Overview
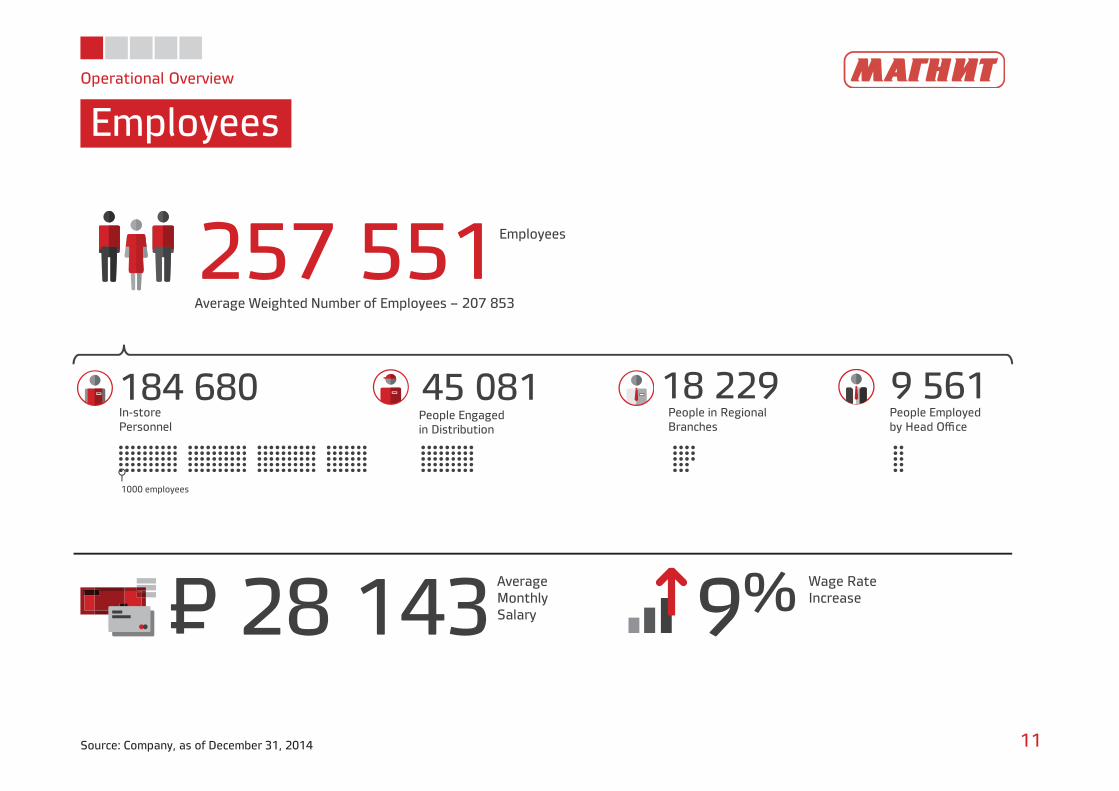
Employees
11Source: Company, as of December 31, 2014
257 551 Employees
28 143AverageMonthlySalary 9% Wage Rate
IncreaseP=
184 680In-storePersonnel
45 081People Engagedin Distribution
18 229People in RegionalBranches
9 561People Employedby Head Office
1000 employees
Average Weighted Number of Employees – 207 853
Operational Overview
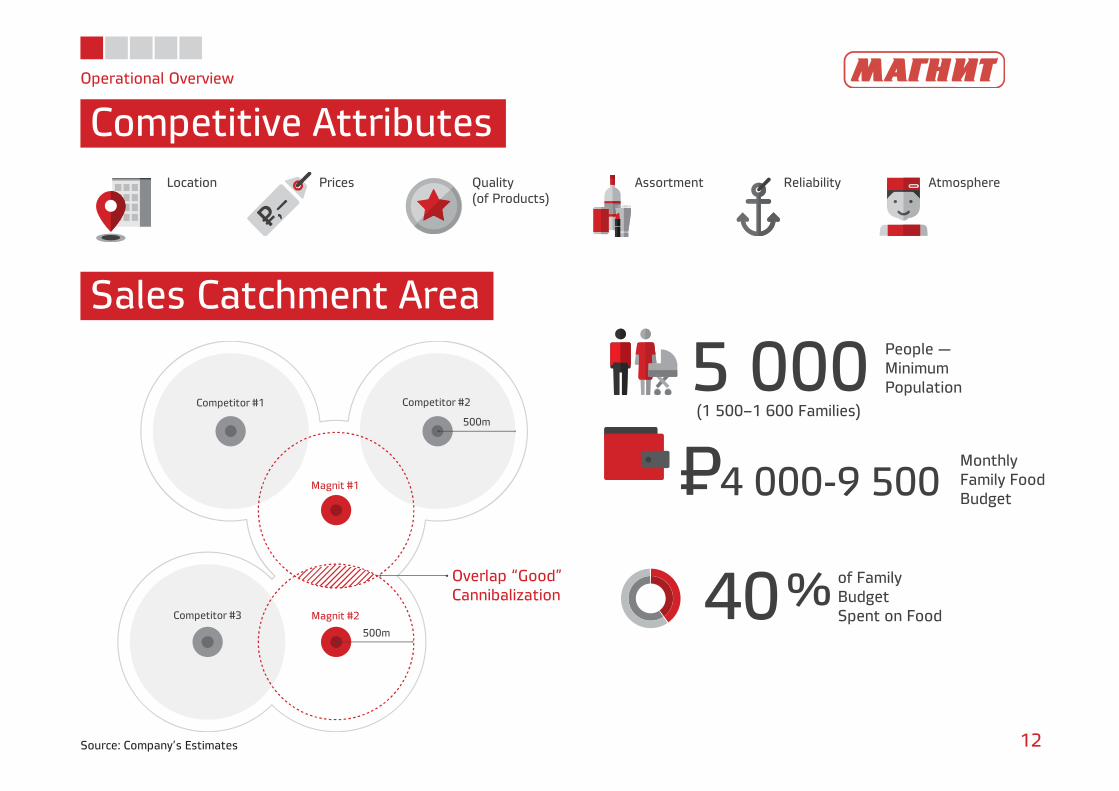
Competitive Attributes
12
40% of FamilyBudgetSpent on Food
Location Quality(of Products)
Assortment Reliability AtmospherePrices
5 000 People —MinimumPopulation
(1 500–1 600 Families)
4 000-9 500MonthlyFamily FoodBudget
P=Overlap “Good”Cannibalization
Magnit #1
Magnit #2
500m
Competitor #1 Competitor #2
Competitor #3
500m
Sales Catchment Area
Source: Company’s Estimates
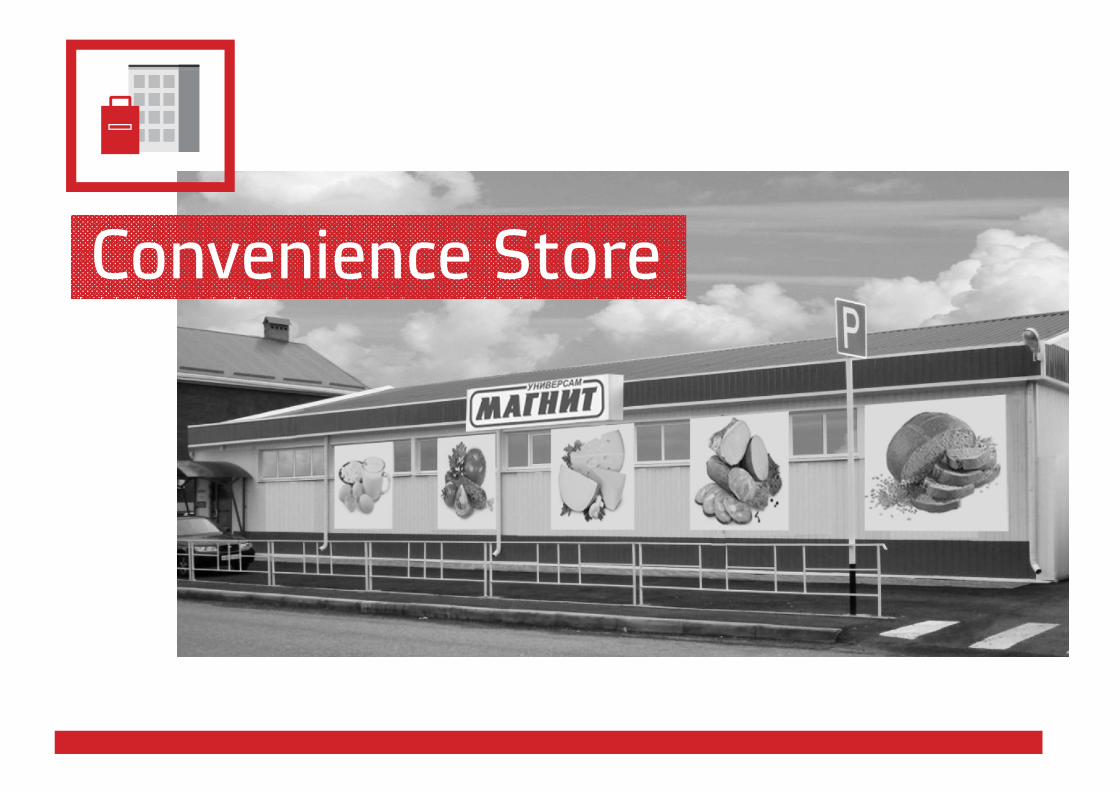
Convenience Store
Operational Overview
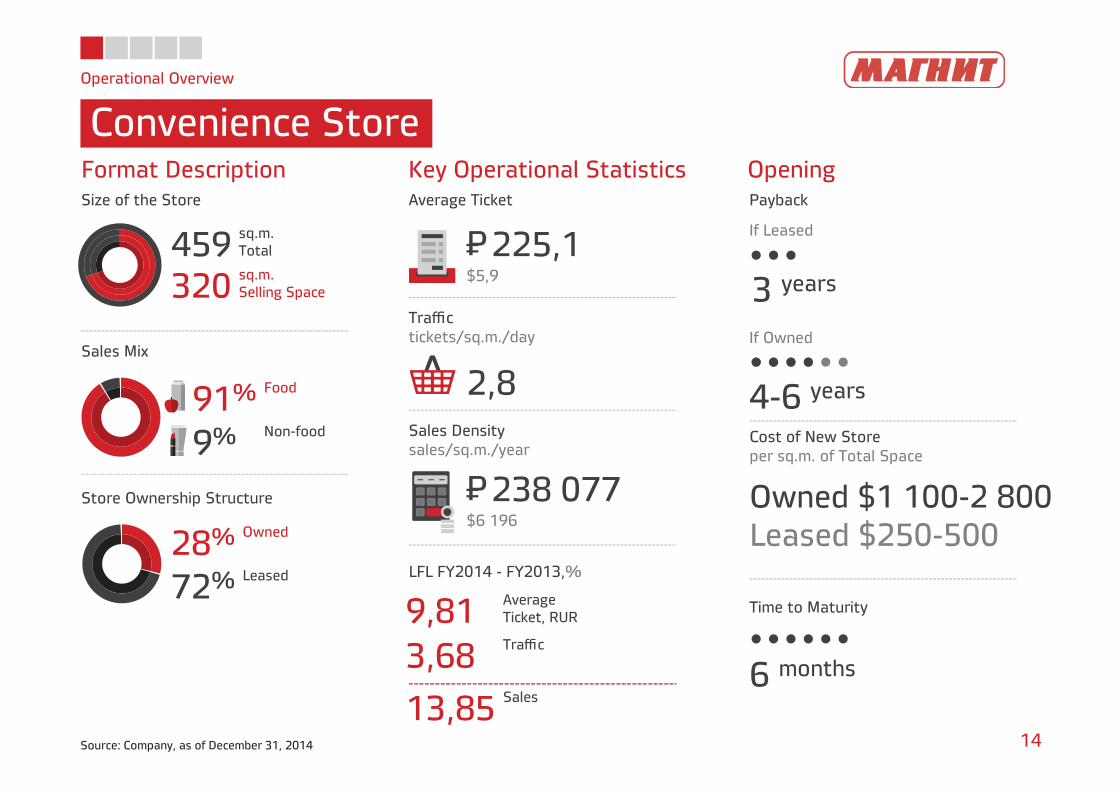
Convenience Store
14Source: Company, as of December 31, 2014
459 sq.m.Total
320 sq.m.Selling Space
91% Food
9% Non-food
28% Owned
72% Leased
Format Description Key Operational Statistics OpeningSize of the Store Average Ticket Payback
Store Ownership Structure
Sales Mix
Traffictickets/sq.m./day
Sales Densitysales/sq.m./year
LFL FY2014 - FY2013,%
225,1P=$5,9
238 077P=$6 196
9,81 AverageTicket, RUR
3,68 Traffic
13,85 Sales
2,8
3 years
If Leased
If Owned
Cost of New Storeper sq.m. of Total Space
Time to Maturity
6 months
Owned $1 100-2 800 Leased $250-500
4-6 years
Hypermarket
Operational Overview
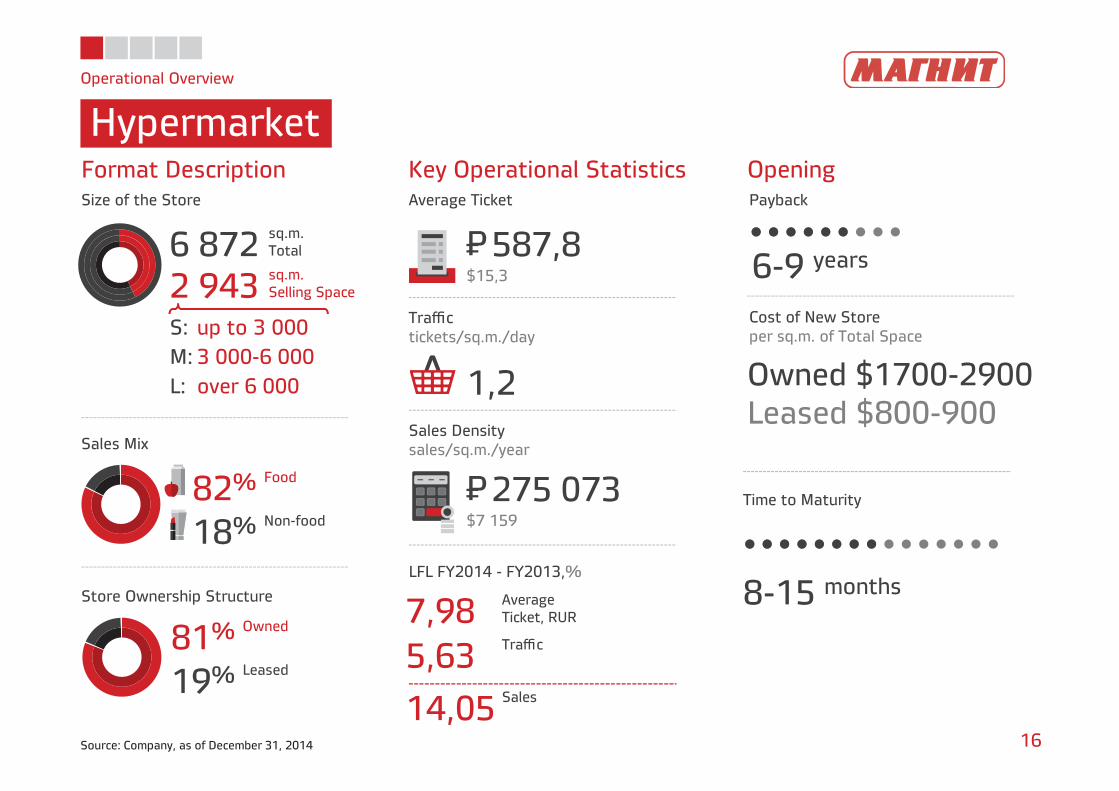
Hypermarket
16Source: Company, as of December 31, 2014
82% Food
18% Non-food
81% Owned
19% Leased
Format Description Key Operational StatisticsSize of the Store Average Ticket
Store Ownership Structure
Sales Mix
Traffictickets/sq.m./day
Sales Densitysales/sq.m./year
LFL FY2014 - FY2013,%
587,8P=$15,3
275 073P=$7 159
1,2
6 872 sq.m.Total
2 943 sq.m.Selling Space
7,98 AverageTicket, RUR
5,63 Traffic
14,05 Sales
OpeningPayback
6-9 years
Cost of New Storeper sq.m. of Total Space
Owned $1700-2900Leased $800-900
8-15 months
Time to Maturity
S: up to 3 000
M: 3 000-6 000
L: over 6 000
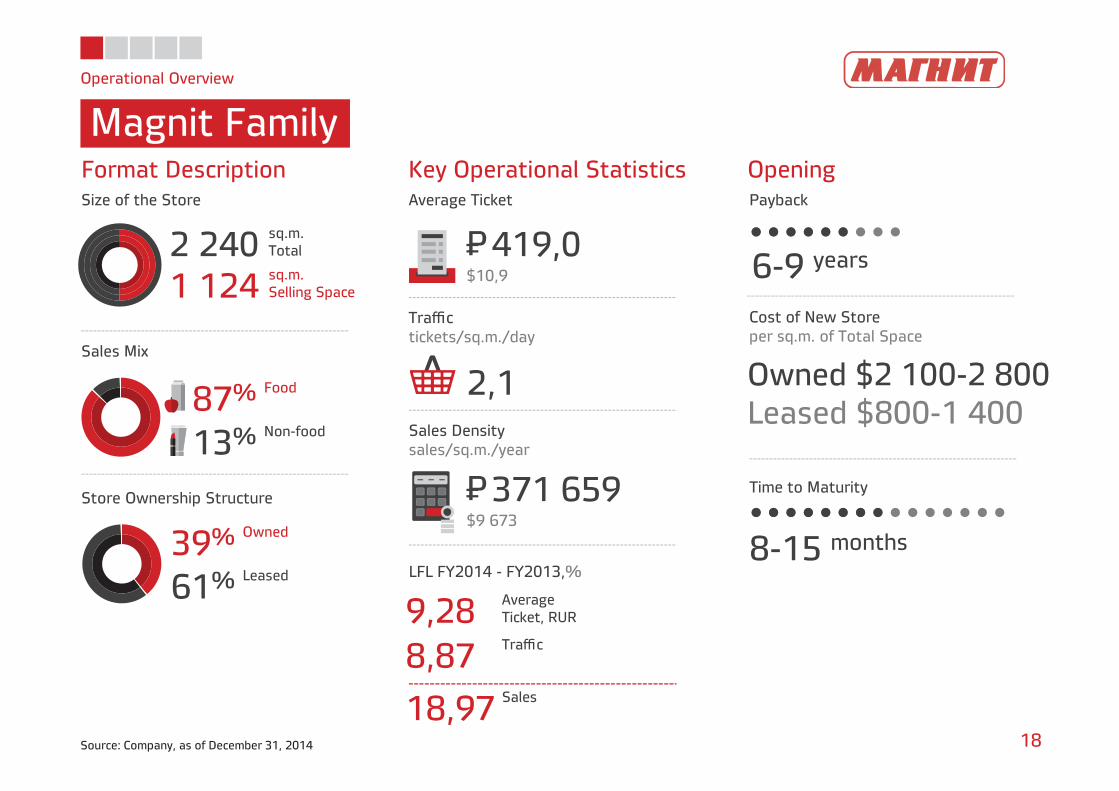
Magnit Family
Operational Overview
Magnit Family
18Source: Company, as of December 31, 2014
2 240 sq.m.Total
1 124 sq.m.Selling Space
87% Food
13% Non-food
39% Owned
61% Leased
Format Description Key Operational Statistics OpeningSize of the Store Average Ticket Payback
Store Ownership Structure
Sales Mix
Traffictickets/sq.m./day
Sales Densitysales/sq.m./year
LFL FY2014 - FY2013,%
419,0P=$10,9
371 659P=$9 673
2,1
6-9 years
Cost of New Storeper sq.m. of Total Space
Owned $2 100-2 800Leased $800-1 400
8-15 months
9,28 AverageTicket, RUR
8,87 Traffic
18,97 Sales
Time to Maturity
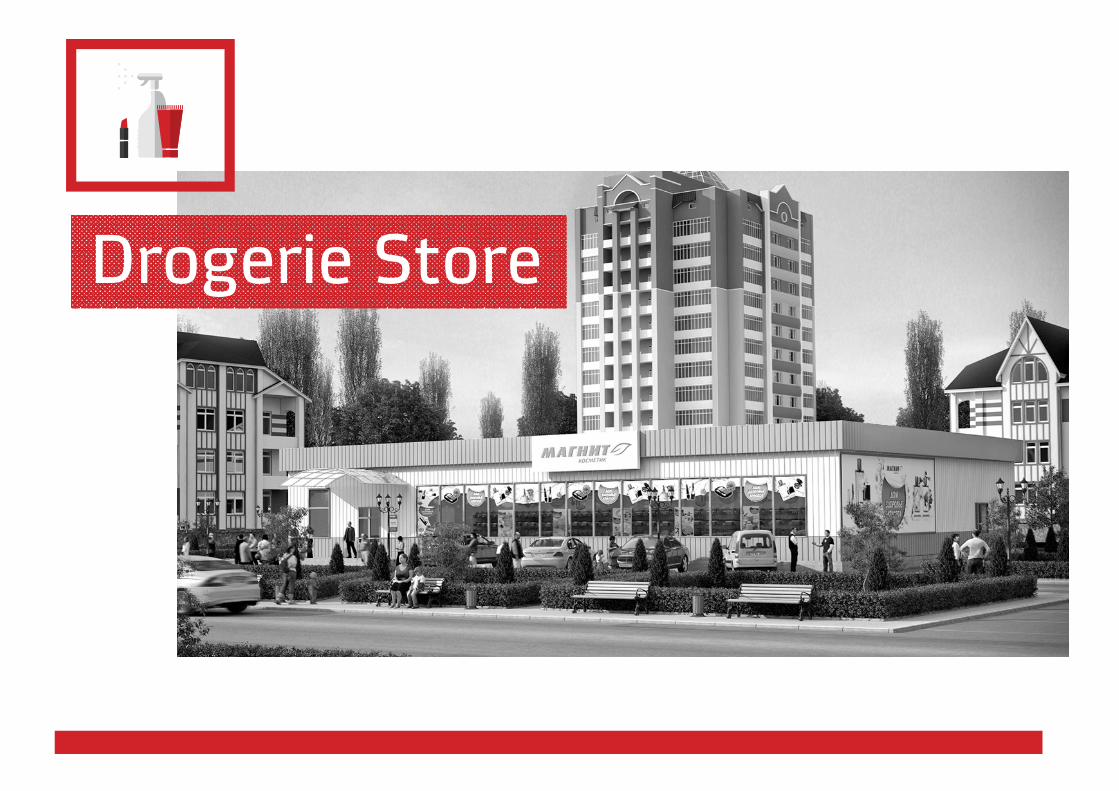
Drogerie Store
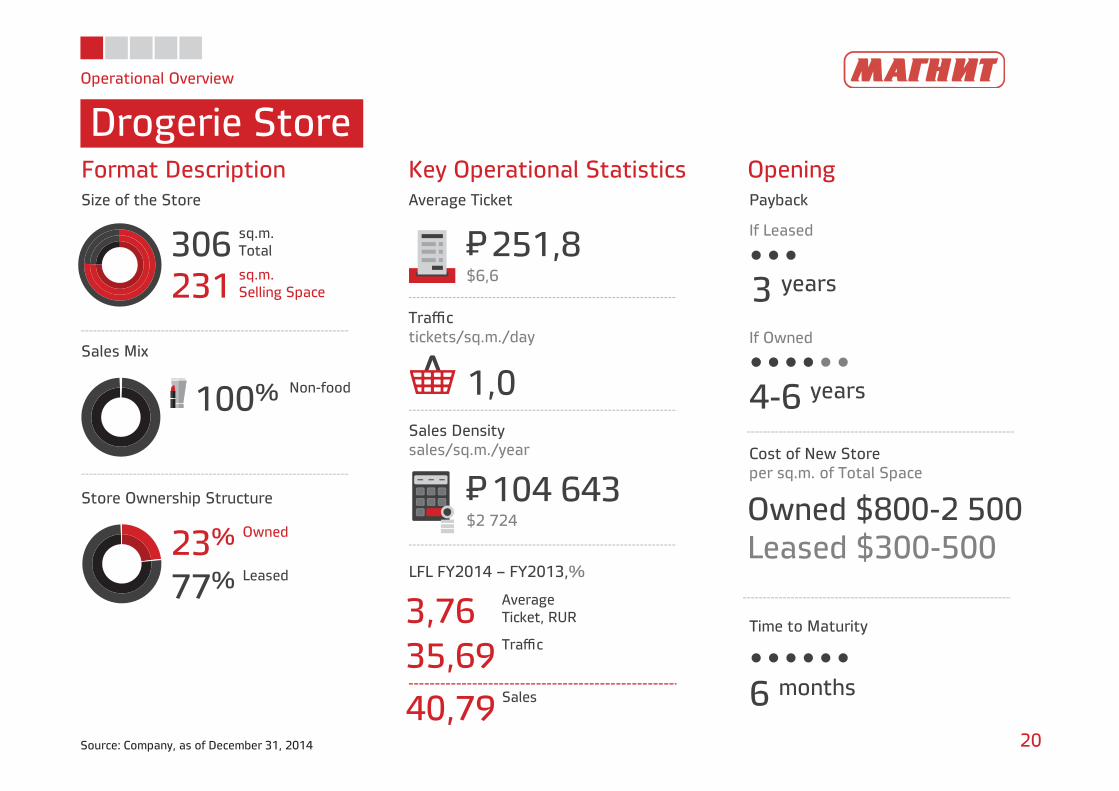
Operational Overview
Drogerie Store
20Source: Company, as of December 31, 2014
306 sq.m.Total
231 sq.m.Selling Space
100% Non-food
23% Owned
77% Leased
Format Description Key Operational Statistics OpeningSize of the Store Average Ticket Payback
Store Ownership Structure
Sales Mix
Traffictickets/sq.m./day
Sales Densitysales/sq.m./year
LFL FY2014 – FY2013,%
251,8P=$6,6
104 643P=$2 724
3,76 AverageTicket, RUR
35,69 Traffic
40,79 Sales
1,0
3 years
If Leased
If Owned
Cost of New Storeper sq.m. of Total Space
Time to Maturity
6 months
Owned $800-2 500Leased $300-500
4-6 years
Sizeof the Store
sq.m.
AverageTicket
TrafficTickets/sq.m./day
DensitySales/
sq.m./year
SalesMix
LFL FY2014-FY2013
%
Store Owner-ship Structure
PaybackYears
Cost of New Store
per sq.m.of Total Space
Timeto Maturity
Months
• Total• Selling Space
• Food• Non-food
• Av.ticket• Traffic/ Sales
• Owned• Leased
23%
77%
39%61%
81%
19%
28%
72%
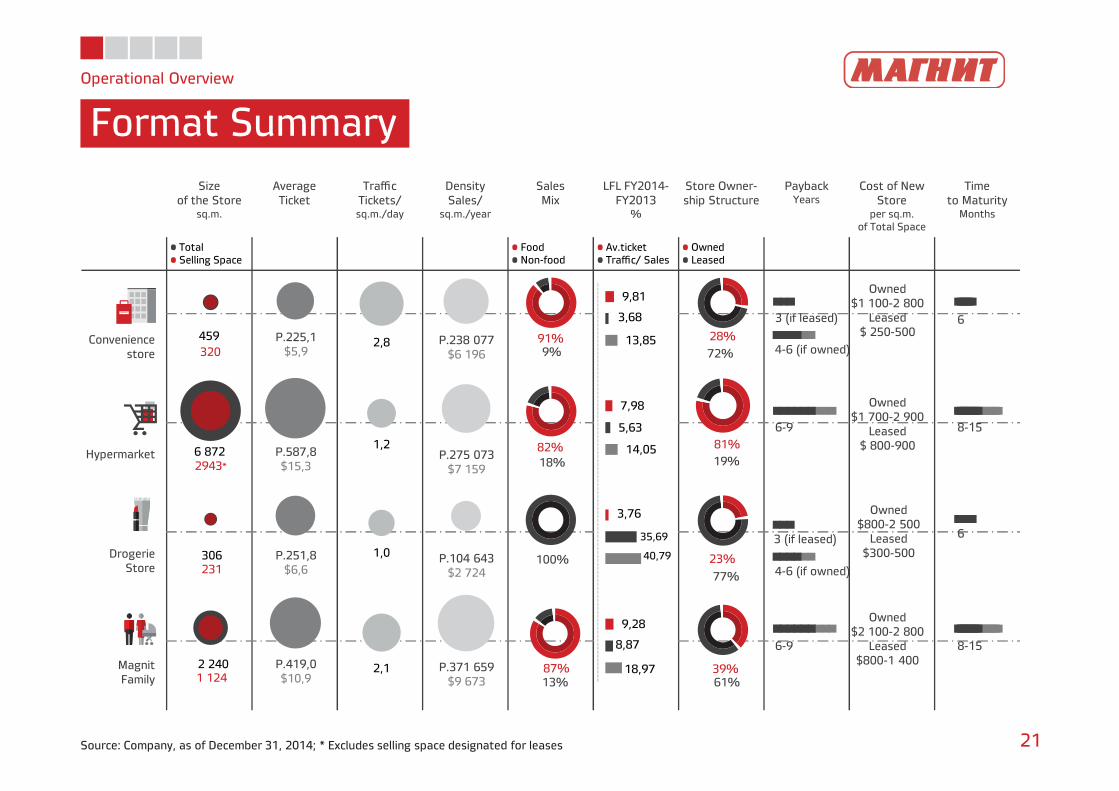
Operational Overview
Format Summary
21Source: Company, as of December 31, 2014; * Excludes selling space designated for leases
Hypermarket
DrogerieStore
MagnitFamily
459
6 872
306
2 240
320
2943*
231
1 124
Owned $1 100-2 800
Leased $ 250-500
2,8
1,2
1,0
2,1
P.225,1$5,9
P.587,8$15,3
P.251,8$6,6
P.419,0$10,9
P.238 077$6 196
P.275 073$7 159
P.104 643$2 724
P.371 659$9 673
82%18%
100%
87%13%
91%9%
Conveniencestore
6
8-15
6
8-15
3 (if leased)
6-9
3 (if leased)
6-9
4-6 (if owned)
4-6 (if owned)
9,81
7,98
3,76
9,28
3,68
5,63
35,69
8,87
13,85
14,05
40,79
18,97
Owned$1 700-2 900
Leased$ 800-900
Owned$800-2 500
Leased$300-500
Owned$2 100-2 800
Leased$800-1 400
Financial Overview
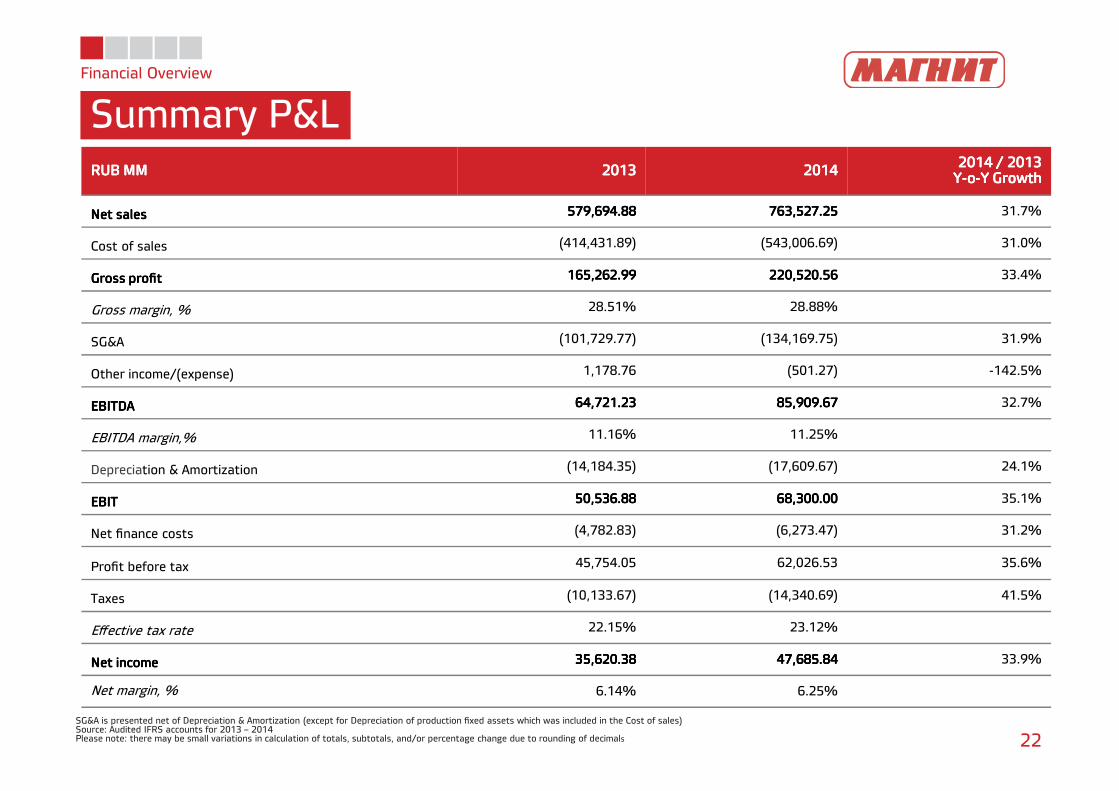
Summary P&L
SG&A is presented net of Depreciation & Amortization (except for Depreciation of production fixed assets which was included in the Cost of sales)Source: Audited IFRS accounts for 2013 – 2014Please note: there may be small variations in calculation of totals, subtotals, and/or percentage change due to rounding of decimals 22
RUB MMRUB MMRUB MMRUB MM 2013201320132013 20142014201420142014 / 20132014 / 20132014 / 20132014 / 2013
YYYY----oooo----Y GrowthY GrowthY GrowthY Growth
Net salesNet salesNet salesNet sales 579,694.88579,694.88579,694.88579,694.88 763,527.25763,527.25763,527.25763,527.25 31.7%
Cost of sales (414,431.89) (543,006.69) 31.0%
Gross profitGross profitGross profitGross profit 165,262.99165,262.99165,262.99165,262.99 220,520.56220,520.56220,520.56220,520.56 33.4%
Gross margin, % 28.51% 28.88%
SG&A (101,729.77) (134,169.75) 31.9%
Other income/(expense) 1,178.76 (501.27) -142.5%
EBITDAEBITDAEBITDAEBITDA 64,721.2364,721.2364,721.2364,721.23 85,909.6785,909.6785,909.6785,909.67 32.7%
EBITDA margin,% 11.16% 11.25%
Depreciation & Amortization (14,184.35) (17,609.67) 24.1%
EBITEBITEBITEBIT 50,536.8850,536.8850,536.8850,536.88 68,300.0068,300.0068,300.0068,300.00 35.1%
Net finance costs (4,782.83) (6,273.47) 31.2%
Profit before tax 45,754.05 62,026.53 35.6%
Taxes (10,133.67) (14,340.69) 41.5%
Effective tax rate 22.15% 23.12%
Net incomeNet incomeNet incomeNet income 35,620.3835,620.3835,620.3835,620.38 47,685.8447,685.8447,685.8447,685.84 33.9%
Net margin, % 6.14% 6.25%
Financial Overview
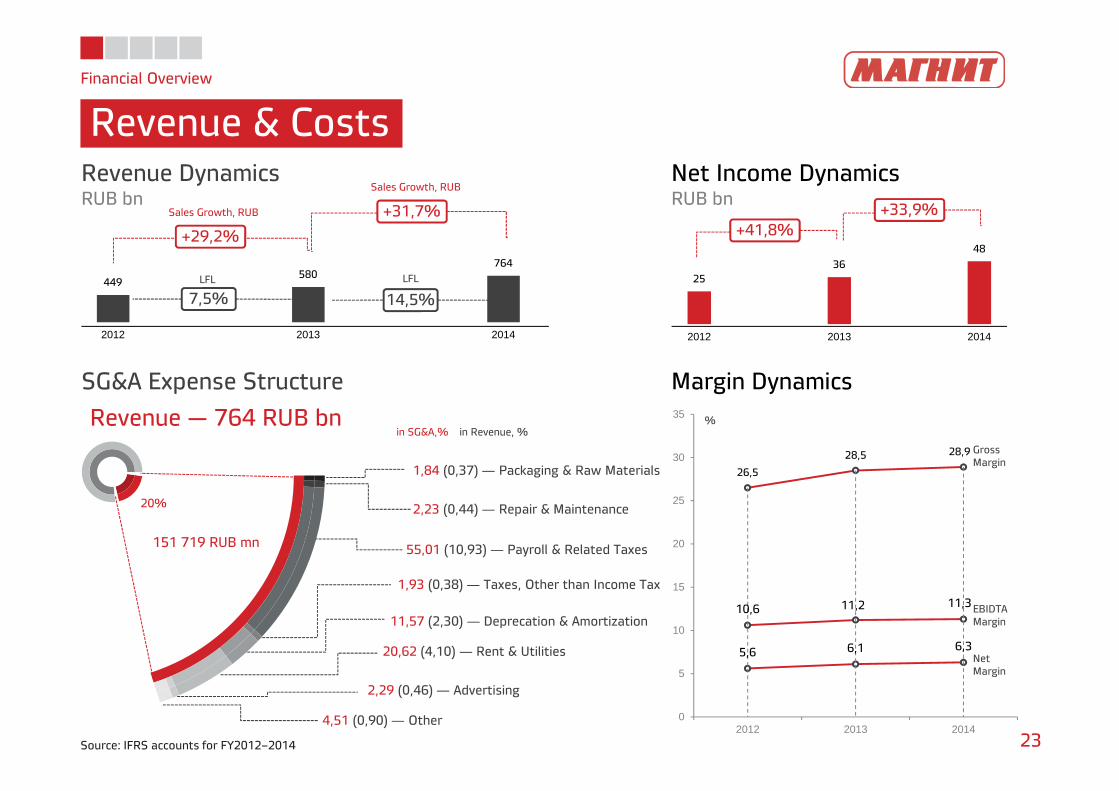
Revenue & Costs
23Source: IFRS accounts for FY2012–2014
26,5
28,5 28,9
10,6 11,2 11,3
5,6 6,1 6,3
0
5
10
15
20
25
30
35
2012 2013 2014
Revenue DynamicsRUB bn
Net Income DynamicsRUB bn
Margin DynamicsSG&A Expense Structure
Revenue — 764 RUB bnGrossMargin
EBIDTAMargin
NetMargin
%
+29,2%
7,5% 14,5%
+31,7%+41,8%
+33,9%
LFLLFL
Sales Growth, RUB
Sales Growth, RUB
449580
764
2012 2013 2014
25
36
48
2012 2013 2014
1,84 (0,37) ― Packaging & Raw Materials
2,23 (0,44) ― Repair & Maintenance
55,01 (10,93) ― Payroll & Related Taxes
1,93 (0,38)― Taxes, Other than Income Tax
11,57 (2,30) ― Deprecation & Amortization
20,62 (4,10) ― Rent & Utilities
4,51 (0,90) ― Other
in SG&A,% in Revenue, %
2,29 (0,46) ― Advertising
20%
151 719 RUB mn
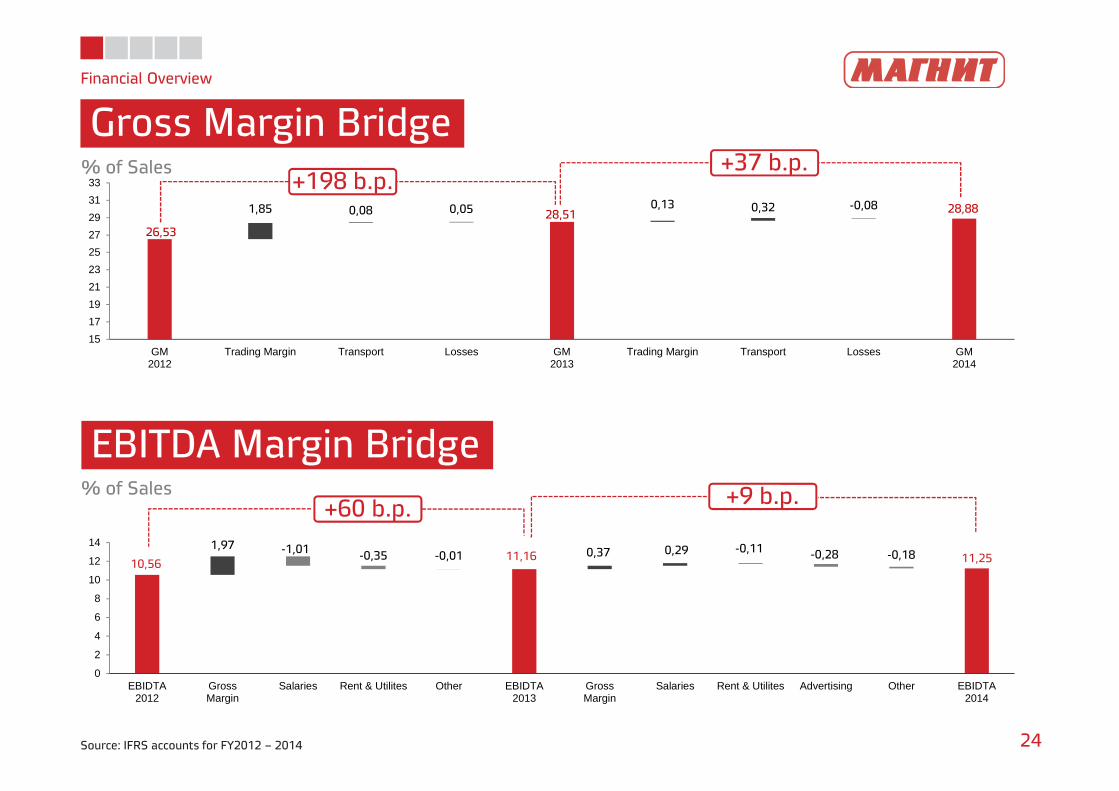
26,53
28,51 28,88-0,081,85 0,08 0,05 0,13 0,32
15
17
19
21
23
25
27
29
31
33
GM2012
Trading Margin Transport Losses GM2013
Trading Margin Transport Losses GM2014
Financial Overview
Gross Margin Bridge
24Source: IFRS accounts for FY2012 – 2014
EBITDA Margin Bridge
% of Sales
% of Sales
+198 b.p.+37 b.p.
+60 b.p. +9 b.p.
10,5611,16 11,25
-1,01-0,35 -0,01
-0,11 -0,28 -0,181,97
0,37 0,29
0
2
4
6
8
10
12
14
EBIDTA2012
GrossMargin
Salaries Rent & Utilites Other EBIDTA2013
GrossMargin
Salaries Rent & Utilites Advertising Other EBIDTA2014
Financial Overview
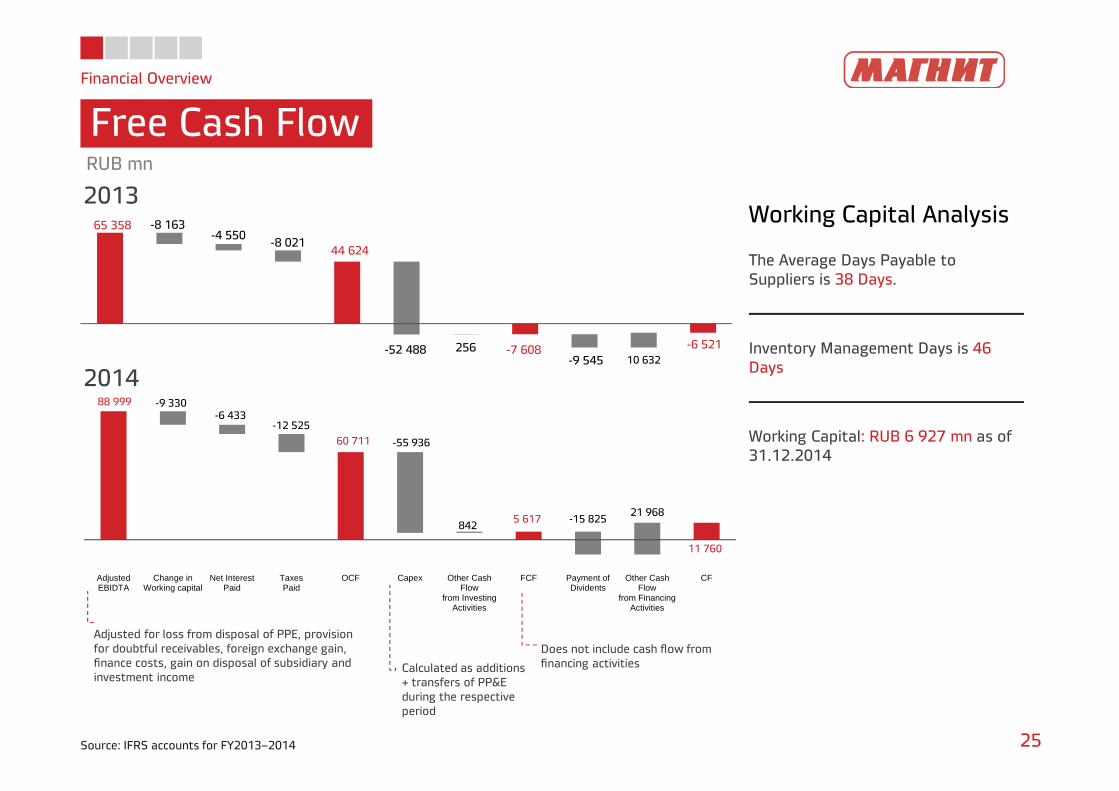
Free Cash Flow
25Source: IFRS accounts for FY2013–2014
Working Capital Analysis
The Average Days Payable to Suppliers is 38 Days.
Inventory Management Days is 46 Days
Working Capital: RUB 6 927 mn as of 31.12.2014
RUB mn
2013
2014
Adjusted for loss from disposal of PPE, provision for doubtful receivables, foreign exchange gain, finance costs, gain on disposal of subsidiary and investment income
Calculated as additions + transfers of PP&E during the respective period
Does not include cash flow from financing activities
88 999
60 711
5 617
11 760
-9 330-6 433
-12 525
-55 936
-15 82521 968
842
AdjustedEBIDTA
Change inWorking capital
Net InterestPaid
TaxesPaid
OCF Capex Other CashFlow
from InvestingActivities
FCF Payment ofDividents
Other CashFlow
from FinancingActivities
CF
65 358
44 624
-7 608 -6 521
-8 163-4 550
-8 021
-52 488 256-9 545 10 632
Financial Overview
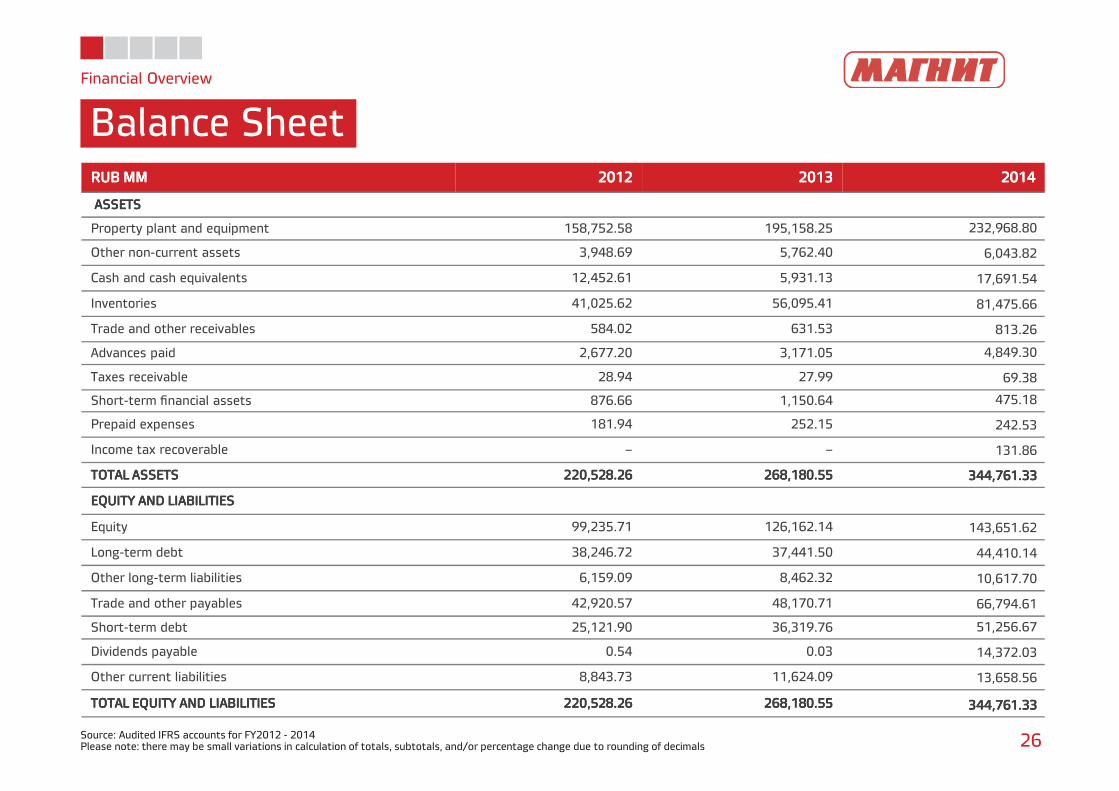
Balance Sheet
Source: Audited IFRS accounts for FY2012 - 2014Please note: there may be small variations in calculation of totals, subtotals, and/or percentage change due to rounding of decimals 26
RUB MMRUB MMRUB MMRUB MM 2012201220122012 2013201320132013 2014201420142014
ASSETS ASSETS ASSETS ASSETS
Property plant and equipment 158,752.58 195,158.25 232,968.80
Other non-current assets 3,948.69 5,762.40 6,043.82
Cash and cash equivalents 12,452.61 5,931.13 17,691.54
Inventories 41,025.62 56,095.41 81,475.66
Trade and other receivables 584.02 631.53 813.26
Advances paid 2,677.20 3,171.05 4,849.30
Taxes receivable 28.94 27.99 69.38
Short-term financial assets 876.66 1,150.64 475.18
Prepaid expenses 181.94 252.15 242.53
Income tax recoverable – – 131.86
TOTAL ASSETS TOTAL ASSETS TOTAL ASSETS TOTAL ASSETS 220220220220,,,,528.26528.26528.26528.26 268268268268,,,,180.55180.55180.55180.55 344,761.33344,761.33344,761.33344,761.33
EQUITY AND LIABILITIES EQUITY AND LIABILITIES EQUITY AND LIABILITIES EQUITY AND LIABILITIES
Equity 99,235.71 126,162.14 143,651.62
Long-term debt 38,246.72 37,441.50 44,410.14
Other long-term liabilities 6,159.09 8,462.32 10,617.70
Trade and other payables 42,920.57 48,170.71 66,794.61
Short-term debt 25,121.90 36,319.76 51,256.67
Dividends payable 0.54 0.03 14,372.03
Other current liabilities 8,843.73 11,624.09 13,658.56
TOTAL EQUITY AND LIABILITIESTOTAL EQUITY AND LIABILITIESTOTAL EQUITY AND LIABILITIESTOTAL EQUITY AND LIABILITIES 220220220220,,,,528.26528.26528.26528.26 268268268268,,,,180.55180.55180.55180.55 344,761.33344,761.33344,761.33344,761.33
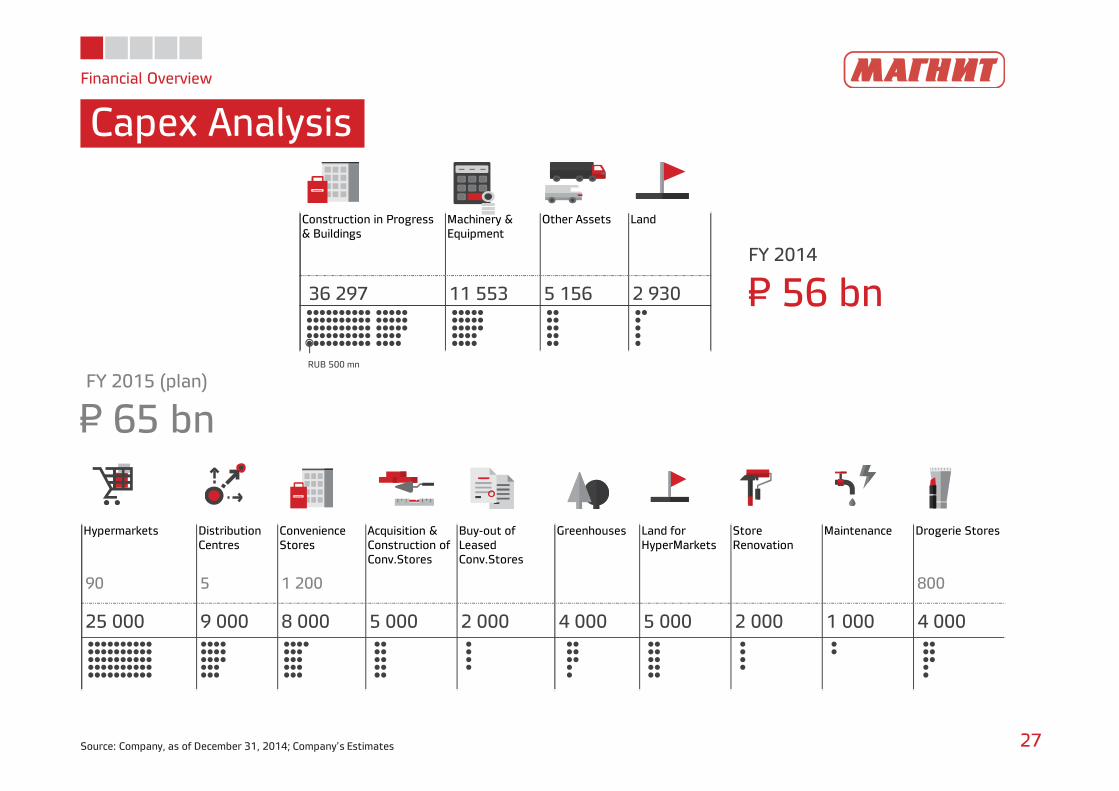
Hypermarkets Distribution Centres
Convenience Stores
Acquisition & Construction of Conv.Stores
Buy-out of Leased Conv.Stores
Greenhouses Land for HyperMarkets
Store Renovation
Maintenance Drogerie Stores
90 5 1 200 800
25 000 9 000 8 000 5 000 2 000 4 000 5 000 2 000 1 000 4 000
Financial Overview
Capex Analysis
27Source: Company, as of December 31, 2014; Company’s Estimates
Construction in Progress & Buildings
Machinery & Equipment
Other Assets Land
36 297 11 553 5 156 2 930
FY 2014
₽ 56 bn
FY 2015 (plan)
₽ 65 bn
RUB 500 mn
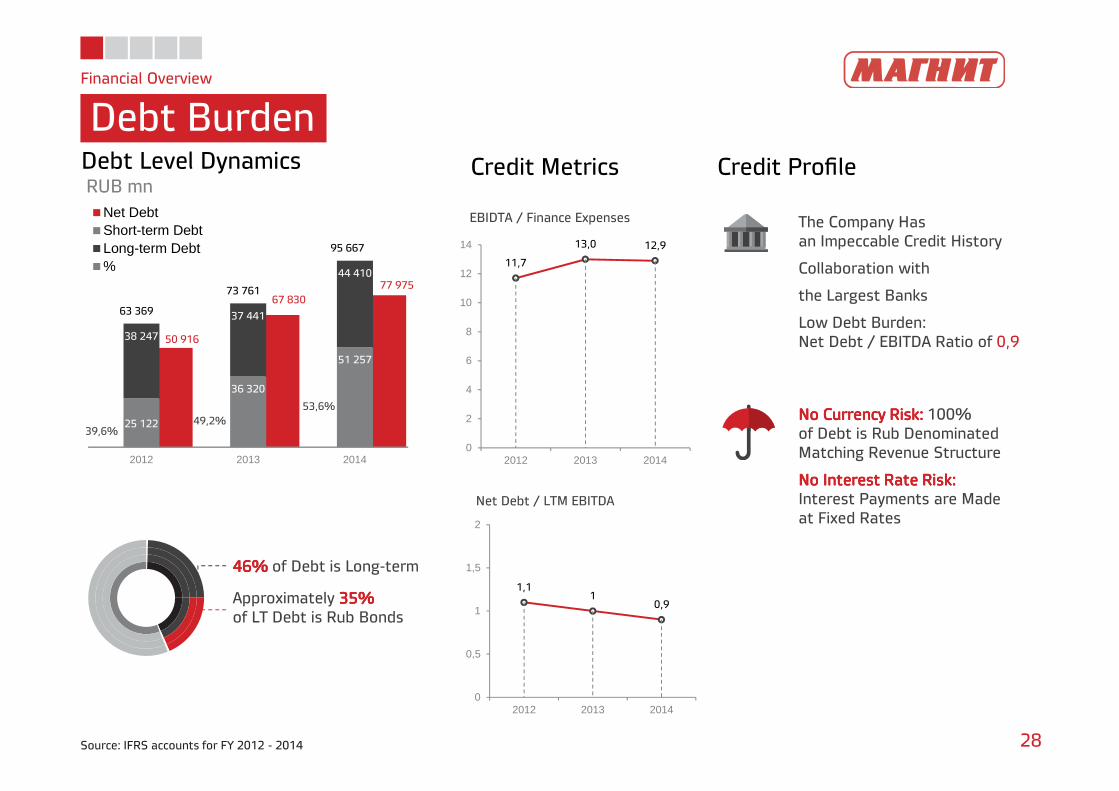
63 369
73 761
95 667
50 916
67 830
77 975
25 122
36 320
51 257
38 247
37 441
44 410
2012 2013 2014
Net DebtShort-term DebtLong-term Debt%
Financial Overview
Debt Burden
28Source: IFRS accounts for FY 2012 - 2014
11,7
13,0 12,9
0
2
4
6
8
10
12
14
2012 2013 2014
1,11
0,9
0
0,5
1
1,5
2
2012 2013 2014
Debt Level DynamicsRUB mn
Credit Metrics Credit Profile
EBIDTA / Finance Expenses
Net Debt / LTM EBITDA
The Company Hasan Impeccable Credit History
Collaboration with
the Largest Banks
Low Debt Burden:Net Debt / EBITDA Ratio of 0,9
No Currency Risk: No Currency Risk: No Currency Risk: No Currency Risk: 100%of Debt is Rub DenominatedMatching Revenue Structure
No Interest Rate Risk:No Interest Rate Risk:No Interest Rate Risk:No Interest Rate Risk:Interest Payments are Madeat Fixed Rates
39,6%49,2%
53,6%
46% 46% 46% 46% of Debt is Long-term
Approximately 35%35%35%35%of LT Debt is Rub Bonds
Contact Information
Contact Information
29
Timothy PostHead of Investor Relations
+7 (961) [email protected]://ir.magnit.com
15/2 Solnechnaya StreetKrasnodar, 350072Russian Federation