Embed Size (px)
Citation preview
INVESTOR PRESENTATION
FY 2015 RESULTS published on January 27, 2016
Magnit at a Glance
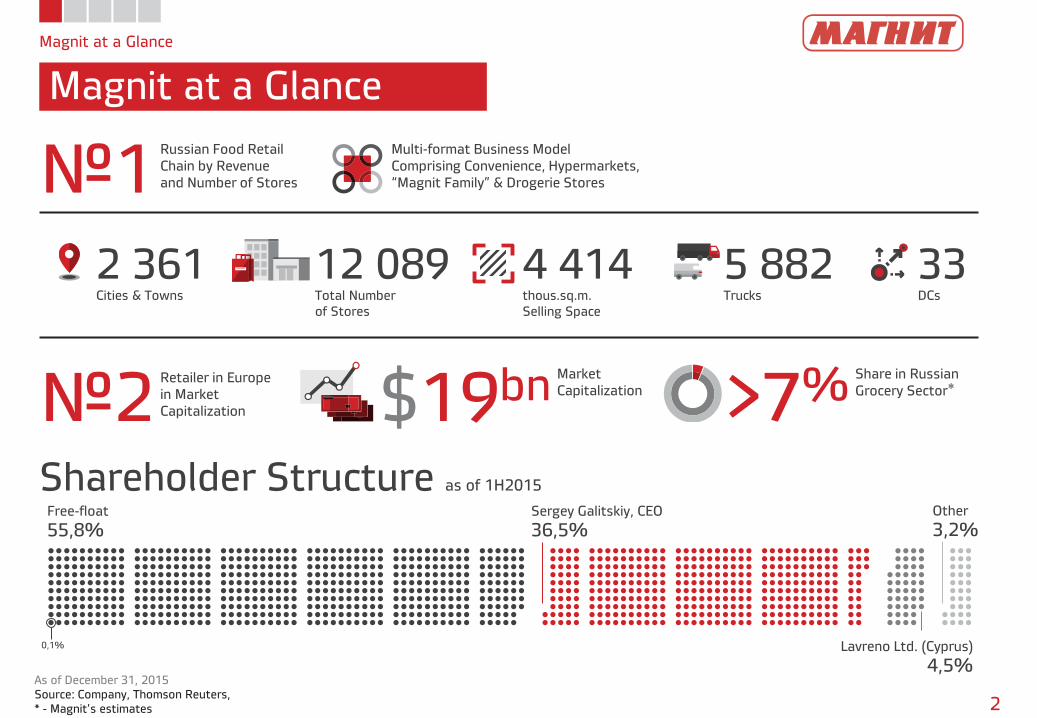
Magnit at a Glance
As of December 31, 2015
Source: Company, Thomson Reuters,
* - Magnit’s estimates 2
2 361 Cities & Towns
№1 Russian Food Retail
Chain by Revenue
and Number of Stores
12 089 Total Number
of Stores
4 414 thous.sq.m.
Selling Space
33 DCs
5 882 Trucks
Multi-format Business Model
Comprising Convenience, Hypermarkets,
“Magnit Family” & Drogerie Stores
№2 Retailer in Europe
in Market
Capitalization $19bn Market
Capitalization >7% Share in Russian
Grocery Sector ⃰
Shareholder Structure as of 1H2015
55,8% Free-float
36,5% Sergey Galitskiy, CEO
3,2% Other
4,5% Lavreno Ltd. (Cyprus) 0,1%
Magnit at a Glance
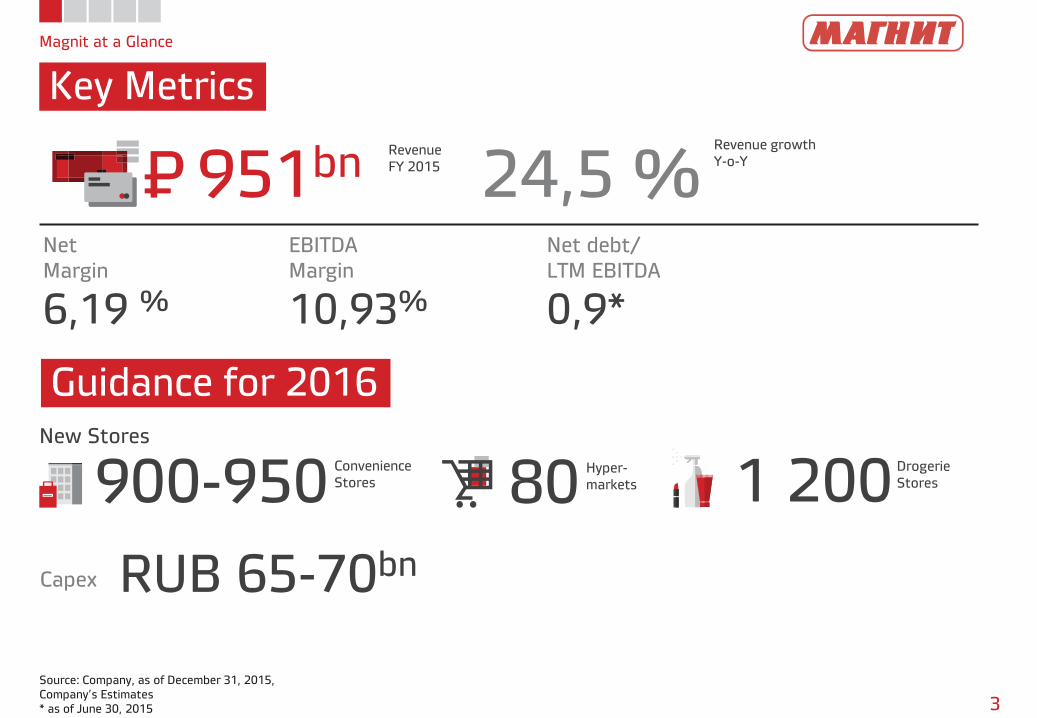
Key Metrics
3
Source: Company, as of December 31, 2015,
Company’s Estimates
* as of June 30, 2015
New Stores
951bn 24,5 % Revenue
FY 2015
6,19 %
Net
Margin
10,93%
EBITDA
Margin
0,9*
Net debt/
LTM EBITDA
900-950 Convenience
Stores 80 Hyper-
markets 1 200 Drogerie
Stores
RUB 65-70bn Capex
P = Revenue growth
Y-o-Y
Guidance for 2016
Magnit at a Glance
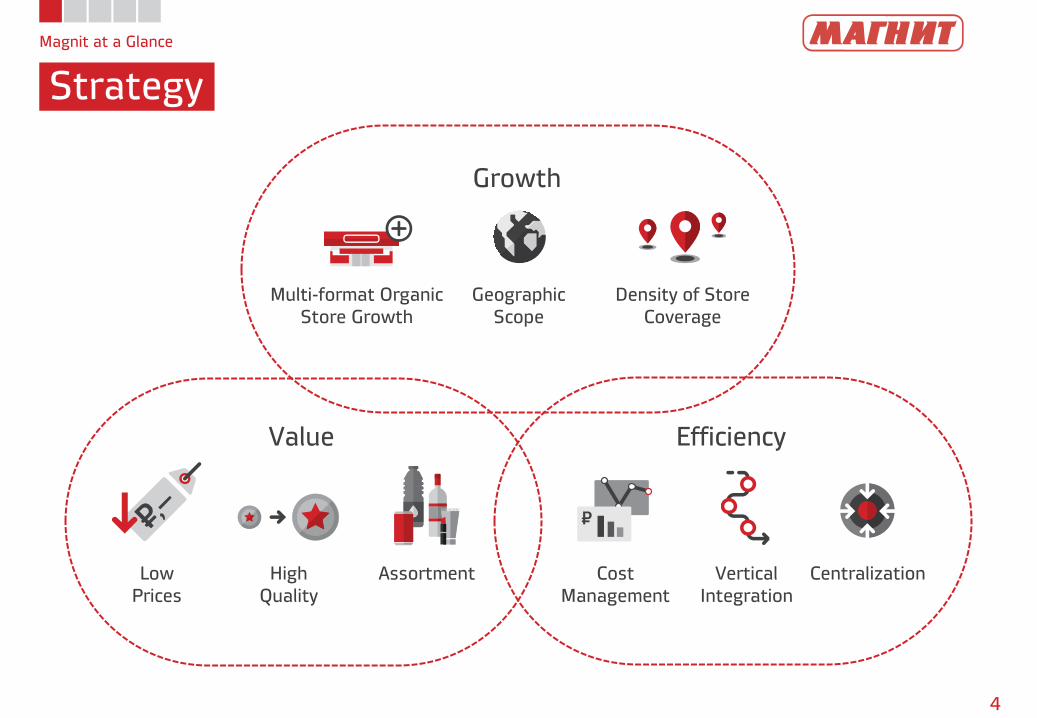
Strategy
4
Growth
Value Efficiency
Multi-format Organic
Store Growth
Geographic
Scope
Density of Store
Coverage
Low
Prices
High
Quality
Assortment Cost
Management
Vertical
Integration
Centralization
65
Magnit at a Glance
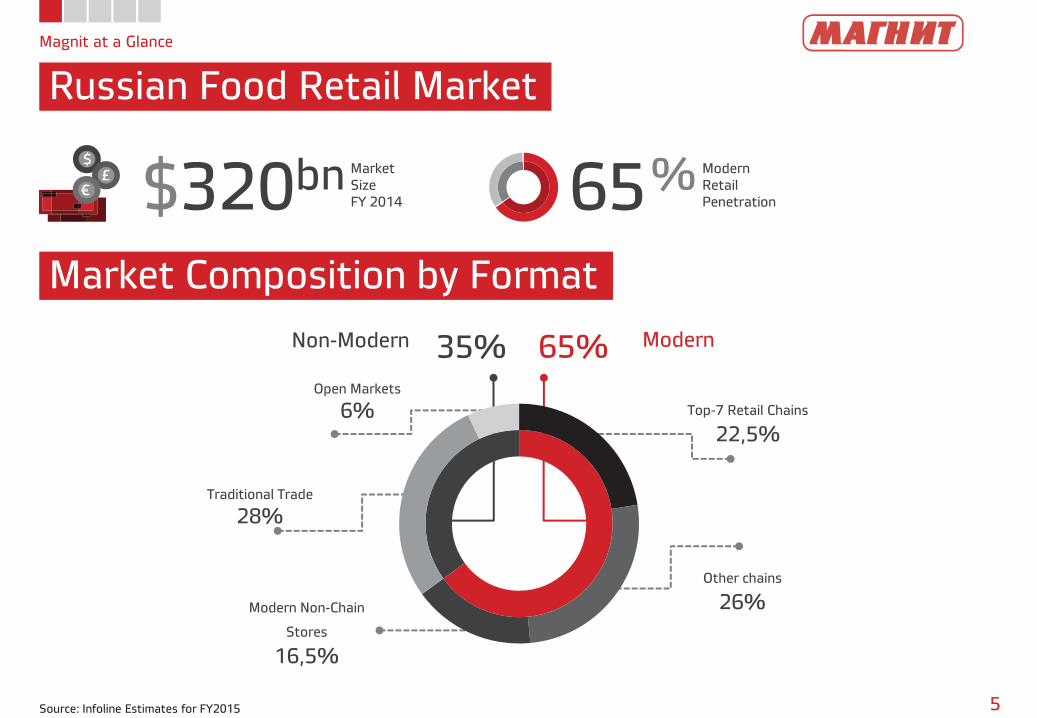
Russian Food Retail Market
5
Market Composition by Format
$320bn Market
Size
FY 2014 % Modern
Retail
Penetration
Non-Modern Modern
Source: Infoline Estimates for FY2015
65% 35%
Top-7 Retail Chains
22,5%
Modern Non-Chain
Stores
16,5%
Other chains
26%
Traditional Trade
28%
Open Markets
6%
Magnit at a Glance
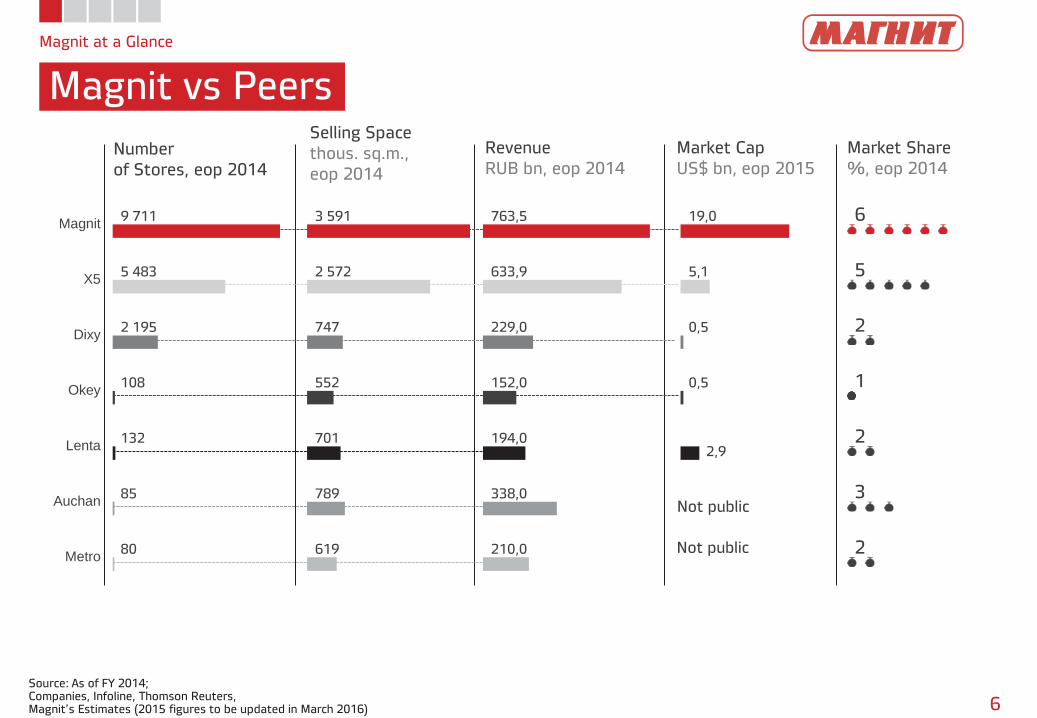
Magnit vs Peers
6
Source: As of FY 2014; Companies, Infoline, Thomson Reuters, Magnit’s Estimates (2015 figures to be updated in March 2016)
Number
of Stores, eop 2014
Selling Space
thous. sq.m.,
eop 2014
Revenue
RUB bn, eop 2014
Market Cap
US$ bn, eop 2015
Market Share
%, eop 2014
9 711
5 483
2 195
108
132
85
80
Magnit
X5
Dixy
Okey
Lenta
Auchan
Metro
3 591
2 572
747
552
701
789
619
763,5
633,9
229,0
152,0
194,0
338,0
210,0
19,0
5,1
0,5
0,5
2,9
6
5
2
1
2
3
2
Not public
Not public
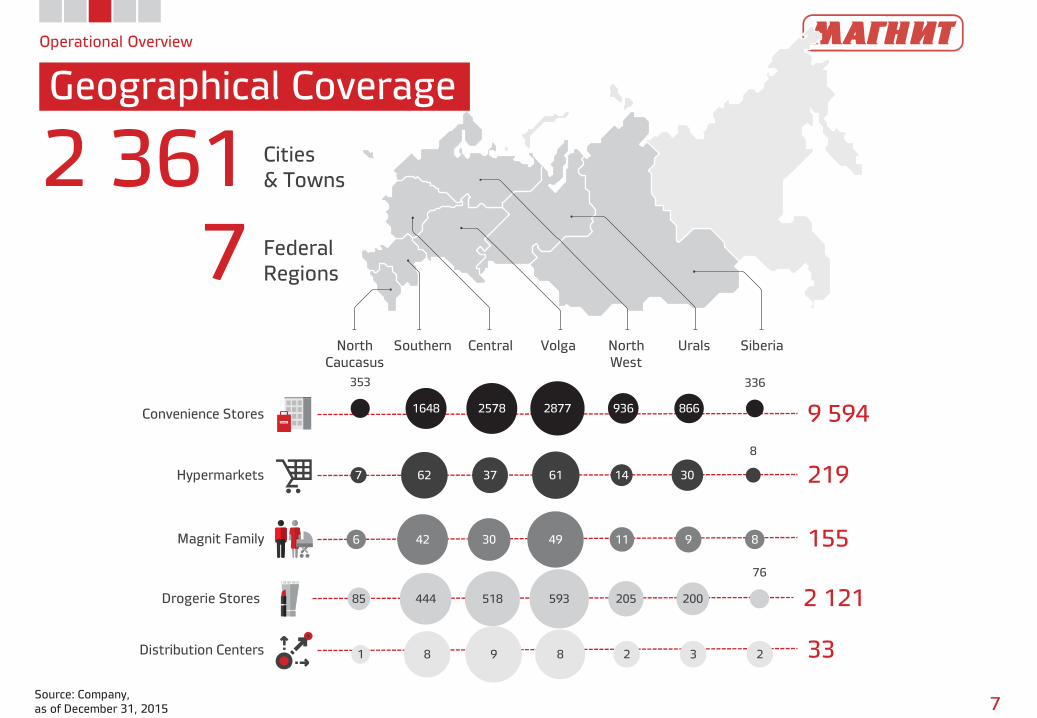
2 121 Drogerie Stores 85 444 518 593 205 200
76
9 594 Convenience Stores
219 Hypermarkets
155 Magnit Family
33 Distribution Centers
6 42 30 49 11 9 8
7 62 37 61 14 30
8
353
1648 2578 2877 936 866
336
Operational Overview
Geographical Coverage
7 Source: Company,
as of December 31, 2015
2 361 Cities
& Towns
7 Federal
Regions
North
Caucasus
Southern Volga North
West
Urals Siberia Central
1 8 9 8 2 3 2
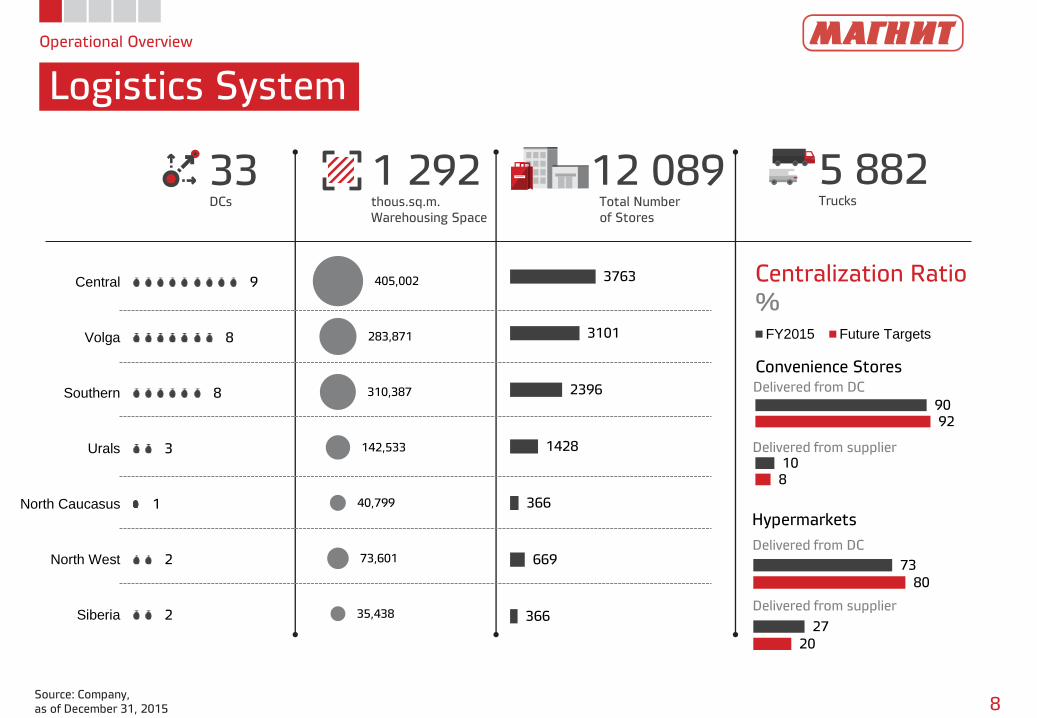
Operational Overview
Logistics System
8 Source: Company,
as of December 31, 2015
12 089 Total Number
of Stores
1 292 thous.sq.m.
Warehousing Space
33 DCs
5 882 Trucks
9
8
8
3
1
2
2
Central
Volga
Southern
Urals
North Caucasus
North West
Siberia
3763
3101
2396
1428
366
669
366
405,002
283,871
310,387
142,533
40,799
73,601
35,438
Centralization Ratio
%
90
10
92
8
Convenience Stores
FY2015 Future Targets
73
27
80
20
Hypermarkets
Delivered from DC
Delivered from supplier
Delivered from DC
Delivered from supplier
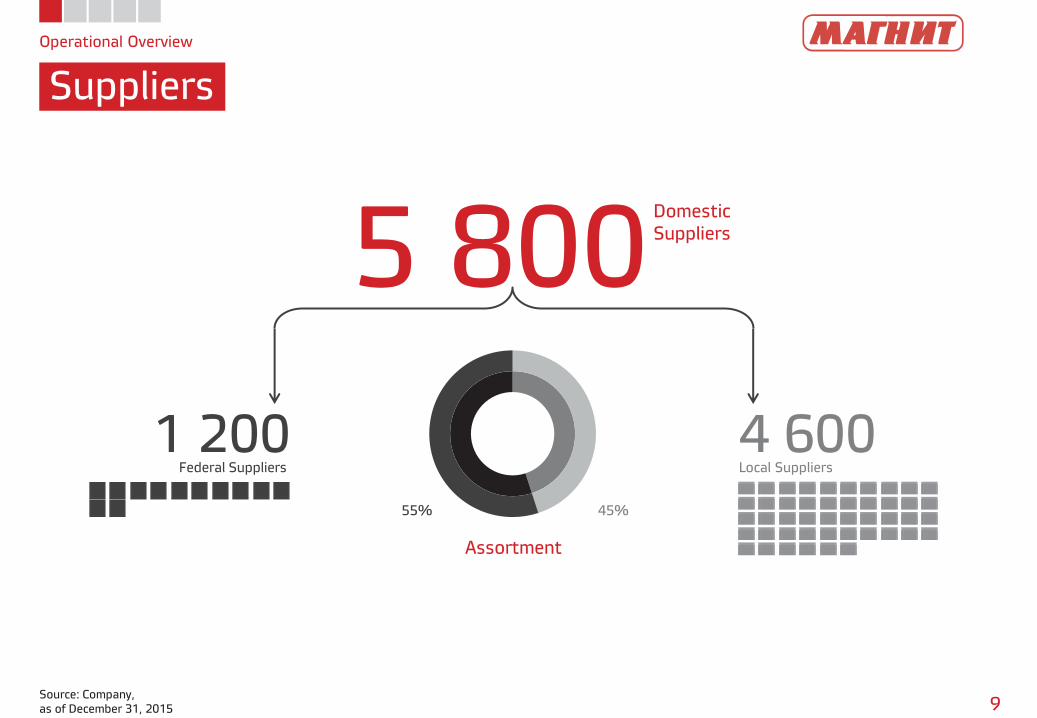
Operational Overview
Suppliers
9 Source: Company,
as of December 31, 2015
5 800 Domestic
Suppliers
4 600 Local Suppliers
1 200 Federal Suppliers
Assortment
55% 45%
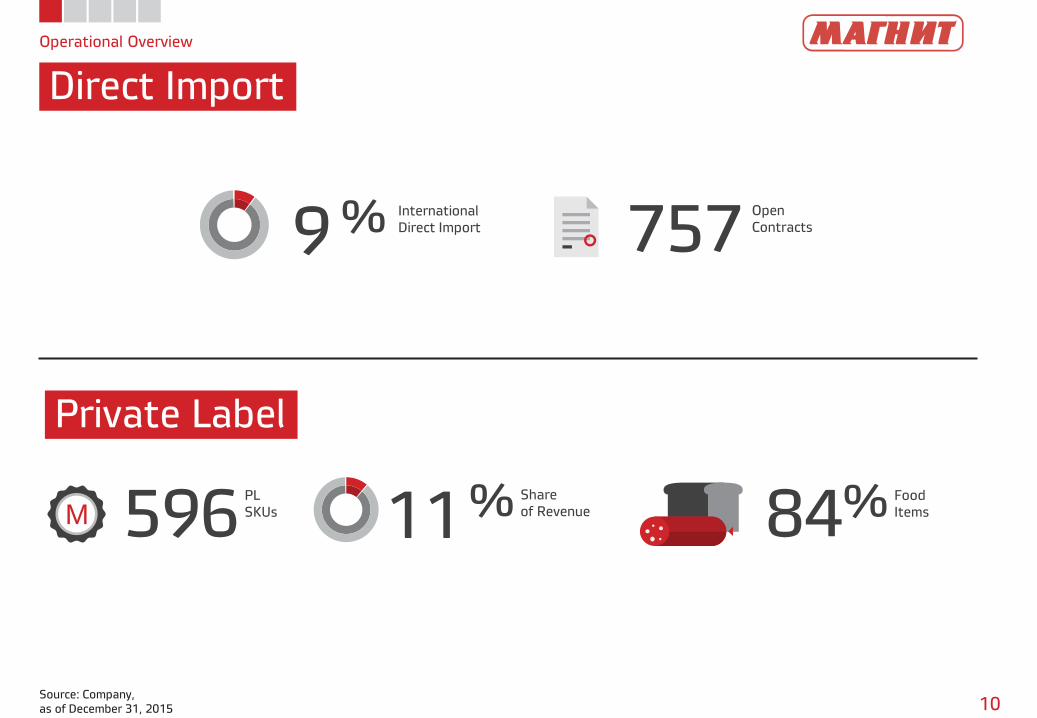
Operational Overview
Direct Import
10 Source: Company,
as of December 31, 2015
11 % Share
of Revenue 596 PL
SKUs M 84% Food
Items
Private Label
9 % International
Direct Import 757 Open
Contracts
Operational Overview
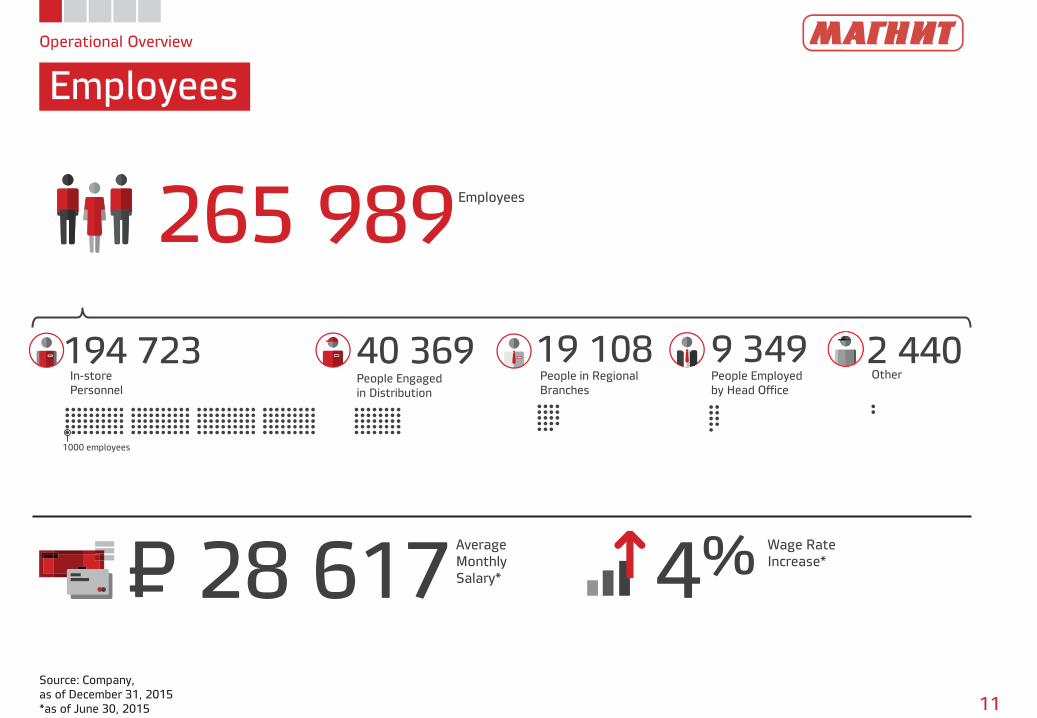
Employees
11
Source: Company,
as of December 31, 2015
*as of June 30, 2015
265 989 Employees
28 617 Average
Monthly
Salary* 4% Wage Rate
Increase* P =
194 723 In-store
Personnel
40 369 People Engaged
in Distribution
19 108 People in Regional
Branches
9 349 People Employed
by Head Office
1000 employees
2 440 Other
Operational Overview
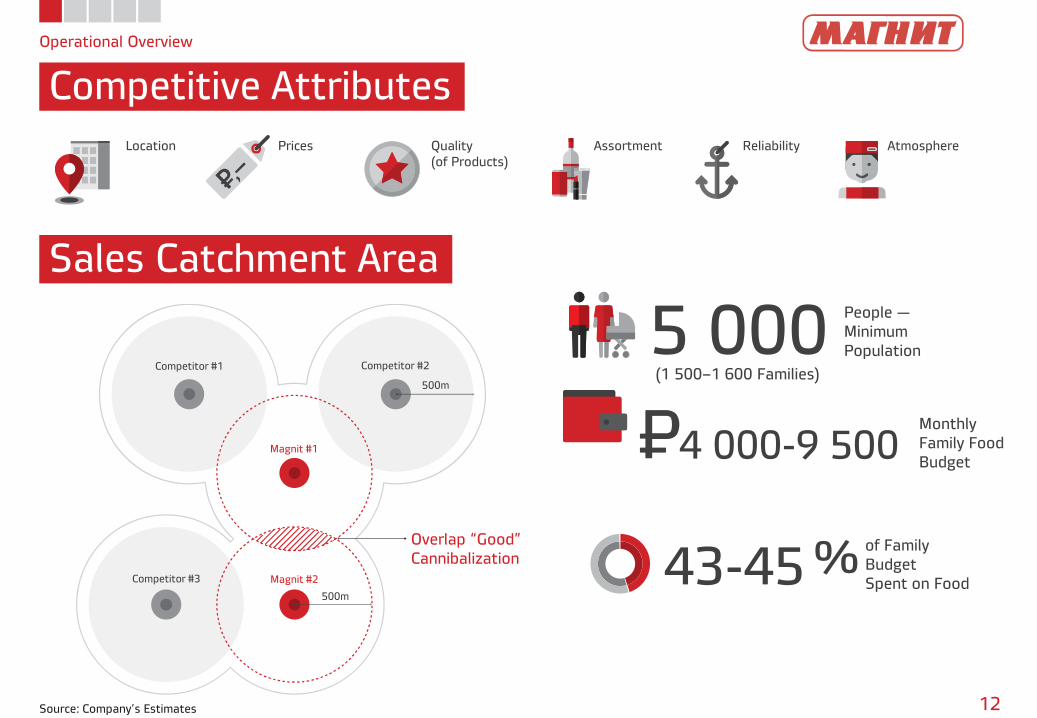
Competitive Attributes
12
43-45 % of Family
Budget
Spent on Food
Location Quality
(of Products)
Assortment Reliability Atmosphere Prices
5 000 People —
Minimum
Population
(1 500–1 600 Families)
4 000-9 500 Monthly
Family Food
Budget P =
Overlap “Good”
Cannibalization
Magnit #1
Magnit #2
500m
Competitor #1 Competitor #2
Competitor #3
500m
Sales Catchment Area
Source: Company’s Estimates
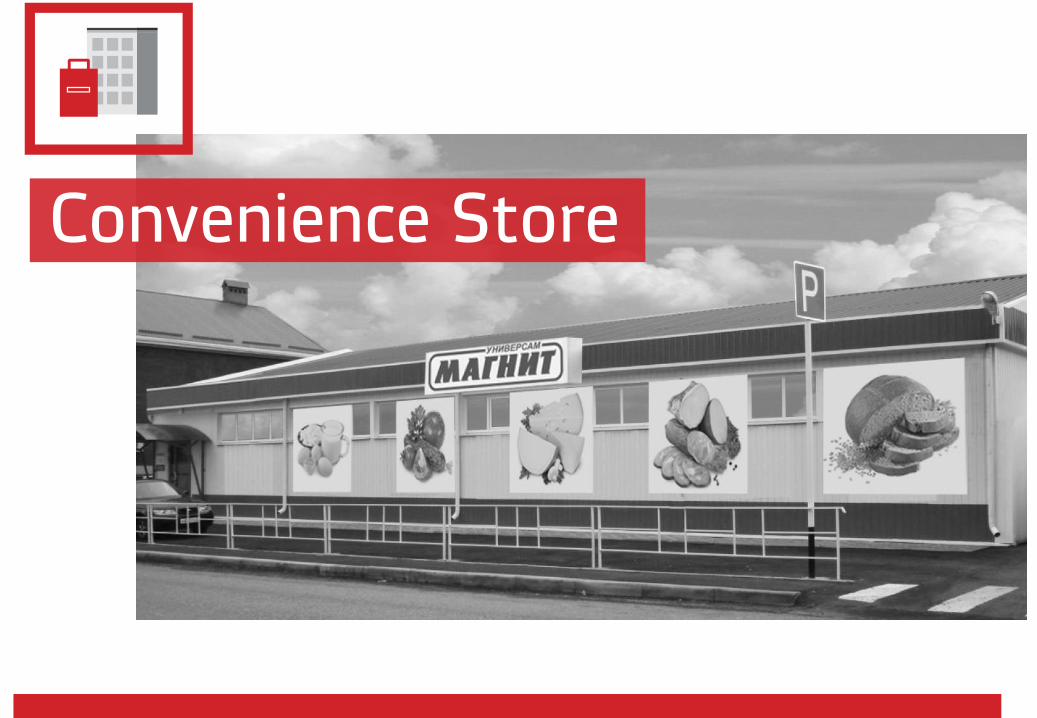
Convenience Store
Operational Overview
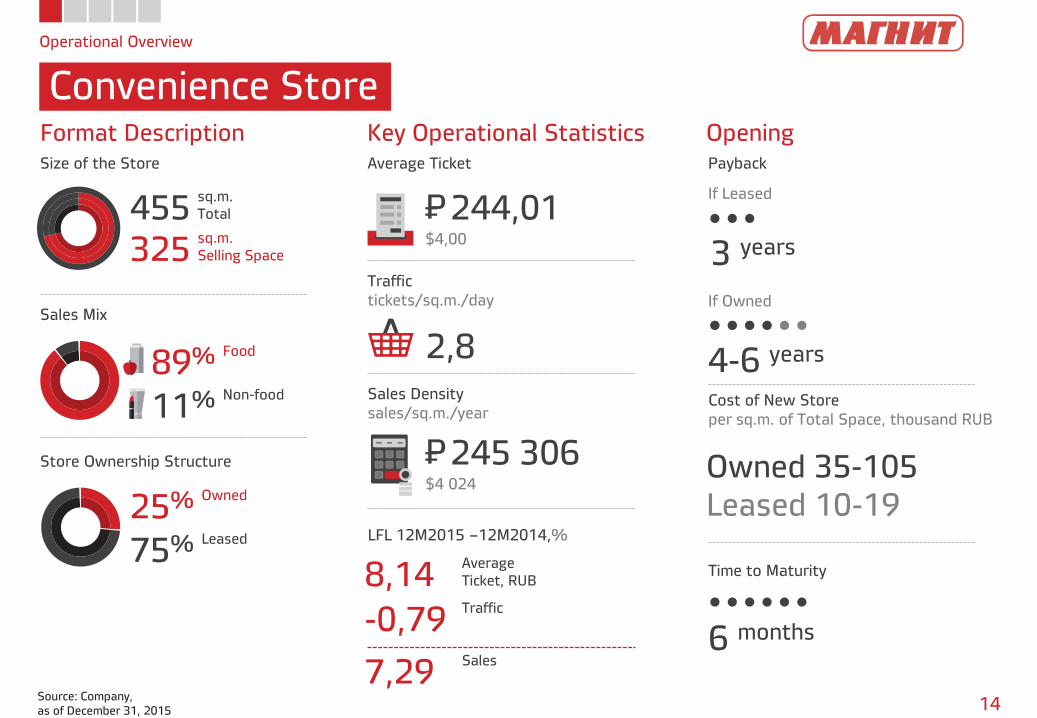
Convenience Store
14 Source: Company,
as of December 31, 2015
455 sq.m.
Total
325 sq.m.
Selling Space
89% Food
11% Non-food
25% Owned
75% Leased
Format Description Key Operational Statistics Opening
Size of the Store Average Ticket Payback
Store Ownership Structure
Sales Mix
Traffic
tickets/sq.m./day
Sales Density
sales/sq.m./year
LFL 12M2015 –12M2014,%
244,01 P = $4,00
245 306 P = $4 024
8,14 Average
Ticket, RUB
-0,79 Traffic
7,29 Sales
2,8
3 years
If Leased
If Owned
Cost of New Store
per sq.m. of Total Space, thousand RUB
Time to Maturity
6 months
4-6 years
Owned 35-105
Leased 10-19
Hypermarket
Operational Overview
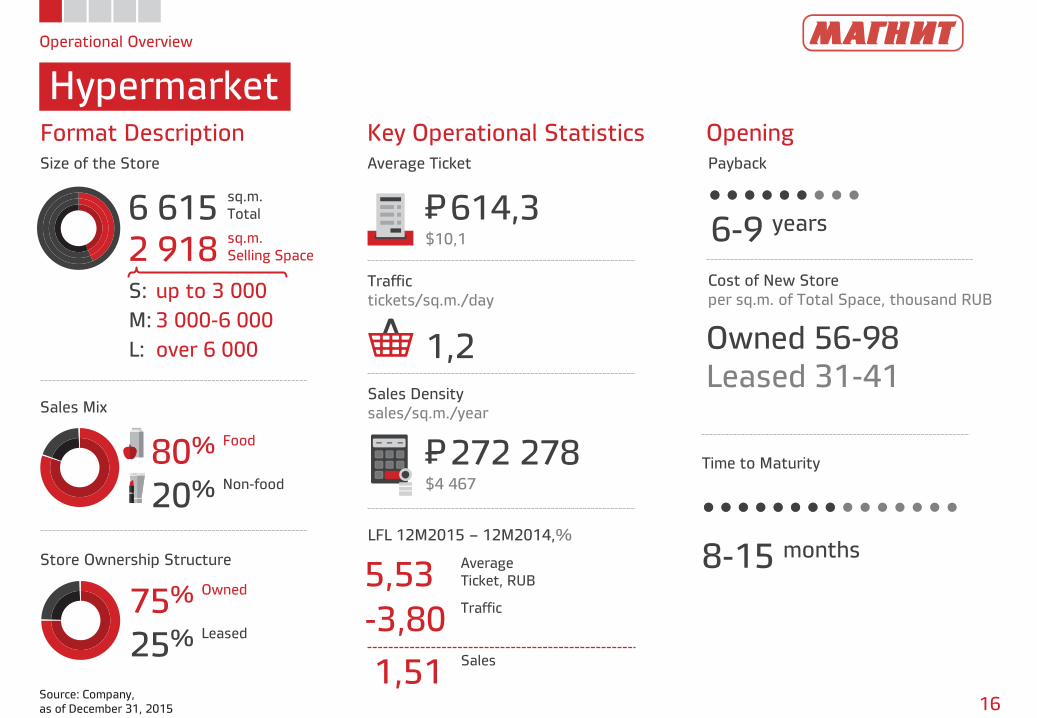
Hypermarket
16 Source: Company,
as of December 31, 2015
80% Food
20% Non-food
75% Owned
25% Leased
Format Description Key Operational Statistics
Size of the Store Average Ticket
Store Ownership Structure
Sales Mix
Traffic
tickets/sq.m./day
Sales Density
sales/sq.m./year
LFL 12M2015 – 12M2014,%
614,3 P = $10,1
272 278 P = $4 467
1,2
6 615 sq.m.
Total
2 918 sq.m.
Selling Space
5,53 Average
Ticket, RUB
-3,80 Traffic
1,51 Sales
Opening
Payback
6-9 years
Cost of New Store
per sq.m. of Total Space, thousand RUB
Owned 56-98
Leased 31-41
8-15 months
Time to Maturity
S: up to 3 000
M: 3 000-6 000
L: over 6 000
Magnit Family
Operational Overview
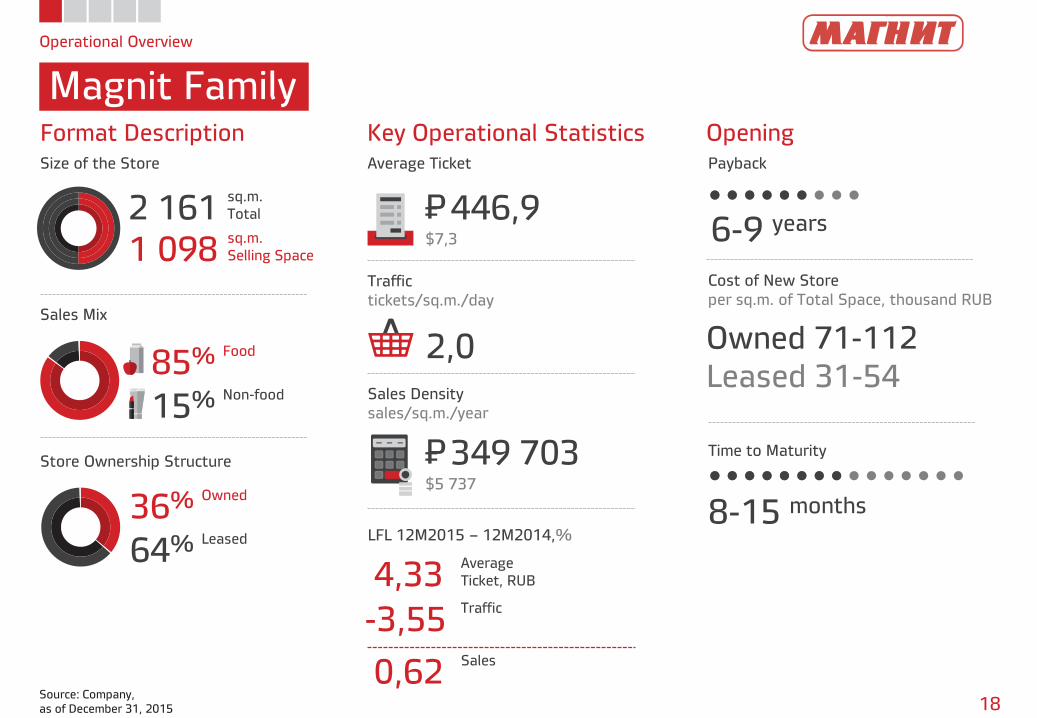
Magnit Family
18 Source: Company,
as of December 31, 2015
2 161 sq.m.
Total
1 098 sq.m.
Selling Space
85% Food
15% Non-food
36% Owned
64% Leased
Format Description Key Operational Statistics Opening
Size of the Store Average Ticket Payback
Store Ownership Structure
Sales Mix
Traffic
tickets/sq.m./day
Sales Density
sales/sq.m./year
LFL 12M2015 – 12M2014,%
446,9 P = $7,3
349 703 P = $5 737
2,0
6-9 years
Cost of New Store
per sq.m. of Total Space, thousand RUB
Owned 71-112
Leased 31-54
8-15 months
4,33 Average
Ticket, RUB
-3,55 Traffic
0,62 Sales
Time to Maturity
Drogerie Store
Operational Overview
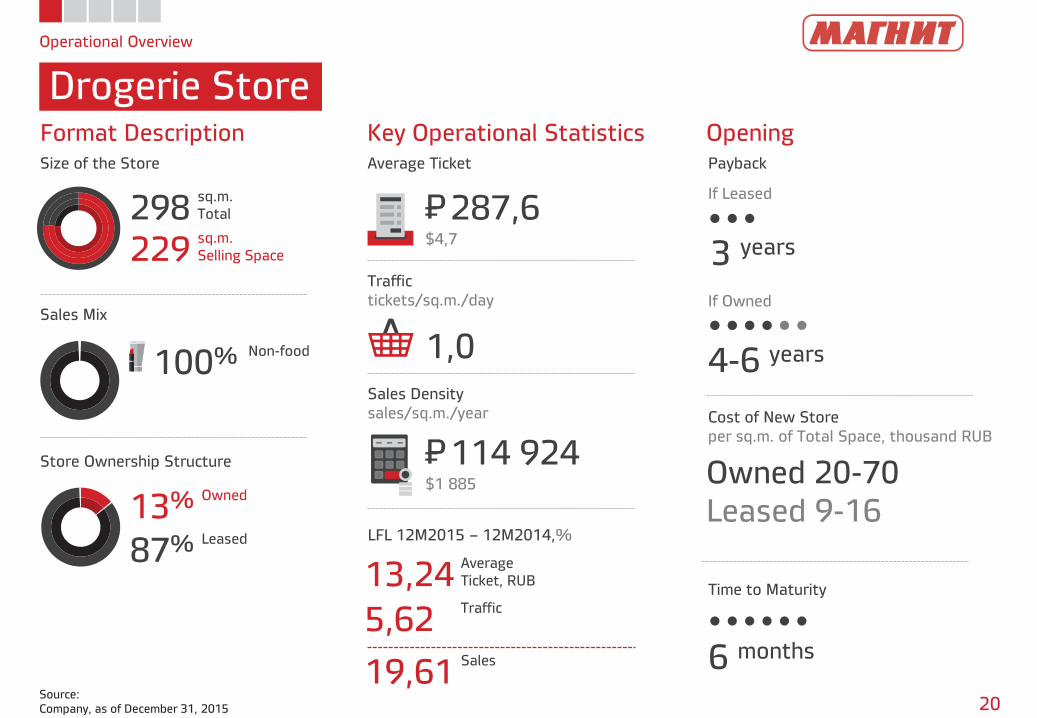
Drogerie Store
20 Source:
Company, as of December 31, 2015
298 sq.m.
Total
229 sq.m.
Selling Space
100% Non-food
13% Owned
87% Leased
Format Description Key Operational Statistics Opening
Size of the Store Average Ticket Payback
Store Ownership Structure
Sales Mix
Traffic
tickets/sq.m./day
Sales Density
sales/sq.m./year
LFL 12M2015 – 12M2014,%
287,6 P = $4,7
114 924 P = $1 885
13,24 Average
Ticket, RUB
5,62 Traffic
19,61 Sales
1,0
3 years
If Leased
If Owned
Cost of New Store
per sq.m. of Total Space, thousand RUB
Time to Maturity
6 months
Owned 20-70
Leased 9-16
4-6 years
80%
20%
Size
of the Store sq.m.
Average
Ticket
Traffic
Tickets/ sq.m./day
Density
Sales/ sq.m./year
Sales
Mix
LFL 12M2015-
12M2014 %
Store Owner-
ship Structure
Payback Years
Cost of New
Store per sq.m.
of Total Space
Time
to Maturity Months
• Total
• Selling Space
• Food
• Non-food
• Av.ticket
• Traffic/ Sales
• Owned
• Leased
13%
87%
36%
64%
75%
25%
25%
75%
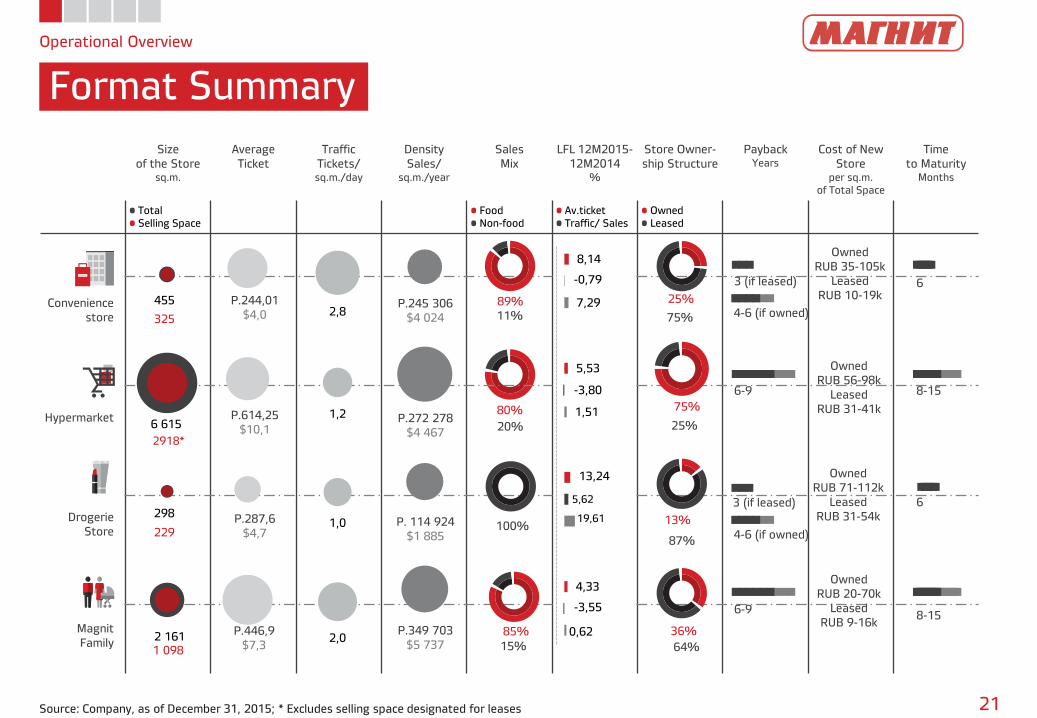
Operational Overview
Format Summary
21 Source: Company, as of December 31, 2015; * Excludes selling space designated for leases
Hypermarket
Drogerie
Store
Magnit
Family
455
6 615
298
2 161
325
2918*
229
1 098
Owned
RUB 35-105k
Leased
RUB 10-19k
2,8
1,2
1,0
2,0
P.244,01
$4,0
P.614,25
$10,1
P.287,6
$4,7
P.446,9
$7,3
P.245 306
$4 024
P.272 278
$4 467
P. 114 924
$1 885
P.349 703
$5 737
89%
11% Convenience
store
6
8-15
6
8-15
3 (if leased)
6-9
3 (if leased)
6-9
4-6 (if owned)
4-6 (if owned)
8,14
5,53
13,24
4,33
-0,79
-3,80
5,62
-3,55
7,29
1,51
19,61
0,62
Owned
RUB 56-98k
Leased
RUB 31-41k
Owned
RUB 71-112k
Leased
RUB 31-54k
Owned
RUB 20-70k
Leased
RUB 9-16k 85%
15%
100%
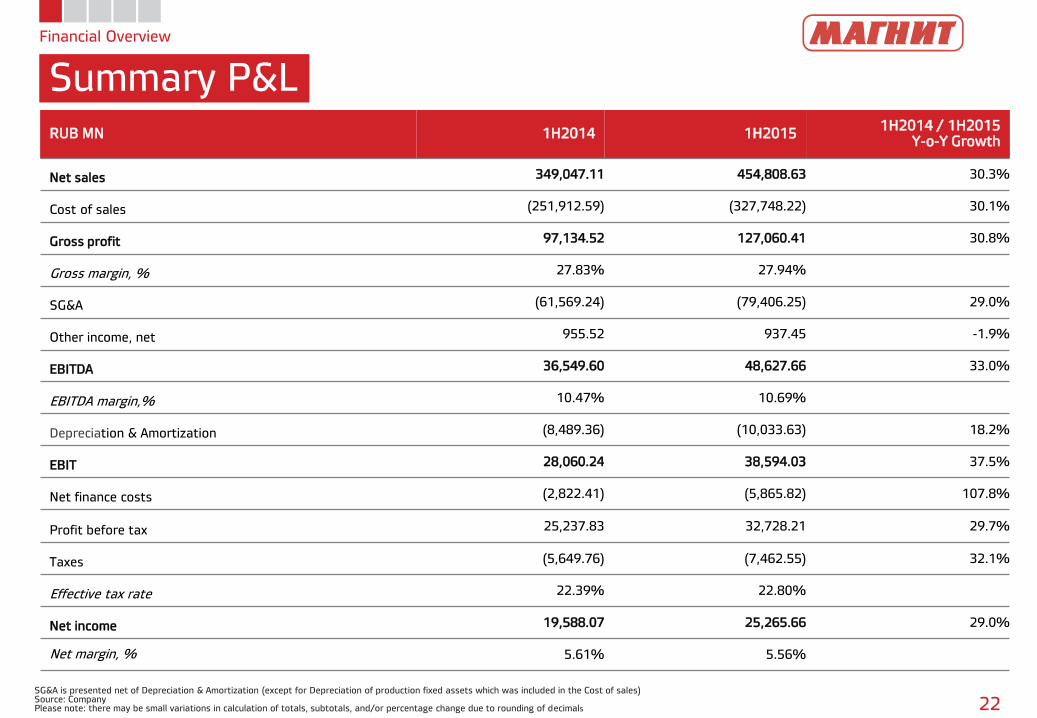
Financial Overview
Summary P&L
SG&A is presented net of Depreciation & Amortization (except for Depreciation of production fixed assets which was included in the Cost of sales) Source: Company Please note: there may be small variations in calculation of totals, subtotals, and/or percentage change due to rounding of decimals 22
RUB MN 1H2014 1H2015 1H2014 / 1H2015
Y-o-Y Growth
Net sales 349,047.11 454,808.63 30.3%
Cost of sales (251,912.59) (327,748.22) 30.1%
Gross profit 97,134.52 127,060.41 30.8%
Gross margin, % 27.83% 27.94%
SG&A (61,569.24) (79,406.25) 29.0%
Other income, net 955.52 937.45 -1.9%
EBITDA 36,549.60 48,627.66 33.0%
EBITDA margin,% 10.47% 10.69%
Depreciation & Amortization (8,489.36) (10,033.63) 18.2%
EBIT 28,060.24 38,594.03 37.5%
Net finance costs (2,822.41) (5,865.82) 107.8%
Profit before tax 25,237.83 32,728.21 29.7%
Taxes (5,649.76) (7,462.55) 32.1%
Effective tax rate 22.39% 22.80%
Net income 19,588.07 25,265.66 29.0%
Net margin, % 5.61% 5.56%
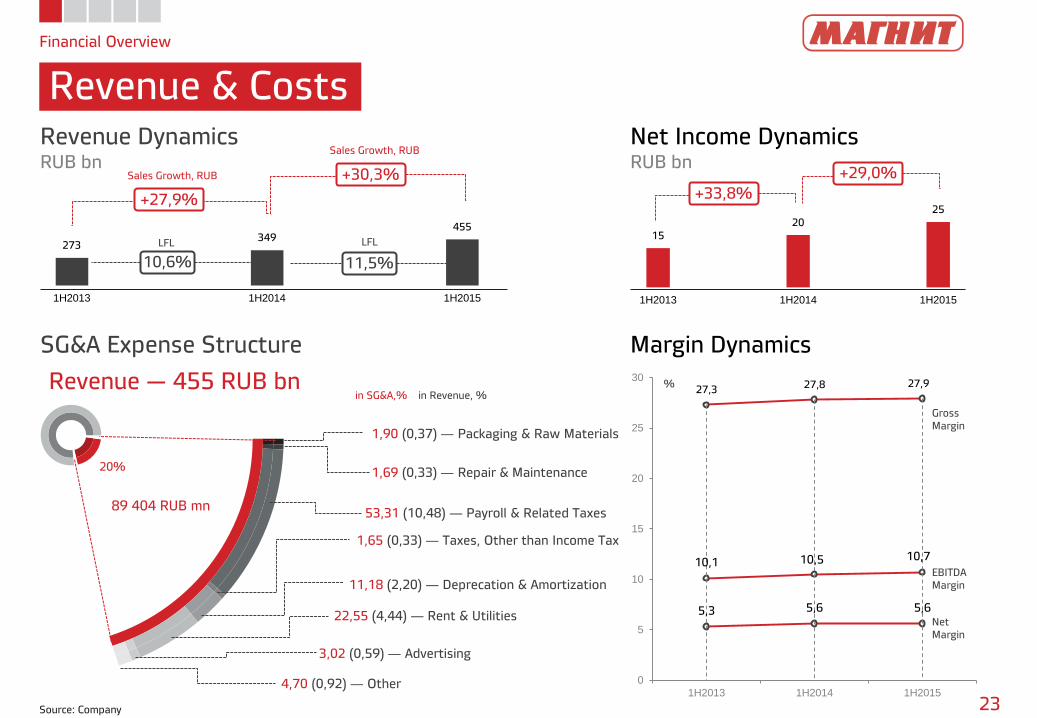
20%
89 404 RUB mn
15
20
25
1H2013 1H2014 1H2015
273 349
455
1H2013 1H2014 1H2015
Financial Overview
Revenue & Costs
23 Source: Company
27,3 27,8 27,9
10,1 10,5 10,7
5,3 5,6 5,6
0
5
10
15
20
25
30
1H2013 1H2014 1H2015
Revenue Dynamics RUB bn
Net Income Dynamics RUB bn
Margin Dynamics SG&A Expense Structure
Revenue — 455 RUB bn
Gross
Margin
EBITDA
Margin
Net
Margin
%
+27,9%
10,6% 11,5%
+30,3%
+33,8%
+29,0%
LFL LFL
Sales Growth, RUB
Sales Growth, RUB
1,90 (0,37) ― Packaging & Raw Materials
1,69 (0,33) ― Repair & Maintenance
53,31 (10,48) ― Payroll & Related Taxes
1,65 (0,33) ― Taxes, Other than Income Tax
11,18 (2,20) ― Deprecation & Amortization
22,55 (4,44) ― Rent & Utilities
4,70 (0,92) ― Other
in SG&A,% in Revenue, %
3,02 (0,59) ― Advertising
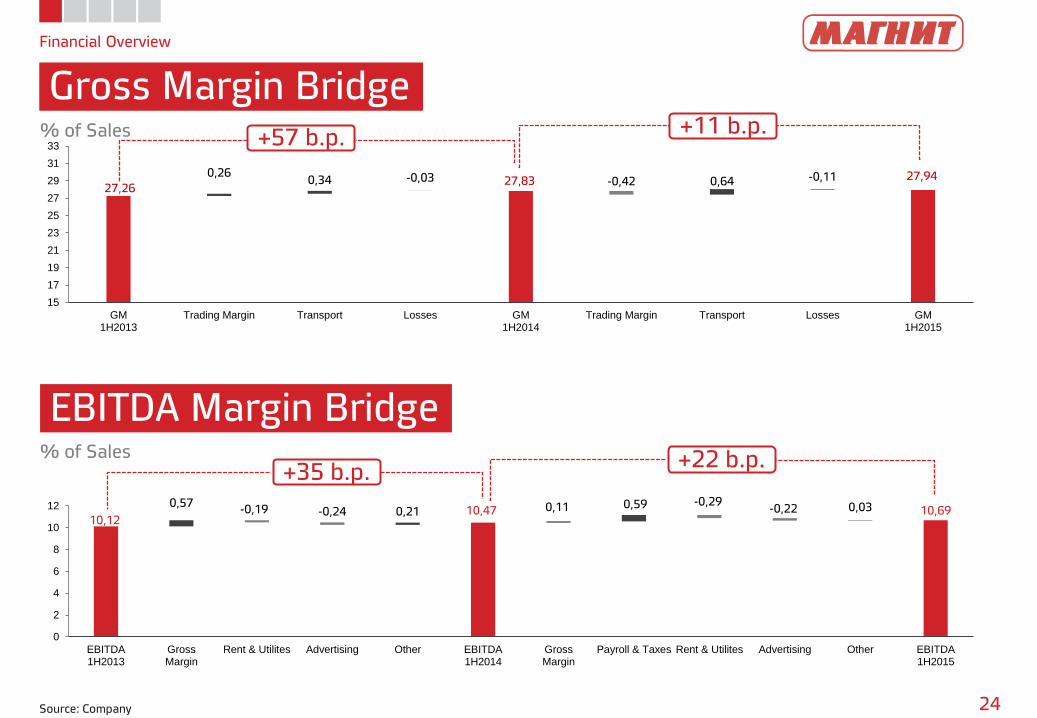
27,26 27,83 27,94 -0,03 -0,42 -0,11 0,26
0,34 0,64
15
17
19
21
23
25
27
29
31
33
GM1H2013
Trading Margin Transport Losses GM1H2014
Trading Margin Transport Losses GM1H2015
Financial Overview
Gross Margin Bridge
24 Source: Company
EBITDA Margin Bridge
% of Sales
% of Sales
+57 b.p. +11 b.p.
+35 b.p. +22 b.p.
10,12 10,47 10,69 -0,19 -0,24
-0,29 -0,22
0,57 0,21 0,11 0,59 0,03
0
2
4
6
8
10
12
EBITDA1H2013
GrossMargin
Rent & Utilites Advertising Other EBITDA1H2014
GrossMargin
Payroll & Taxes Rent & Utilites Advertising Other EBITDA1H2015
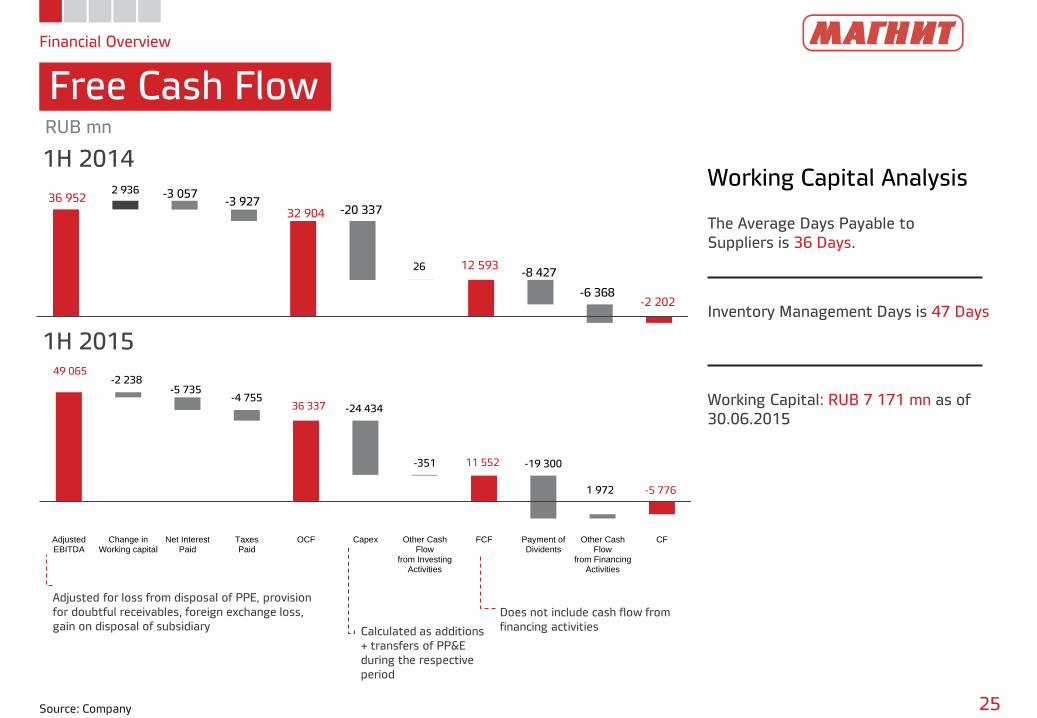
36 952
32 904
12 593
-2 202
-3 057 -3 927
-20 337
-8 427
-6 368
2 936
26
Financial Overview
Free Cash Flow
25 Source: Company
Working Capital Analysis
The Average Days Payable to
Suppliers is 36 Days.
Inventory Management Days is 47 Days
Working Capital: RUB 7 171 mn as of
30.06.2015
RUB mn
1H 2014
1H 2015
Adjusted for loss from disposal of PPE, provision
for doubtful receivables, foreign exchange loss,
gain on disposal of subsidiary Calculated as additions
+ transfers of PP&E
during the respective
period
Does not include cash flow from
financing activities
49 065
36 337
11 552
-5 776
-2 238 -5 735
-4 755 -24 434
-351 -19 300
1 972
AdjustedEBITDA
Change inWorking capital
Net InterestPaid
TaxesPaid
OCF Capex Other CashFlow
from InvestingActivities
FCF Payment ofDividents
Other CashFlow
from FinancingActivities
CF
Financial Overview
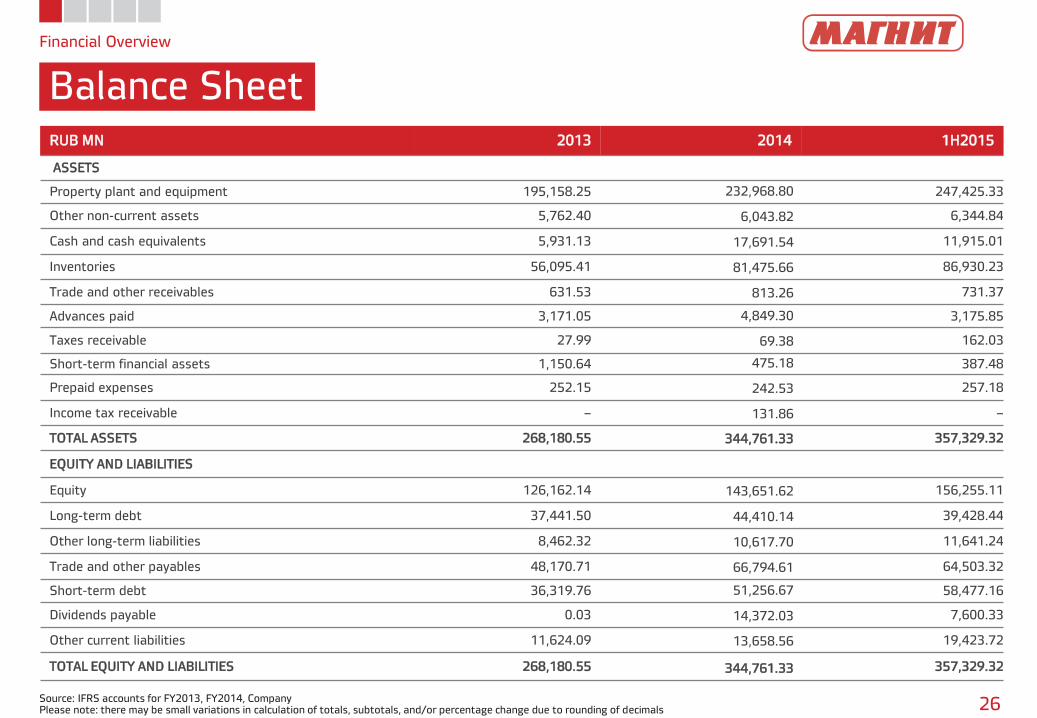
Balance Sheet
Source: IFRS accounts for FY2013, FY2014, Company Please note: there may be small variations in calculation of totals, subtotals, and/or percentage change due to rounding of decimals 26
RUB MN 2013 2014 1H2015
ASSETS
Property plant and equipment 195,158.25 232,968.80 247,425.33
Other non-current assets 5,762.40 6,043.82 6,344.84
Cash and cash equivalents 5,931.13 17,691.54 11,915.01
Inventories 56,095.41 81,475.66 86,930.23
Trade and other receivables 631.53 813.26 731.37
Advances paid 3,171.05 4,849.30 3,175.85
Taxes receivable 27.99 69.38 162.03
Short-term financial assets 1,150.64 475.18 387.48
Prepaid expenses 252.15 242.53 257.18
Income tax receivable – 131.86 –
TOTAL ASSETS 268,180.55 344,761.33 357,329.32
EQUITY AND LIABILITIES
Equity 126,162.14 143,651.62 156,255.11
Long-term debt 37,441.50 44,410.14 39,428.44
Other long-term liabilities 8,462.32 10,617.70 11,641.24
Trade and other payables 48,170.71 66,794.61 64,503.32
Short-term debt 36,319.76 51,256.67 58,477.16
Dividends payable 0.03 14,372.03 7,600.33
Other current liabilities 11,624.09 13,658.56 19,423.72
TOTAL EQUITY AND LIABILITIES 268,180.55 344,761.33 357,329.32
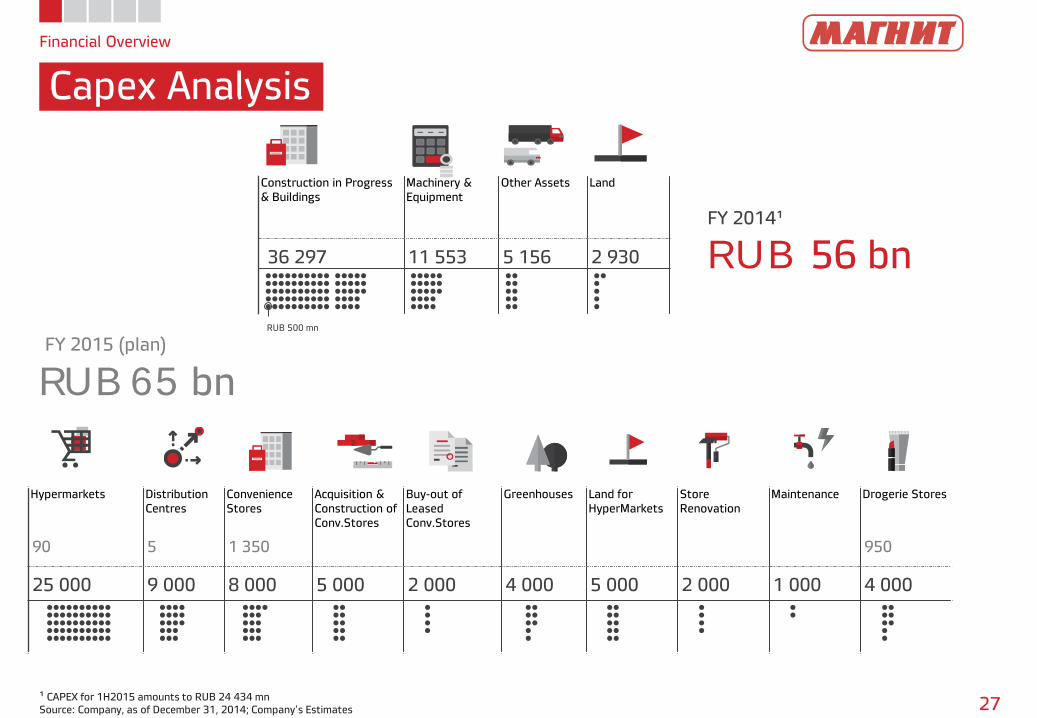
Financial Overview
Capex Analysis
27 ¹ CAPEX for 1H2015 amounts to RUB 24 434 mn
Source: Company, as of December 31, 2014; Company’s Estimates
Construction in Progress
& Buildings
Machinery &
Equipment
Other Assets Land
36 297 11 553 5 156 2 930
FY 2014¹
RUB 56 bn
FY 2015 (plan)
RUB 65 bn
RUB 500 mn
Hypermarkets Distribution
Centres
Convenience
Stores
Acquisition &
Construction of
Conv.Stores
Buy-out of
Leased
Conv.Stores
Greenhouses Land for
HyperMarkets
Store
Renovation
Maintenance Drogerie Stores
90 5 1 350 950
25 000 9 000 8 000 5 000 2 000 4 000 5 000 2 000 1 000 4 000
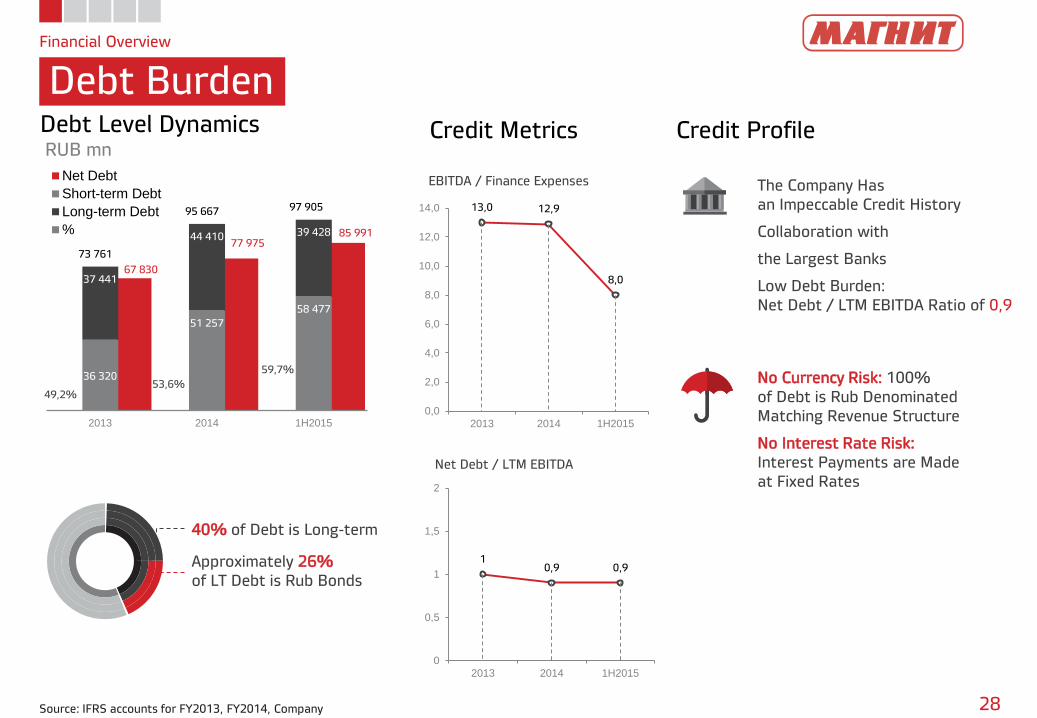
73 761
95 667 97 905
67 830
77 975 85 991
36 320
51 257
58 477
37 441
44 410 39 428
2013 2014 1H2015
Net Debt
Short-term Debt
Long-term Debt
%
Financial Overview
Debt Burden
28 Source: IFRS accounts for FY2013, FY2014, Company
13,0 12,9
8,0
0,0
2,0
4,0
6,0
8,0
10,0
12,0
14,0
2013 2014 1H2015
1 0,9 0,9
0
0,5
1
1,5
2
2013 2014 1H2015
Debt Level Dynamics RUB mn
Credit Metrics Credit Profile
EBITDA / Finance Expenses
Net Debt / LTM EBITDA
The Company Has
an Impeccable Credit History
Collaboration with
the Largest Banks
Low Debt Burden:
Net Debt / LTM EBITDA Ratio of 0,9
No Currency Risk: 100%
of Debt is Rub Denominated
Matching Revenue Structure
No Interest Rate Risk:
Interest Payments are Made
at Fixed Rates
49,2% 53,6%
59,7%
40% of Debt is Long-term
Approximately 26%
of LT Debt is Rub Bonds
Contact Information
Contact Information
29
Timothy Post
Head of Investor Relations
+7 (961) 511-7678
http://ir.magnit.com
15/2 Solnechnaya Street
Krasnodar, 350072
Russian Federation