Embed Size (px)
Citation preview
MAR2015BUILDING VALUE
ACROSS THE CYCLETSX // MND
This presentation contains "forward-looking statements" within the meaning of applicable securities laws, including statements relating to life ofmine production plans, exploration plans and the growth and strategy of Mandalay. Actual results and developments may differ materially fromthose contemplated by these statements depending on, among other things: exploration results or production results not meeting management’sexpectations; capital, production and operating cost results not meeting current plans; and changes in commodity prices and general market andeconomic conditions. The factors identified above are not intended to represent a complete list of the factors that could affect Mandalay. Adescription of additional risks that could result in actual results and developments differing from those contemplated by forward lookingstatements in this news release can be found under the heading “Risk Factors” in Mandalay’s annual information form dated March 28, 2014 andin its final prospectus dated September 2, 2014, copies of which are available under Mandalay's profile at www.sedar.com. Although Mandalayhas attempted to identify important factors that could cause actual actions, events or results to differ materially from those described in forward-looking statements, there may be other factors that cause actions, events or results not to be as anticipated, estimated or intended. There can beno assurance that forward-looking statements will prove to be accurate, as actual results and future events could differ materially from thoseanticipated in such statements. Accordingly, readers should not place undue reliance on forward-looking statements.
Quality Control and AssuranceQuality control and assurance programs are implemented in line with the standards of National Instrument 43-101.
The exploration program at Costerfield is supervised by Chris Gregory (Member, Australian Institute of Geoscientists accredited CharteredProfessional (Mining)), General Manager of Australasian Business Development for Mandalay and a Qualified Person as defined under NationalInstrument 43-101. Mr. Gregory regularly visits Costerfield, supervises the collection and interpretation of scientific and technical informationcontained in this presentation.
The exploration programs on the Cerro Bayo projectis supervised by Ronald Luethe (Member: American Institute of Professional Geologists andan Idaho Registered Professional Geologist), General Manager of Mandalay Chile Ltda. and a Qualified Person as defined under NationalInstrument 43-101. Mr. Luethe visits the Cerro Bayo project often, supervises the collection and interpretation of scientific and technicalinformation contained in this presentation.
Dr. Mark Sander (Member: AusIMM), President of Mandalay, has visited the Costerfield, Cerro Bayo, Challacollo, and Björkdal and hassupervised the preparation of this presentation.
All currency references in US$ unless otherwise indicated
Forward-looking Statements
2
15,854 63,351 107,941 126,908
253,796
520,175 633,000
771,500
1,123,367
0
200,000
400,000
600,000
800,000
1,000,000
1,200,000
0
50,000
100,000
150,000
200,000
250,000
300,000
2010 2011 2012 2013 2014 2015
Oz
Au E
q. Y
ear-
End
Rese
rves
Oz
Au E
q. A
nnua
l Pr
oduc
tion
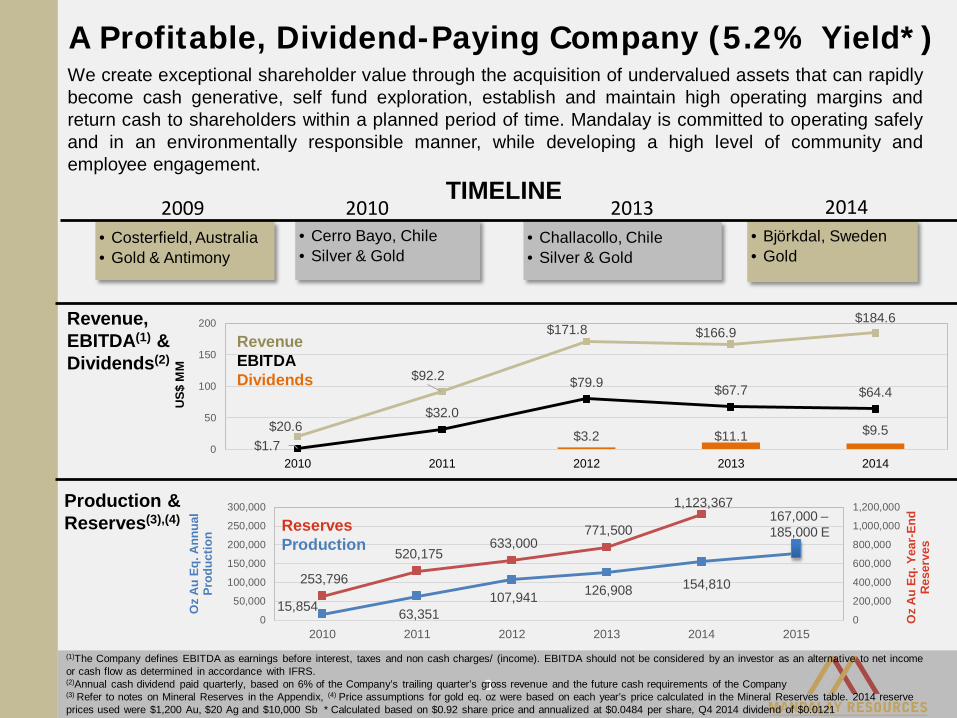
2009• Costerfield, Australia• Gold & Antimony
2010• Cerro Bayo, Chile• Silver & Gold
2013• Challacollo, Chile• Silver & Gold
2014• Björkdal, Sweden• Gold
$3.2 $11.1 $9.5$20.6
$92.2
$171.8 $166.9$184.6
$1.7
$32.0
$79.9 $67.7 $64.4
0
50
100
150
200
2010 2011 2012 2013 2014
US$
MM
A Profitable, Dividend-Paying Company (5.2% Yield*)
3
We create exceptional shareholder value through the acquisition of undervalued assets that can rapidlybecome cash generative, self fund exploration, establish and maintain high operating margins andreturn cash to shareholders within a planned period of time. Mandalay is committed to operating safelyand in an environmentally responsible manner, while developing a high level of community andemployee engagement.
(1)The Company defines EBITDA as earnings before interest, taxes and non cash charges/ (income). EBITDA should not be considered by an investor as an alternative to net incomeor cash flow as determined in accordance with IFRS.(2)Annual cash dividend paid quarterly, based on 6% of the Company’s trailing quarter’s gross revenue and the future cash requirements of the Company(3) Refer to notes on Mineral Reserves in the Appendix, (4) Price assumptions for gold eq. oz were based on each year’s price calculated in the Mineral Reserves table. 2014 reserve prices used were $1,200 Au, $20 Ag and $10,000 Sb * Calculated based on $0.92 share price and annualized at $0.0484 per share, Q4 2014 dividend of $0.0121
TIMELINE
Production &Reserves(3),(4)
Revenue,EBITDA(1) & Dividends(2)
RevenueEBITDADividends
ReservesProduction
154,810
167,000 –185,000 E
50%
100%
150%
200%
250%
300%
Q3
2009
Q4
2009
Q1
2010
Q2
2010
Q3
2010
Q4
2010
Q1
2011
Q2
2011
Q3
2011
Q4
2011
Q1
2012
Q2
2012
Q3
2012
Q4
2012
Q1
2013
Q2
2013
Q3
2013
Q4
2013
Q1
2014
Q2
2014
Q3
2014
Q4
2014Cu
mul
ativ
e %
Val
ue C
hang
e S
ince
Q3
2009
Mandalay Cumulative Returns 16.5% Annual Compounded Rate of Return Gold Silver
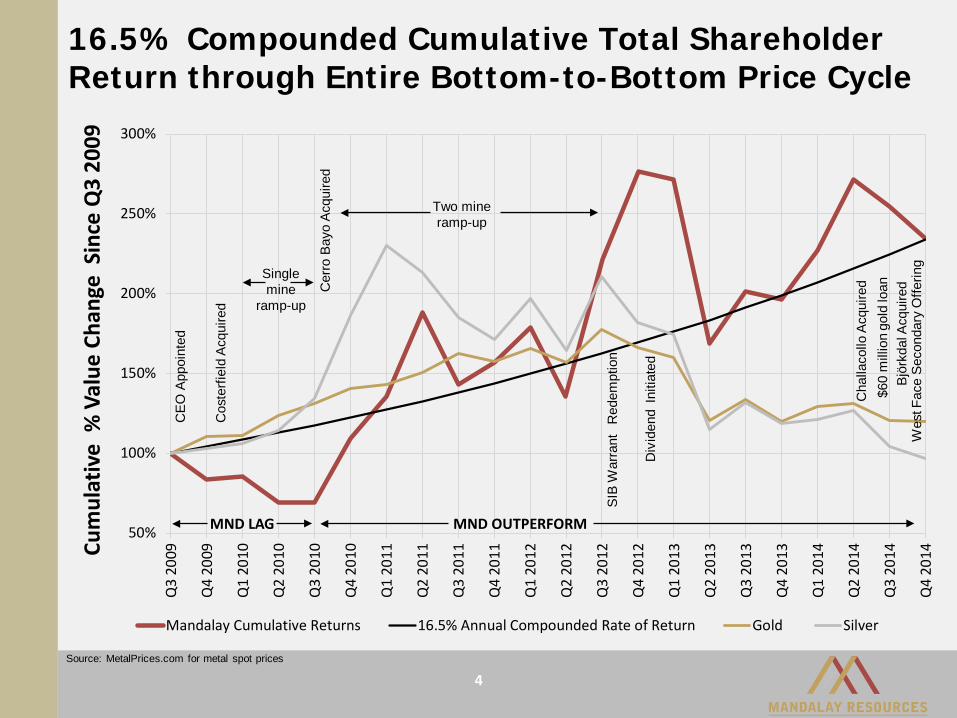
16.5% Compounded Cumulative Total Shareholder Return through Entire Bottom-to-Bottom Price Cycle
MND LAG MND OUTPERFORM
CEO
App
oint
ed
Cos
terfi
eld
Acqu
ired
Single mine
ramp-upC
erro
Bay
oAc
quire
d
Two mineramp-up
SIB
War
rant
R
edem
ptio
n
Div
iden
dIn
itiat
ed
Cha
llaco
llo A
cqui
red
$60
mill
ion
gold
loan
Björ
kdal
Acq
uire
dW
est F
ace
Seco
ndar
y O
fferin
g
Source: MetalPrices.com for metal spot prices
4
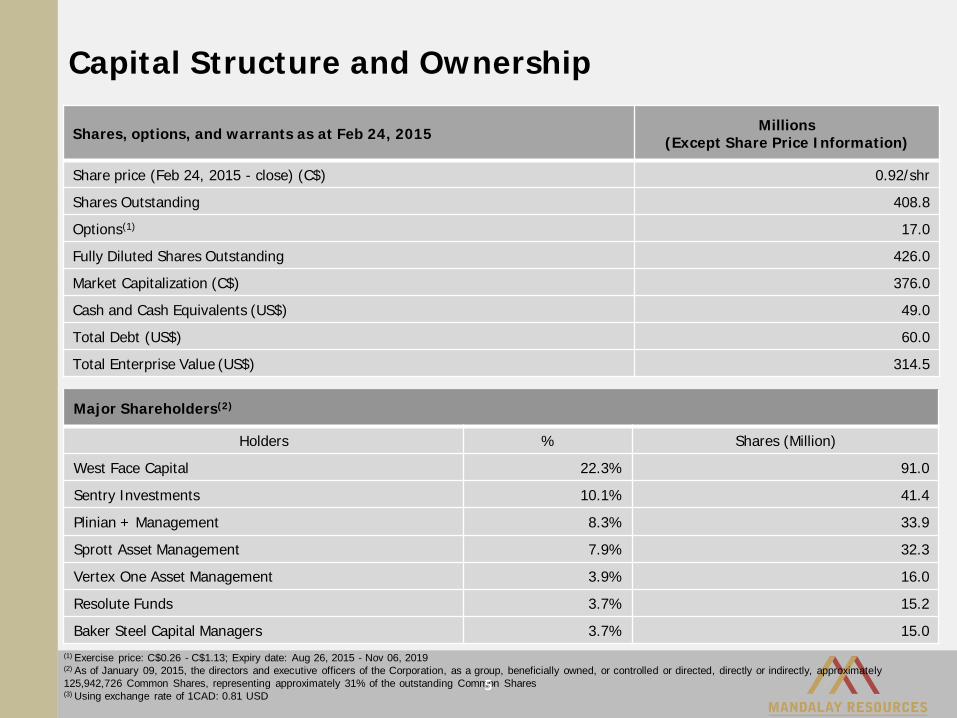
(1) Exercise price: C$0.26 - C$1.13; Expiry date: Aug 26, 2015 - Nov 06, 2019(2) As of January 09, 2015, the directors and executive officers of the Corporation, as a group, beneficially owned, or controlled or directed, directly or indirectly, approximately 125,942,726 Common Shares, representing approximately 31% of the outstanding Common Shares(3) Using exchange rate of 1CAD: 0.81 USD
Capital Structure and Ownership
5
Major Shareholders(2)
Holders % Shares (Million)
West Face Capital 22.3% 91.0
Sentry Investments 10.1% 41.4
Plinian + Management 8.3% 33.9
Sprott Asset Management 7.9% 32.3
Vertex One Asset Management 3.9% 16.0
Resolute Funds 3.7% 15.2
Baker Steel Capital Managers 3.7% 15.0
Shares, options, and warrants as at Feb 24, 2015 Millions (Except Share Price Information)
Share price (Feb 24, 2015 - close) (C$) 0.92/shr
Shares Outstanding 408.8
Options(1) 17.0
Fully Diluted Shares Outstanding 426.0
Market Capitalization (C$) 376.0
Cash and Cash Equivalents (US$) 49.0
Total Debt (US$) 60.0
Total Enterprise Value (US$) 314.5
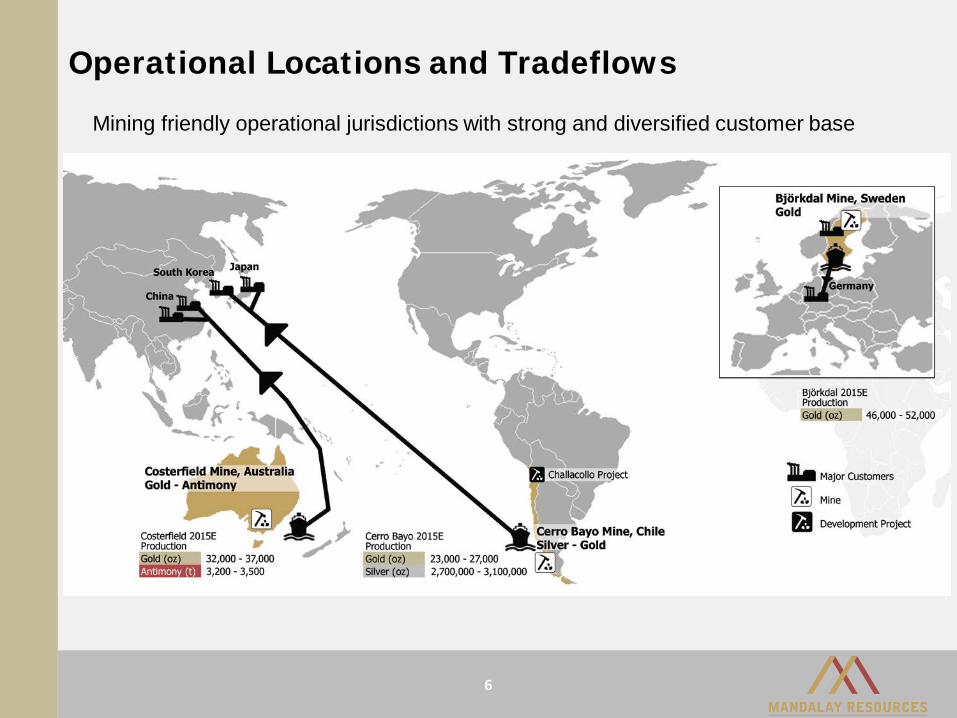
Operational Locations and Tradeflows
6
Mining friendly operational jurisdictions with strong and diversified customer base
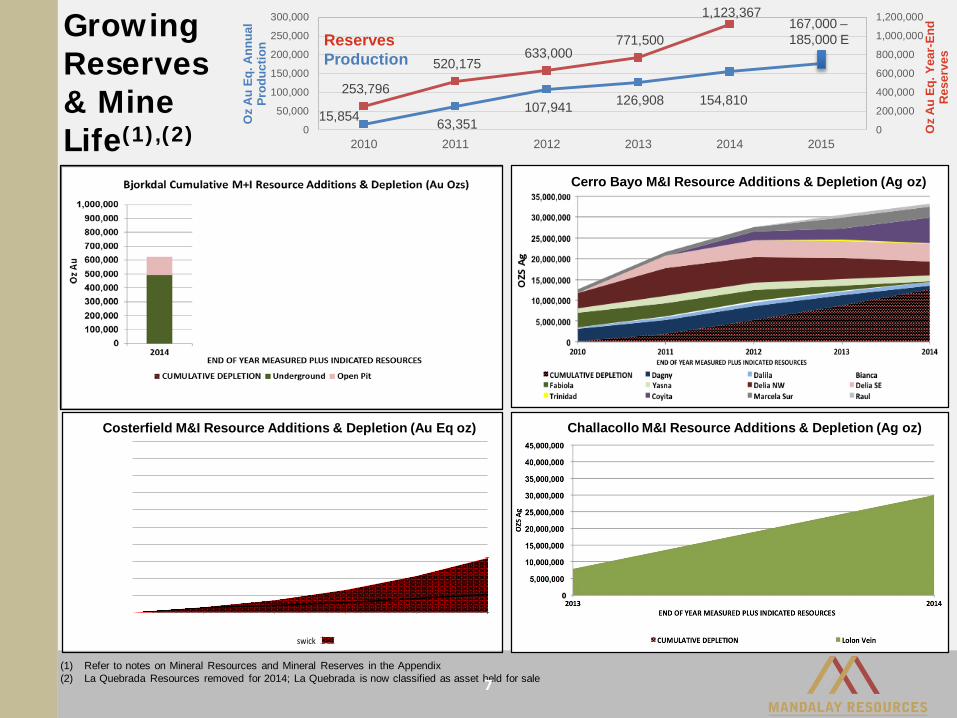
(1) Refer to notes on Mineral Resources and Mineral Reserves in the Appendix(2) La Quebrada Resources removed for 2014; La Quebrada is now classified as asset held for sale7
15,854 63,351 107,941 126,908
253,796
520,175 633,000
771,500
1,123,367
0
200,000
400,000
600,000
800,000
1,000,000
1,200,000
0
50,000
100,000
150,000
200,000
250,000
300,000
2010 2011 2012 2013 2014 2015
Oz
Au E
q. Y
ear-
End
Rese
rves
Oz
Au E
q. A
nnua
l Pr
oduc
tion
7
ReservesProduction
154,810
167,000 –185,000 EGrowing
Reserves & Mine Life(1),(2)
Costerfield M&I Resource Additions & Depletion (Au Eq oz)
Bjorkdal M&I Resource Additions & Depletion (Au oz) Cerro Bayo M&I Resource Additions & Depletion (Ag oz)
Challacollo M&I Resource Additions & Depletion (Ag oz)
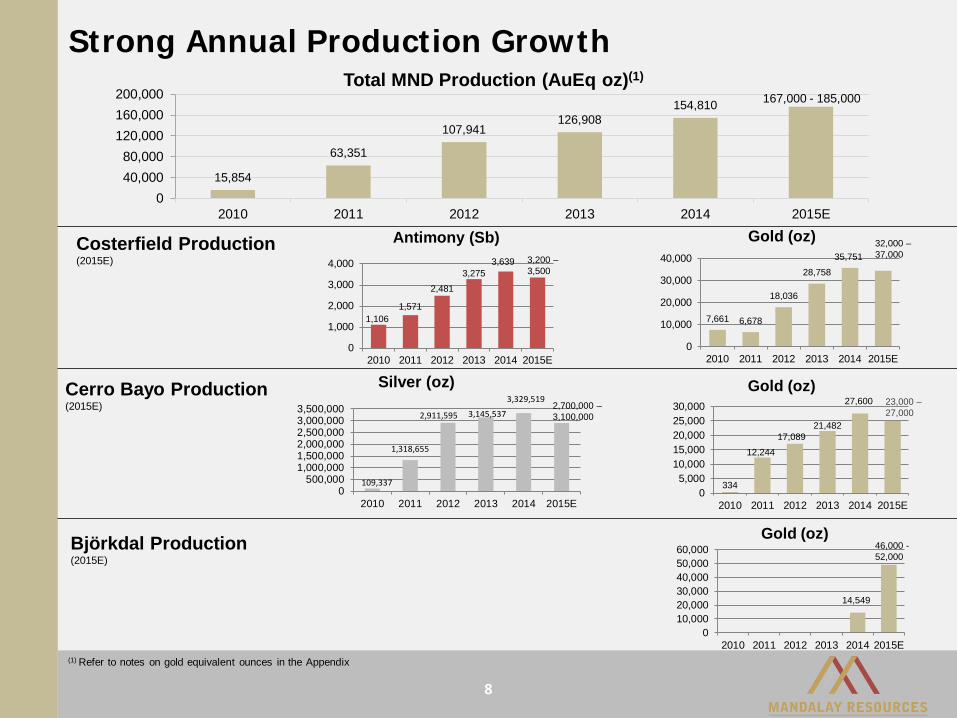
Strong Annual Production Growth
8
109,337
1,318,655
2,911,595 3,145,537
3,329,519
0500,000
1,000,0001,500,0002,000,0002,500,0003,000,0003,500,000
2010 2011 2012 2013 2014 2015E
Silver (oz)
334
12,24417,089
21,482
27,600
05,000
10,00015,00020,00025,00030,000
2010 2011 2012 2013 2014 2015E
Gold (oz)
7,661 6,678
18,036
28,75835,751
0
10,000
20,000
30,000
40,000
2010 2011 2012 2013 2014 2015E
Gold (oz)Costerfield Production(2015E)
Cerro Bayo Production(2015E)
1,1061,571
2,4813,275
3,639
0
1,000
2,000
3,000
4,000
2010 2011 2012 2013 2014 2015E
Antimony (Sb)
Björkdal Production(2015E)
14,549
010,00020,00030,00040,00050,00060,000
2010 2011 2012 2013 2014 2015E
Gold (oz)
15,854
63,351
107,941126,908
154,810
040,00080,000
120,000160,000200,000
2010 2011 2012 2013 2014 2015E
Total MND Production (AuEq oz)(1)
(1) Refer to notes on gold equivalent ounces in the Appendix
167,000 - 185,000
32,000 –37,000
23,000 –27,000
46,000 -52,000
3,200 –3,500
2,700,000 –3,100,000
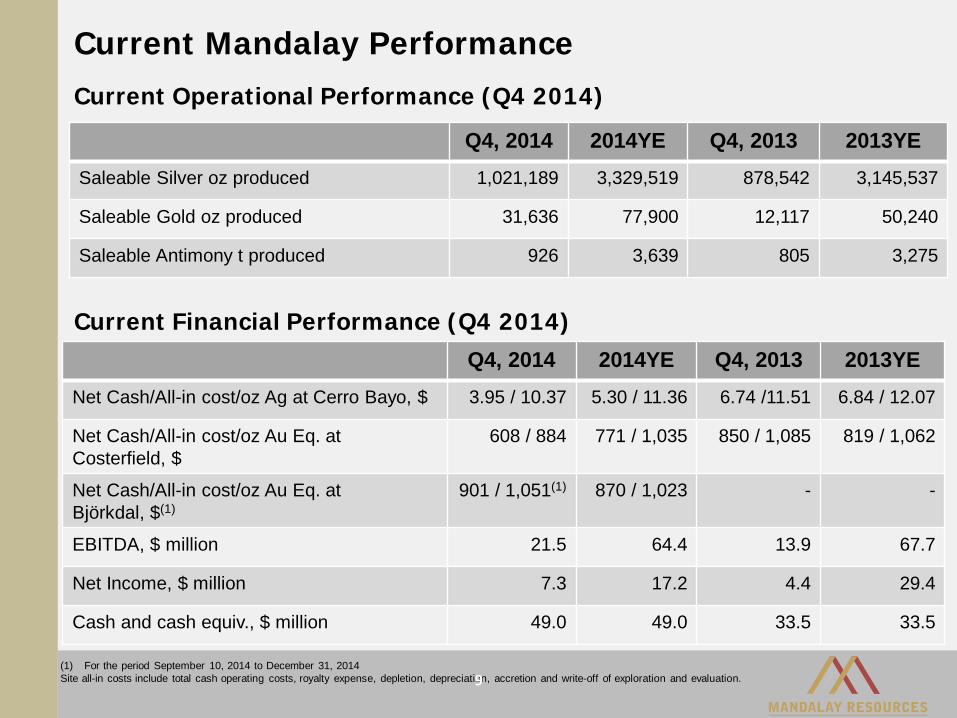
Current Financial Performance (Q4 2014)
Current Operational Performance (Q4 2014)Q4, 2014 2014YE Q4, 2013 2013YE
Saleable Silver oz produced 1,021,189 3,329,519 878,542 3,145,537
Saleable Gold oz produced 31,636 77,900 12,117 50,240
Saleable Antimony t produced 926 3,639 805 3,275
Q4, 2014 2014YE Q4, 2013 2013YENet Cash/All-in cost/oz Ag at Cerro Bayo, $ 3.95 / 10.37 5.30 / 11.36 6.74 /11.51 6.84 / 12.07
Net Cash/All-in cost/oz Au Eq. at Costerfield, $
608 / 884 771 / 1,035 850 / 1,085 819 / 1,062
Net Cash/All-in cost/oz Au Eq. at Björkdal, $(1)
901 / 1,051(1) 870 / 1,023 - -
EBITDA, $ million 21.5 64.4 13.9 67.7
Net Income, $ million 7.3 17.2 4.4 29.4
Cash and cash equiv., $ million 49.0 49.0 33.5 33.5
Current Mandalay Performance
(1) For the period September 10, 2014 to December 31, 2014Site all-in costs include total cash operating costs, royalty expense, depletion, depreciation, accretion and write-off of exploration and evaluation.9
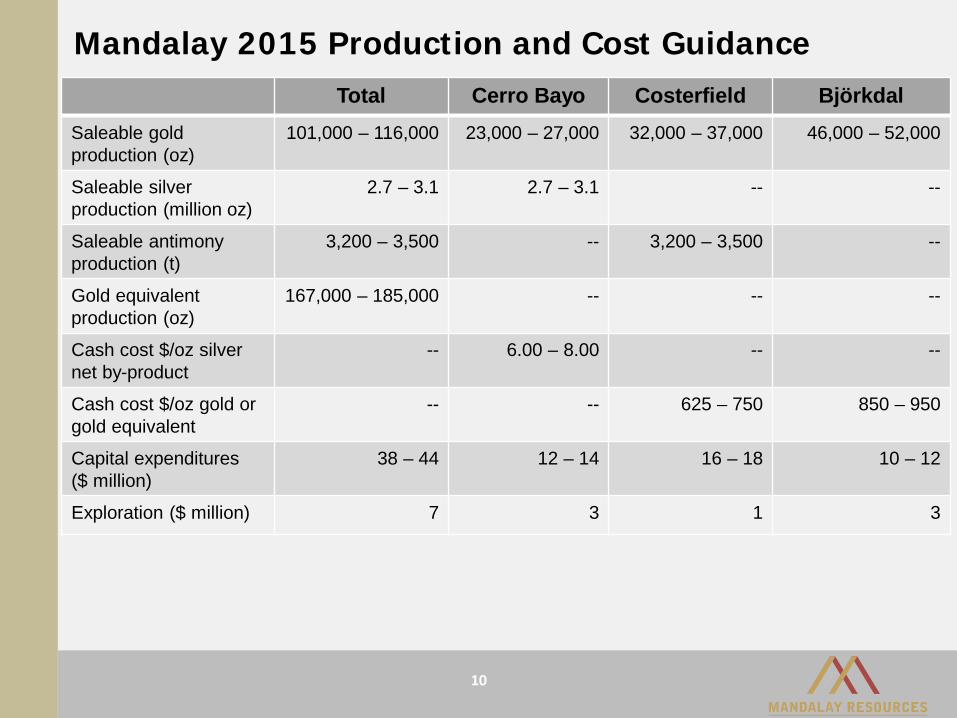
Total Cerro Bayo Costerfield BjörkdalSaleable gold production (oz)
101,000 – 116,000 23,000 – 27,000 32,000 – 37,000 46,000 – 52,000
Saleable silver production (million oz)
2.7 – 3.1 2.7 – 3.1 -- --
Saleable antimony production (t)
3,200 – 3,500 -- 3,200 – 3,500 --
Gold equivalent production (oz)
167,000 – 185,000 -- -- --
Cash cost $/oz silver net by-product
-- 6.00 – 8.00 -- --
Cash cost $/oz gold or gold equivalent
-- -- 625 – 750 850 – 950
Capital expenditures ($ million)
38 – 44 12 – 14 16 – 18 10 – 12
Exploration ($ million) 7 3 1 3
Mandalay 2015 Production and Cost Guidance
10
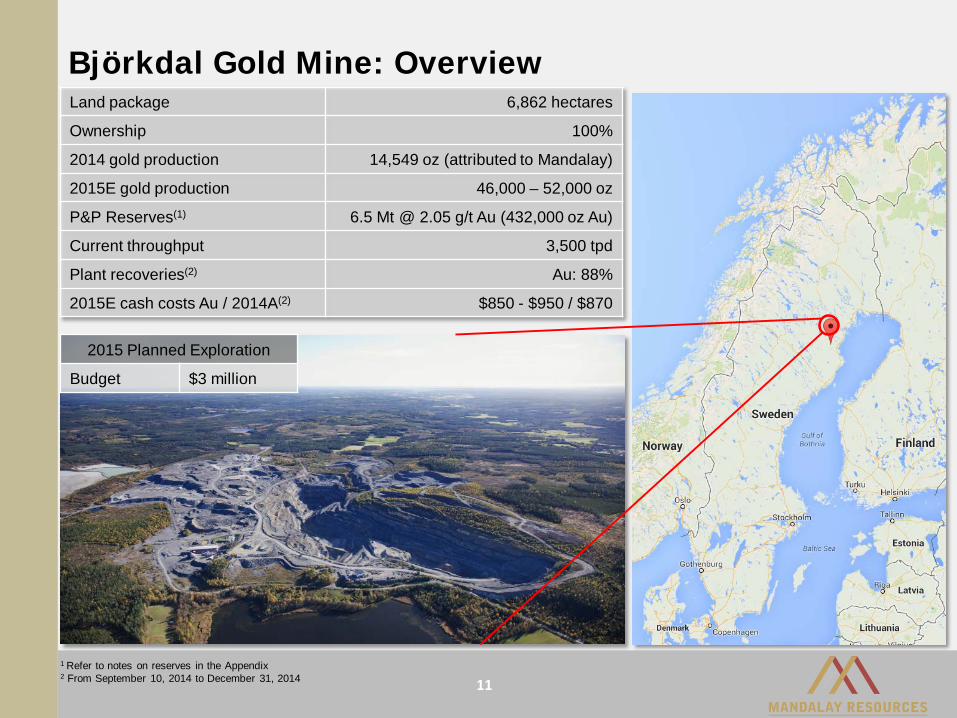
Björkdal Gold Mine: Overview
11
Land package 6,862 hectares
Ownership 100%
2014 gold production 14,549 oz (attributed to Mandalay)
2015E gold production 46,000 – 52,000 oz
P&P Reserves(1) 6.5 Mt @ 2.05 g/t Au (432,000 oz Au)
Current throughput 3,500 tpd
Plant recoveries(2) Au: 88%
2015E cash costs Au / 2014A(2) $850 - $950 / $870
1 Refer to notes on reserves in the Appendix2 From September 10, 2014 to December 31, 2014
2015 Planned Exploration
Budget $3 million
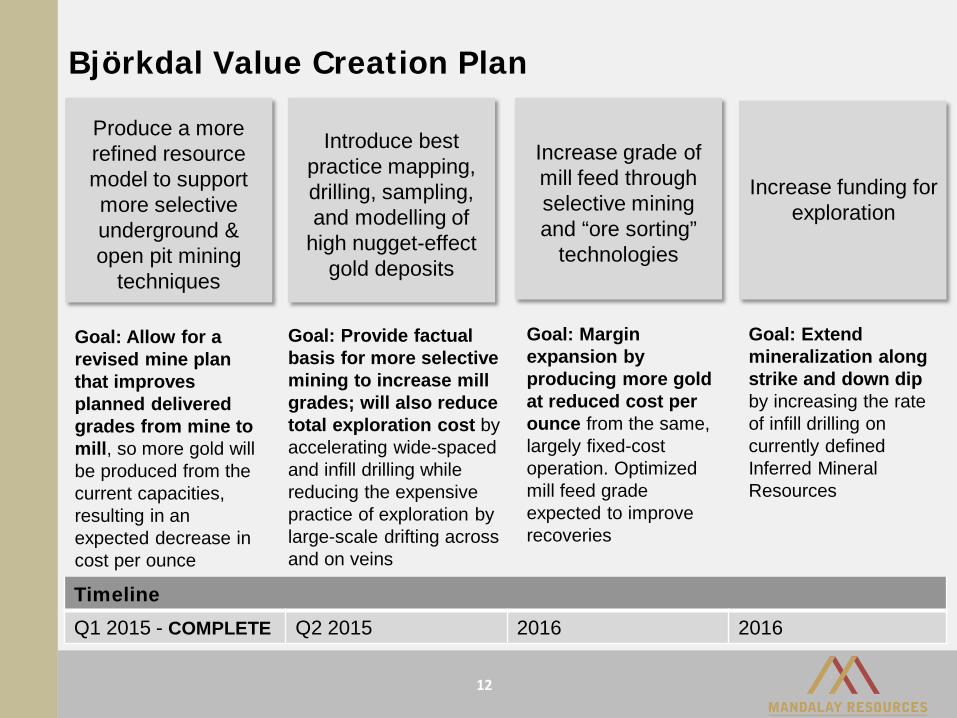
Björkdal Value Creation Plan
12
Goal: Allow for a revised mine plan that improves planned delivered grades from mine to mill, so more gold will be produced from the current capacities, resulting in an expected decrease in cost per ounce
Produce a more refined resource model to support more selective underground & open pit mining
techniques
Goal: Margin expansion by producing more gold at reduced cost per ounce from the same, largely fixed-cost operation. Optimized mill feed grade expected to improve recoveries
Increase grade of mill feed through selective mining and “ore sorting”
technologies
Goal: Extend mineralization along strike and down dip by increasing the rate of infill drilling on currently defined Inferred Mineral Resources
Increase funding for exploration
Introduce best practice mapping, drilling, sampling, and modelling of
high nugget-effect gold deposits
Goal: Provide factual basis for more selective mining to increase mill grades; will also reduce total exploration cost by accelerating wide-spaced and infill drilling while reducing the expensive practice of exploration by large-scale drifting across and on veins
TimelineQ1 2015 - COMPLETE Q2 2015 2016 2016
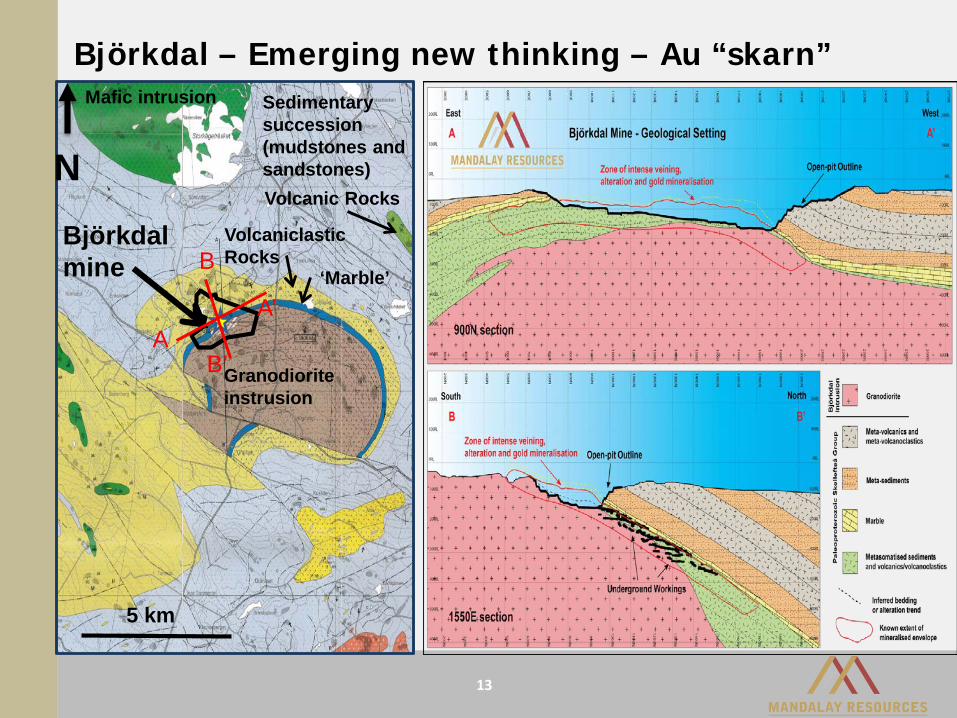
Björkdal – Emerging new thinking – Au “skarn”
N
5 km
Björkdal mine
Granodioriteinstrusion
‘Marble’
VolcaniclasticRocks
Mafic intrusion
Volcanic Rocks
Sedimentary succession(mudstones and sandstones)
B
B’A
A’
13
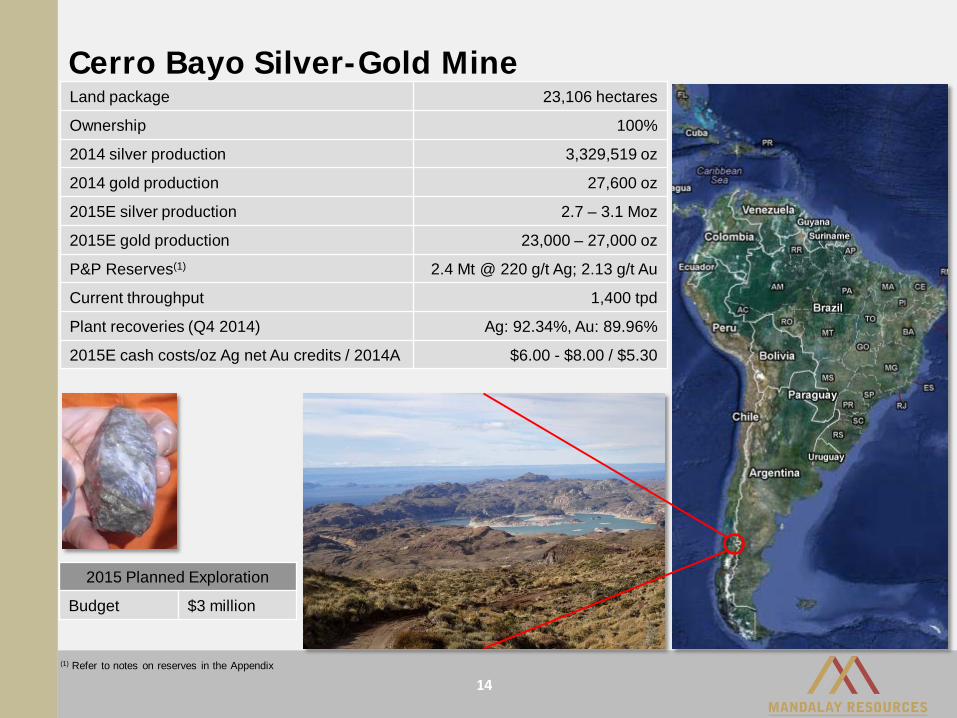
Cerro Bayo Silver-Gold Mine
14
Land package 23,106 hectares
Ownership 100%
2014 silver production 3,329,519 oz
2014 gold production 27,600 oz
2015E silver production 2.7 – 3.1 Moz
2015E gold production 23,000 – 27,000 oz
P&P Reserves(1) 2.4 Mt @ 220 g/t Ag; 2.13 g/t Au
Current throughput 1,400 tpd
Plant recoveries (Q4 2014) Ag: 92.34%, Au: 89.96%
2015E cash costs/oz Ag net Au credits / 2014A $6.00 - $8.00 / $5.30
2015 Planned Exploration
Budget $3 million
(1) Refer to notes on reserves in the Appendix
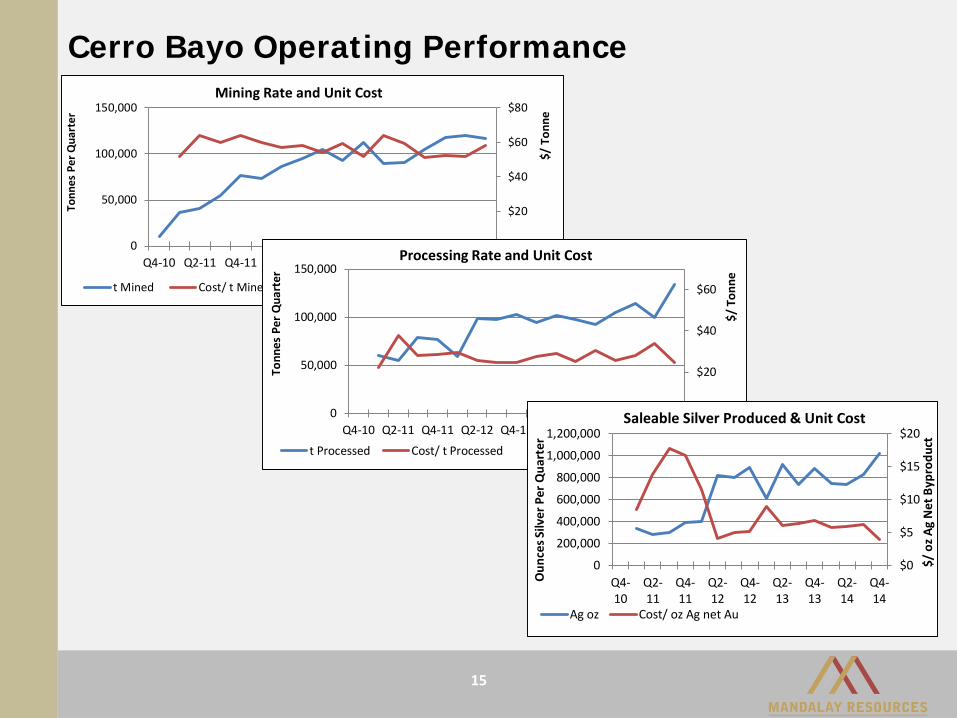
Cerro Bayo Operating Performance
$0
$20
$40
$60
$80
0
50,000
100,000
150,000
Q4-10 Q2-11 Q4-11 Q2-12 Q4-12 Q2-2013
Q4-2013
Q2-2014
Q4-2014
$/ T
onne
Tonn
es P
er Q
uart
er
Mining Rate and Unit Cost
t Mined Cost/ t Mined
$0
$20
$40
$60
0
50,000
100,000
150,000
Q4-10 Q2-11 Q4-11 Q2-12 Q4-12 Q2-13 Q4-13 Q2-14 Q4-14
$/ T
onne
Tonn
es P
er Q
uart
erProcessing Rate and Unit Cost
t Processed Cost/ t Processed
$0
$5
$10
$15
$20
0
200,000
400,000
600,000
800,000
1,000,000
1,200,000
Q4-10
Q2-11
Q4-11
Q2-12
Q4-12
Q2-13
Q4-13
Q2-14
Q4-14
$/ o
z Ag
Net
Byp
rodu
ct
Oun
ces S
ilver
Per
Qua
rter
Saleable Silver Produced & Unit Cost
Ag oz Cost/ oz Ag net Au
15
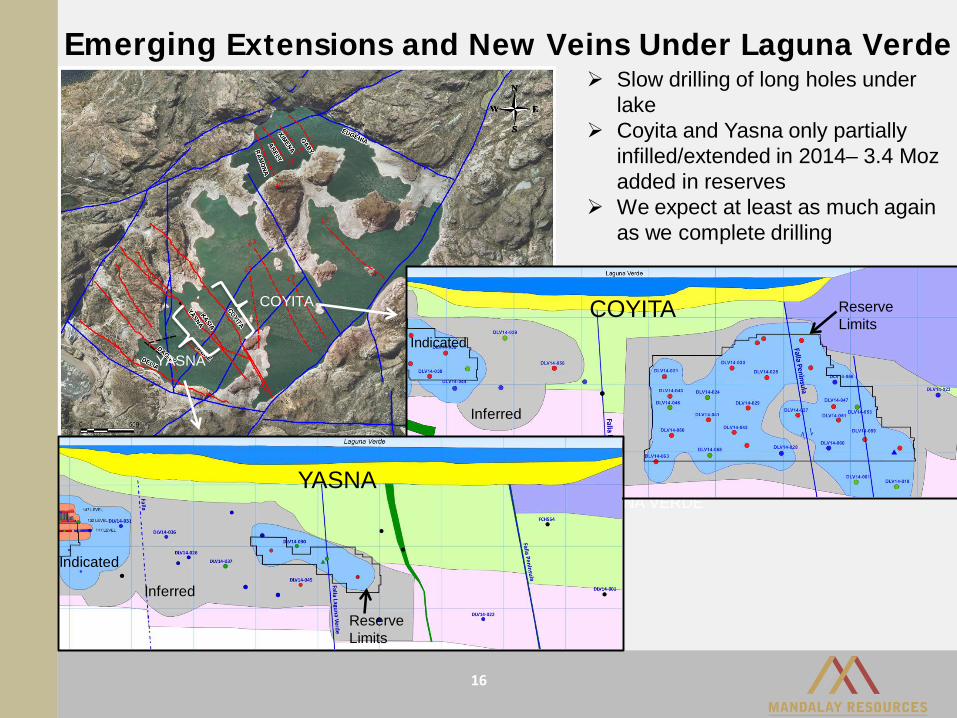
LAGUNA VERDE
Emerging Extensions and New Veins Under Laguna Verde
COYITA
YASNA
COYITA
YASNA
Inferred
Inferred
Indicated
Indicated
Reserve Limits
Reserve Limits
Slow drilling of long holes under lake
Coyita and Yasna only partially infilled/extended in 2014– 3.4 Moz added in reserves
We expect at least as much again as we complete drilling
16
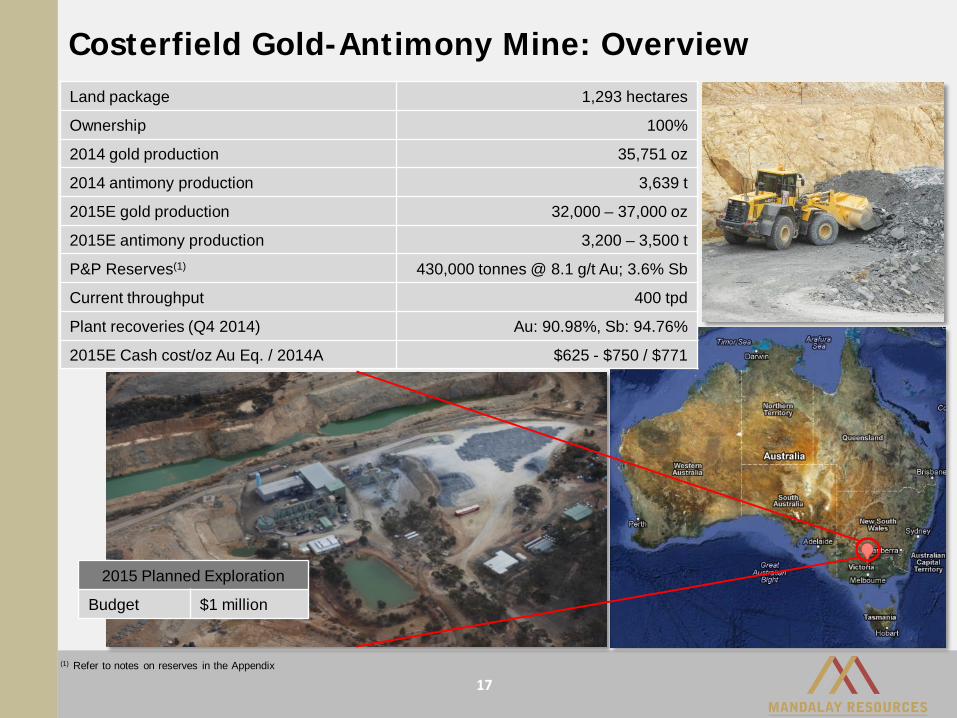
Costerfield Gold-Antimony Mine: Overview
17
2015 Planned Exploration
Budget $1 million
Land package 1,293 hectares
Ownership 100%
2014 gold production 35,751 oz
2014 antimony production 3,639 t
2015E gold production 32,000 – 37,000 oz
2015E antimony production 3,200 – 3,500 t
P&P Reserves(1) 430,000 tonnes @ 8.1 g/t Au; 3.6% Sb
Current throughput 400 tpd
Plant recoveries (Q4 2014) Au: 90.98%, Sb: 94.76%
2015E Cash cost/oz Au Eq. / 2014A $625 - $750 / $771
(1) Refer to notes on reserves in the Appendix
Costerfield Operating Performance
18
$0
$100
$200
$300
$400
05,000
10,00015,00020,00025,00030,00035,00040,00045,00050,000
Q4-09(Dec.only)
Q2-10 Q4-10 Q2-11 Q4-11 Q2-12 Q4-12 Q2-13 Q4-13 Q2-14 Q4-14
USD
/ To
nne
Tonn
es P
er Q
uart
er
Mining Rate and Unit Cost
t Mined Cost/ t Mined
$0
$20
$40
$60
$80
$100
$120
05,000
10,00015,00020,00025,00030,00035,00040,00045,000
Q4-09(Dec.only)
Q2-10 Q4-10 Q2-11 Q4-11 Q2-12 Q4-12 Q2-13 Q4-13 Q2-14 Q4-14
USD
/ To
nne
Tonn
es P
er Q
uart
er
Processing Rate and Unit Cost
t Processed Cost/ t Processed
$0
$500
$1,000
$1,500
$2,000
$2,500
$3,000
02,0004,0006,0008,000
10,00012,00014,00016,00018,00020,000
USD
/ O
z Au
Eq.
Oun
ces
Per Q
uart
er
Au Equivalent Production and Cost
Oz Au Eq. Cost/ Au Eq. Oz
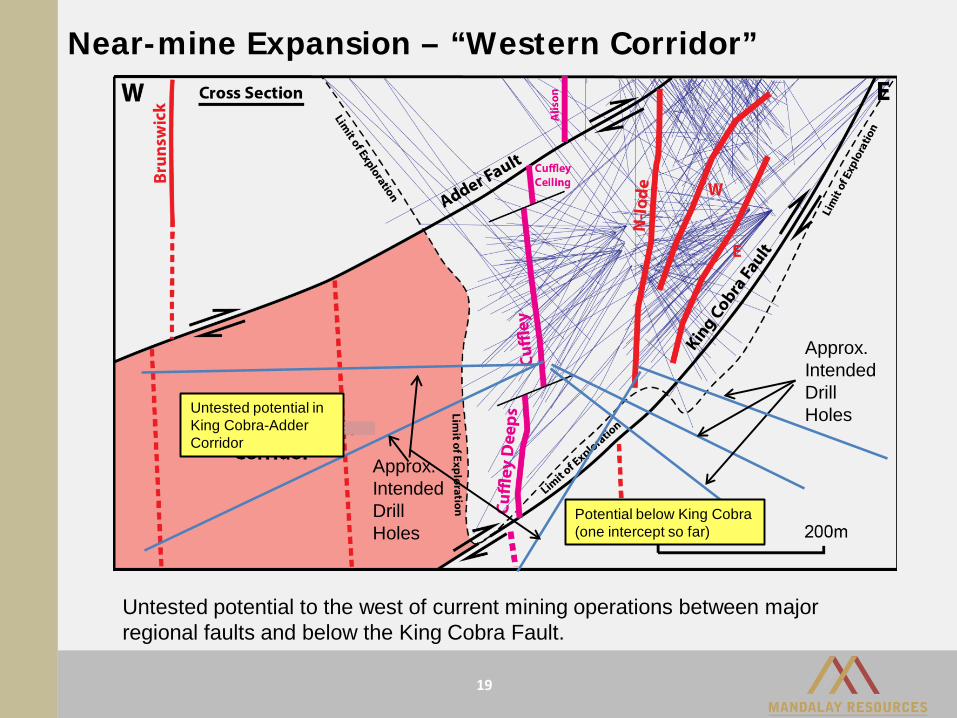
Near-mine Expansion – “Western Corridor”
Untested potential to the west of current mining operations between major regional faults and below the King Cobra Fault.
Untested potential in King Cobra-Adder Corridor
Potential below King Cobra (one intercept so far)
Approx. Intended Drill Holes
Approx. Intended Drill Holes
19
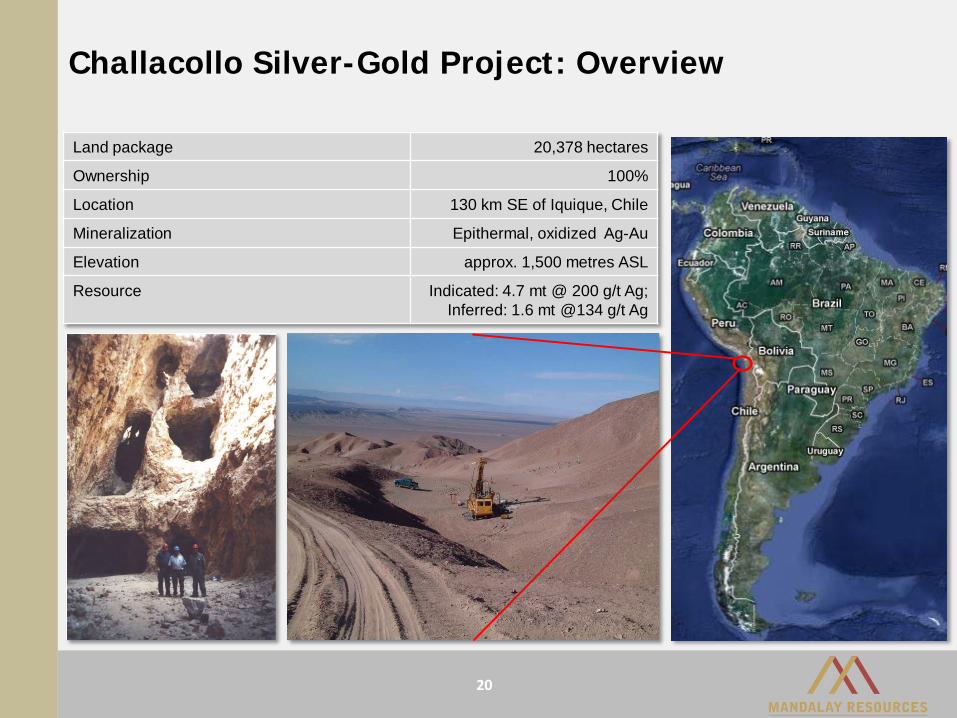
Challacollo Silver-Gold Project: Overview
20
Land package 20,378 hectares
Ownership 100%
Location 130 km SE of Iquique, Chile
Mineralization Epithermal, oxidized Ag-Au
Elevation approx. 1,500 metres ASL
Resource Indicated: 4.7 mt @ 200 g/t Ag;Inferred: 1.6 mt @134 g/t Ag
Current status• Mineral resource – estimate complete• Mining – Mining plan in progress • Metallurgy – complete – 92-93% Ag recovery, 70% Au recovery• Site layout, plant design in progress• Capital and operating cost estimates being refined• Water well drilling – complete in March, 2014• Environmental and cultural baselines complete• Community consultations ongoing
Next milestones• Permitting
Submission of EIA Q1, 2015 Receipt of permits – Goal: EOY 2015
• Build 12 months build (est.) in 2016
• Production First production – Goal: 2017
Challacollo Development Activities
21
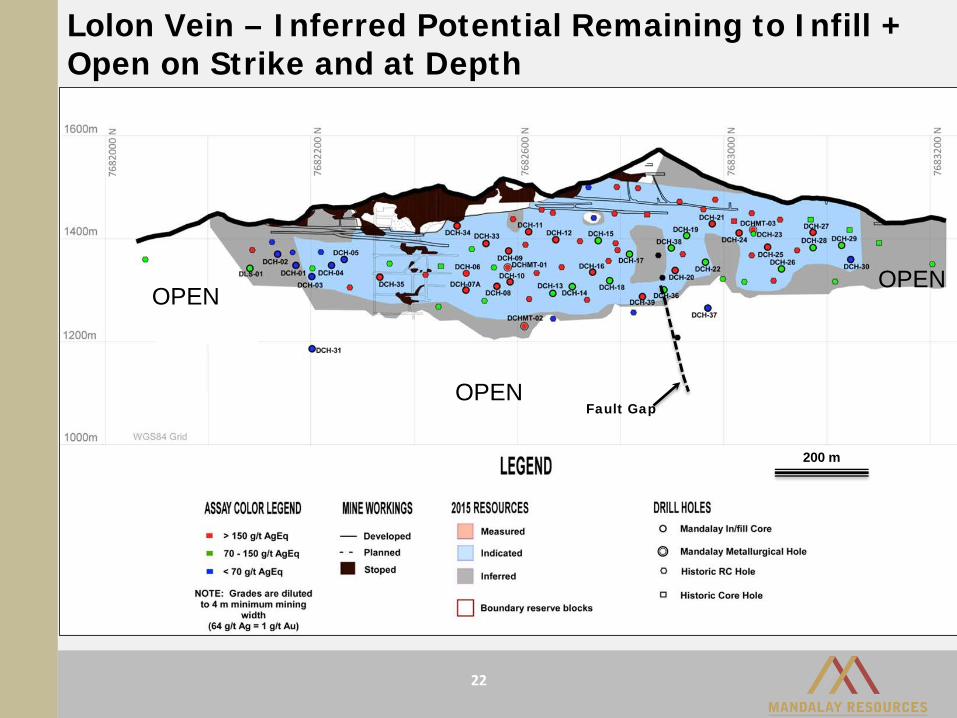
Lolon Vein – Inferred Potential Remaining to Infill + Open on Strike and at Depth
Short Hole
200 m
Fault Gap
OPEN
OPEN
OPEN
22
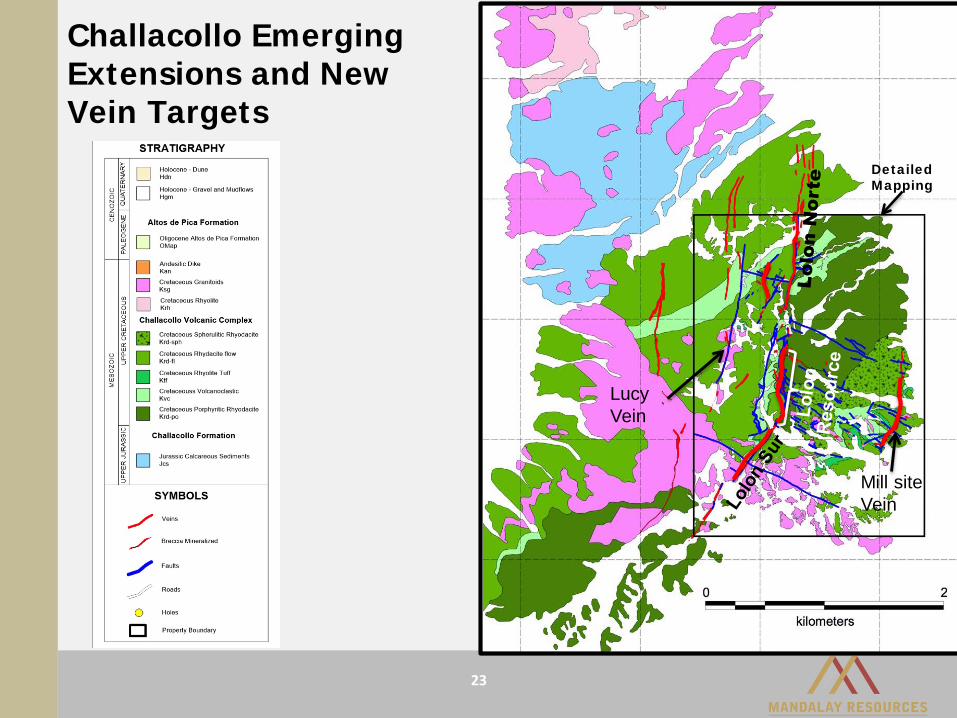
Challacollo Emerging Extensions and New Vein Targets
Mill siteVein
LucyVein
Detailed Mapping
23
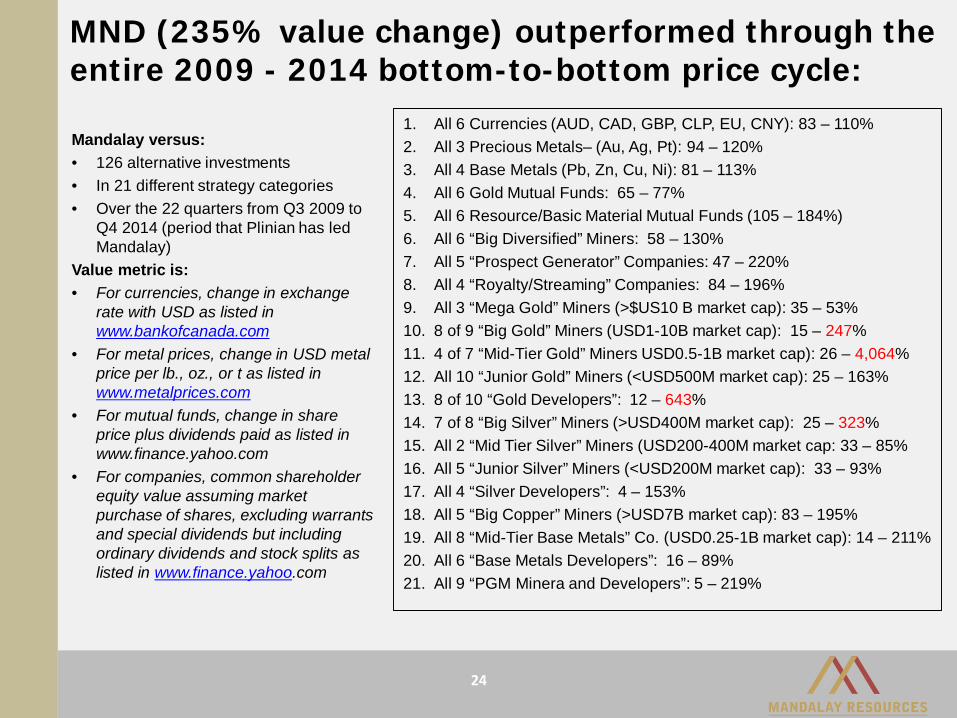
MND (235% value change) outperformed through the entire 2009 - 2014 bottom-to-bottom price cycle:
1. All 6 Currencies (AUD, CAD, GBP, CLP, EU, CNY): 83 – 110%2. All 3 Precious Metals– (Au, Ag, Pt): 94 – 120%3. All 4 Base Metals (Pb, Zn, Cu, Ni): 81 – 113%4. All 6 Gold Mutual Funds: 65 – 77%5. All 6 Resource/Basic Material Mutual Funds (105 – 184%)6. All 6 “Big Diversified” Miners: 58 – 130%7. All 5 “Prospect Generator” Companies: 47 – 220%8. All 4 “Royalty/Streaming” Companies: 84 – 196%9. All 3 “Mega Gold” Miners (>$US10 B market cap): 35 – 53%10. 8 of 9 “Big Gold” Miners (USD1-10B market cap): 15 – 247%11. 4 of 7 “Mid-Tier Gold” Miners USD0.5-1B market cap): 26 – 4,064%12. All 10 “Junior Gold” Miners (<USD500M market cap): 25 – 163%13. 8 of 10 “Gold Developers”: 12 – 643%14. 7 of 8 “Big Silver” Miners (>USD400M market cap): 25 – 323%15. All 2 “Mid Tier Silver” Miners (USD200-400M market cap: 33 – 85%16. All 5 “Junior Silver” Miners (<USD200M market cap): 33 – 93%17. All 4 “Silver Developers”: 4 – 153%18. All 5 “Big Copper” Miners (>USD7B market cap): 83 – 195%19. All 8 “Mid-Tier Base Metals” Co. (USD0.25-1B market cap): 14 – 211%20. All 6 “Base Metals Developers”: 16 – 89%21. All 9 “PGM Minera and Developers”: 5 – 219%
Mandalay versus:• 126 alternative investments• In 21 different strategy categories• Over the 22 quarters from Q3 2009 to
Q4 2014 (period that Plinian has led Mandalay)
Value metric is: • For currencies, change in exchange
rate with USD as listed in www.bankofcanada.com
• For metal prices, change in USD metal price per lb., oz., or t as listed in www.metalprices.com
• For mutual funds, change in share price plus dividends paid as listed in www.finance.yahoo.com
• For companies, common shareholder equity value assuming market purchase of shares, excluding warrants and special dividends but including ordinary dividends and stock splits as listed in www.finance.yahoo.com
24
0
5
10
15
20
25
30
35
40
45
50
Num
ber o
f Alte
rnat
ives
Cumulative Total Value Q3 2009 – Q4 2014
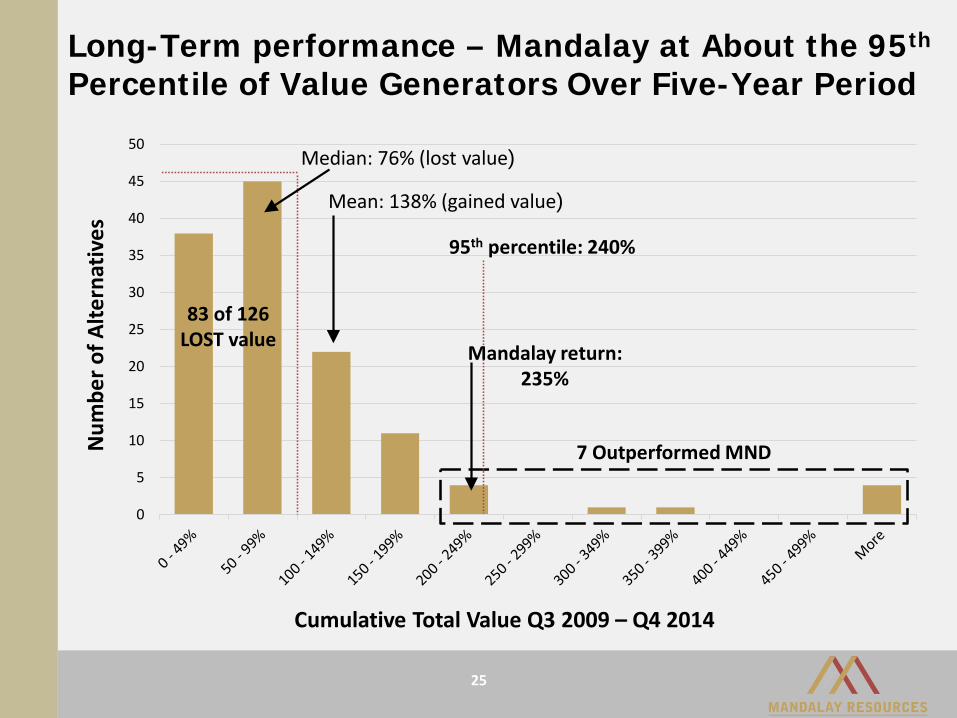
Long-Term performance – Mandalay at About the 95th
Percentile of Value Generators Over Five-Year Period
7 Outperformed MND
95th percentile: 240%
83 of 126 LOST value
Median: 76% (lost value)
Mean: 138% (gained value)
Mandalay return: 235%
25
How We Will Deploy Your Capital When You Invest With Us Acquire new assets counter-cyclically – only at a deep discount to value that we can deliver
• Base case returns at least 2x the investment• Upside case 3-5x over 3-5 years based on specific testable hypotheses• Keep portfolio evergreen – exit assets that do not fit
Execute focused improvement projects at each site• Exploration – project portfolio targeted on discovery of near-term reserves• Mining – projects focused on safer, more mechanised mining with higher extraction,
lower dilution and reduced cost• Metallurgical – projects focused on higher recovery, higher availability, higher quality
products with higher payables and reduced costs• Commercial – create more diverse customers paying better terms
Apply relentless, disciplined financial management• Low cash cost and overheads for high EBITDA margins• Low DD&A for high P&L margins – low acquisition cost, focused CAPEX & exploration • Prudent, low-cost leverage to fund growth when needed• Minimize shareholder dilution• Return cash to shareholders – dividends = 6% of trailing qtr. revenues
26
MAR2015BUILDING VALUE
ACROSS THE CYCLETSX // MND
For more information, please contact:
Greg DiTomasoDirector, Investor RelationsTel: 647.260.1566Email: [email protected] Website: www.mandalayresources.comTwitter: @MandalayAuAg
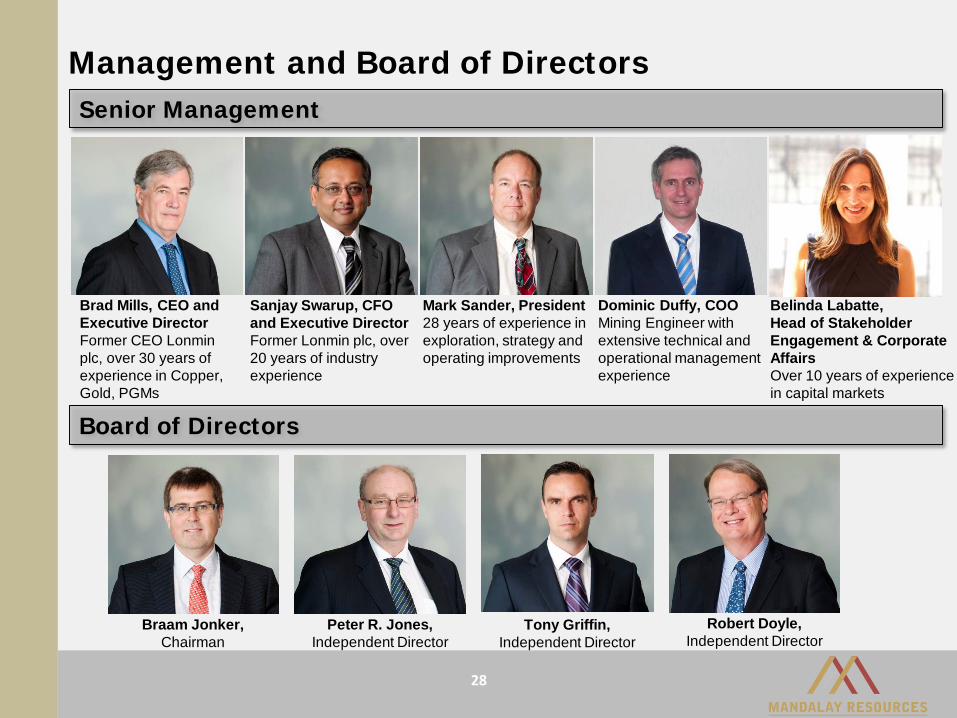
Management and Board of DirectorsSenior Management
Board of Directors
Brad Mills, CEO and Executive DirectorFormer CEO Lonmin plc, over 30 years of experience in Copper, Gold, PGMs
Mark Sander, President28 years of experience in exploration, strategy and operating improvements
Sanjay Swarup, CFO and Executive DirectorFormer Lonmin plc, over 20 years of industry experience
Belinda Labatte, Head of Stakeholder Engagement & Corporate AffairsOver 10 years of experience in capital markets
Braam Jonker, Chairman
Peter R. Jones,Independent Director
Tony Griffin,Independent Director
Robert Doyle,Independent Director
Dominic Duffy, COOMining Engineer with extensive technical and operational management experience
28
Numbers may differ slightly from source documents due to rounding
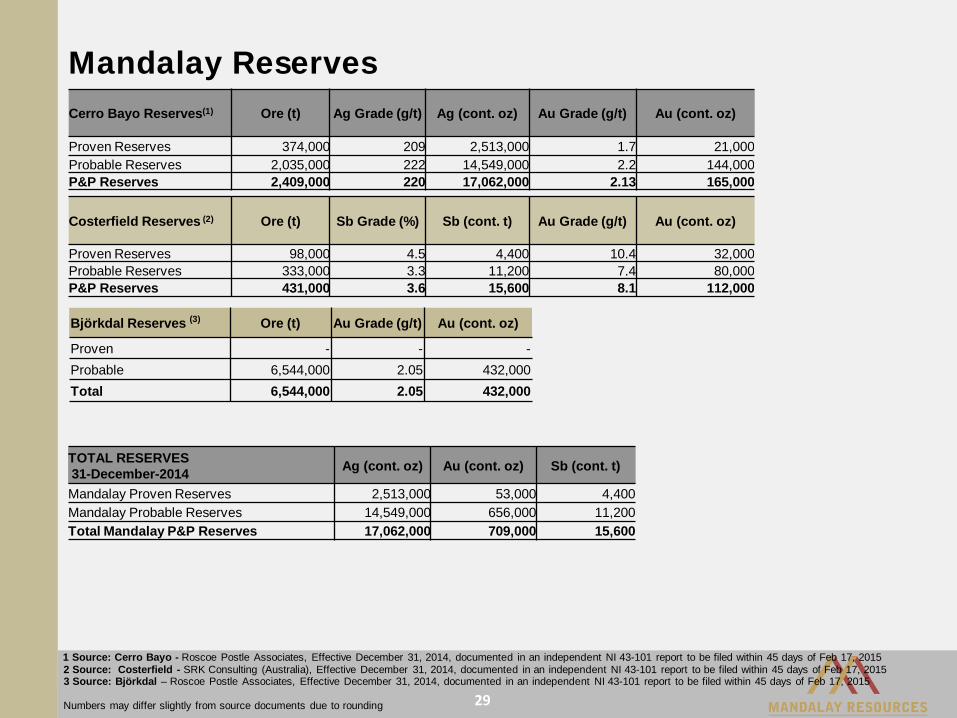
Mandalay ReservesCerro Bayo Reserves(1) Ore (t) Ag Grade (g/t) Ag (cont. oz) Au Grade (g/t) Au (cont. oz)
Proven Reserves 374,000 209 2,513,000 1.7 21,000Probable Reserves 2,035,000 222 14,549,000 2.2 144,000P&P Reserves 2,409,000 220 17,062,000 2.13 165,000
Costerfield Reserves (2) Ore (t) Sb Grade (%) Sb (cont. t) Au Grade (g/t) Au (cont. oz)
Proven Reserves 98,000 4.5 4,400 10.4 32,000Probable Reserves 333,000 3.3 11,200 7.4 80,000P&P Reserves 431,000 3.6 15,600 8.1 112,000
1 Source: Cerro Bayo - Roscoe Postle Associates, Effective December 31, 2014, documented in an independent NI 43-101 report to be filed within 45 days of Feb 17, 20152 Source: Costerfield - SRK Consulting (Australia), Effective December 31, 2014, documented in an independent NI 43-101 report to be filed within 45 days of Feb 17, 20153 Source: Björkdal – Roscoe Postle Associates, Effective December 31, 2014, documented in an independent NI 43-101 report to be filed within 45 days of Feb 17, 2015
TOTAL RESERVES31-December-2014 Ag (cont. oz) Au (cont. oz) Sb (cont. t)
Mandalay Proven Reserves 2,513,000 53,000 4,400Mandalay Probable Reserves 14,549,000 656,000 11,200Total Mandalay P&P Reserves 17,062,000 709,000 15,600
Björkdal Reserves (3) Ore (t) Au Grade (g/t) Au (cont. oz)
Proven - - -Probable 6,544,000 2.05 432,000Total 6,544,000 2.05 432,000
29
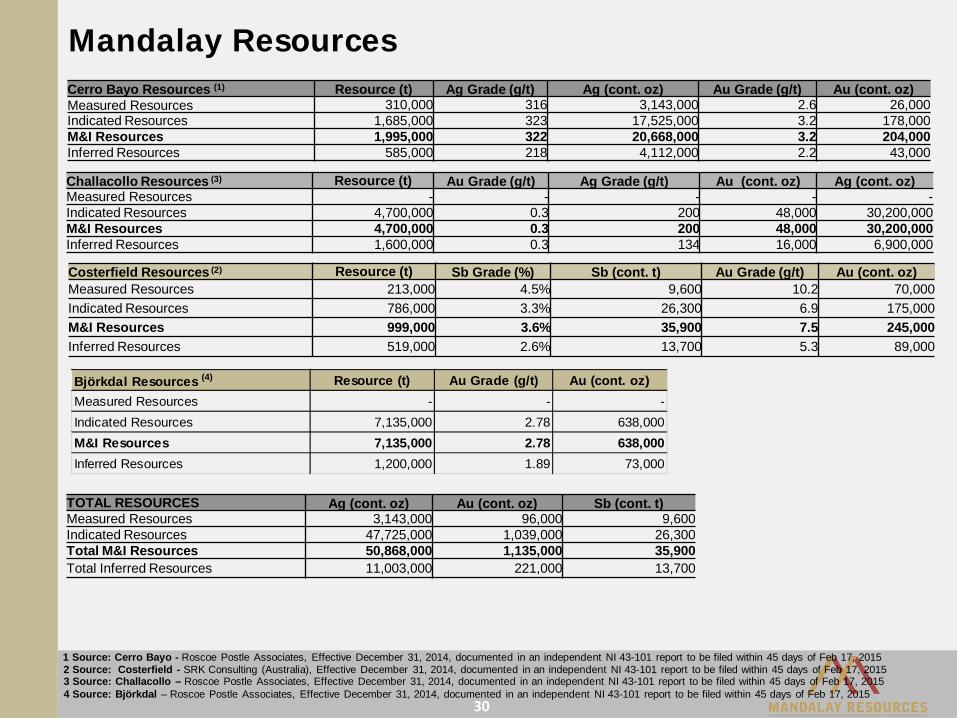
Mandalay ResourcesCerro Bayo Resources (1) Resource (t) Ag Grade (g/t) Ag (cont. oz) Au Grade (g/t) Au (cont. oz)Measured Resources 310,000 316 3,143,000 2.6 26,000Indicated Resources 1,685,000 323 17,525,000 3.2 178,000M&I Resources 1,995,000 322 20,668,000 3.2 204,000Inferred Resources 585,000 218 4,112,000 2.2 43,000
Costerfield Resources (2) Resource (t) Sb Grade (%) Sb (cont. t) Au Grade (g/t) Au (cont. oz)Measured Resources 213,000 4.5% 9,600 10.2 70,000 Indicated Resources 786,000 3.3% 26,300 6.9 175,000 M&I Resources 999,000 3.6% 35,900 7.5 245,000 Inferred Resources 519,000 2.6% 13,700 5.3 89,000
TOTAL RESOURCES Ag (cont. oz) Au (cont. oz) Sb (cont. t)Measured Resources 3,143,000 96,000 9,600Indicated Resources 47,725,000 1,039,000 26,300Total M&I Resources 50,868,000 1,135,000 35,900Total Inferred Resources 11,003,000 221,000 13,700
1 Source: Cerro Bayo - Roscoe Postle Associates, Effective December 31, 2014, documented in an independent NI 43-101 report to be filed within 45 days of Feb 17, 20152 Source: Costerfield - SRK Consulting (Australia), Effective December 31, 2014, documented in an independent NI 43-101 report to be filed within 45 days of Feb 17, 2015
Challacollo Resources (3) Resource (t) Au Grade (g/t) Ag Grade (g/t) Au (cont. oz) Ag (cont. oz)Measured Resources - - - - -Indicated Resources 4,700,000 0.3 200 48,000 30,200,000 M&I Resources 4,700,000 0.3 200 48,000 30,200,000 Inferred Resources 1,600,000 0.3 134 16,000 6,900,000
3 Source: Challacollo – Roscoe Postle Associates, Effective December 31, 2014, documented in an independent NI 43-101 report to be filed within 45 days of Feb 17, 20154 Source: Björkdal – Roscoe Postle Associates, Effective December 31, 2014, documented in an independent NI 43-101 report to be filed within 45 days of Feb 17, 2015
Björkdal Resources (4) Resource (t) Au Grade (g/t) Au (cont. oz)Measured Resources - - - Indicated Resources 7,135,000 2.78 638,000M&I Resources 7,135,000 2.78 638,000Inferred Resources 1,200,000 1.89 73,000
30