Embed Size (px)
Citation preview
BUILDING VALUEACROSS THE CYCLE
MANDALAY RESOURCES
MARCH 2017TSX // MND
This presentation contains "forward-looking statements" within the meaning of applicable securities laws, including statements relating to life ofmine production plans, exploration plans and the growth and strategy of Mandalay. Actual results and developments may differ materially fromthose contemplated by these statements depending on, among other things: exploration results or production results not meeting management’sexpectations; capital, production and operating cost results not meeting current plans; and changes in commodity prices and general market andeconomic conditions. The factors identified above are not intended to represent a complete list of the factors that could affect Mandalay. Adescription of additional risks that could result in actual results and developments differing from those contemplated by forward lookingstatements in this news release can be found under the heading “Risk Factors” in Mandalay’s annual information form dated March 30, 2016 andin its final prospectus dated July 18, 2016, copies of which are available under Mandalay's profile at www.sedar.com. Although Mandalay hasattempted to identify important factors that could cause actual actions, events or results to differ materially from those described in forward-looking statements, there may be other factors that cause actions, events or results not to be as anticipated, estimated or intended. There can beno assurance that forward-looking statements will prove to be accurate, as actual results and future events could differ materially from thoseanticipated in such statements. Accordingly, readers should not place undue reliance on forward-looking statements.
Quality Control and AssuranceQuality control and assurance programs are implemented in line with the standards of National Instrument 43-101.
The exploration programs at Costerfield and Björkdal are supervised by Chris Gregory (Member, Australian Institute of Geoscientists, VP ofOperational Geology for Mandalay and a “Qualified Person” as defined under National Instrument 43-101. Mr. Gregory regularly visits Costerfieldand Björkdal, and supervises the collection and interpretation of scientific and technical information contained in this presentation.
The exploration programs at the Cerro Bayo and Challacollo projects are supervised by Scott Manske, Chief Cordilleran Geologist of MandalayResources, and an Oregon registered Professional Geologist. A “Qualified Person” as defined by NI 43-101, he has reviewed and approved thetechnical and scientific information on these projects contained in the presentation.
Dr. Mark Sander (Member: AusIMM), President and CEO of Mandalay, has visited the Costerfield, Cerro Bayo, Challacollo, and Björkdal andhas supervised the preparation of this presentation.
All currency references in US$ unless otherwise indicated
Forward-looking Statements
2
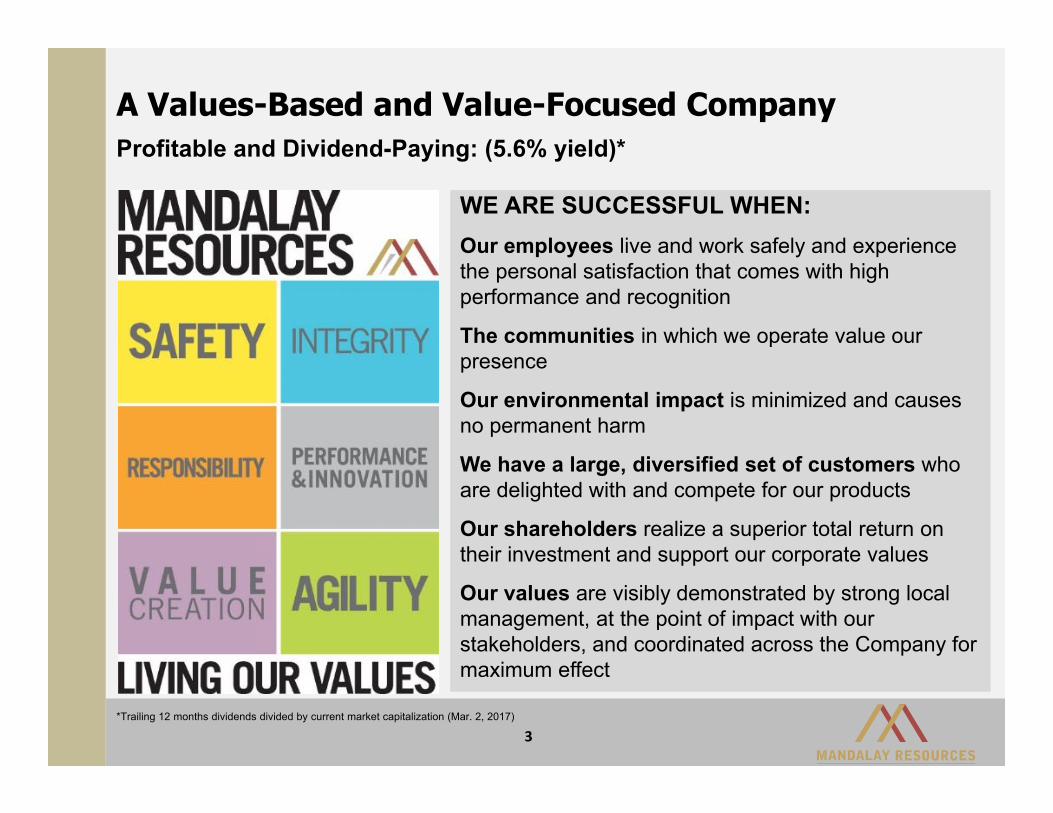
A Values-Based and Value-Focused Company
WE ARE SUCCESSFUL WHEN:Our employees live and work safely and experience the personal satisfaction that comes with high performance and recognition
The communities in which we operate value our presence
Our environmental impact is minimized and causes no permanent harm
We have a large, diversified set of customers who are delighted with and compete for our products
Our shareholders realize a superior total return on their investment and support our corporate values
Our values are visibly demonstrated by strong local management, at the point of impact with our stakeholders, and coordinated across the Company for maximum effect
Profitable and Dividend-Paying: (5.6% yield)*
*Trailing 12 months dividends divided by current market capitalization (Mar. 2, 2017)
3
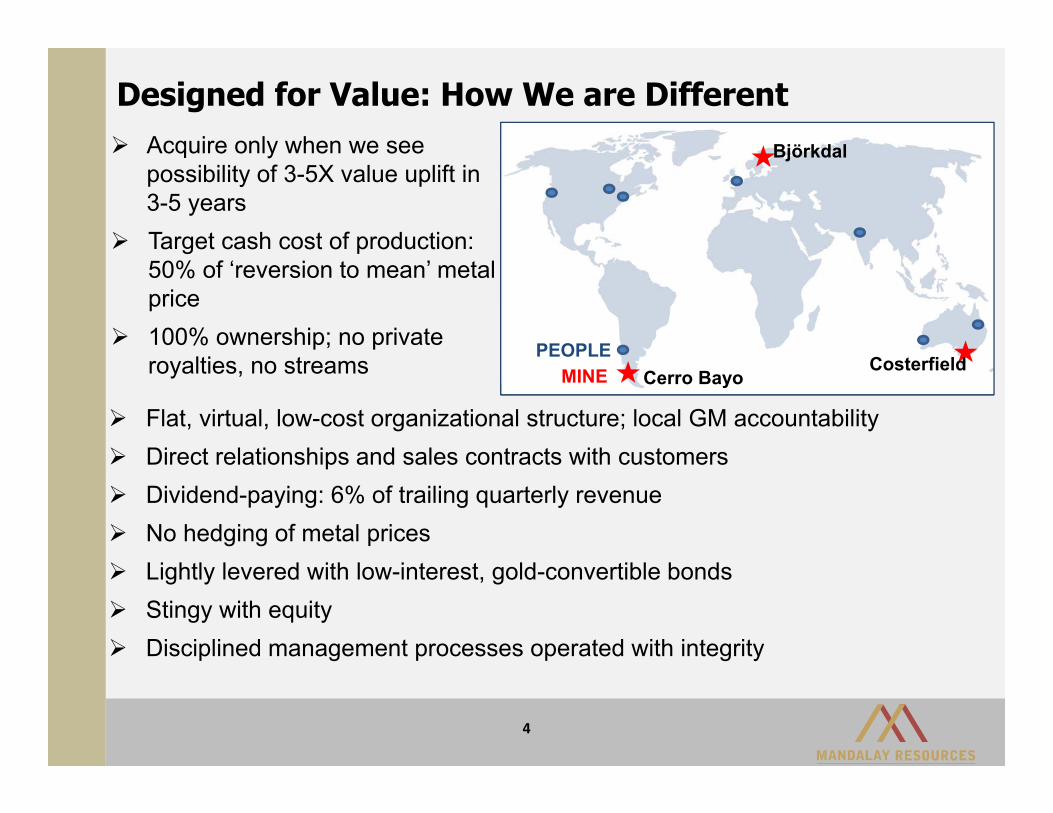
Designed for Value: How We are Different Acquire only when we see
possibility of 3-5X value uplift in 3-5 years
Target cash cost of production: 50% of ‘reversion to mean’ metal price
100% ownership; no private royalties, no streams
4
MINE MINE PEOPLEPEOPLE
Cerro BayoCerro BayoCosterfieldCosterfield
BjörkdalBjörkdal
MINE PEOPLE
Cerro BayoCosterfield
Björkdal
Flat, virtual, low-cost organizational structure; local GM accountability Direct relationships and sales contracts with customers Dividend-paying: 6% of trailing quarterly revenue No hedging of metal prices Lightly levered with low-interest, gold-convertible bonds Stingy with equity Disciplined management processes operated with integrity
1.7
32
79.967.7 64.4 68
50.9
-0.8
30.6
61.275.9
52.473.4
53.7
20.6
92.2
171.8
166.9
184.6194.5
185.51,224
1,5701,670
1,411
1,2651,160 1,248
0
200
400
600
800
1,000
1,200
1,400
1,600
1,800
-50
0
50
100
150
200
250
2010 2011 2012 2013 2014 2015 2016
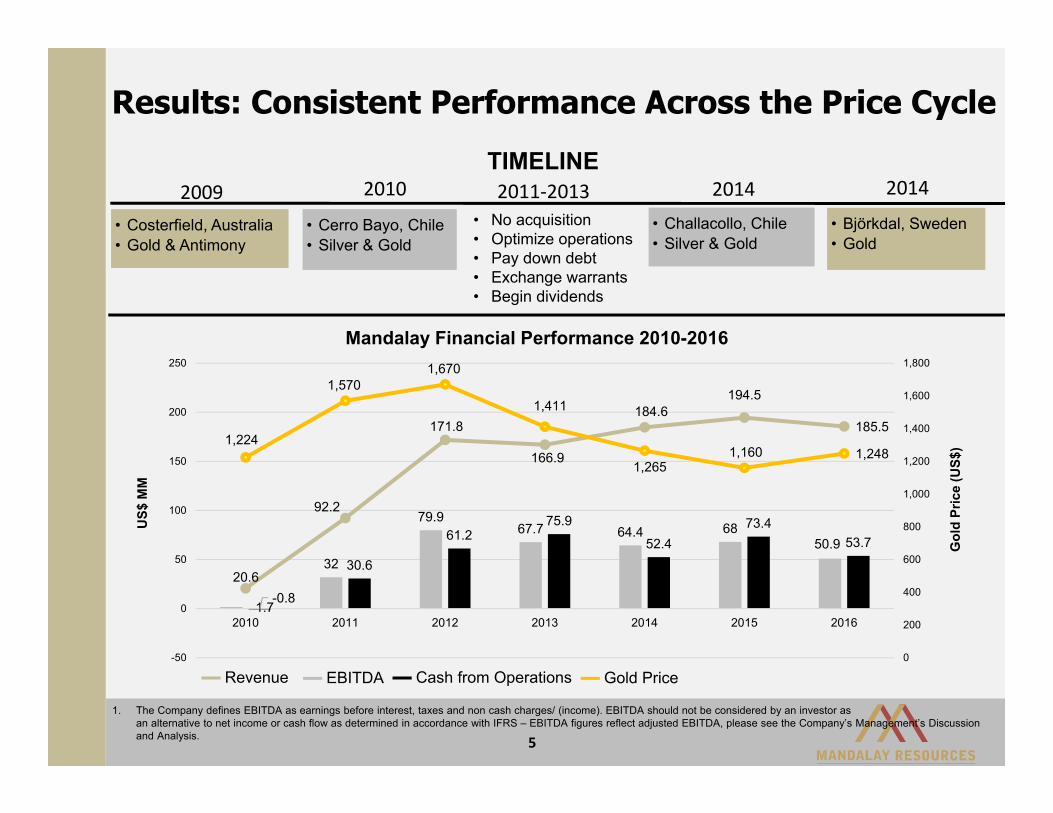
2009• Costerfield, Australia• Gold & Antimony• Costerfield, Australia• Gold & Antimony
2010
• Cerro Bayo, Chile• Silver & Gold• Cerro Bayo, Chile• Silver & Gold
2014• Challacollo, Chile• Silver & Gold• Challacollo, Chile• Silver & Gold
2014
• Björkdal, Sweden• Gold• Björkdal, Sweden• Gold
Results: Consistent Performance Across the Price Cycle
1. The Company defines EBITDA as earnings before interest, taxes and non cash charges/ (income). EBITDA should not be considered by an investor as an alternative to net income or cash flow as determined in accordance with IFRS – EBITDA figures reflect adjusted EBITDA, please see the Company’s Management’s Discussion and Analysis.
TIMELINE
Mandalay Financial Performance 2010-2016
• No acquisition • Optimize operations• Pay down debt• Exchange warrants• Begin dividends
2011‐2013
5
US$
MM
Gol
d Pr
ice
(US$
)
Revenue EBITDA Cash from Operations Gold Price
6
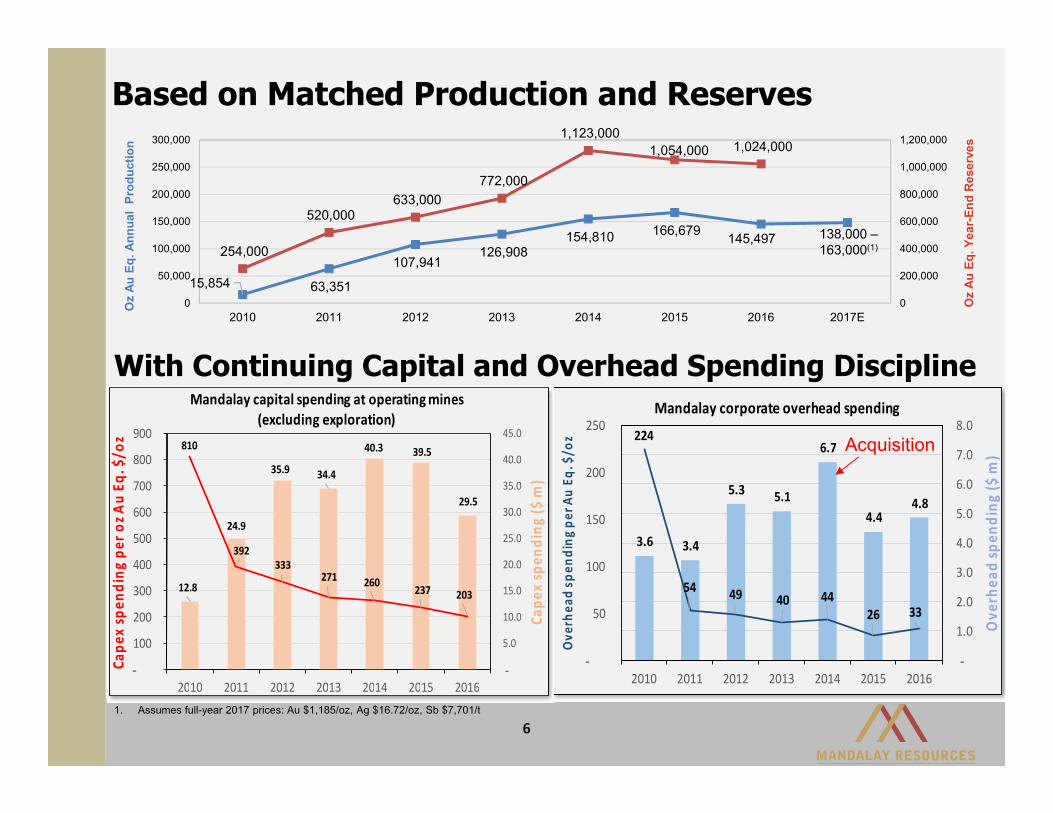
Based on Matched Production and Reserves
6
With Continuing Capital and Overhead Spending Discipline
15,854 63,351
107,941 126,908
154,810 166,679 254,000
520,000 633,000
772,000
1,123,000 1,054,000 1,024,000
0
200,000
400,000
600,000
800,000
1,000,000
1,200,000
0
50,000
100,000
150,000
200,000
250,000
300,000
2010 2011 2012 2013 2014 2015 2016 2017E
Oz
Au E
q. Y
ear-
End
Res
erve
s
Oz
Au E
q. A
nnua
l Pr
oduc
tion
145,497 138,000 –163,000(1)
3.6 3.4
5.3 5.1
6.7
4.4 4.8
224
54 49 40 44 26 33
-
50
100
150
200
250
2010 2011 2012 2013 2014 2015 2016-
1.0
2.0
3.0
4.0
5.0
6.0
7.0
8.0
Ove
rhea
d sp
ending
per
Au Eq
. $/o
z
Ove
rhea
d sp
ending
($ m
)
Mandalay corporate overhead spending
12.8
24.9
35.9 34.4
40.3 39.5
29.5
810
392 333
271 260 237 203
-
100
200
300
400
500
600
700
800
900
2010 2011 2012 2013 2014 2015 2016-
5.0
10.0
15.0
20.0
25.0
30.0
35.0
40.0
45.0
Cape
x sp
ending
per
oz A
u Eq
. $/o
z
Cape
x sp
ending
($ m
)
Mandalay capital spending at operating mines (excluding exploration)
Acquisition
1. Assumes full-year 2017 prices: Au $1,185/oz, Ag $16.72/oz, Sb $7,701/t
0
50
100
150
200
250
300
2010 2011 2012 2013 2014 2015 2016
US$
/oz
Au
Eq. P
&P
Add
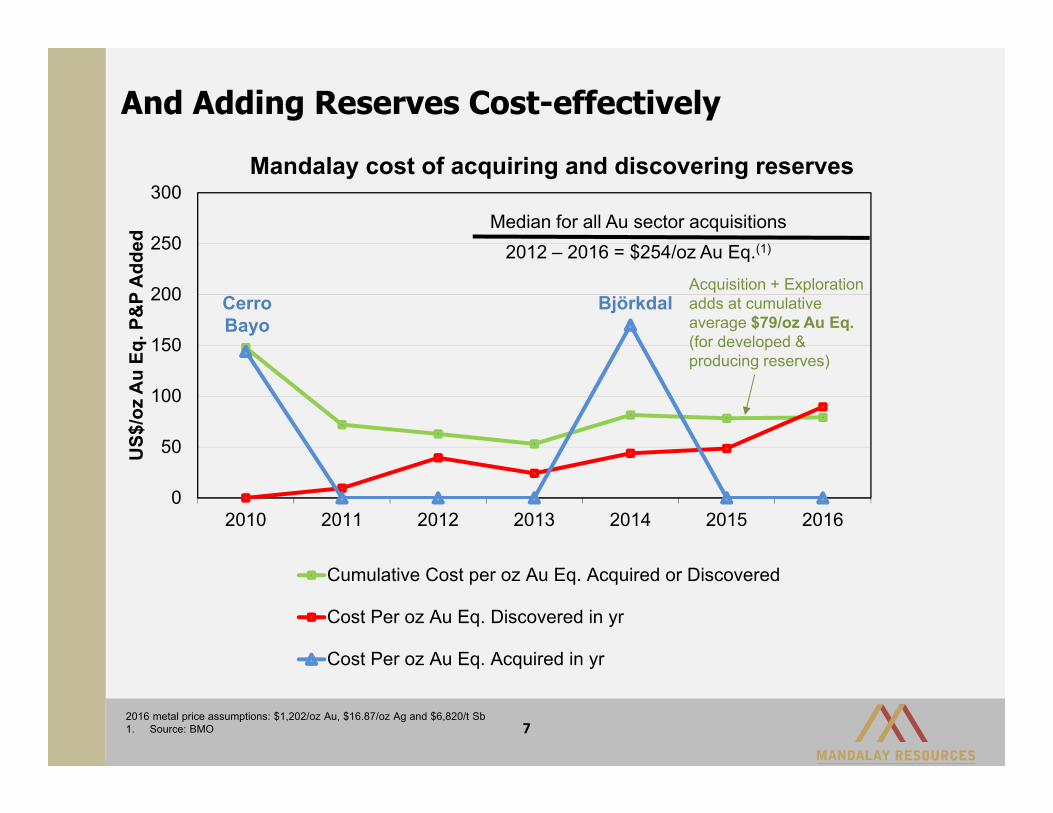
edMandalay cost of acquiring and discovering reserves
Cumulative Cost per oz Au Eq. Acquired or Discovered
Cost Per oz Au Eq. Discovered in yr
Cost Per oz Au Eq. Acquired in yr
And Adding Reserves Cost-effectively
2016 metal price assumptions: $1,202/oz Au, $16.87/oz Ag and $6,820/t Sb1. Source: BMO
Acquisition + Exploration adds at cumulative average $79/oz Au Eq. (for developed & producing reserves)
Cerro Bayo
Björkdal
Median for all Au sector acquisitions2012 – 2016 = $254/oz Au Eq.(1)
7
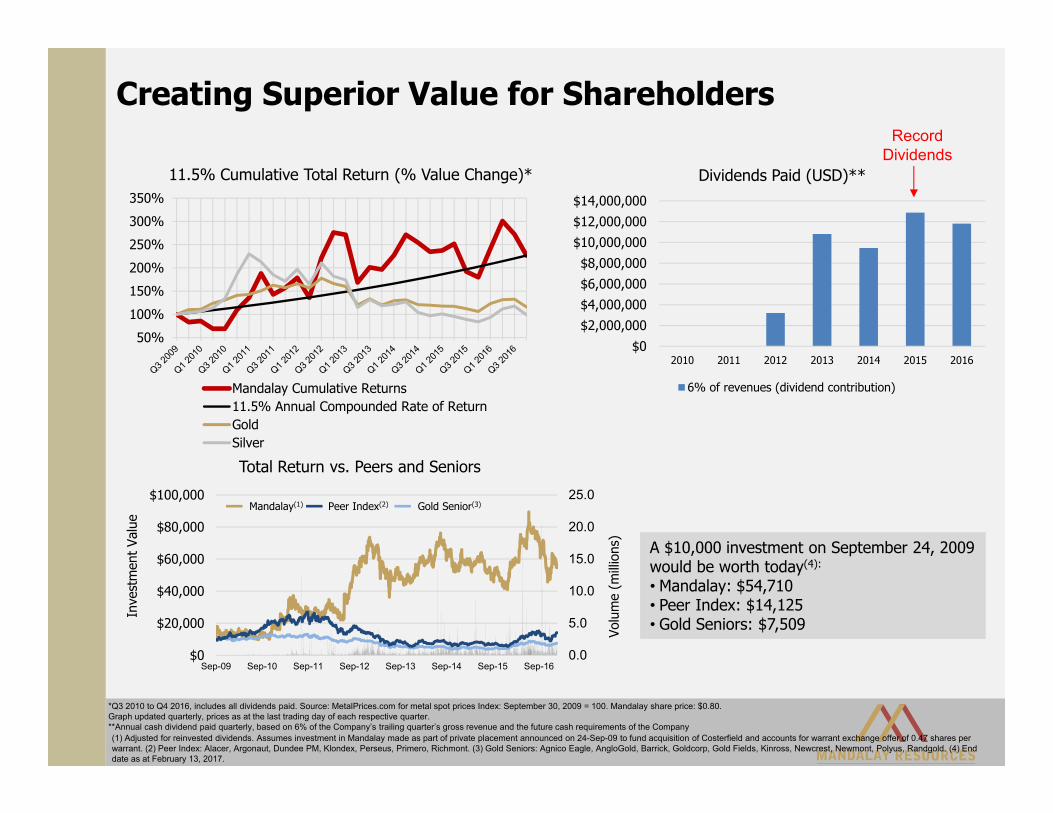
50%100%150%200%250%300%350%
Mandalay Cumulative Returns11.5% Annual Compounded Rate of ReturnGoldSilver
(1) Adjusted for reinvested dividends. Assumes investment in Mandalay made as part of private placement announced on 24-Sep-09 to fund acquisition of Costerfield and accounts for warrant exchange offer of 0.47 shares per warrant. (2) Peer Index: Alacer, Argonaut, Dundee PM, Klondex, Perseus, Primero, Richmont. (3) Gold Seniors: Agnico Eagle, AngloGold, Barrick, Goldcorp, Gold Fields, Kinross, Newcrest, Newmont, Polyus, Randgold. (4) End date as at February 13, 2017.
Creating Superior Value for Shareholders
$0$2,000,000$4,000,000$6,000,000$8,000,000
$10,000,000$12,000,000$14,000,000
2010 2011 2012 2013 2014 2015 2016
Dividends Paid (USD)**
6% of revenues (dividend contribution)
11.5% Cumulative Total Return (% Value Change)*
*Q3 2010 to Q4 2016, includes all dividends paid. Source: MetalPrices.com for metal spot prices Index: September 30, 2009 = 100. Mandalay share price: $0.80.Graph updated quarterly, prices as at the last trading day of each respective quarter. **Annual cash dividend paid quarterly, based on 6% of the Company’s trailing quarter’s gross revenue and the future cash requirements of the Company
0.0
5.0
10.0
15.0
20.0
25.0
$0
$20,000
$40,000
$60,000
$80,000
$100,000
Sep-09 Sep-10 Sep-11 Sep-12 Sep-13 Sep-14 Sep-15 Sep-16
Volu
me
(milli
ons)
Inve
stm
ent V
alue
Mandalay(1) Peer Index(2) Gold Senior(3)
Total Return vs. Peers and Seniors
A $10,000 investment on September 24, 2009 would be worth today(4):
• Mandalay: $54,710• Peer Index: $14,125• Gold Seniors: $7,509
A $10,000 investment on September 24, 2009 would be worth today(4):
• Mandalay: $54,710• Peer Index: $14,125• Gold Seniors: $7,509
Record Dividends
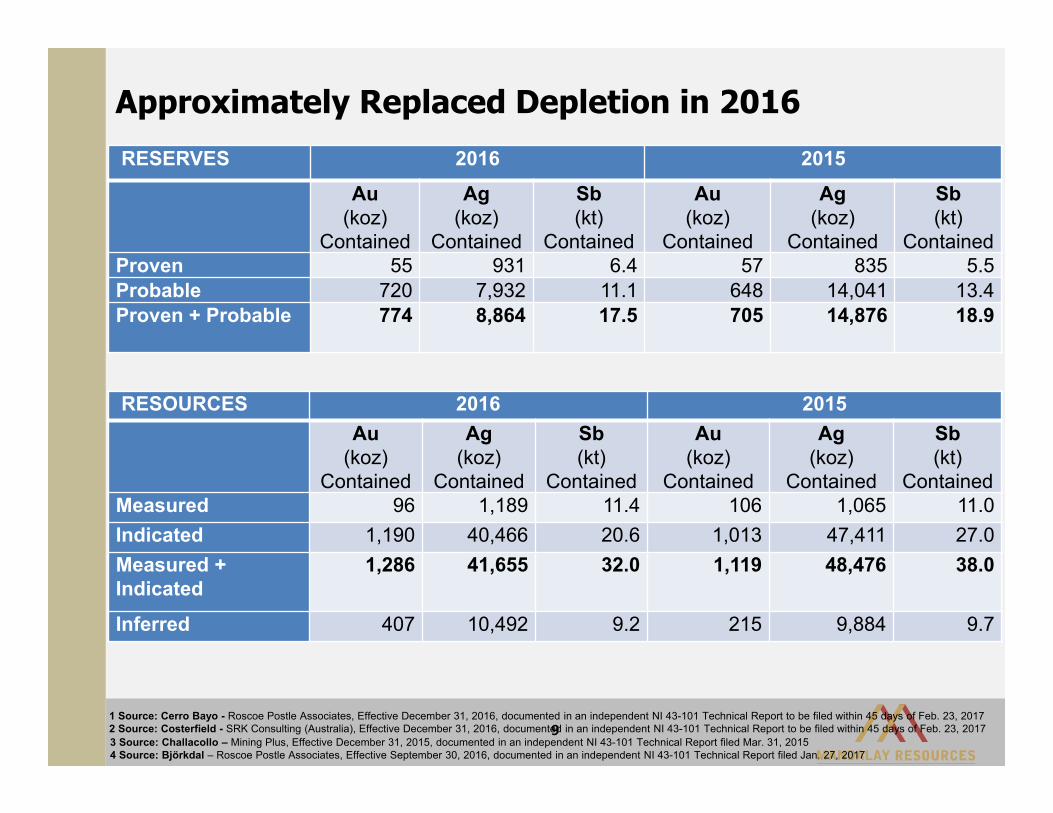
Approximately Replaced Depletion in 2016
9
RESERVES 2016 2015Au
(koz)Contained
Ag (koz)
Contained
Sb (kt)
Contained
Au(koz)
Contained
Ag(koz)
Contained
Sb (kt)
ContainedProven 55 931 6.4 57 835 5.5Probable 720 7,932 11.1 648 14,041 13.4Proven + Probable 774 8,864 17.5 705 14,876 18.9
RESOURCES 2016 2015Au
(koz)Contained
Ag (koz)
Contained
Sb (kt)
Contained
Au(koz)
Contained
Ag (koz)
Contained
Sb(kt)
ContainedMeasured 96 1,189 11.4 106 1,065 11.0Indicated 1,190 40,466 20.6 1,013 47,411 27.0Measured + Indicated
1,286 41,655 32.0 1,119 48,476 38.0
Inferred 407 10,492 9.2 215 9,884 9.7
1 Source: Cerro Bayo - Roscoe Postle Associates, Effective December 31, 2016, documented in an independent NI 43-101 Technical Report to be filed within 45 days of Feb. 23, 20172 Source: Costerfield - SRK Consulting (Australia), Effective December 31, 2016, documented in an independent NI 43-101 Technical Report to be filed within 45 days of Feb. 23, 20173 Source: Challacollo – Mining Plus, Effective December 31, 2015, documented in an independent NI 43-101 Technical Report filed Mar. 31, 20154 Source: Björkdal – Roscoe Postle Associates, Effective September 30, 2016, documented in an independent NI 43-101 Technical Report filed Jan. 27, 2017
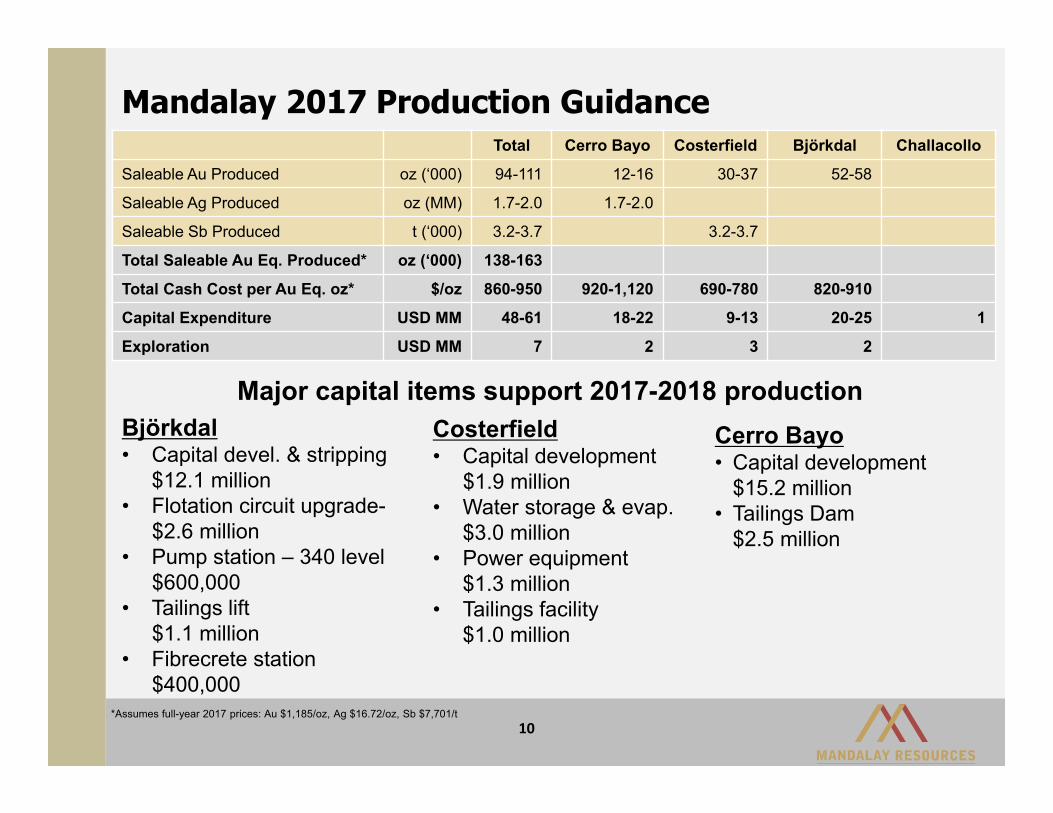
Mandalay 2017 Production Guidance
10
Total Cerro Bayo Costerfield Björkdal Challacollo
Saleable Au Produced oz (‘000) 94-111 12-16 30-37 52-58
Saleable Ag Produced oz (MM) 1.7-2.0 1.7-2.0
Saleable Sb Produced t (‘000) 3.2-3.7 3.2-3.7
Total Saleable Au Eq. Produced* oz (‘000) 138-163
Total Cash Cost per Au Eq. oz* $/oz 860-950 920-1,120 690-780 820-910
Capital Expenditure USD MM 48-61 18-22 9-13 20-25 1
Exploration USD MM 7 2 3 2
*Assumes full-year 2017 prices: Au $1,185/oz, Ag $16.72/oz, Sb $7,701/t
Björkdal• Capital devel. & stripping
$12.1 million• Flotation circuit upgrade-
$2.6 million• Pump station – 340 level
$600,000• Tailings lift
$1.1 million• Fibrecrete station
$400,000
Costerfield• Capital development
$1.9 million• Water storage & evap.
$3.0 million• Power equipment
$1.3 million• Tailings facility
$1.0 million
Cerro Bayo• Capital development
$15.2 million• Tailings Dam
$2.5 million
Major capital items support 2017-2018 production
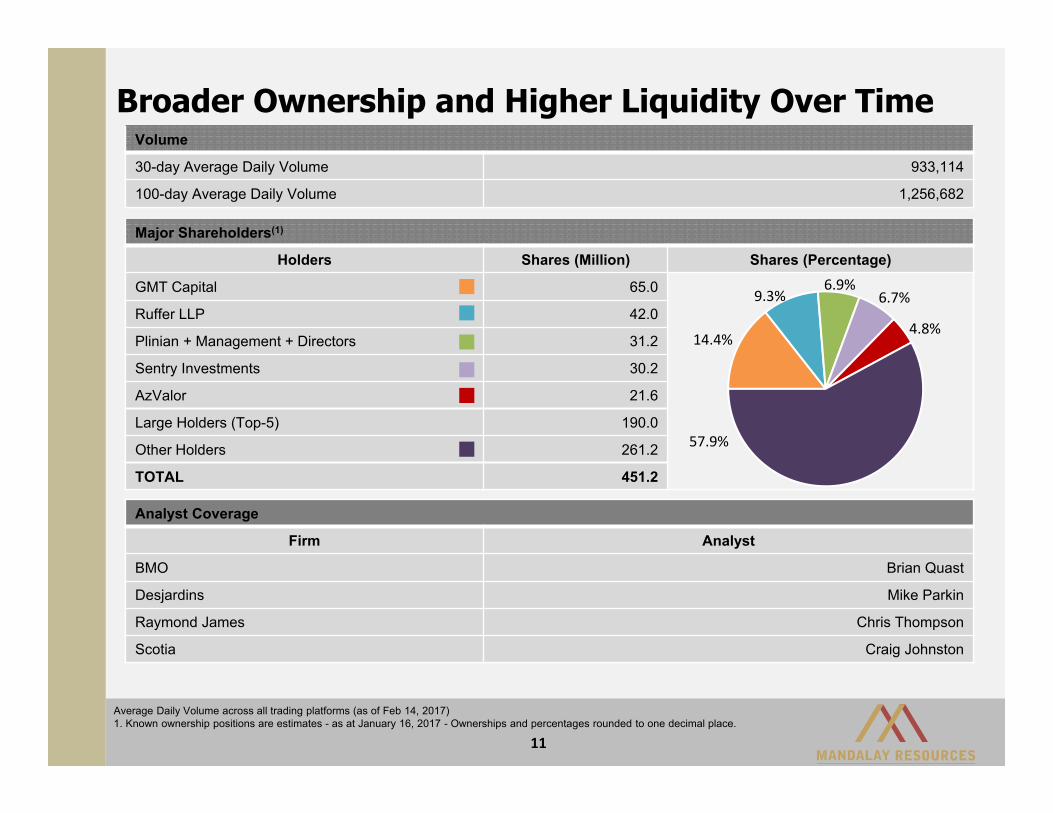
Broader Ownership and Higher Liquidity Over Time
Major Shareholders(1)
Holders Shares (Million) Shares (Percentage)
GMT Capital 65.0
Ruffer LLP 42.0
Plinian + Management + Directors 31.2
Sentry Investments 30.2
AzValor 21.6
Large Holders (Top-5) 190.0
Other Holders 261.2
TOTAL 451.2
Analyst Coverage
Firm Analyst
BMO Brian Quast
Desjardins Mike Parkin
Raymond James Chris Thompson
Scotia Craig Johnston
Volume
30-day Average Daily Volume 933,114
100-day Average Daily Volume 1,256,682
14.4%
9.3%6.9%
6.7%
4.8%
57.9%
11
Average Daily Volume across all trading platforms (as of Feb 14, 2017)1. Known ownership positions are estimates - as at January 16, 2017 - Ownerships and percentages rounded to one decimal place.
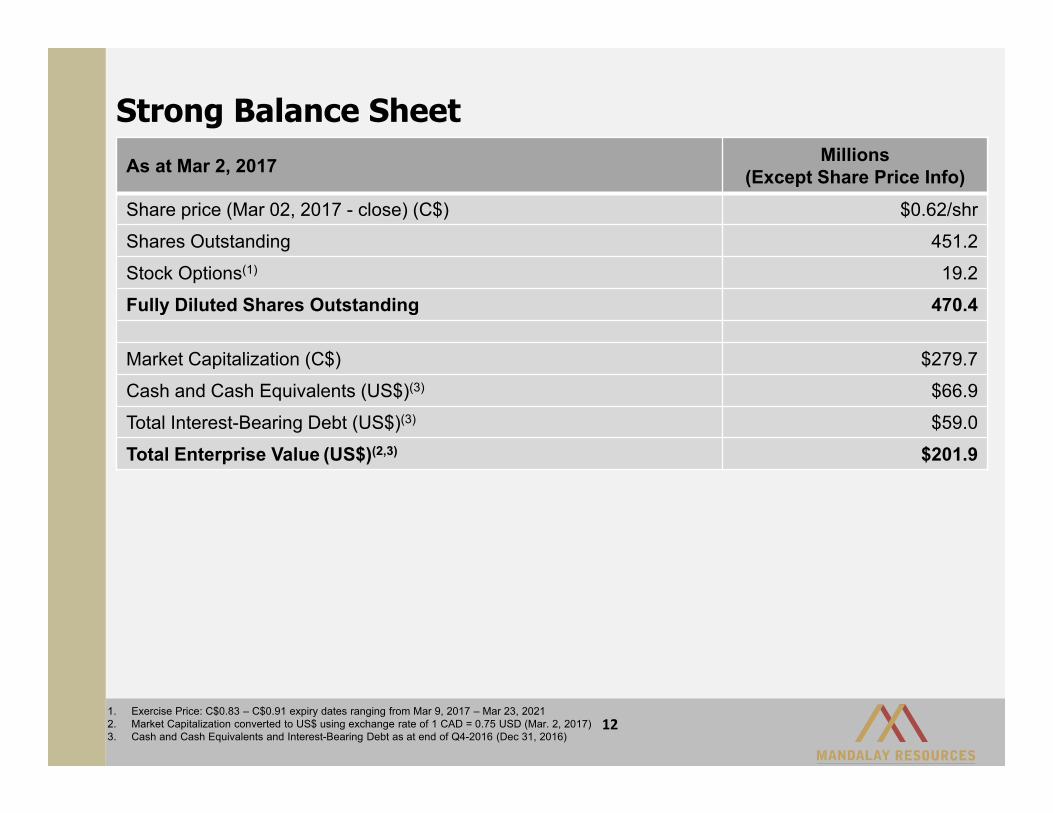
Strong Balance Sheet
121. Exercise Price: C$0.83 – C$0.91 expiry dates ranging from Mar 9, 2017 – Mar 23, 20212. Market Capitalization converted to US$ using exchange rate of 1 CAD = 0.75 USD (Mar. 2, 2017)3. Cash and Cash Equivalents and Interest-Bearing Debt as at end of Q4-2016 (Dec 31, 2016)
As at Mar 2, 2017 Millions(Except Share Price Info)
Share price (Mar 02, 2017 - close) (C$) $0.62/shr
Shares Outstanding 451.2
Stock Options(1) 19.2
Fully Diluted Shares Outstanding 470.4
Market Capitalization (C$) $279.7
Cash and Cash Equivalents (US$)(3) $66.9
Total Interest-Bearing Debt (US$)(3) $59.0
Total Enterprise Value (US$)(2,3) $201.9
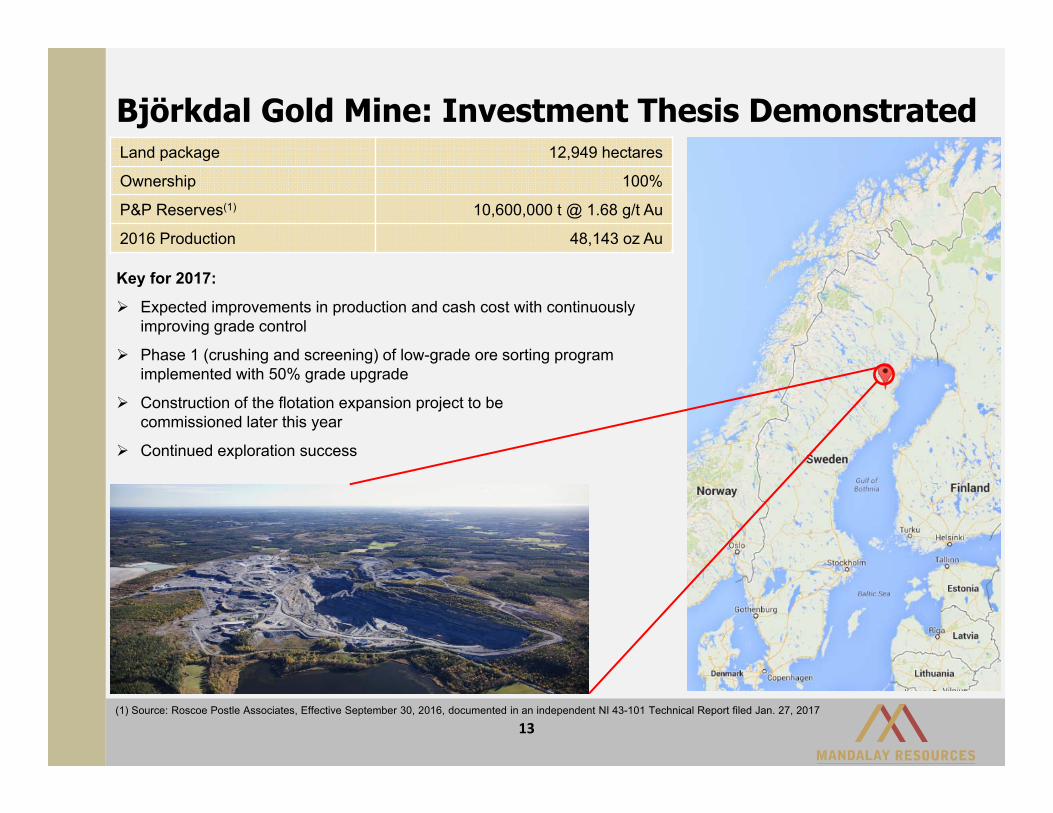
Björkdal Gold Mine: Investment Thesis DemonstratedLand package 12,949 hectares
Ownership 100%
P&P Reserves(1) 10,600,000 t @ 1.68 g/t Au
2016 Production 48,143 oz Au
13
Key for 2017:
Expected improvements in production and cash cost with continuously improving grade control
Phase 1 (crushing and screening) of low-grade ore sorting program implemented with 50% grade upgrade
Construction of the flotation expansion project to be commissioned later this year
Continued exploration success
(1) Source: Roscoe Postle Associates, Effective September 30, 2016, documented in an independent NI 43-101 Technical Report filed Jan. 27, 2017
14
Björkdal Operating Performance and Improvements
$0$5$10$15$20$25$30
0
100,000
200,000
300,000
400,000
Q4‐14 Q1‐15 Q2‐15 Q3‐15 Q4‐15 Q1‐16 Q2‐16 Q3‐16 Q4‐16
$/ Ton
ne
Tonn
es Per Qua
rter
Mining Rate and Unit Cost
t Mined Cost/ t Mined
$0
$2
$4
$6
$8
$10
0
100,000
200,000
300,000
400,000
Q4‐14 Q1‐15 Q2‐15 Q3‐15 Q4‐15 Q1‐16 Q2‐16 Q3‐16 Q4‐16
$/ Ton
ne
Tonn
es Per Qua
rter
Processing Rate and Unit Cost
t Processed Cost/ t Processed
$0
$500
$1,000
$1,500
0
5,000
10,000
15,000
Q4‐14 Q1‐15 Q2‐15 Q3‐15 Q4‐15 Q1‐16 Q2‐16 Q3‐16 Q4‐16
$/ oz A
u
Oun
ces G
old Pe
r Qua
rter
Saleable Gold Produced and Unit Cost
Au oz Cost/ oz Au
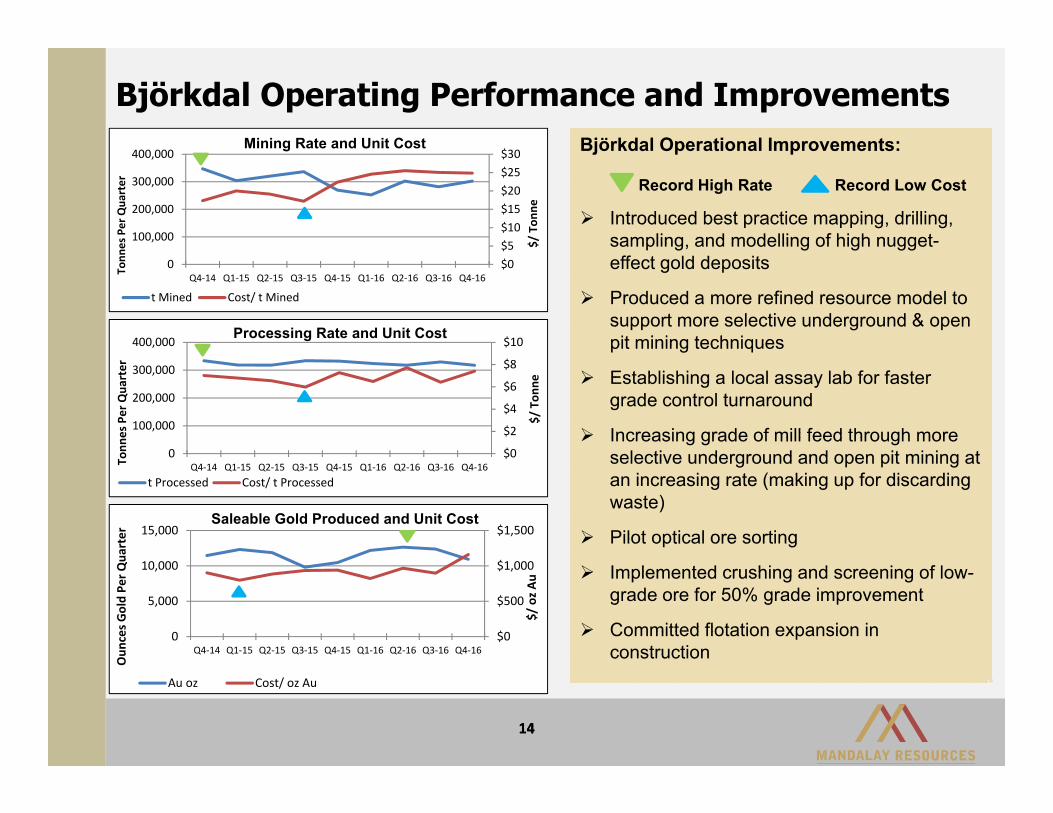
Björkdal Operational Improvements:
Record High Rate Record Low Cost
Introduced best practice mapping, drilling, sampling, and modelling of high nugget-effect gold deposits
Produced a more refined resource model to support more selective underground & open pit mining techniques
Establishing a local assay lab for faster grade control turnaround
Increasing grade of mill feed through more selective underground and open pit mining at an increasing rate (making up for discarding waste)
Pilot optical ore sorting
Implemented crushing and screening of low-grade ore for 50% grade improvement
Committed flotation expansion in construction
14
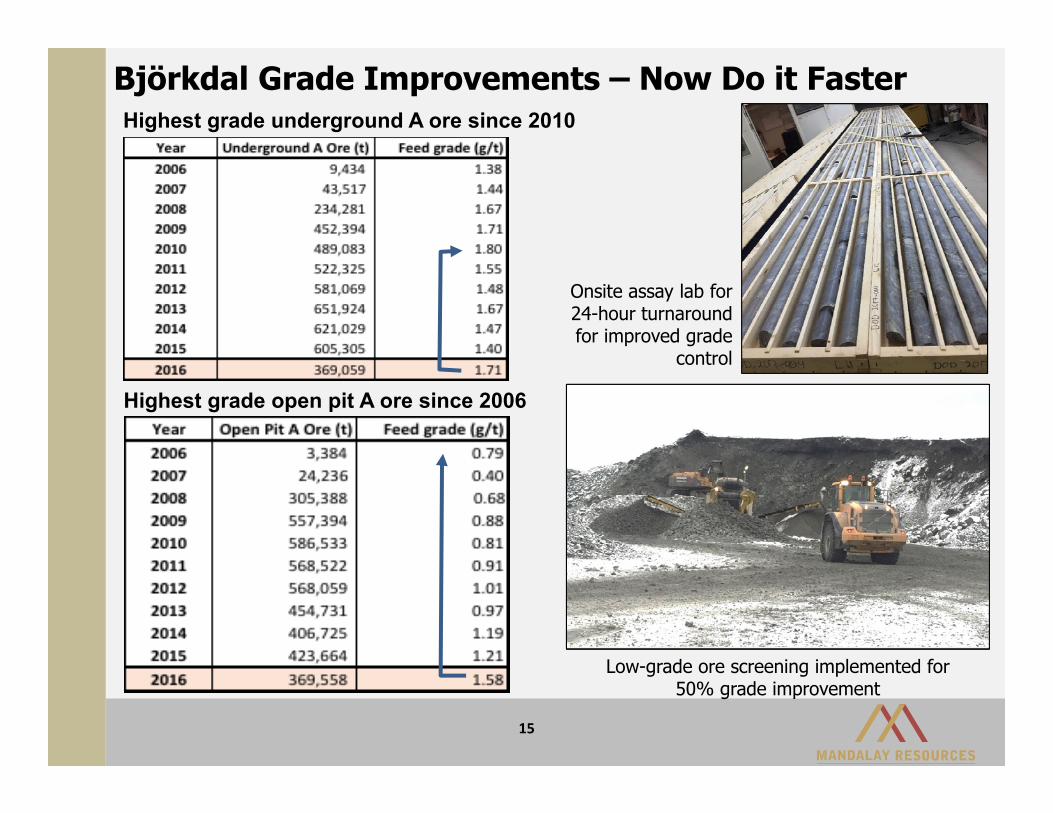
Björkdal Grade Improvements – Now Do it Faster
Low-grade ore screening implemented for 50% grade improvement
15
Onsite assay lab for 24-hour turnaround for improved grade
control
Highest grade open pit A ore since 2006
Highest grade underground A ore since 2010
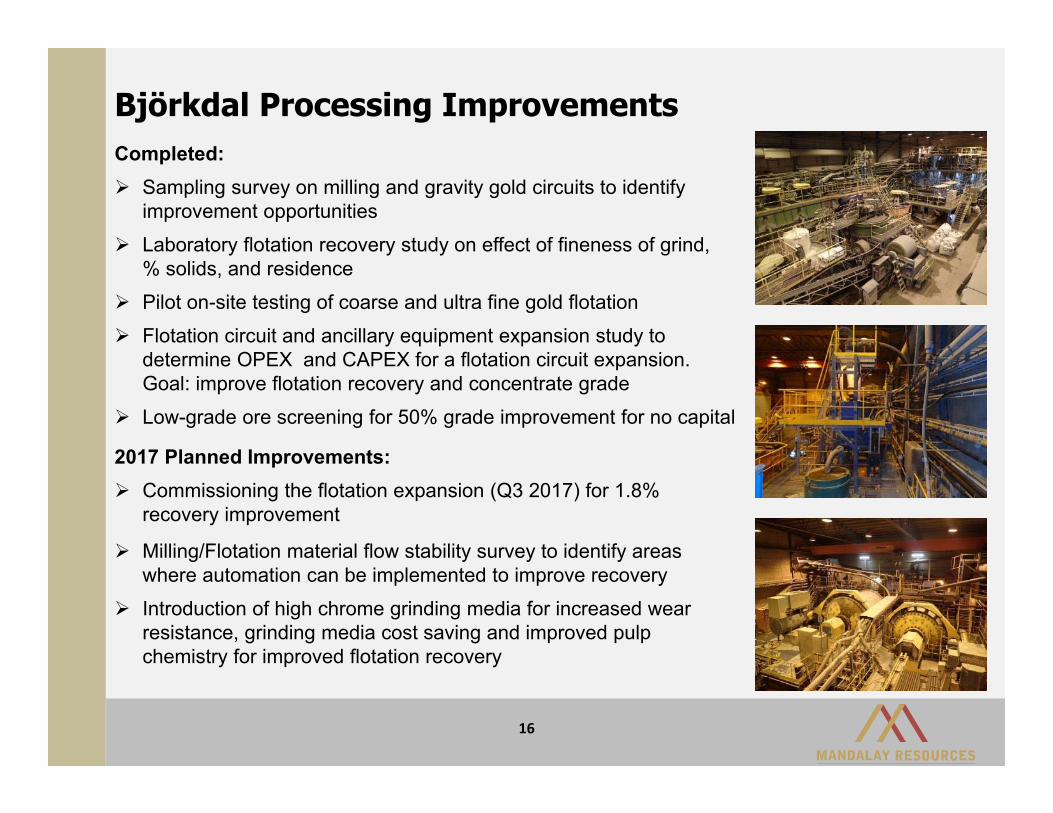
Björkdal Processing Improvements
16
Completed: Sampling survey on milling and gravity gold circuits to identify
improvement opportunities Laboratory flotation recovery study on effect of fineness of grind,
% solids, and residence Pilot on-site testing of coarse and ultra fine gold flotation Flotation circuit and ancillary equipment expansion study to
determine OPEX and CAPEX for a flotation circuit expansion. Goal: improve flotation recovery and concentrate grade
Low-grade ore screening for 50% grade improvement for no capital
2017 Planned Improvements: Commissioning the flotation expansion (Q3 2017) for 1.8%
recovery improvement
Milling/Flotation material flow stability survey to identify areas where automation can be implemented to improve recovery
Introduction of high chrome grinding media for increased wear resistance, grinding media cost saving and improved pulp chemistry for improved flotation recovery
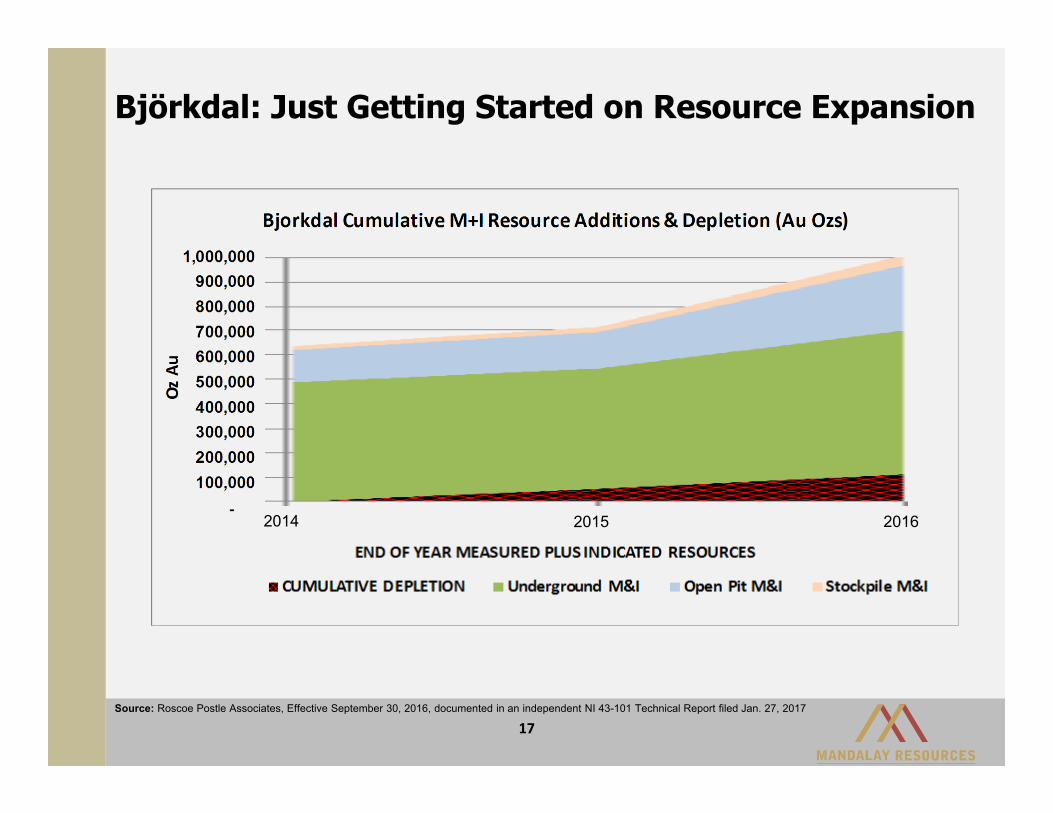
Björkdal: Just Getting Started on Resource Expansion
17Source: Roscoe Postle Associates, Effective September 30, 2016, documented in an independent NI 43-101 Technical Report filed Jan. 27, 2017
2014 2015 2016
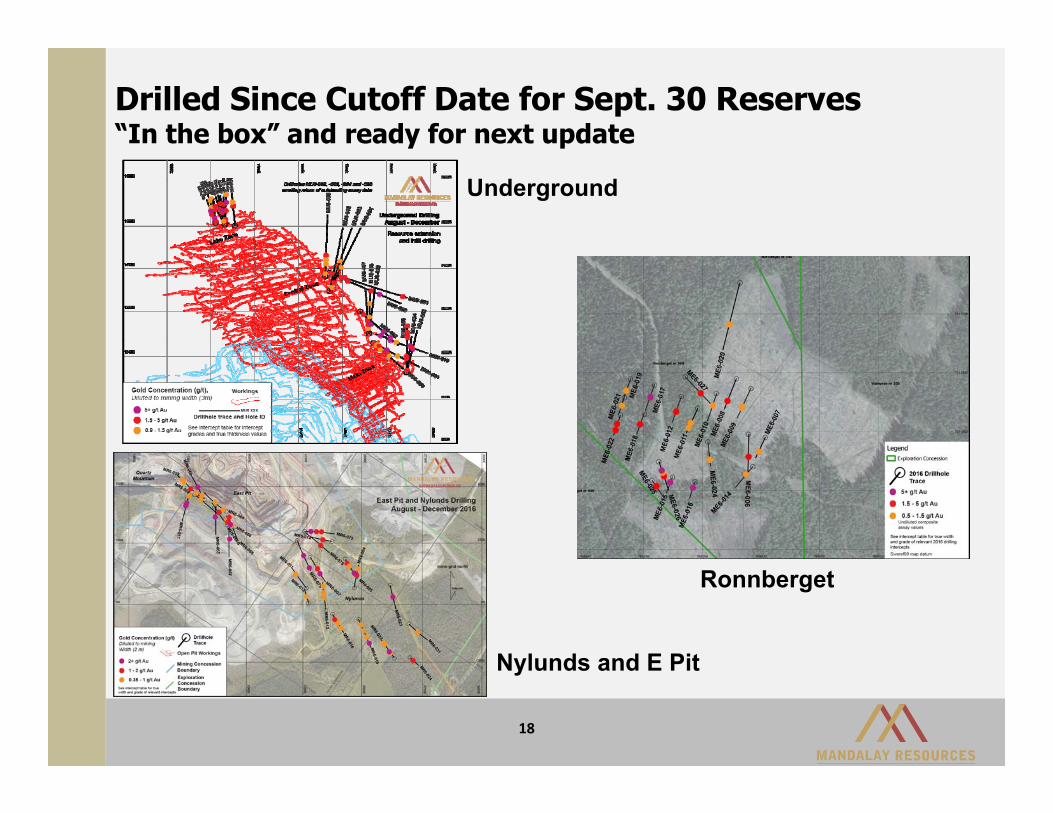
Drilled Since Cutoff Date for Sept. 30 Reserves“In the box” and ready for next update
18
Ronnberget
Nylunds and E Pit
Underground
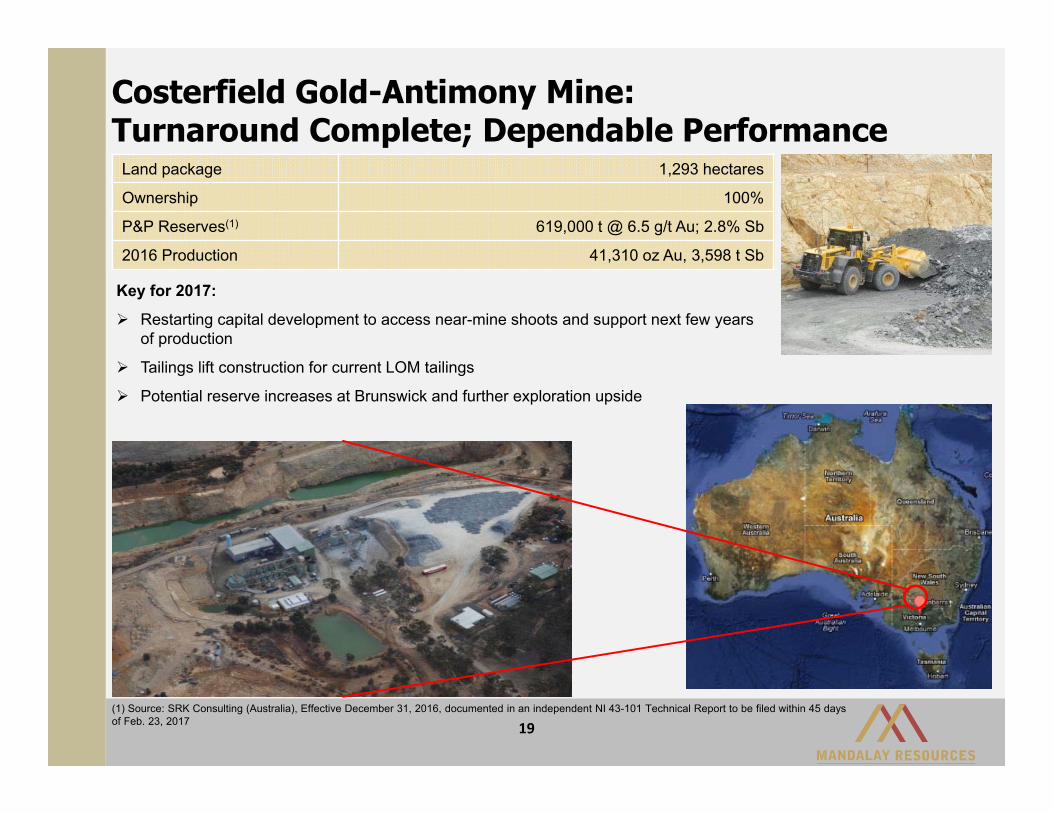
Costerfield Gold-Antimony Mine:Turnaround Complete; Dependable Performance
Land package 1,293 hectares
Ownership 100%
P&P Reserves(1) 619,000 t @ 6.5 g/t Au; 2.8% Sb
2016 Production 41,310 oz Au, 3,598 t Sb
19
Key for 2017:
Restarting capital development to access near-mine shoots and support next few years of production
Tailings lift construction for current LOM tailings
Potential reserve increases at Brunswick and further exploration upside
(1) Source: SRK Consulting (Australia), Effective December 31, 2016, documented in an independent NI 43-101 Technical Report to be filed within 45 days of Feb. 23, 2017
20
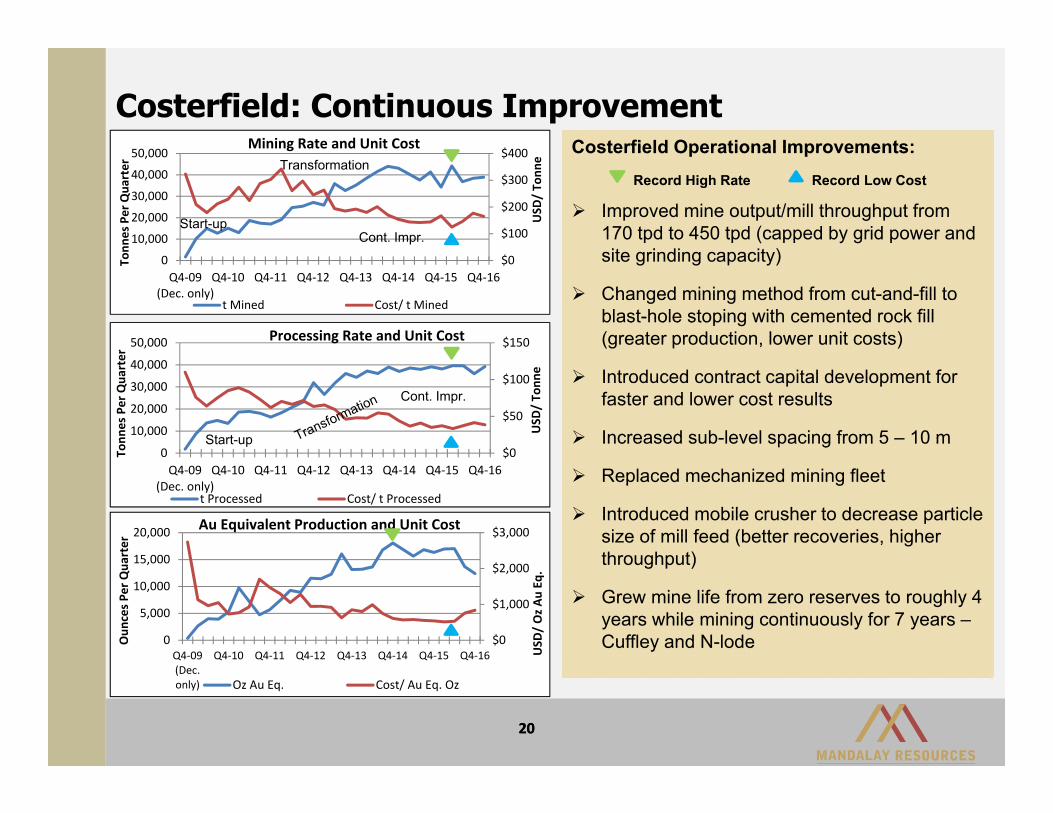
Costerfield: Continuous Improvement
$0
$100
$200
$300
$400
0
10,000
20,000
30,000
40,000
50,000
Q4‐09(Dec. only)
Q4‐10 Q4‐11 Q4‐12 Q4‐13 Q4‐14 Q4‐15 Q4‐16
USD
/ To
nne
Tonn
es Per Qua
rter
Mining Rate and Unit Cost
t Mined Cost/ t Mined
$0
$50
$100
$150
0
10,000
20,000
30,000
40,000
50,000
Q4‐09(Dec. only)
Q4‐10 Q4‐11 Q4‐12 Q4‐13 Q4‐14 Q4‐15 Q4‐16
USD
/ To
nne
Tonn
es Per Qua
rter
Processing Rate and Unit Cost
t Processed Cost/ t Processed
Cont. Impr.
Start-up
$0
$1,000
$2,000
$3,000
0
5,000
10,000
15,000
20,000
Q4‐09(Dec.only)
Q4‐10 Q4‐11 Q4‐12 Q4‐13 Q4‐14 Q4‐15 Q4‐16 USD
/ Oz A
u Eq
.
Oun
ces P
er Qua
rter
Au Equivalent Production and Unit Cost
Oz Au Eq. Cost/ Au Eq. Oz
Costerfield Operational Improvements:Record High Rate Record Low Cost
Improved mine output/mill throughput from 170 tpd to 450 tpd (capped by grid power and site grinding capacity)
Changed mining method from cut-and-fill to blast-hole stoping with cemented rock fill (greater production, lower unit costs)
Introduced contract capital development for faster and lower cost results
Increased sub-level spacing from 5 – 10 m
Replaced mechanized mining fleet
Introduced mobile crusher to decrease particle size of mill feed (better recoveries, higher throughput)
Grew mine life from zero reserves to roughly 4 years while mining continuously for 7 years –Cuffley and N-lode
20
Start-up
Transformation
Cont. Impr.
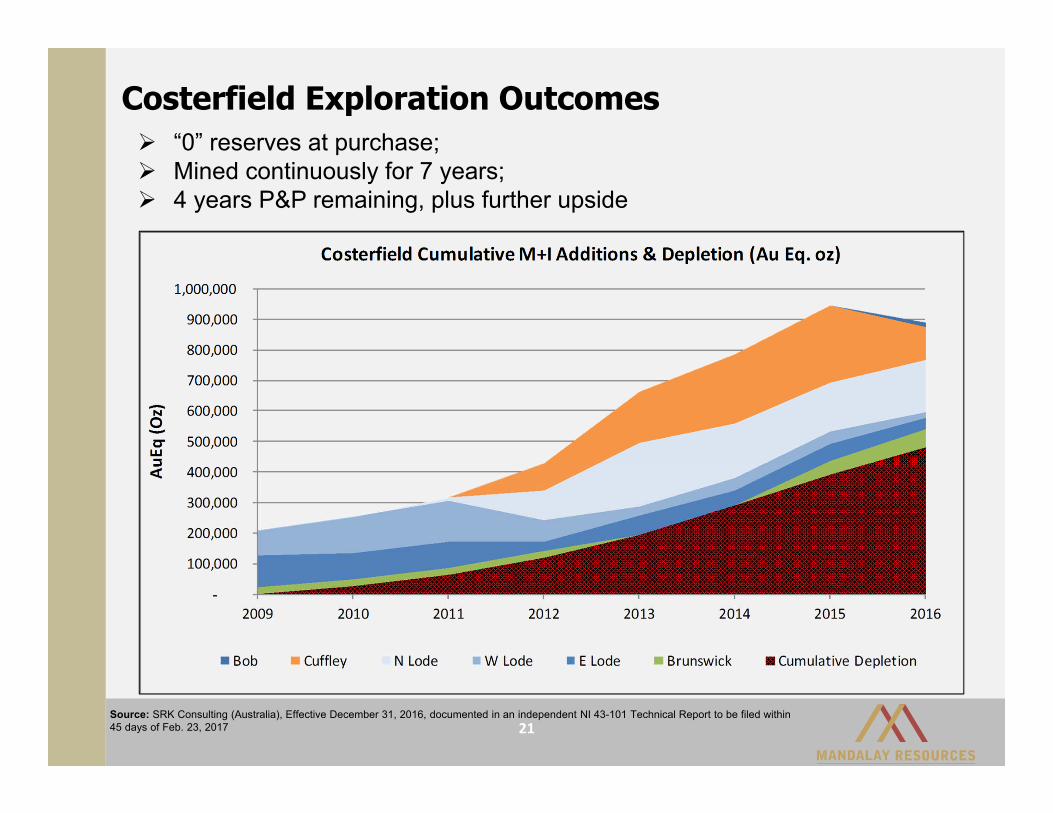
Costerfield Exploration Outcomes
21
“0” reserves at purchase; Mined continuously for 7 years; 4 years P&P remaining, plus further upside
Source: SRK Consulting (Australia), Effective December 31, 2016, documented in an independent NI 43-101 Technical Report to be filed within 45 days of Feb. 23, 2017
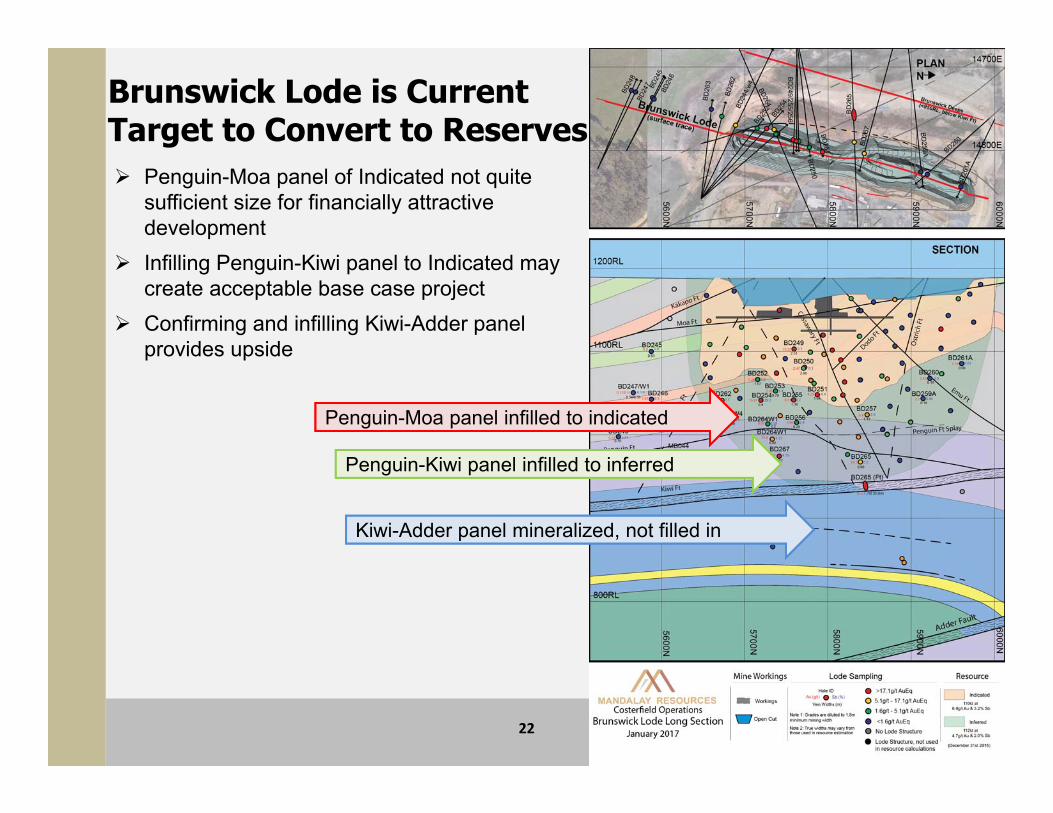
Brunswick Lode is Current Target to Convert to Reserves
22
Penguin-Moa panel infilled to indicated
Penguin-Kiwi panel infilled to inferred
Kiwi-Adder panel mineralized, not filled in
Penguin-Moa panel of Indicated not quite sufficient size for financially attractive development
Infilling Penguin-Kiwi panel to Indicated may create acceptable base case project
Confirming and infilling Kiwi-Adder panel provides upside
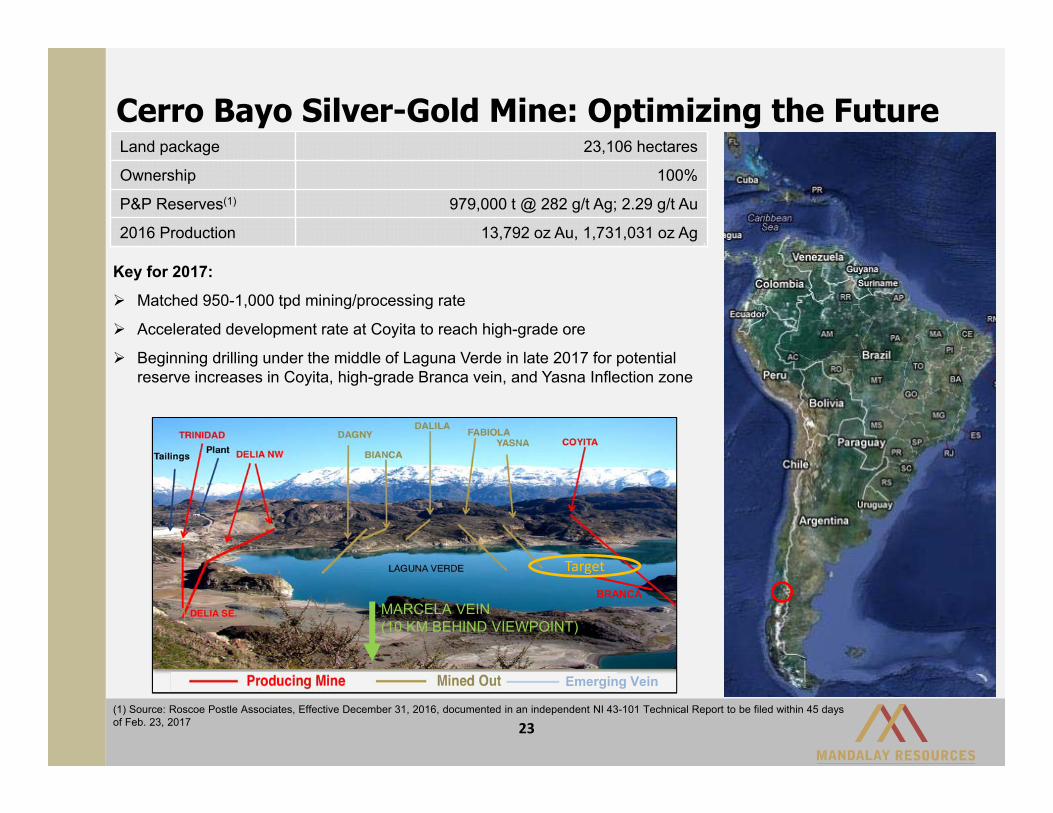
Cerro Bayo Silver-Gold Mine: Optimizing the FutureLand package 23,106 hectares
Ownership 100%
P&P Reserves(1) 979,000 t @ 282 g/t Ag; 2.29 g/t Au
2016 Production 13,792 oz Au, 1,731,031 oz Ag
23
BRANCA
Emerging Vein
Key for 2017:
Matched 950-1,000 tpd mining/processing rate
Accelerated development rate at Coyita to reach high-grade ore
Beginning drilling under the middle of Laguna Verde in late 2017 for potential reserve increases in Coyita, high-grade Branca vein, and Yasna Inflection zone
Target
(1) Source: Roscoe Postle Associates, Effective December 31, 2016, documented in an independent NI 43-101 Technical Report to be filed within 45 days of Feb. 23, 2017
MARCELA VEIN (10 KM BEHIND VIEWPOINT)
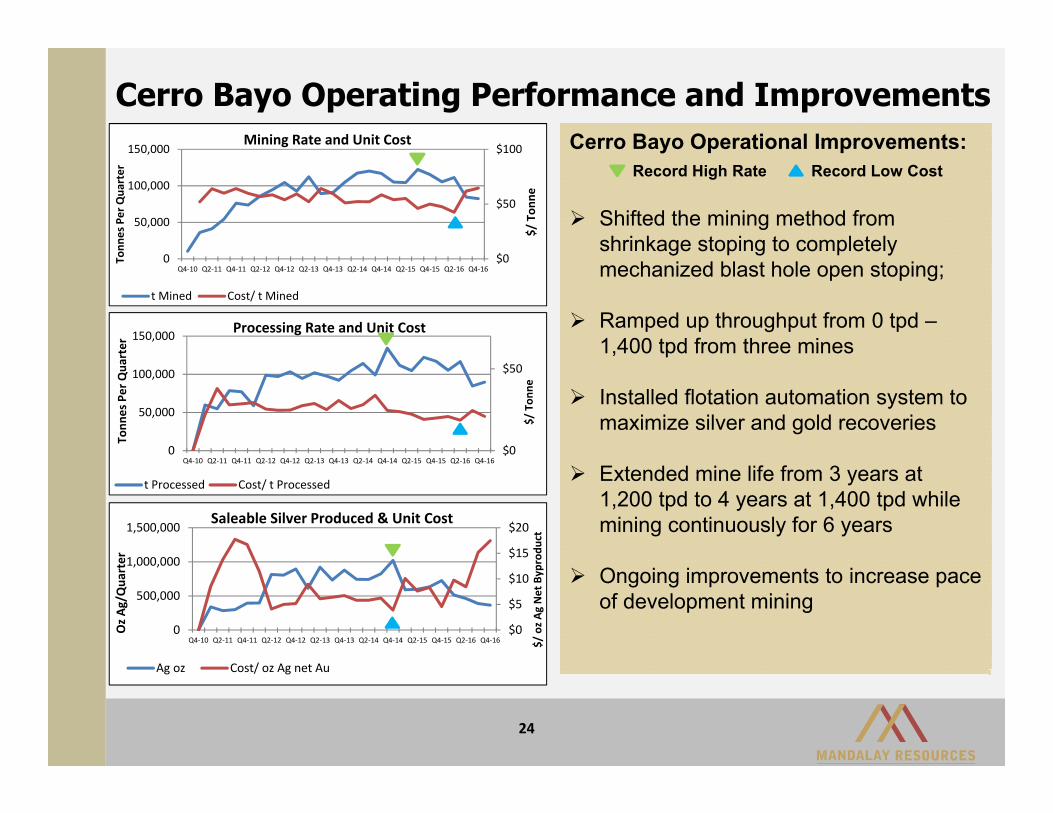
Cerro Bayo Operating Performance and ImprovementsCerro Bayo Operational Improvements:
Shifted the mining method from shrinkage stoping to completely mechanized blast hole open stoping;
Ramped up throughput from 0 tpd –1,400 tpd from three mines
Installed flotation automation system to maximize silver and gold recoveries
Extended mine life from 3 years at 1,200 tpd to 4 years at 1,400 tpd while mining continuously for 6 years
Ongoing improvements to increase pace of development mining
Cerro Bayo Operational Improvements:
Shifted the mining method from shrinkage stoping to completely mechanized blast hole open stoping;
Ramped up throughput from 0 tpd –1,400 tpd from three mines
Installed flotation automation system to maximize silver and gold recoveries
Extended mine life from 3 years at 1,200 tpd to 4 years at 1,400 tpd while mining continuously for 6 years
Ongoing improvements to increase pace of development mining
24
$0
$50
$100
0
50,000
100,000
150,000
Q4‐10 Q2‐11 Q4‐11 Q2‐12 Q4‐12 Q2‐13 Q4‐13 Q2‐14 Q4‐14 Q2‐15 Q4‐15 Q2‐16 Q4‐16
$/ Ton
ne
Tonn
es Per Qua
rter
Mining Rate and Unit Cost
t Mined Cost/ t Mined
$0
$50
0
50,000
100,000
150,000
Q4‐10 Q2‐11 Q4‐11 Q2‐12 Q4‐12 Q2‐13 Q4‐13 Q2‐14 Q4‐14 Q2‐15 Q4‐15 Q2‐16 Q4‐16
$/ Ton
ne
Tonn
es Per Qua
rter
Processing Rate and Unit Cost
t Processed Cost/ t Processed
$0
$5
$10
$15
$20
0
500,000
1,000,000
1,500,000
Q4‐10 Q2‐11 Q4‐11 Q2‐12 Q4‐12 Q2‐13 Q4‐13 Q2‐14 Q4‐14 Q2‐15 Q4‐15 Q2‐16 Q4‐16 $/ oz A
g Net Byp
rodu
ct
Oz A
g/Qua
rter
Saleable Silver Produced & Unit Cost
Ag oz Cost/ oz Ag net Au
Record High Rate Record Low Cost
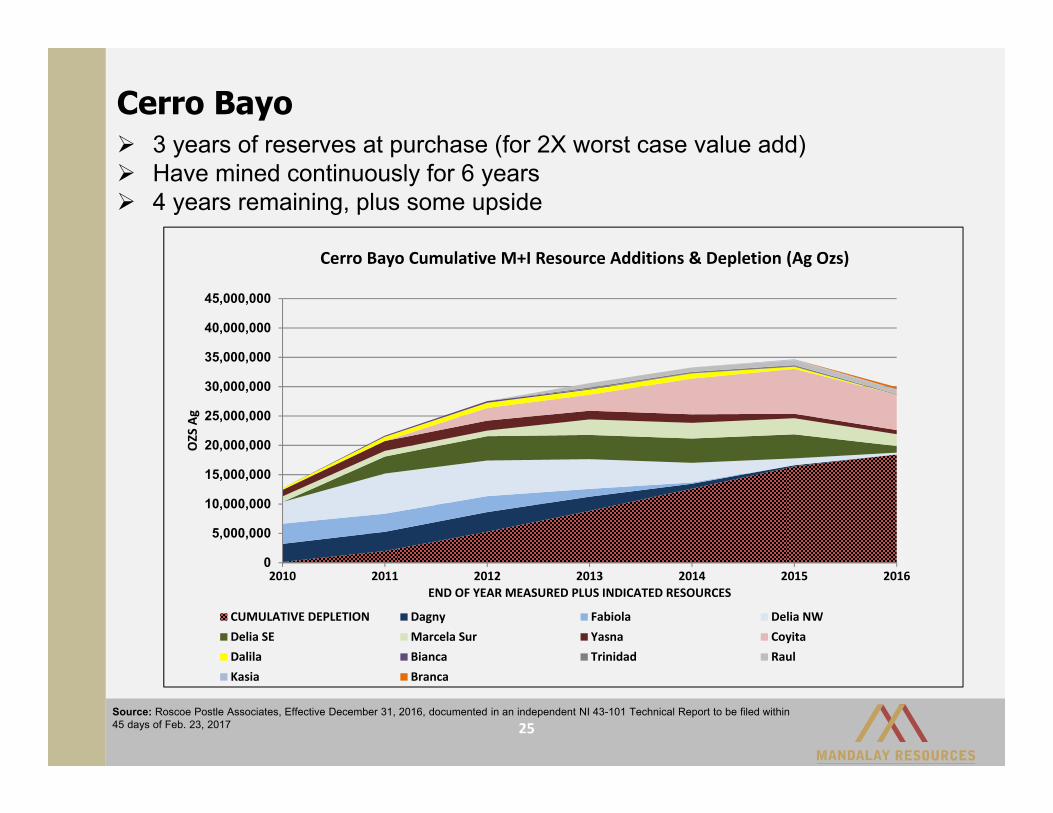
Cerro Bayo
25
3 years of reserves at purchase (for 2X worst case value add) Have mined continuously for 6 years 4 years remaining, plus some upside
0
5,000,000
10,000,000
15,000,000
20,000,000
25,000,000
30,000,000
35,000,000
40,000,000
45,000,000
2010 2011 2012 2013 2014 2015 2016
OZS Ag
END OF YEAR MEASURED PLUS INDICATED RESOURCES
Cerro Bayo Cumulative M+I Resource Additions & Depletion (Ag Ozs)
CUMULATIVE DEPLETION Dagny Fabiola Delia NWDelia SE Marcela Sur Yasna CoyitaDalila Bianca Trinidad RaulKasia Branca
Source: Roscoe Postle Associates, Effective December 31, 2016, documented in an independent NI 43-101 Technical Report to be filed within 45 days of Feb. 23, 2017
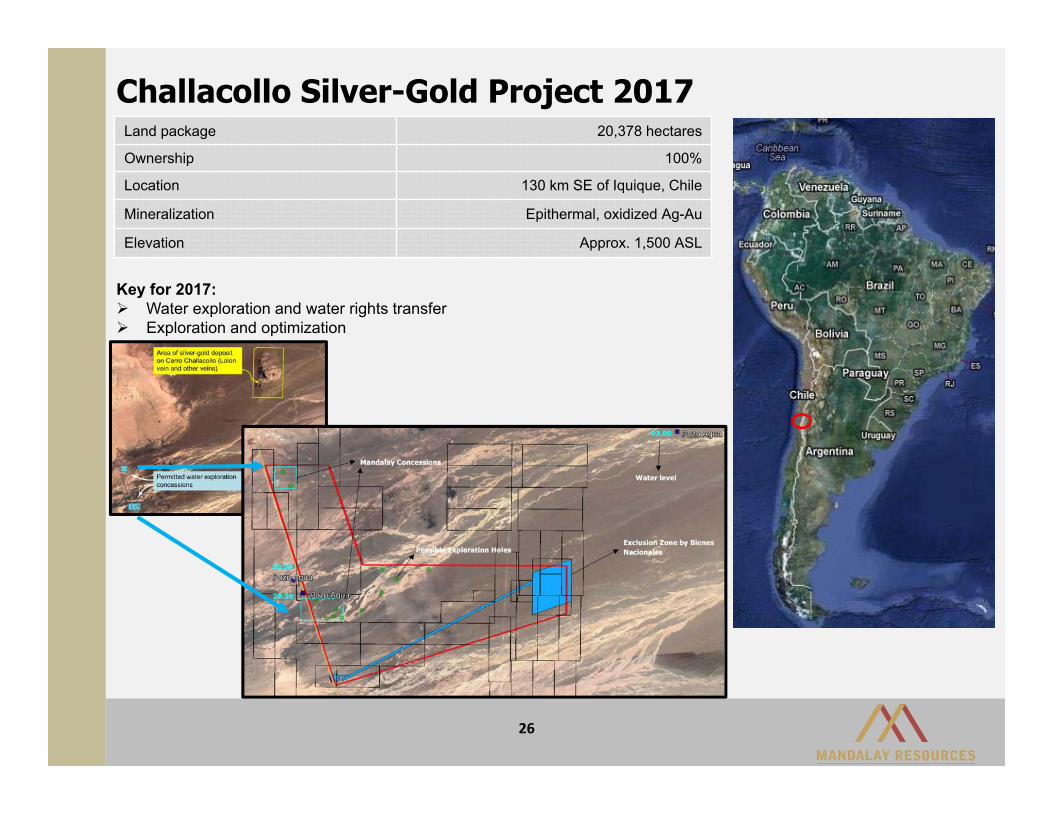
Challacollo Silver-Gold Project 2017
26
Key for 2017: Water exploration and water rights transfer Exploration and optimization
Land package 20,378 hectares
Ownership 100%
Location 130 km SE of Iquique, Chile
Mineralization Epithermal, oxidized Ag-Au
Elevation Approx. 1,500 ASL
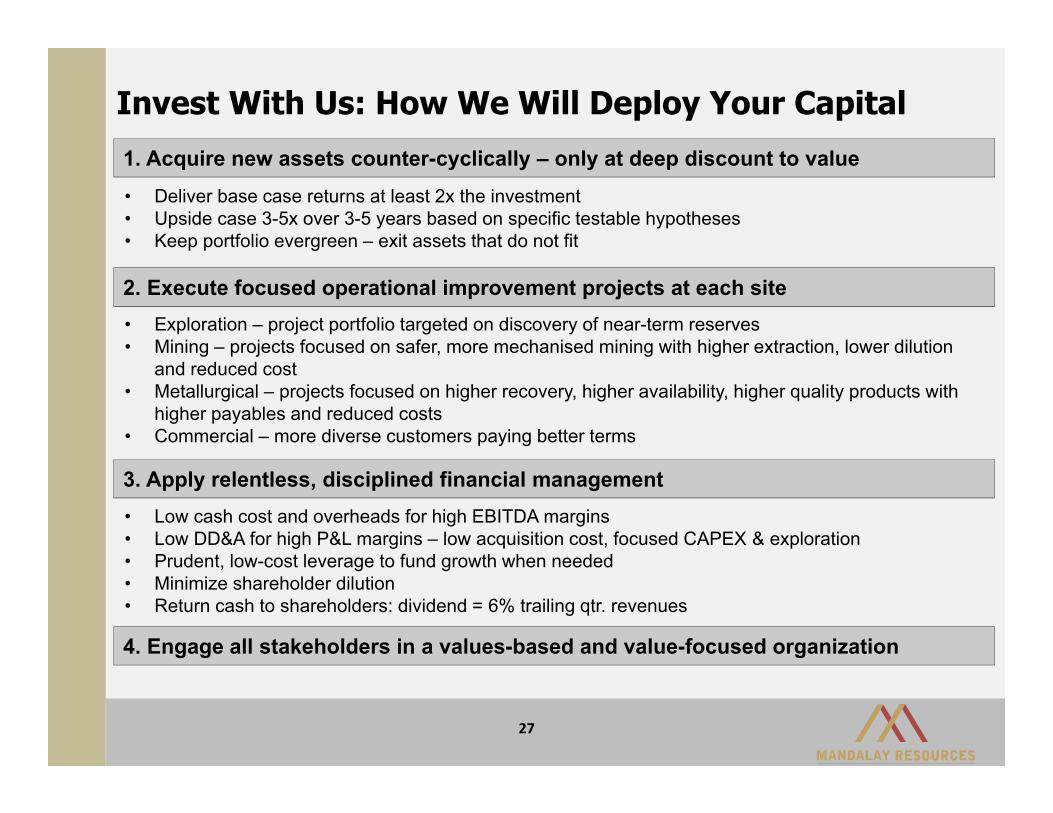
Invest With Us: How We Will Deploy Your Capital1. Acquire new assets counter-cyclically – only at deep discount to value• Deliver base case returns at least 2x the investment• Upside case 3-5x over 3-5 years based on specific testable hypotheses• Keep portfolio evergreen – exit assets that do not fit
2. Execute focused operational improvement projects at each site
3. Apply relentless, disciplined financial management
• Exploration – project portfolio targeted on discovery of near-term reserves• Mining – projects focused on safer, more mechanised mining with higher extraction, lower dilution
and reduced cost• Metallurgical – projects focused on higher recovery, higher availability, higher quality products with
higher payables and reduced costs• Commercial – more diverse customers paying better terms
• Low cash cost and overheads for high EBITDA margins• Low DD&A for high P&L margins – low acquisition cost, focused CAPEX & exploration • Prudent, low-cost leverage to fund growth when needed• Minimize shareholder dilution• Return cash to shareholders: dividend = 6% trailing qtr. revenues
4. Engage all stakeholders in a values-based and value-focused organization
27
BUILDING VALUEACROSS THE CYCLE
MANDALAY RESOURCES
For more information, please contact:
Greg DiTomasoDirector, Investor RelationsTel: 647.260.1566Email: [email protected] Website: www.mandalayresources.comTwitter: @MandalayAuAg
For more information, please contact:
Greg DiTomasoDirector, Investor RelationsTel: 647.260.1566Email: [email protected] Website: www.mandalayresources.comTwitter: @MandalayAuAg