Embed Size (px)
Citation preview
2016 Q4 and Year-End Results
MARCH 16, 2017
Certain statements contained in this presentation may be deemed "forward-looking statements". All statements in this release, other than statements of historical fact, that address future events, developments or performancethat Osisko (the “Corporation”) expect to occur, including managements’ expectations regarding the Corporation’s growth, results of operations, estimated future revenues, statements or estimates of mineral resources and reserves,requirements for additional capital, future demand for and prices of commodities, business prospects and opportunities are forward looking statements. Forward looking statements are statements that are not historical facts and aregenerally, but not always, identified by the words "expects", "plans", "anticipates", "believes", "intends", "estimates", "projects", "potential", "scheduled" and similar expressions or variations (including negative variations), or that events orconditions "will", "would", "may", "could" or "should" occur including, without limitation, that all conditions precedent a transaction will be met and the realization of the anticipated benefits deriving therefrom for shareholders of theCorporation, the view on the quality and the potential of the Corporation’s assets, production forecasts for properties in which the Corporation holds a royalty or other interest. Although the Corporation believes the expectations expressed insuch forward-looking statements are based on reasonable assumptions, such statements involve known and unknown risks, uncertainties and other factors and are not guarantees of future performance and actual results may accordinglydiffer materially from those in forward looking statements. Factors that could cause the actual results to differ materially from those in forward-looking statements include, without limitation: fluctuations in the prices of the commodities thatdrive royalties held by the Corporation; fluctuations in the value of the Canadian dollar relative to the U.S. dollar; risks related to the operators of the properties in which the Corporation holds a royalty or other interest; the unfavorableoutcome of litigation relating to any of the properties in which Osisko holds a royalty or other interest; development, permitting, infrastructure, operating or technical difficulties on any of the properties in which the Corporation hold a royaltyor other interest; rate and timing of production differences from mineral resource estimates or production forecasts by operators of properties in which the Corporation hold a royalty or other interest; risks and hazards associated with thebusiness of exploring, development and mining on any of the properties in which the Corporation hold a royalty or other interest, including, but not limited to unusual or unexpected geological and metallurgical conditions, slope failures orcave-ins, flooding and other natural disasters or civil unrest; regulatory changes by national and local government, including corporate law, permitting and licensing regimes and taxation policies; regulations and political or economicdevelopments in any of the countries where properties in which the Corporation hold a royalty or other interest are located or through which they are held); continued availability of capital and financing and general economic, market orbusiness conditions; business opportunities that become available to, or are pursued by the Corporation; the impossibility to acquire royalties and to fund precious metal streams; other uninsured risks. The forward looking statementscontained in this presentation are based upon assumptions management believes to be reasonable, including, without limitation: the ongoing operation of the properties in which the Corporation holds a royalty or other interest by theowners or operators of such properties in a manner consistent with past practice; the accuracy of public statements and disclosures made by the owners or operators of such underlying properties; no material adverse change in the marketprice of the commodities that underlie the asset portfolio; no adverse development in respect of any significant property in which the Corporation holds a royalty, stream or other interest; the accuracy of publicly disclosed expectations forthe development of underlying properties that are not yet in production; and the absence of any other factors that could cause actions, events or results to differ from those anticipated, estimated or intended. For additional information onrisks, uncertainties and assumptions, please refer to the Corporation’s most recent Annual Information Form filed on SEDAR at www.sedar.com. The Corporation cautions that the foregoing list of risk and uncertainties is not exhaustive.Investors and others who base themselves on the forward looking statements contained herein should carefully consider the above factors as well as the uncertainties they represent and the risk they entail. The Corporation believes that theexpectations reflected in those forward-looking statements are reasonable, but no assurance can be given that these expectations will prove to be correct and such forward-looking statements included in this presentation should not beunduly relied upon. These statements speak only as of the date of this presentation. The Corporation undertakes no obligation to publicly update or revise any forward-looking statements, whether as a result of new information, futureevents or otherwise, other than as required by applicable law.
Safe Harbour Statement
This PowerPoint presentation has been prepared for informational purposes only in order to assist prospective investors in evaluating an investment in Osisko Gold Royalties Ltd.Inquiries regarding this confidential PowerPoint presentation can be made to the senior management of the Corporation.
Cautionary Note to U.S. Investors Regarding Mineral Reserve and Mineral Resource Estimates
Osisko is subject to the reporting requirements of the applicable Canadian securities laws, and as a result, reports its mineral resources and reserves according to Canadian standards. Canadian reporting requirements for disclosure of mineralproperties are governed by National Instrument 43-101 (“NI 43-101”). The definitions of NI 43-101 are adopted from those given by the Canadian Institute of Mining, Metallurgy and Petroleum (“CIM”). U.S. reporting requirements aregoverned by the Industry Guide 7 (“Guide 7”) of the Security and Exchange Commission ("SEC"). This presentation includes estimates of mineral reserves and mineral resources reported in accordance with NI 43-101. These reportingstandards have similar goals in terms of conveying an appropriate level of confidence in the disclosures being reported, but embody different approaches and definitions. For example, under Guide 7, mineralization may not be classified as a“reserve” unless the determination has been made that the mineralization could be economically and legally produced or extracted at the time the reserve determination is made. Consequently, the definitions of “Proven Mineral Reserves”and “Probable Mineral Reserves” under CIM standards differ in certain respects from the standards of the SEC. Osisko also reports estimates of “mineral resources” in accordance with NI 43-101. While the terms “Mineral Resource,”“Measured Mineral Resource,” “Indicated Mineral Resource” and “Inferred Mineral Resource” are recognized by NI 43-101, they are not defined terms under standards of the SEC and, generally, U.S. companies are not permitted to reportestimates of mineral resources of any category in documents filed with the SEC. As such, certain information contained in this presentation concerning descriptions of mineralization and estimates of mineral reserves and mineral resourcesunder Canadian standards is not comparable to similar information made public by United States companies subject to the reporting and disclosure requirements of the SEC. Readers are cautioned not to assume that all or any part ofMeasured Mineral Resources or Indicated Mineral Resource exists, or is economically or legally mineable. Further, an “Inferred Mineral Resource” has a great amount of uncertainty as to its existence and as to its economic and legalfeasibility, and a reader cannot assume that all or any part of an Inferred Mineral Resource will ever be upgraded to a higher category. Under Canadian rules, estimates of Inferred Mineral Resources may not form the basis of feasibility orother economic studies.
Forward Looking Statements
2
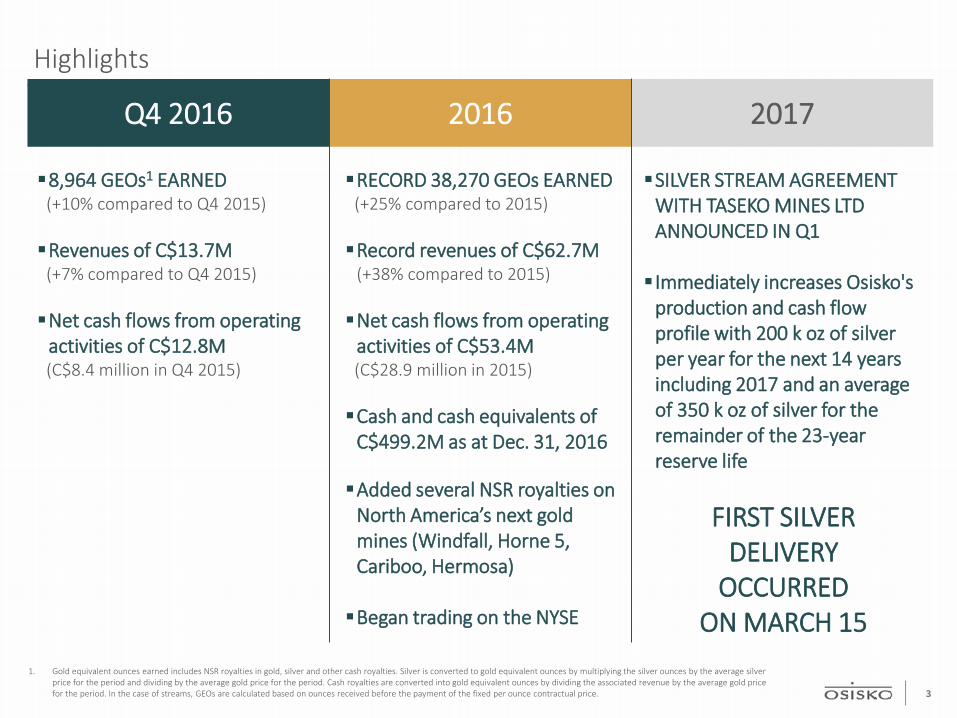
Highlights
Q4 2016 2016 2017
8,964 GEOs1 EARNED(+10% compared to Q4 2015)
Revenues of C$13.7M(+7% compared to Q4 2015)
Net cash flows from operating activities of C$12.8M(C$8.4 million in Q4 2015)
RECORD 38,270 GEOs EARNED(+25% compared to 2015)
Record revenues of C$62.7M (+38% compared to 2015)
Net cash flows from operating activities of C$53.4M(C$28.9 million in 2015)
Cash and cash equivalents of C$499.2M as at Dec. 31, 2016
Added several NSR royalties on North America’s next gold mines (Windfall, Horne 5, Cariboo, Hermosa)
Began trading on the NYSE
SILVER STREAM AGREEMENT WITH TASEKO MINES LTD ANNOUNCED IN Q1
Immediately increases Osisko'sproduction and cash flow profile with 200 k oz of silver per year for the next 14 years including 2017 and an average of 350 k oz of silver for the remainder of the 23-year reserve life
FIRST SILVERDELIVERY
OCCURREDON MARCH 15
1. Gold equivalent ounces earned includes NSR royalties in gold, silver and other cash royalties. Silver is converted to gold equivalent ounces by multiplying the silver ounces by the average silver price for the period and dividing by the average gold price for the period. Cash royalties are converted into gold equivalent ounces by dividing the associated revenue by the average gold price for the period. In the case of streams, GEOs are calculated based on ounces received before the payment of the fixed per ounce contractual price. 3
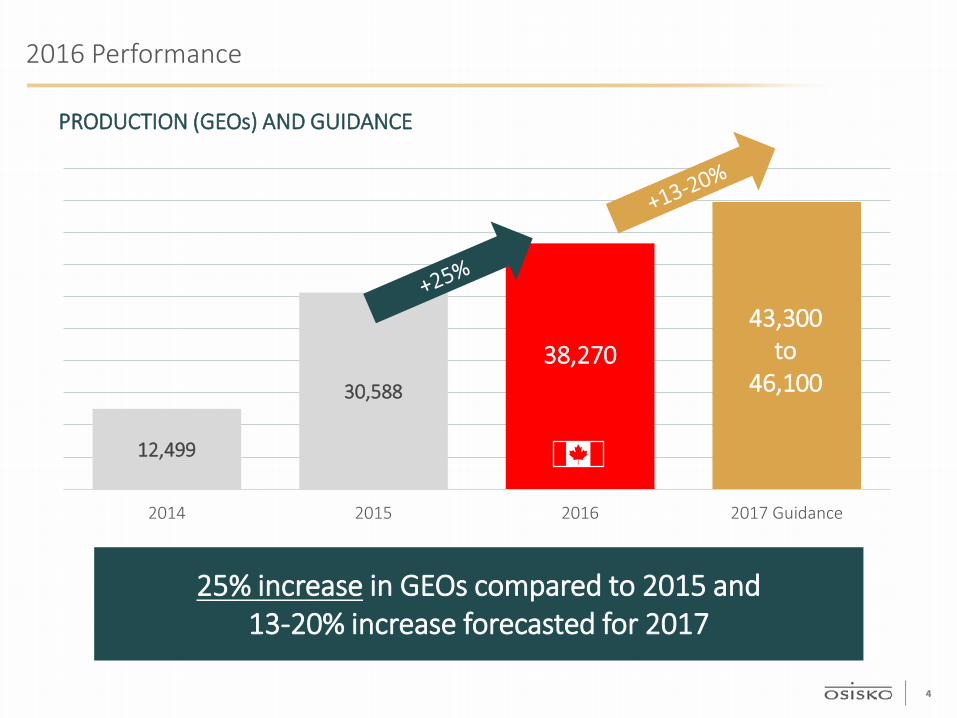
2016 Performance
PRODUCTION (GEOs) AND GUIDANCE
25% increase in GEOs compared to 2015 and13-20% increase forecasted for 2017
12,499
30,588
38,27043,300
to 46,100
2014 2015 2016 2017 Guidance
4
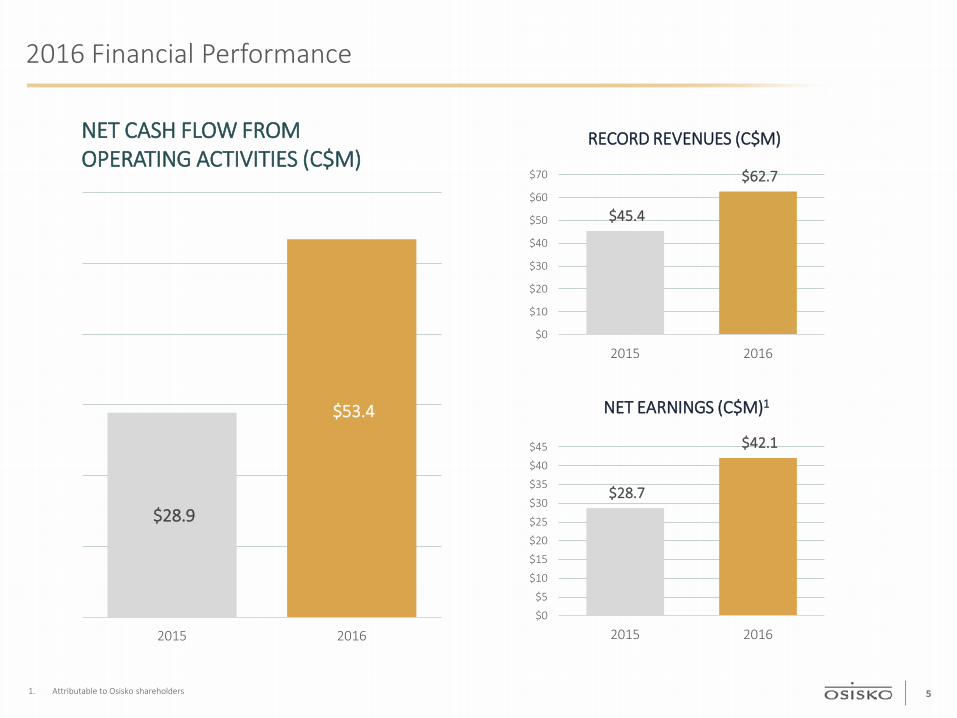
2016 Financial Performance
NET CASH FLOW FROM OPERATING ACTIVITIES (C$M)
$28.9
$53.4
2015 2016
$45.4
$62.7
$0
$10
$20
$30
$40
$50
$60
$70
2015 2016
RECORD REVENUES (C$M)
$28.7
$42.1
$0
$5
$10
$15
$20
$25
$30
$35
$40
$45
2015 2016
NET EARNINGS (C$M)1
1. Attributable to Osisko shareholders 5
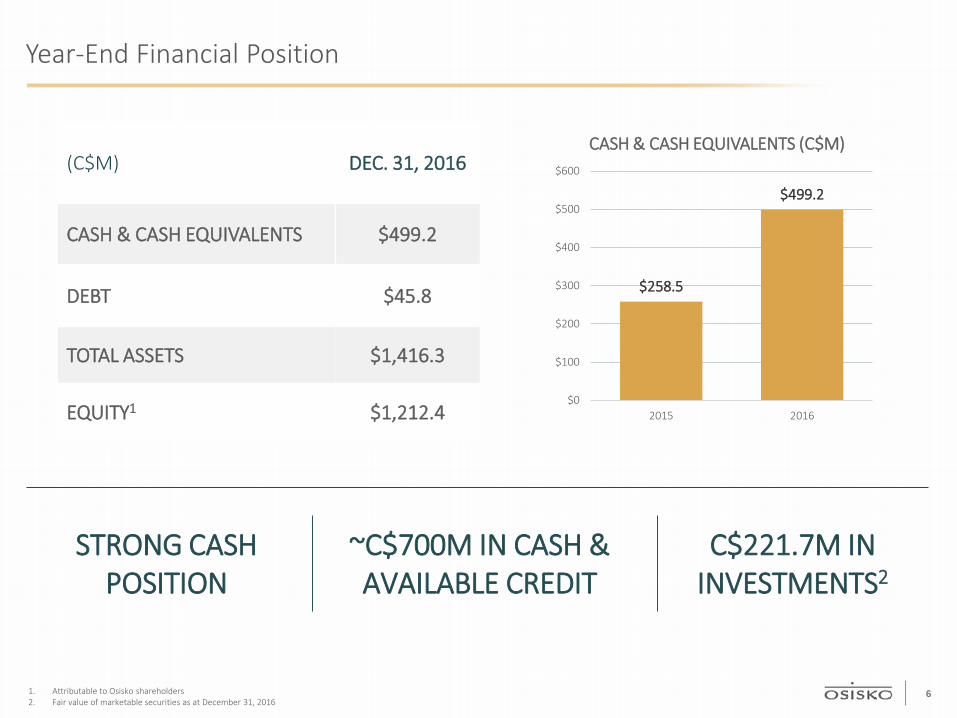
(C$M) DEC. 31, 2016
CASH & CASH EQUIVALENTS $499.2
DEBT $45.8
TOTAL ASSETS $1,416.3
EQUITY1 $1,212.4
Year-End Financial Position
~C$700M IN CASH & AVAILABLE CREDIT
STRONG CASH POSITION
1. Attributable to Osisko shareholders2. Fair value of marketable securities as at December 31, 2016
$258.5
$499.2
$0
$100
$200
$300
$400
$500
$600
2015 2016
CASH & CASH EQUIVALENTS (C$M)
C$221.7M IN INVESTMENTS2
6
2016 Activity
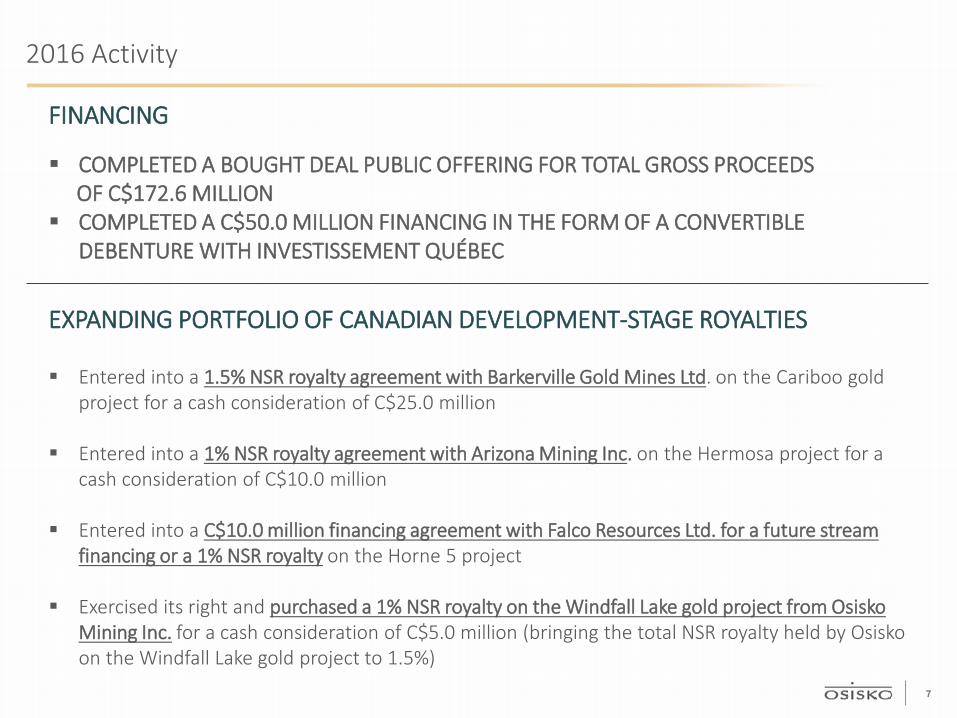
FINANCING
COMPLETED A BOUGHT DEAL PUBLIC OFFERING FOR TOTAL GROSS PROCEEDSOF C$172.6 MILLION
COMPLETED A C$50.0 MILLION FINANCING IN THE FORM OF A CONVERTIBLE DEBENTURE WITH INVESTISSEMENT QUÉBEC
EXPANDING PORTFOLIO OF CANADIAN DEVELOPMENT-STAGE ROYALTIES
Entered into a 1.5% NSR royalty agreement with Barkerville Gold Mines Ltd. on the Cariboo gold project for a cash consideration of C$25.0 million
Entered into a 1% NSR royalty agreement with Arizona Mining Inc. on the Hermosa project for a cash consideration of C$10.0 million
Entered into a C$10.0 million financing agreement with Falco Resources Ltd. for a future stream financing or a 1% NSR royalty on the Horne 5 project
Exercised its right and purchased a 1% NSR royalty on the Windfall Lake gold project from Osisko Mining Inc. for a cash consideration of C$5.0 million (bringing the total NSR royalty held by Osisko on the Windfall Lake gold project to 1.5%)
7

2016 Activity
OSISKO BEGAN TRADING ON THE
NYSE
EARN-IN AGREEMENT WITH
OSISKO MINING INC. ON
EXPLORATION PROPERTIES
GENERATED PROCEEDS OF
C$129.2M ON SALE OF INVESTMENTS
8
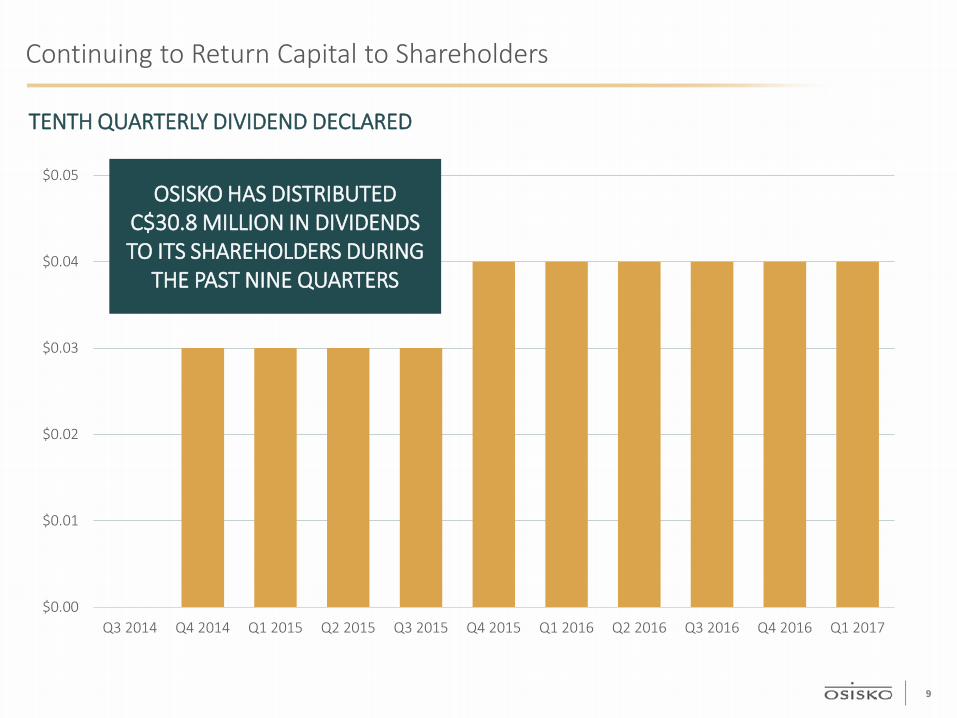
$0.00
$0.01
$0.02
$0.03
$0.04
$0.05
Q3 2014 Q4 2014 Q1 2015 Q2 2015 Q3 2015 Q4 2015 Q1 2016 Q2 2016 Q3 2016 Q4 2016 Q1 2017
Continuing to Return Capital to Shareholders
TENTH QUARTERLY DIVIDEND DECLARED
OSISKO HAS DISTRIBUTED C$30.8 MILLION IN DIVIDENDS TO ITS SHAREHOLDERS DURING
THE PAST NINE QUARTERS
9
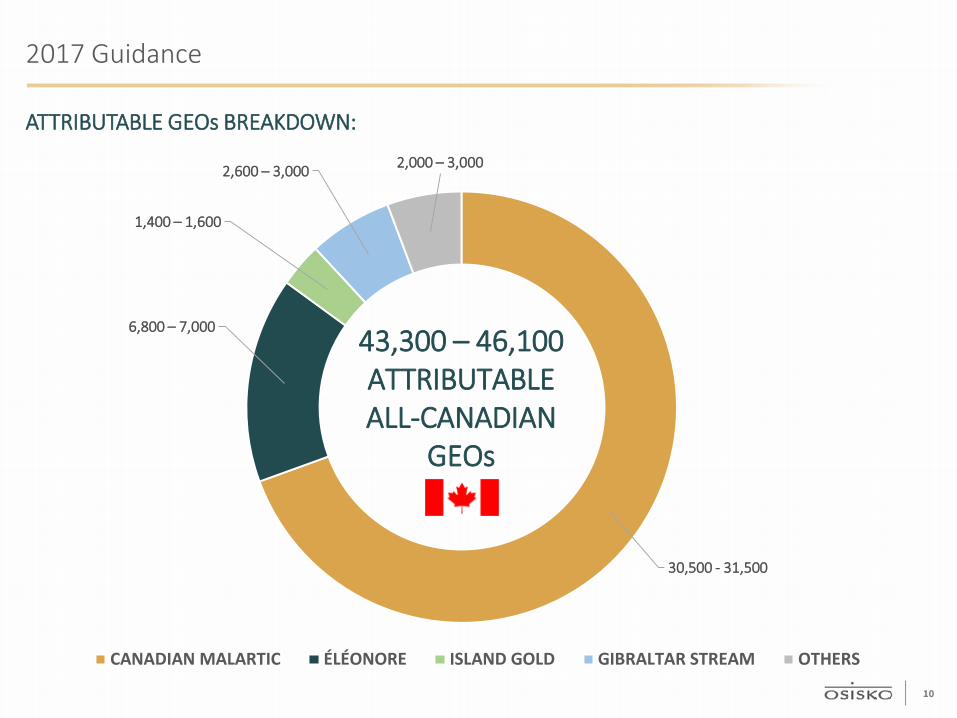
2017 Guidance
ATTRIBUTABLE GEOs BREAKDOWN:
30,500 - 31,500
6,800 – 7,000
1,400 – 1,600
2,600 – 3,000 2,000 – 3,000
CANADIAN MALARTIC ÉLÉONORE ISLAND GOLD GIBRALTAR STREAM OTHERS
43,300 – 46,100ATTRIBUTABLE ALL-CANADIAN
GEOs
10
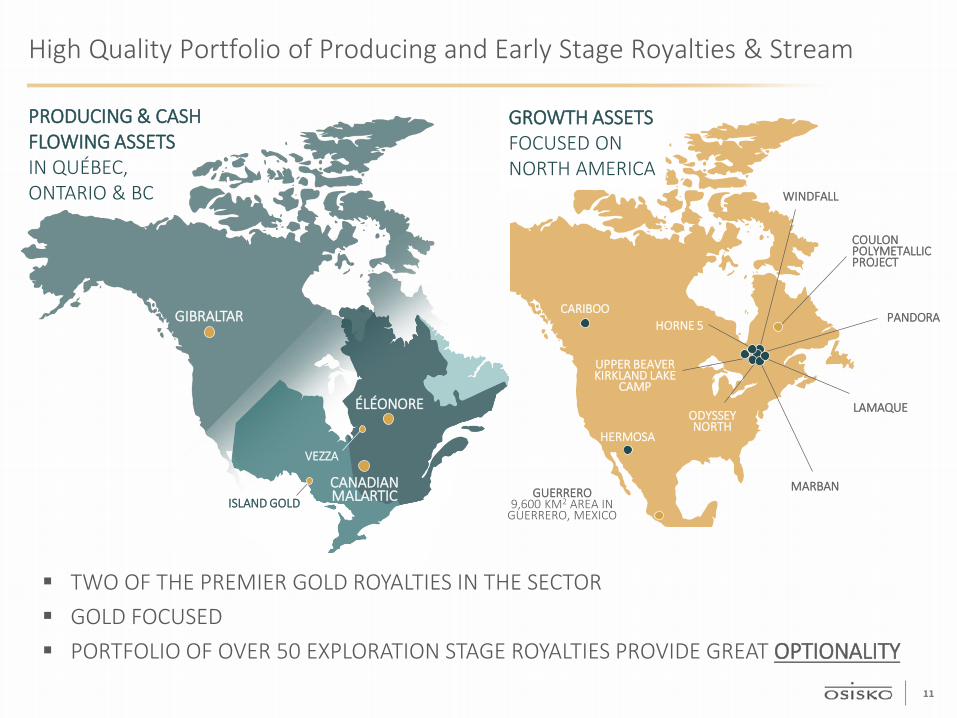
TWO OF THE PREMIER GOLD ROYALTIES IN THE SECTOR GOLD FOCUSED PORTFOLIO OF OVER 50 EXPLORATION STAGE ROYALTIES PROVIDE GREAT OPTIONALITY
High Quality Portfolio of Producing and Early Stage Royalties & Stream
PRODUCING & CASH FLOWING ASSETSIN QUÉBEC,ONTARIO & BC
GROWTH ASSETSFOCUSED ON NORTH AMERICA
ODYSSEY NORTH
UPPER BEAVER KIRKLAND LAKE
CAMP
CARIBOO
MARBAN
LAMAQUE
PANDORA
WINDFALL
HERMOSA
HORNE 5
GUERRERO9,600 KM2 AREA IN
GUERRERO, MEXICO
COULON POLYMETALLIC PROJECT
ÉLÉONORE
ISLAND GOLD
VEZZA
CANADIAN MALARTIC
GIBRALTAR
11

Asset Update
12
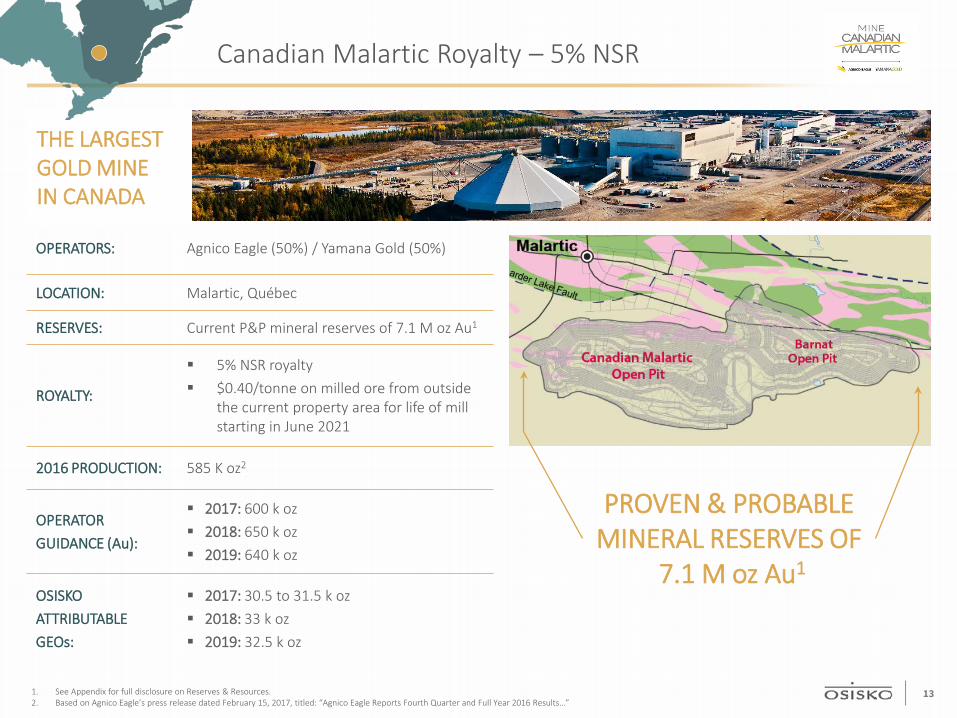
OPERATORS: Agnico Eagle (50%) / Yamana Gold (50%)
LOCATION: Malartic, Québec
RESERVES: Current P&P mineral reserves of 7.1 M oz Au1
ROYALTY:
5% NSR royalty $0.40/tonne on milled ore from outside
the current property area for life of mill starting in June 2021
2016 PRODUCTION: 585 K oz2
OPERATORGUIDANCE (Au):
2017: 600 k oz 2018: 650 k oz 2019: 640 k oz
OSISKOATTRIBUTABLEGEOs:
2017: 30.5 to 31.5 k oz 2018: 33 k oz 2019: 32.5 k oz
1. See Appendix for full disclosure on Reserves & Resources.2. Based on Agnico Eagle’s press release dated February 15, 2017, titled: “Agnico Eagle Reports Fourth Quarter and Full Year 2016 Results…”
Canadian Malartic Royalty – 5% NSR
THE LARGESTGOLD MINEIN CANADA
PROVEN & PROBABLEMINERAL RESERVES OF
7.1 M oz Au1
13
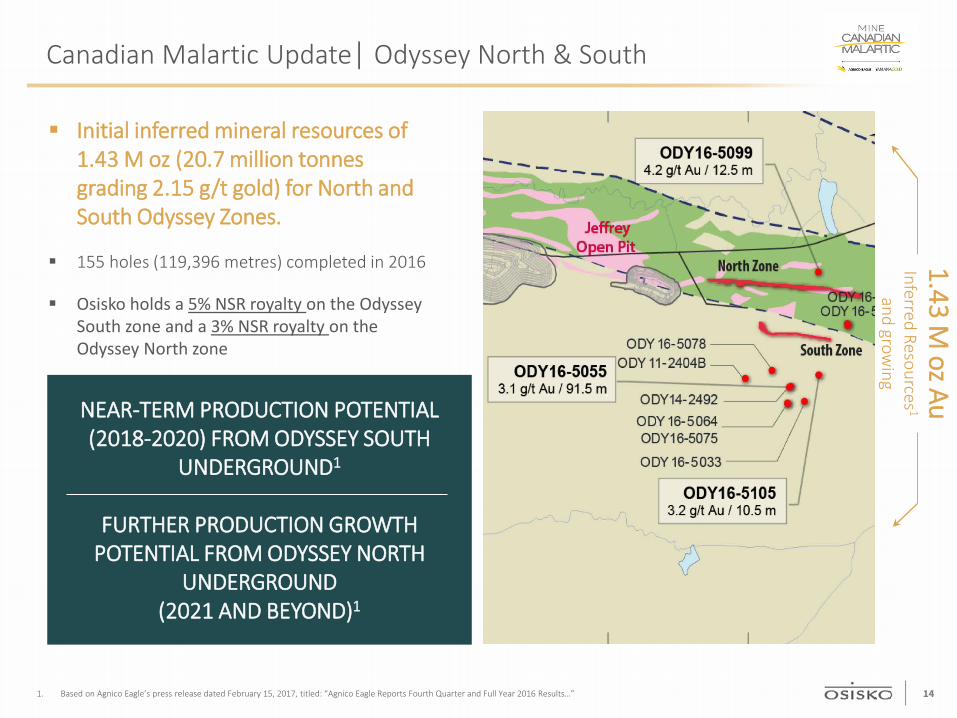
Canadian Malartic Update| Odyssey North & South
1. Based on Agnico Eagle’s press release dated February 15, 2017, titled: “Agnico Eagle Reports Fourth Quarter and Full Year 2016 Results…”
Initial inferred mineral resources of 1.43 M oz (20.7 million tonnesgrading 2.15 g/t gold) for North and South Odyssey Zones.
155 holes (119,396 metres) completed in 2016
Osisko holds a 5% NSR royalty on the Odyssey South zone and a 3% NSR royalty on the Odyssey North zone
NEAR-TERM PRODUCTION POTENTIAL (2018-2020) FROM ODYSSEY SOUTH
UNDERGROUND1
FURTHER PRODUCTION GROWTH POTENTIAL FROM ODYSSEY NORTH
UNDERGROUND(2021 AND BEYOND)1
1.43 M ozAu
Inferred Resources 1
and growing
14
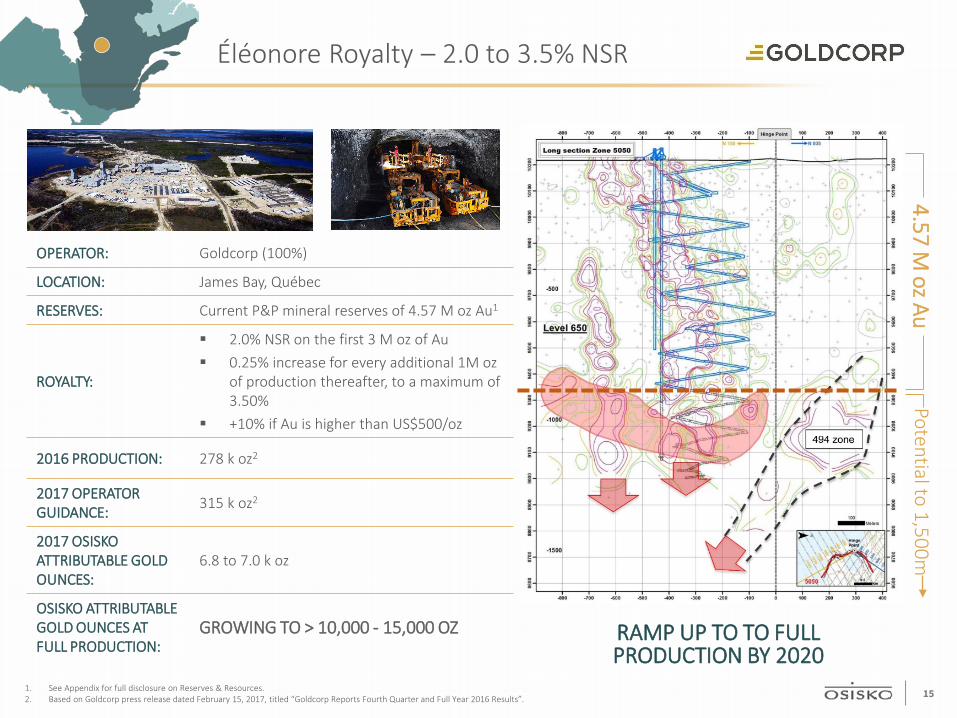
1. See Appendix for full disclosure on Reserves & Resources.2. Based on Goldcorp press release dated February 15, 2017, titled “Goldcorp Reports Fourth Quarter and Full Year 2016 Results”.
OPERATOR: Goldcorp (100%)
LOCATION: James Bay, Québec
RESERVES: Current P&P mineral reserves of 4.57 M oz Au1
ROYALTY:
2.0% NSR on the first 3 M oz of Au 0.25% increase for every additional 1M oz
of production thereafter, to a maximum of 3.50%
+10% if Au is higher than US$500/oz
2016 PRODUCTION: 278 k oz2
2017 OPERATOR GUIDANCE: 315 k oz2
2017 OSISKO ATTRIBUTABLE GOLD OUNCES:
6.8 to 7.0 k oz
OSISKO ATTRIBUTABLE GOLD OUNCES AT FULL PRODUCTION:
GROWING TO > 10,000 - 15,000 OZ RAMP UP TO TO FULL PRODUCTION BY 2020
4.57 M oz Au
Potentialto 1,500mÉléonore Royalty – 2.0 to 3.5% NSR
15
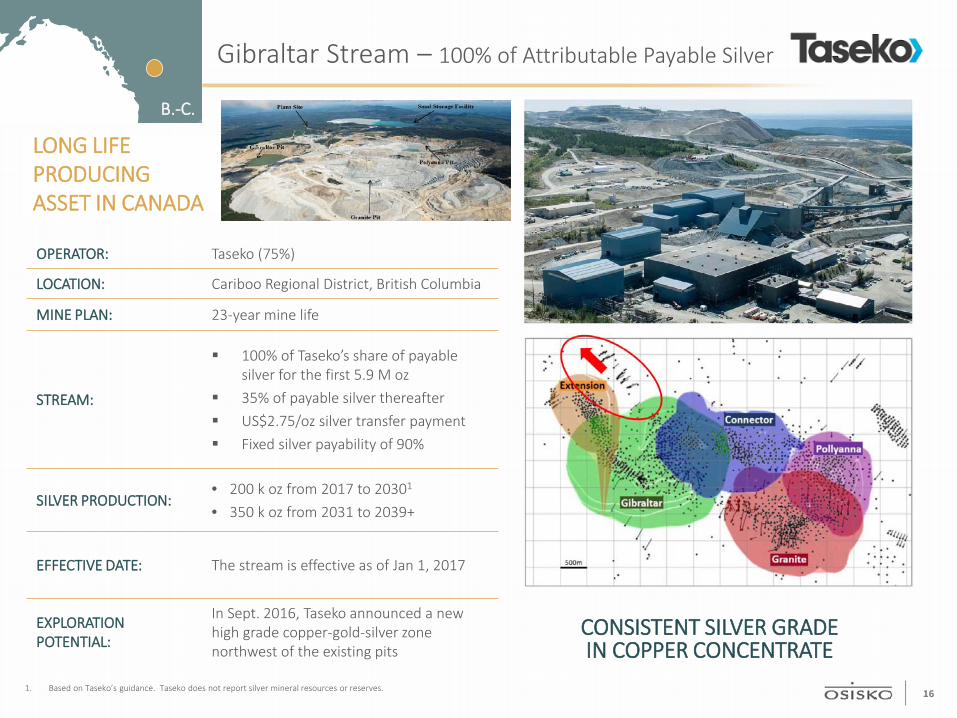
1. Based on Taseko’s guidance. Taseko does not report silver mineral resources or reserves.
OPERATOR: Taseko (75%)
LOCATION: Cariboo Regional District, British Columbia
MINE PLAN: 23-year mine life
STREAM:
100% of Taseko’s share of payable silver for the first 5.9 M oz
35% of payable silver thereafter US$2.75/oz silver transfer payment Fixed silver payability of 90%
SILVER PRODUCTION:• 200 k oz from 2017 to 20301
• 350 k oz from 2031 to 2039+
EFFECTIVE DATE: The stream is effective as of Jan 1, 2017
EXPLORATIONPOTENTIAL:
In Sept. 2016, Taseko announced a new high grade copper-gold-silver zone northwest of the existing pits
LONG LIFE PRODUCING ASSET IN CANADA
CONSISTENT SILVER GRADE IN COPPER CONCENTRATE
Gibraltar Stream – 100% of Attributable Payable Silver
B.-C.
16
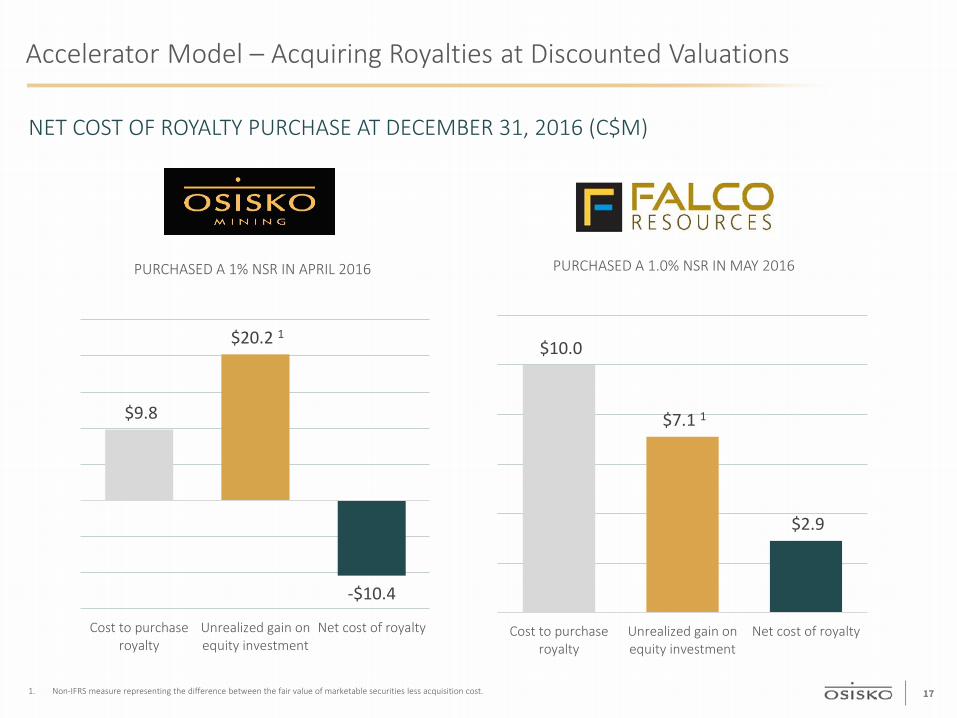
Accelerator Model – Acquiring Royalties at Discounted Valuations
NET COST OF ROYALTY PURCHASE AT DECEMBER 31, 2016 (C$M)
1. Non-IFRS measure representing the difference between the fair value of marketable securities less acquisition cost.
PURCHASED A 1.0% NSR IN MAY 2016
$10.0
$7.1 1
$2.9
Cost to purchaseroyalty
Unrealized gain onequity investment
Net cost of royalty
PURCHASED A 1% NSR IN APRIL 2016
$9.8
$20.2 1
-$10.4
Cost to purchaseroyalty
Unrealized gain onequity investment
Net cost of royalty
17

Accelerator Model – Acquiring Royalties at Discounted Valuations
NET COST OF ROYALTY PURCHASE AT DECEMBER 31, 2016 (C$M)
PURCHASED A 1.5% NSR IN FEBRUARY 2016 PURCHASED A 1% NSR IN APRIL 2016
1. Non-IFRS measure representing the difference between the fair value of marketable securities less acquisition cost.
$10.0
$16.6 1
-$6.6
Cost to purchaseroyalty
Unrealized gain onequity investment
Net cost of royalty
$25.0
$5.0 1
$20.0
Cost to purchaseroyalty
Unrealized gain onequity investment
Net cost of royalty
18
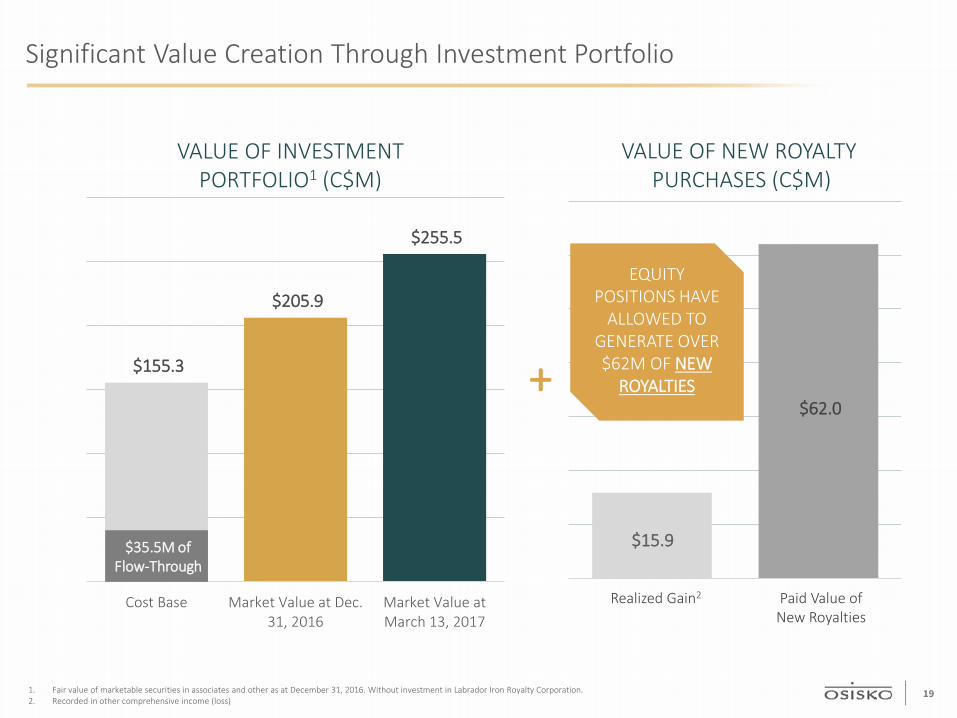
$155.3
$205.9
$255.5
Cost Base Market Value at Dec.31, 2016
Market Value atMarch 13, 2017
$62.0
Significant Value Creation Through Investment Portfolio
VALUE OF INVESTMENT PORTFOLIO1 (C$M)
1. Fair value of marketable securities in associates and other as at December 31, 2016. Without investment in Labrador Iron Royalty Corporation.2. Recorded in other comprehensive income (loss)
+
VALUE OF NEW ROYALTYPURCHASES (C$M)
Paid Value of New Royalties
EQUITY POSITIONS HAVE
ALLOWED TO GENERATE OVER $62M OF NEW
ROYALTIES
$35.5M ofFlow-Through
$15.9
Realized Gain2
19
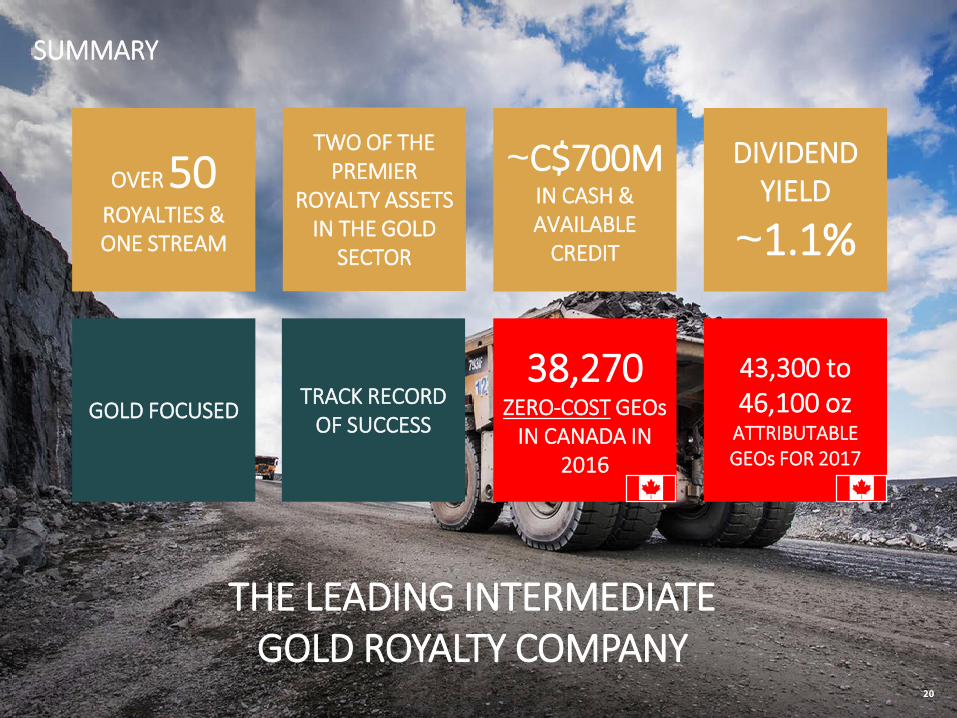
SUMMARY
OVER 50ROYALTIES &ONE STREAM
~C$700MIN CASH & AVAILABLE
CREDIT
DIVIDEND YIELD
~1.1%
TWO OF THE PREMIER
ROYALTY ASSETS IN THE GOLD
SECTOR
GOLD FOCUSED
THE LEADING INTERMEDIATEGOLD ROYALTY COMPANY
TRACK RECORD OF SUCCESS
38,270ZERO-COST GEOs
IN CANADA IN 2016
43,300 to 46,100 oz
ATTRIBUTABLE GEOs FOR 2017
20
APPENDIX
Appendix A – 2016 Financial ResultsAppendix B – 2016 Statement of IncomeAppendix C – Mineral Reserves & Resources
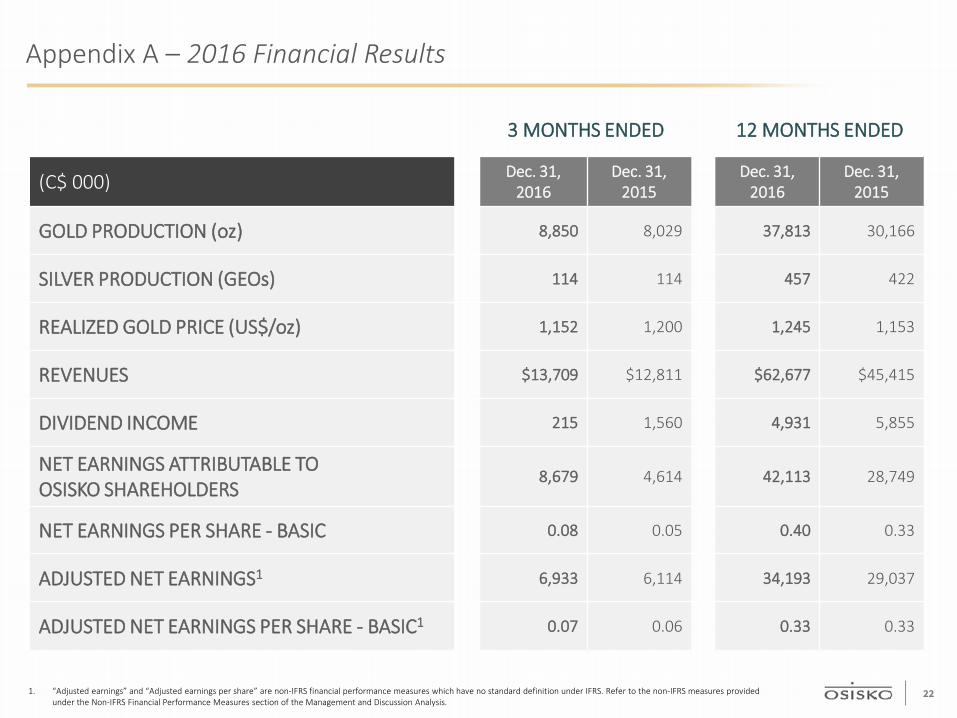
3 MONTHS ENDED 12 MONTHS ENDED
(C$ 000) Dec. 31, 2016
Dec. 31, 2015
Dec. 31, 2016
Dec. 31, 2015
GOLD PRODUCTION (oz) 8,850 8,029 37,813 30,166
SILVER PRODUCTION (GEOs) 114 114 457 422
REALIZED GOLD PRICE (US$/oz) 1,152 1,200 1,245 1,153
REVENUES $13,709 $12,811 $62,677 $45,415
DIVIDEND INCOME 215 1,560 4,931 5,855
NET EARNINGS ATTRIBUTABLE TOOSISKO SHAREHOLDERS
8,679 4,614 42,113 28,749
NET EARNINGS PER SHARE - BASIC 0.08 0.05 0.40 0.33
ADJUSTED NET EARNINGS1 6,933 6,114 34,193 29,037
ADJUSTED NET EARNINGS PER SHARE - BASIC1 0.07 0.06 0.33 0.33
Appendix A – 2016 Financial Results
1. “Adjusted earnings” and “Adjusted earnings per share” are non-IFRS financial performance measures which have no standard definition under IFRS. Refer to the non-IFRS measures provided under the Non-IFRS Financial Performance Measures section of the Management and Discussion Analysis.
22
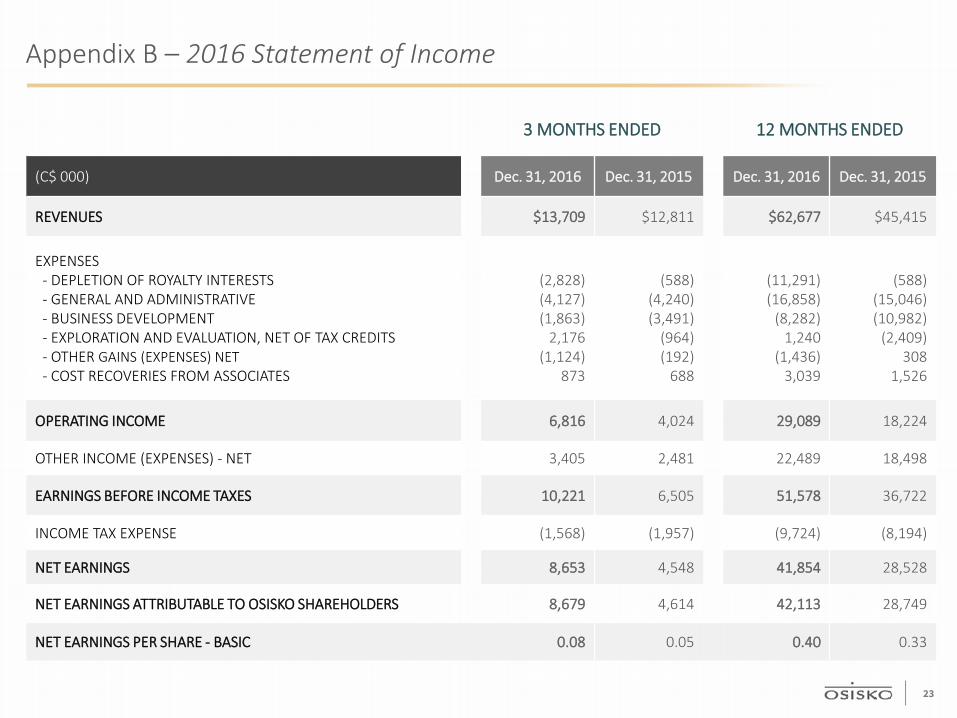
3 MONTHS ENDED 12 MONTHS ENDED
(C$ 000) Dec. 31, 2016 Dec. 31, 2015 Dec. 31, 2016 Dec. 31, 2015
REVENUES $13,709 $12,811 $62,677 $45,415
EXPENSES- DEPLETION OF ROYALTY INTERESTS- GENERAL AND ADMINISTRATIVE- BUSINESS DEVELOPMENT- EXPLORATION AND EVALUATION, NET OF TAX CREDITS- OTHER GAINS (EXPENSES) NET- COST RECOVERIES FROM ASSOCIATES
(2,828)(4,127)(1,863)
2,176(1,124)
873
(588)(4,240)(3,491)
(964)(192)
688
(11,291)(16,858)
(8,282)1,240
(1,436)3,039
(588)(15,046)(10,982)
(2,409)308
1,526
OPERATING INCOME 6,816 4,024 29,089 18,224
OTHER INCOME (EXPENSES) - NET 3,405 2,481 22,489 18,498
EARNINGS BEFORE INCOME TAXES 10,221 6,505 51,578 36,722
INCOME TAX EXPENSE (1,568) (1,957) (9,724) (8,194)
NET EARNINGS 8,653 4,548 41,854 28,528
NET EARNINGS ATTRIBUTABLE TO OSISKO SHAREHOLDERS 8,679 4,614 42,113 28,749
NET EARNINGS PER SHARE - BASIC 0.08 0.05 0.40 0.33
Appendix B – 2016 Statement of Income
23
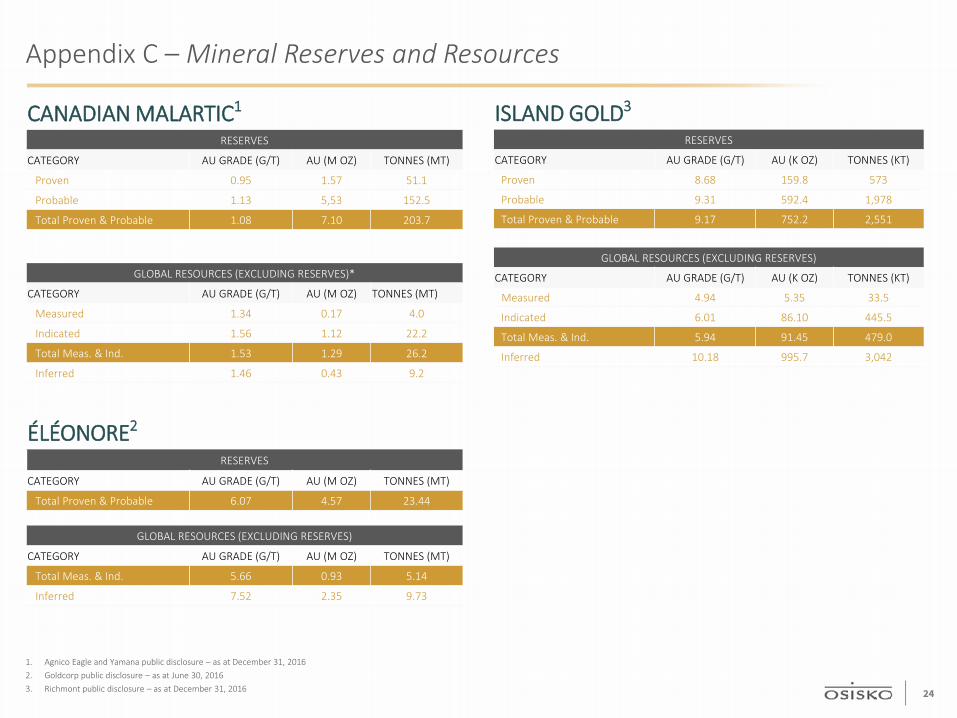
Appendix C – Mineral Reserves and Resources
1. Agnico Eagle and Yamana public disclosure – as at December 31, 20162. Goldcorp public disclosure – as at June 30, 20163. Richmont public disclosure – as at December 31, 2016
CANADIAN MALARTIC1
RESERVES
CATEGORY AU GRADE (G/T) AU (M OZ) TONNES (MT)
Proven 0.95 1.57 51.1
Probable 1.13 5,53 152.5
Total Proven & Probable 1.08 7.10 203.7
GLOBAL RESOURCES (EXCLUDING RESERVES)*
CATEGORY AU GRADE (G/T) AU (M OZ) TONNES (MT)
Measured 1.34 0.17 4.0
Indicated 1.56 1.12 22.2
Total Meas. & Ind. 1.53 1.29 26.2
Inferred 1.46 0.43 9.2
ÉLÉONORE2
RESERVES
CATEGORY AU GRADE (G/T) AU (M OZ) TONNES (MT)
Total Proven & Probable 6.07 4.57 23.44
GLOBAL RESOURCES (EXCLUDING RESERVES)
CATEGORY AU GRADE (G/T) AU (M OZ) TONNES (MT)
Total Meas. & Ind. 5.66 0.93 5.14
Inferred 7.52 2.35 9.73
ISLAND GOLD3
RESERVES
CATEGORY AU GRADE (G/T) AU (K OZ) TONNES (KT)
Proven 8.68 159.8 573
Probable 9.31 592.4 1,978
Total Proven & Probable 9.17 752.2 2,551
GLOBAL RESOURCES (EXCLUDING RESERVES)
CATEGORY AU GRADE (G/T) AU (K OZ) TONNES (KT)
Measured 4.94 5.35 33.5
Indicated 6.01 86.10 445.5
Total Meas. & Ind. 5.94 91.45 479.0
Inferred 10.18 995.7 3,042
24