Embed Size (px)
Citation preview
Investor Presentation
February 2017
Forward-looking statements
This presentation may contain forward-looking statements and information that both represents management's current expectations or beliefs concerning future
events and are subject to known and unknown risks and uncertainties.
A number of factors could cause actual results, performance or events to differ materially from those expressed or implied by these forward-looking statements.
February 2017 | P1
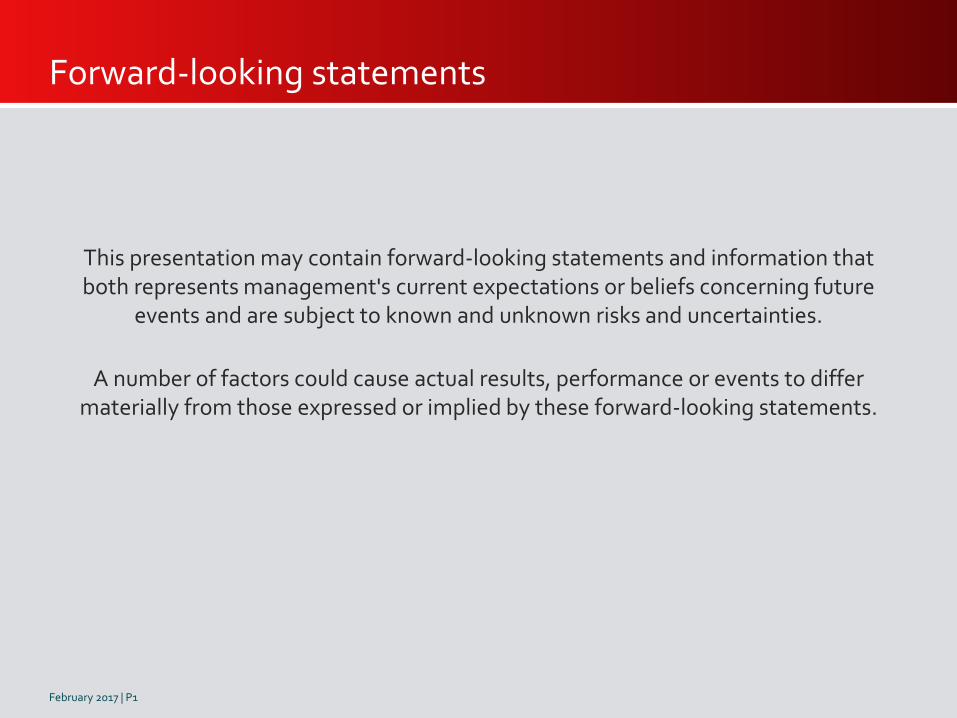
Cost reductions delivered
High operating efficiency
Step change in production
Continued portfolio upgrading
Refinancing in progress
2016 highlights
1
2
3
4
5
2016 2017E
91% >90%
2015 2016 2016 Q4
58 kboepd71.kboepd
>80 kboepd
E.ON acquisition case 2016 2H
15 kboepd
17 kboepd
2014 opex 2016 opex
$18.5/boe
$15.7/boe
Drawn Debt Total Facilities (incl LCs)
$3.4 bn
$4 bn
Undrawn
February 2017 | P2
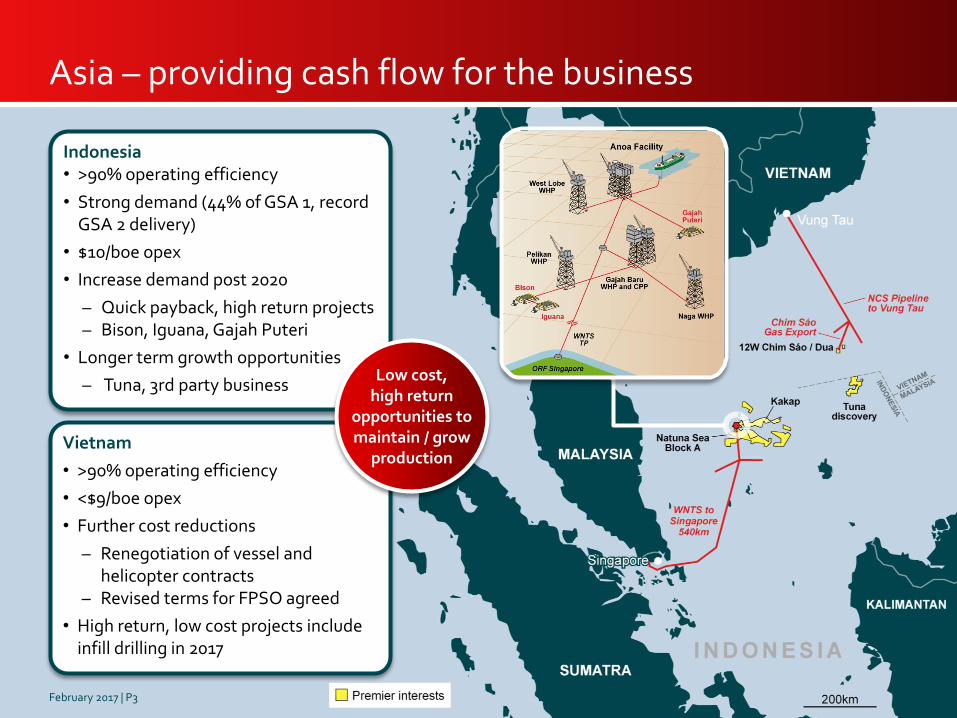
Indonesia• >90% operating efficiency
• Strong demand (44% of GSA 1, record GSA 2 delivery)
• $10/boe opex
• Increase demand post 2020
– Quick payback, high return projects– Bison, Iguana, Gajah Puteri
• Longer term growth opportunities
– Tuna, 3rd party business
Asia – providing cash flow for the business
Vietnam
• >90% operating efficiency
• <$9/boe opex
• Further cost reductions
– Renegotiation of vessel and helicopter contracts
– Revised terms for FPSO agreed
• High return, low cost projects include infill drilling in 2017
Low cost,high return
opportunities tomaintain / grow
production
February 2017 | P3
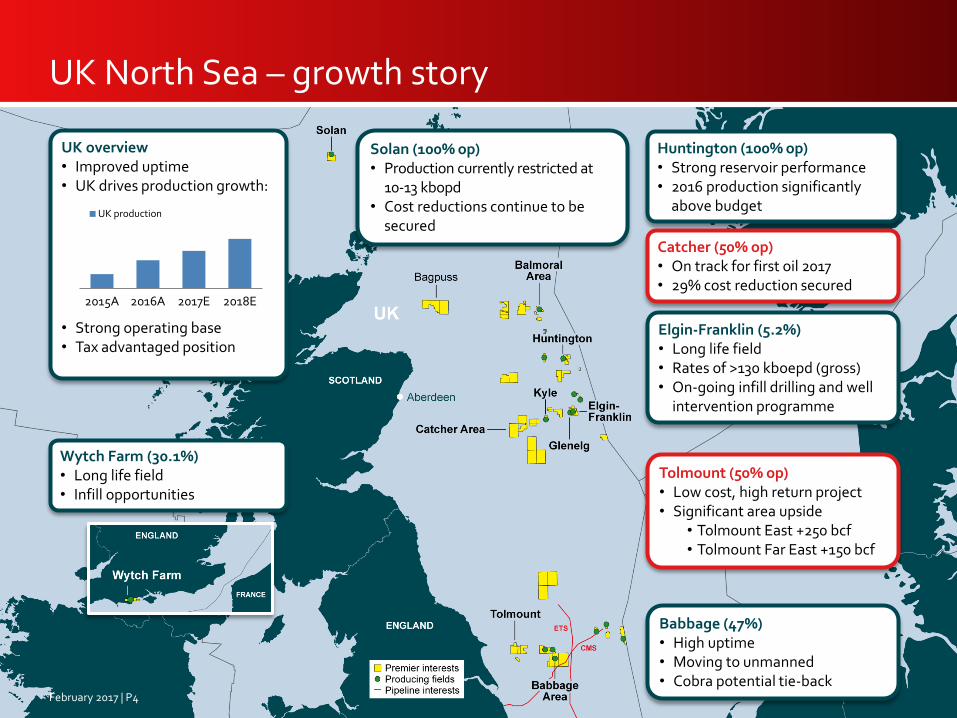
UK North Sea – growth story
Wytch Farm (30.1%)• Long life field• Infill opportunities
Solan (100% op)• Production currently restricted at
10-13 kbopd• Cost reductions continue to be
secured
UK overview• Improved uptime• UK drives production growth:
• Strong operating base• Tax advantaged position
Babbage (47%)• High uptime• Moving to unmanned• Cobra potential tie-back
Elgin-Franklin (5.2%)• Long life field• Rates of >130 kboepd (gross) • On-going infill drilling and well
intervention programme
Huntington (100% op)• Strong reservoir performance• 2016 production significantly
above budget
Catcher (50% op)• On track for first oil 2017• 29% cost reduction secured
Tolmount (50% op)• Low cost, high return project• Significant area upside
• Tolmount East +250 bcf• Tolmount Far East +150 bcf
February 2017 | P4
2015A 2016A 2017E 2018E
UK production
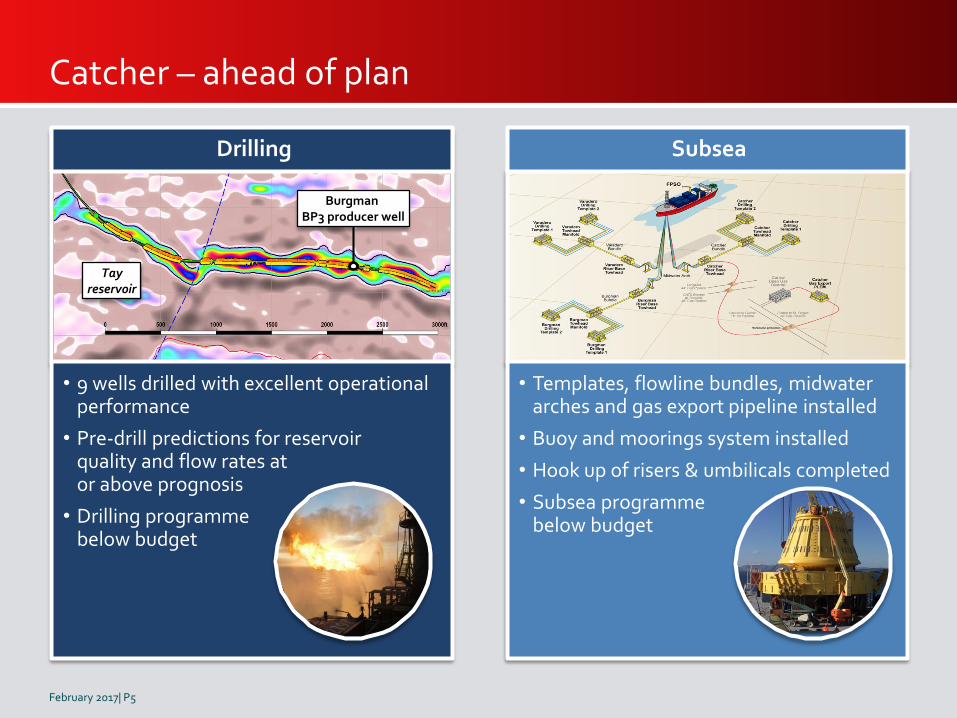
• Templates, flowline bundles, midwater arches and gas export pipeline installed
• Buoy and moorings system installed
• Hook up of risers & umbilicals completed
• Subsea programmebelow budget
Subsea
• 9 wells drilled with excellent operational performance
• Pre-drill predictions for reservoirquality and flow rates ator above prognosis
• Drilling programmebelow budget
Catcher – ahead of plan
BurgmanBP3 producer well
Tayreservoir
Drilling
February 2017| P5
February 2017 | P6
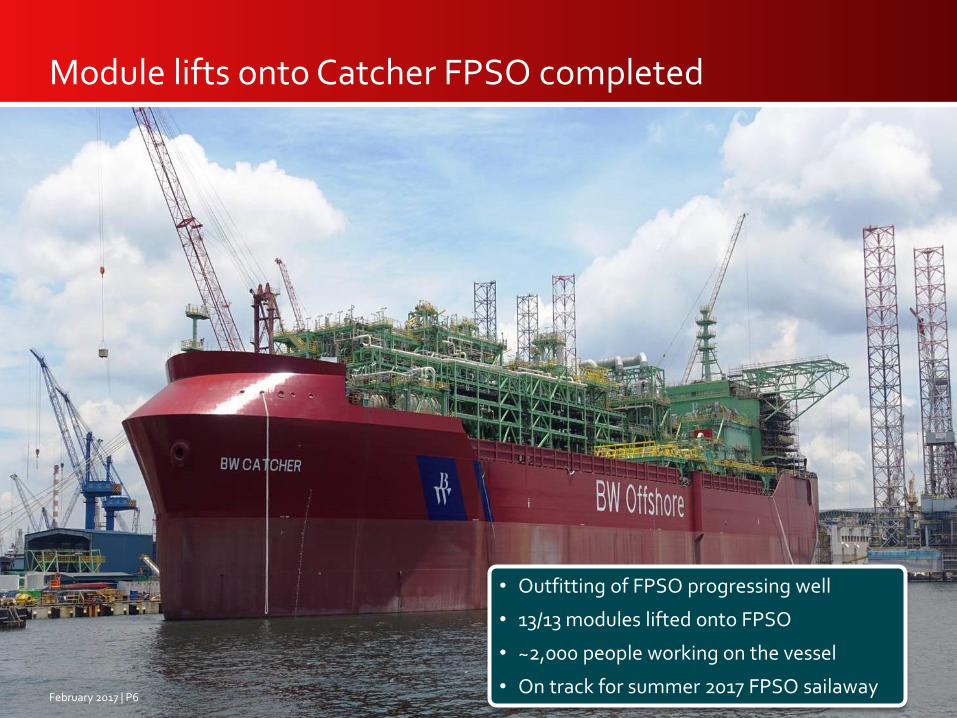
Module lifts onto Catcher FPSO completed
• Outfitting of FPSO progressing well
• 13/13 modules lifted onto FPSO
• ~2,000 people working on the vessel
• On track for summer 2017 FPSO sailaway
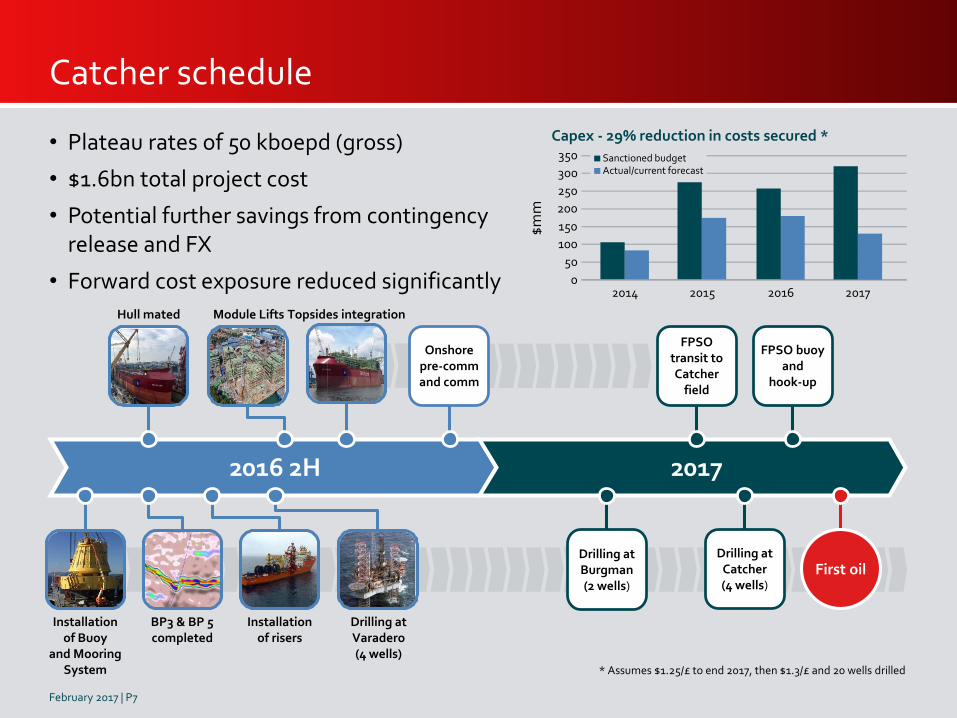
Catcher schedule
20172016 2H
• Plateau rates of 50 kboepd (gross)
• $1.6bn total project cost
• Potential further savings from contingency release and FX
• Forward cost exposure reduced significantly
BP3 & BP 5completed
Drilling at Varadero(4 wells)
Installation of Buoy
and Mooring System
Module Lifts
Installation of risers
Hull mated
Onshore pre-command comm
Drilling at Burgman(2 wells)
FPSO transit to Catcher
field
FPSO buoy and
hook-up
First oil
February 2017 | P7
Drilling at Catcher(4 wells)
* Assumes $1.25/£ to end 2017, then $1.3/£ and 20 wells drilled
Topsides integration
Capex - 29% reduction in costs secured *
$m
m
0
50
100
150
200
250
300
350
2014 2015 2016 2017
Sanctioned budgetActual/current forecast
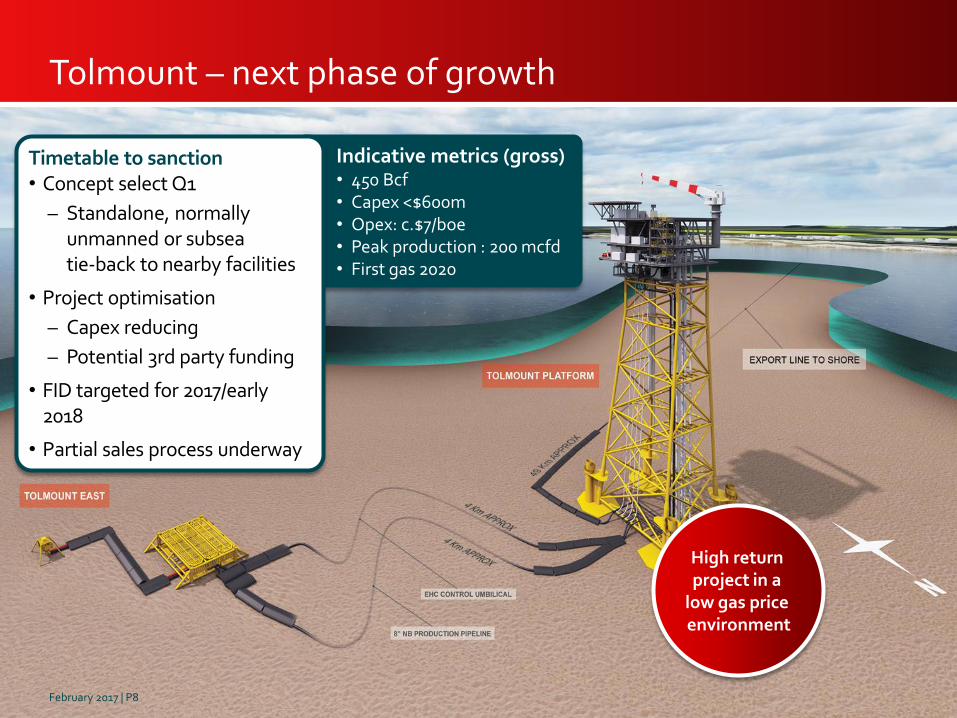
Tolmount – next phase of growth
Indicative metrics (gross)• 450 Bcf• Capex <$600m• Opex: c.$7/boe• Peak production : 200 mcfd• First gas 2020
High return project in a
low gas price environment
Timetable to sanction• Concept select Q1
– Standalone, normally unmanned or subseatie-back to nearby facilities
• Project optimisation
– Capex reducing
– Potential 3rd party funding
• FID targeted for 2017/early 2018
• Partial sales process underway
February 2017 | P8
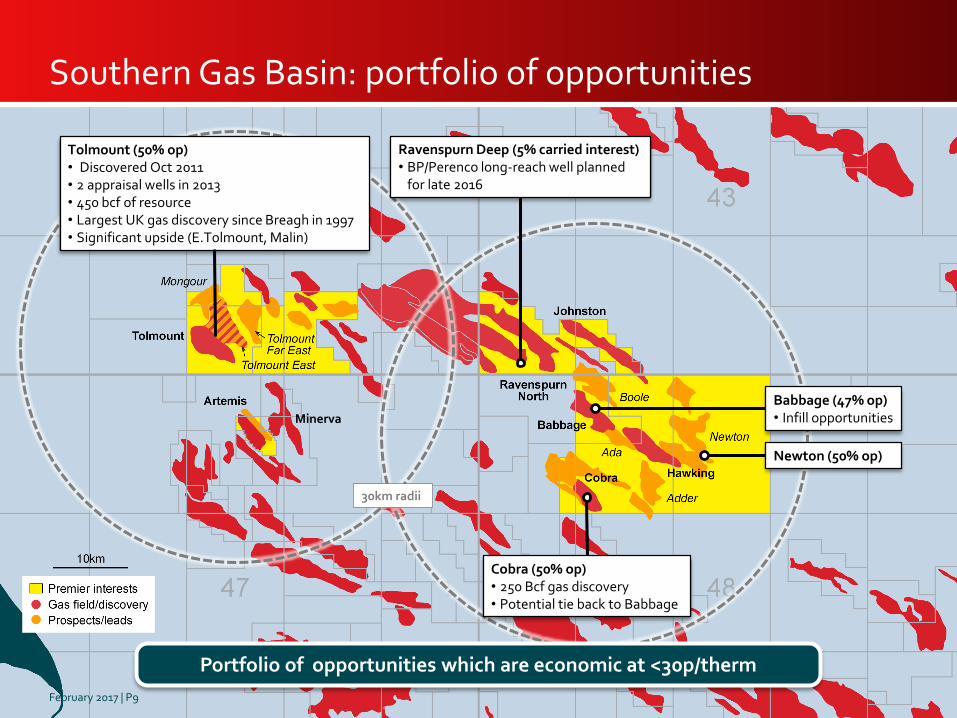
Southern Gas Basin: portfolio of opportunities
Babbage (47% op)• Infill opportunities
Ravenspurn Deep (5% carried interest)• BP/Perenco long-reach well planned
for late 2016
Newton (50% op)
Cobra (50% op)• 250 Bcf gas discovery• Potential tie back to Babbage
30km radii
Portfolio of opportunities which are economic at <30p/therm
February 2017 | P9
Minerva
Tolmount (50% op)• Discovered Oct 2011• 2 appraisal wells in 2013• 450 bcf of resource• Largest UK gas discovery since Breagh in 1997• Significant upside (E.Tolmount, Malin)
February 2017 | P10
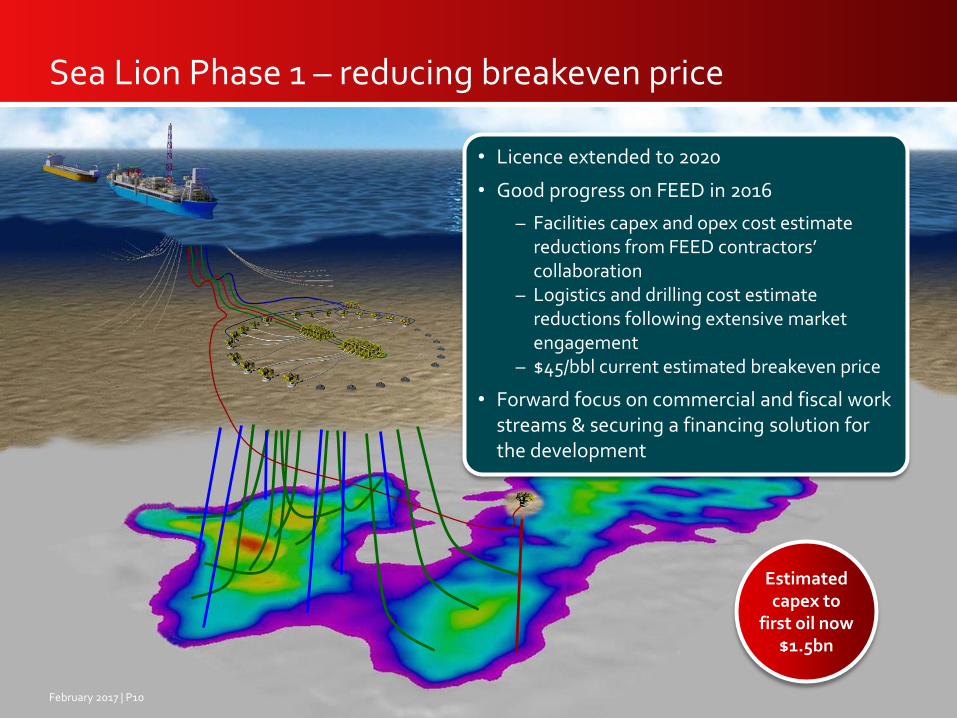
• Licence extended to 2020
• Good progress on FEED in 2016
– Facilities capex and opex cost estimate reductions from FEED contractors’ collaboration
– Logistics and drilling cost estimate reductions following extensive market engagement
– $45/bbl current estimated breakeven price
• Forward focus on commercial and fiscal work streams & securing a financing solution for the development
Estimatedcapex to
first oil now$1.5bn
Sea Lion Phase 1 – reducing breakeven price
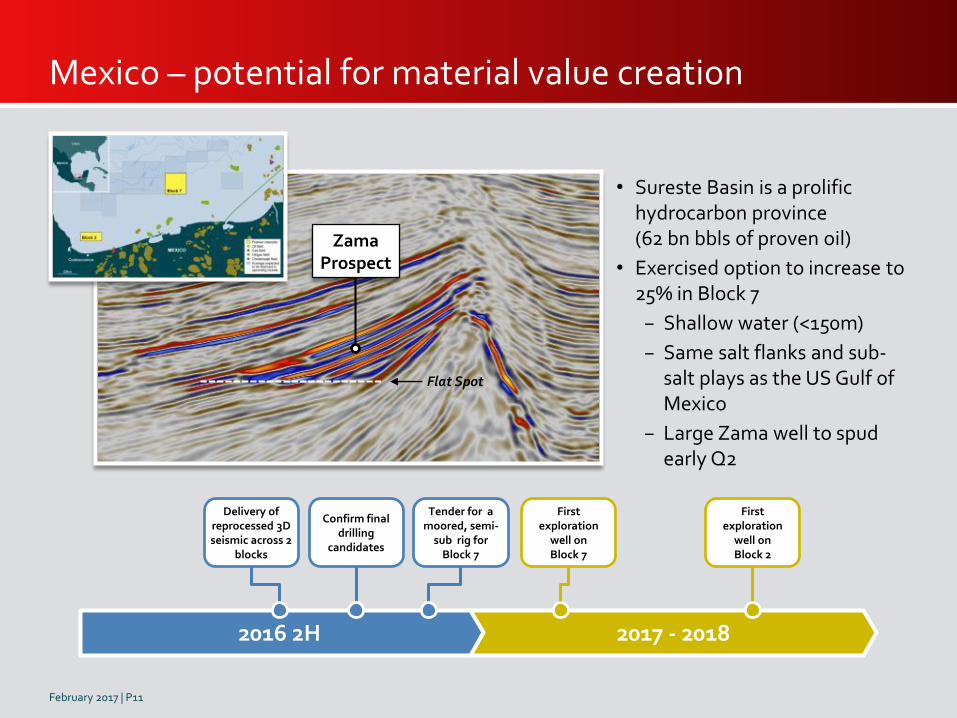
• Sureste Basin is a prolific hydrocarbon province(62 bn bbls of proven oil)
• Exercised option to increase to 25% in Block 7
− Shallow water (<150m)
− Same salt flanks and sub-salt plays as the US Gulf of Mexico
− Large Zama well to spud early Q2
Mexico – potential for material value creation
2017 - 20182016 2H
Delivery of reprocessed 3D seismic across 2
blocks
Confirm final drilling
candidates
Tender for a moored, semi-
sub rig forBlock 7
Firstexploration
well onBlock 7
Firstexploration
well onBlock 2
February 2017 | P11
Flat Spot
ZamaProspect
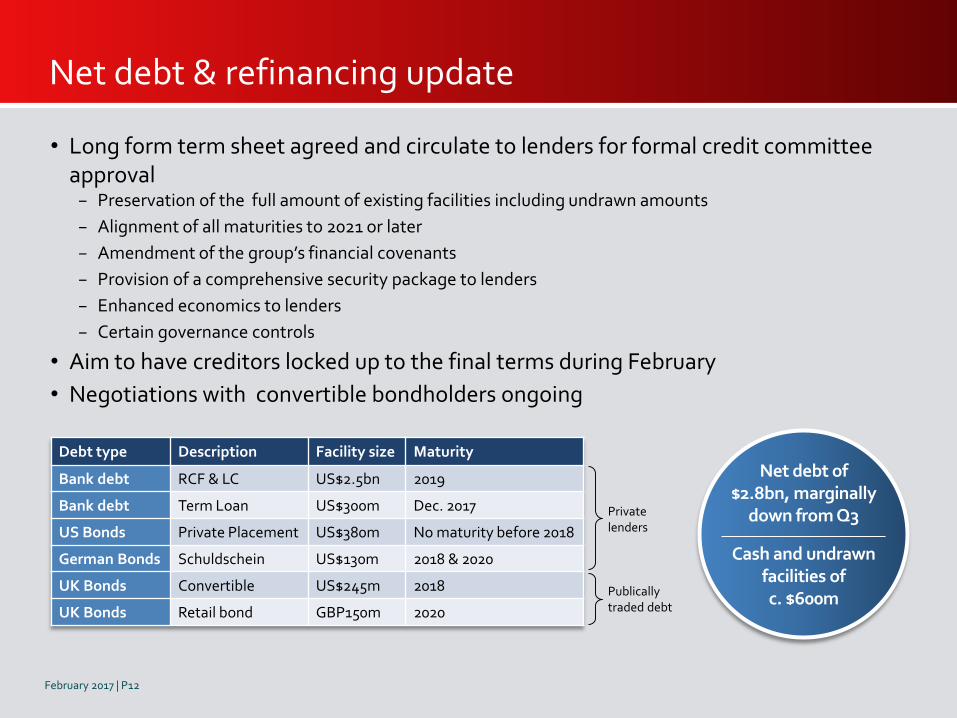
Net debt & refinancing update
February 2017 | P12
Debt type Description Facility size Maturity
Bank debt RCF & LC US$2.5bn 2019
Bank debt Term Loan US$300m Dec. 2017
US Bonds Private Placement US$380m No maturity before 2018
German Bonds Schuldschein US$130m 2018 & 2020
UK Bonds Convertible US$245m 2018
UK Bonds Retail bond GBP150m 2020
Privatelenders
Publicallytraded debt
• Long form term sheet agreed and circulate to lenders for formal credit committee approval
− Preservation of the full amount of existing facilities including undrawn amounts
− Alignment of all maturities to 2021 or later
− Amendment of the group’s financial covenants
− Provision of a comprehensive security package to lenders
− Enhanced economics to lenders
− Certain governance controls
• Aim to have creditors locked up to the final terms during February
• Negotiations with convertible bondholders ongoing
Net debt of$2.8bn, marginally
down from Q3
Cash and undrawn facilities ofc. $600m
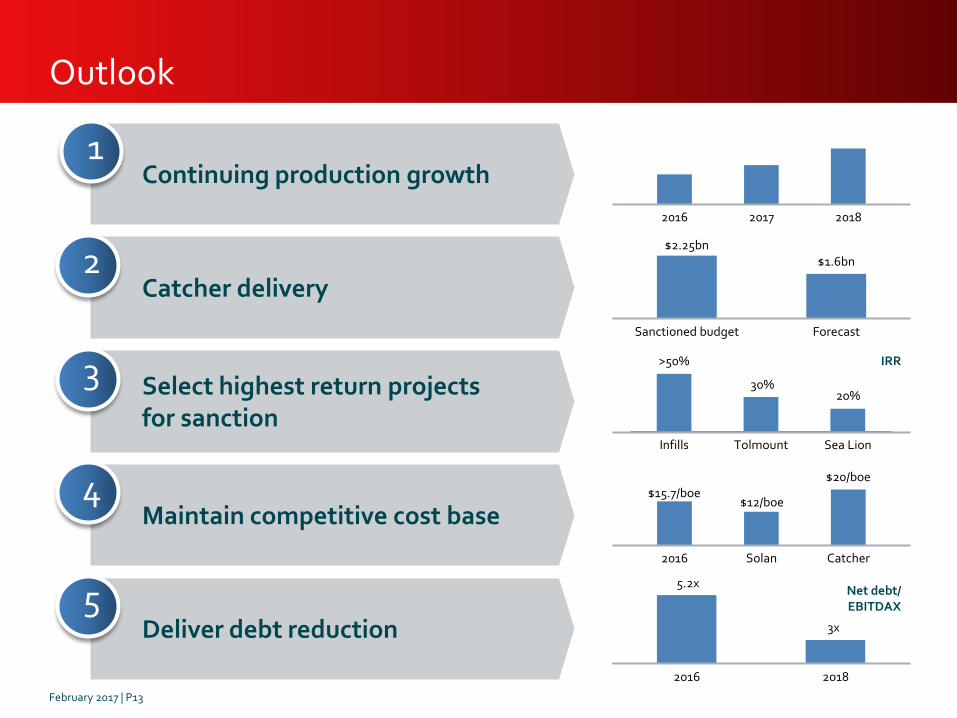
2016 2018
Infills Tolmount Sea Lion
$2.25bn$1.6bn
Sanctioned budget Forecast
Maintain competitive cost base
Continuing production growth
Catcher delivery
Select highest return projectsfor sanction
Deliver debt reduction
Outlook
1
2
3
4
5
20%
>50%
30%
2016 Solan Catcher
$15.7/boe
5.2x
3x
$12/boe
$20/boe
February 2017 | P13
2016 2017 2018
IRR
Net debt/EBITDAX

Premier Oil Plc23 Lower Belgrave StreetLondonSW1W 0NR
Tel: +44 (0)20 7730 1111Fax: +44 (0)20 7730 4696Email: [email protected]
www.premier-oil.com
February 2017