Embed Size (px)
Citation preview

© Copyright 2015 Quintiles
Second Quarter 2015Earnings CallJuly 29, 2015
2
This presentation contains forward-looking statements within the meaning of Section 27A of the Securities Act of 1933, as amended and Section 21E of the Securities Exchange Act of 1934, as amended. Such forward-looking statements reflect, among other things, the Company’s current expectations and anticipated results of operations, all of which are subject to known and unknown risks, uncertainties and other factors that may cause actual results, performance or achievements, market trends or industry results to differ materially from those expressed or implied by such forward-looking statements. Therefore, any statements contained herein that are not statements of historical fact may be forward-looking statements and should be evaluated as such. Without limiting the foregoing, the words “anticipates,” “believes,” “estimates,” “expects,” “intends,” “may,” “plans,” “projects,” “should,” “guidance,” “targets,” “will” and the negative thereof and similar words and expressions are intended to identify forward-looking statements. Actual results may differ materially from the Company’s expectations due to a number of factors, including, but not limited to, that most of the Company’s contracts may be terminated on short notice, the Company may be unable to maintain large customer contracts or to enter into new contracts, the Company may under-price its contracts, overrun its cost estimates, or fail to receive approval for or experience delays in documenting change orders, the historical indications of the relationship of backlog to revenues may not be indicative of their future relationship, the Company is subject to the complex and changing regulatory and international environments in which the Company operates, the Company may be unable to successfully identify, acquire and integrate businesses, the Company’s substantial indebtedness, the Company’s effective income tax rate may fluctuate, which may adversely affect our operations, earnings and earnings per share, and other risks more fully set forth in the Company's filings with the SEC, including the Company’s annual report on Form 10-K for the fiscal year ended December 31, 2014, as such factors may be amended or updated from time to time in the Company’s periodic filings with the SEC, which are accessible on the SEC's website at www.sec.gov. The Company assumes no obligation to update any forward-looking statement after the date of this presentation, whether as a result of new information, future developments or otherwise.
This presentation includes financial measures not prepared in accordance with accounting principles generally accepted in the United States (“GAAP”). Management believes that these non-GAAP financial measures provide useful supplemental information to management and investors regarding the underlying performance of the Company’s business operations and are more indicative of core operating results as they exclude certain items whose fluctuations from period-to-period do not necessarily correspond to changes in the core operations of the Company’s business. Investors and potential investors are encouraged to review the reconciliations of the non-GAAP financial measures to their most directly comparable GAAP measures attached to this presentation.
Forward Looking Statements and Use of Non-GAAP Financial Measures
3
Second Quarter 2015 Overview
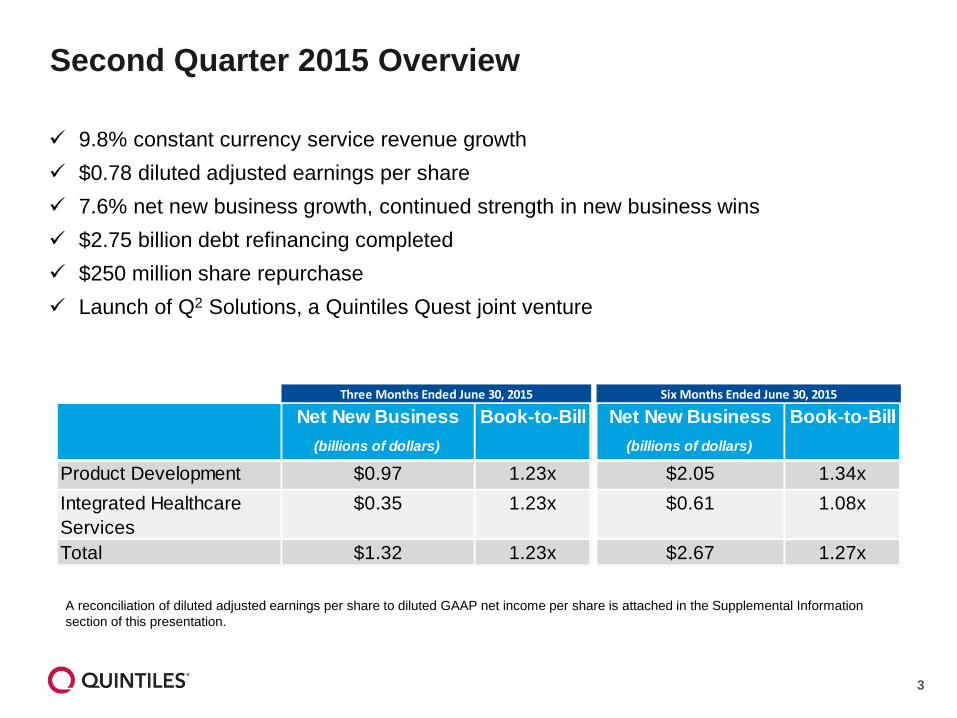
9.8% constant currency service revenue growth $0.78 diluted adjusted earnings per share 7.6% net new business growth, continued strength in new business wins $2.75 billion debt refinancing completed $250 million share repurchase Launch of Q2 Solutions, a Quintiles Quest joint venture
Net New Business Net New Business(billions of dollars) (billions of dollars)
Product Development $0.97 1.23x $2.05 1.34xIntegrated Healthcare Services
$0.35 1.23x $0.61 1.08x
Total $1.32 1.23x $2.67 1.27x
Three Months Ended June 30, 2015
Book-to-Bill Six Months Ended June 30, 2015
Book-to-Bill
A reconciliation of diluted adjusted earnings per share to diluted GAAP net income per share is attached in the Supplemental Information section of this presentation.

4
Financial Highlights and Other Metrics
Second Quarter 2015 Highlights
9.8% constant currency service revenue growth and 3.8% at actual exchange rates Higher IHS service revenue contribution with IHS segment service revenue growth of
22.9% at constant currency and 13.2% at actual exchange rates 160 basis points of expansion in adjusted income from operations margin due to
improved IHS margins at constant currency and foreign currency benefits in PD 20.0% increase in diluted adjusted earnings per share
1 Diluted Adjusted EPS is represented in dollars.
Reconciliations of the non-GAAP measures adjusted income from operations, adjusted income from operations margin, adjusted EBITDA, adjusted net income attributable to Quintiles, and diluted adjusted earnings per share to the corresponding GAAP measures are attached in the Supplemental Information section of this presentation.
(millions of dollars) 2015 2014 Change 2015 2014 ChangeNet New Business 1,322.0$ 1,228.0$ 7.6% 2,668.0$ 2,503.0$ 6.6%Service Revenues 1,074.4$ 1,035.5$ 3.8% 2,104.3$ 2,040.8$ 3.1%Adjusted Income from Operations 164.6$ 141.9$ 16.0% 313.2$ 284.3$ 10.2%Adjusted Income from Operations Margin 15.3% 13.7% 160 bps 14.9% 13.9% 100 bpsAdjusted EBITDA 189.3$ 172.1$ 10.0% 373.2$ 353.2$ 5.7%Adjusted Net Income Attributable to Quintiles 98.7$ 85.7$ 15.1% 189.9$ 176.6$ 7.6%Diluted Adjusted EPS1 0.78$ 0.65$ 20.0% 1.50$ 1.33$ 12.8%
Three Months Ended June 30 Six Months Ended June 30
5
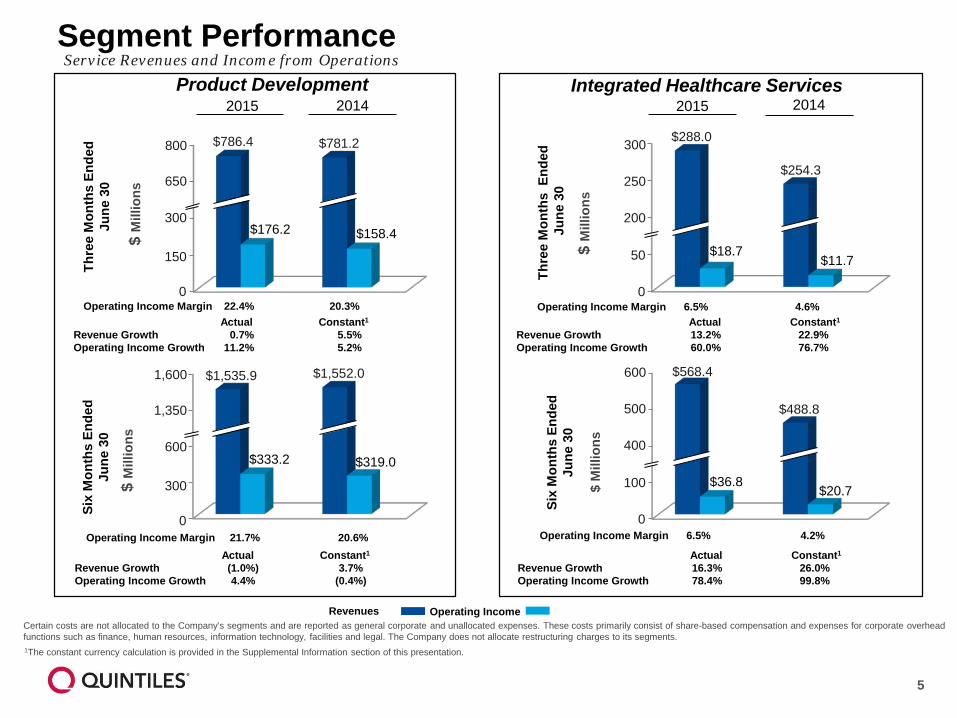
Segment Performance Service Revenues and Income from Operations
$ M
illio
ns$
Mill
ions
Product Development
$176.2 $158.4
$36.8 $20.7 $
Mill
ions
$18.7 $11.7
$ M
illio
ns
Integrated Healthcare Services
Certain costs are not allocated to the Company’s segments and are reported as general corporate and unallocated expenses. These costs primarily consist of share-based compensation and expenses for corporate overhead functions such as finance, human resources, information technology, facilities and legal. The Company does not allocate restructuring charges to its segments.
$333.2 $319.0
Actual Constant1 Actual Constant1
Revenue Growth 0.7% 5.5% Revenue Growth 13.2% 22.9% Operating Income Growth 11.2% 5.2% Operating Income Growth 60.0% 76.7%
1The constant currency calculation is provided in the Supplemental Information section of this presentation.
Thre
e M
onth
s En
ded
June
30
Six
Mon
ths
Ende
d Ju
ne 3
0
Thre
e M
onth
s E
nded
June
30
Six
Mon
ths
Ende
dJu
ne 3
0
2015 2014
Operating Income Margin 22.4% 20.3% Operating Income Margin 6.5% 4.6%
2015 2014
Operating Income Margin 21.7% 20.6% Operating Income Margin 6.5% 4.2%
Revenues Operating Income
Actual Constant1 Actual Constant1
Revenue Growth (1.0%) 3.7% Revenue Growth 16.3% 26.0% Operating Income Growth 4.4% (0.4%) Operating Income Growth 78.4% 99.8%
$786.4 $781.2
0
150
300
650
800
0
50
200
250
300 $288.0
$254.3
0
300
600
1,350
1,600 $1,535.9 $1,552.0
0
100
400
500
600 $568.4
$488.8
6
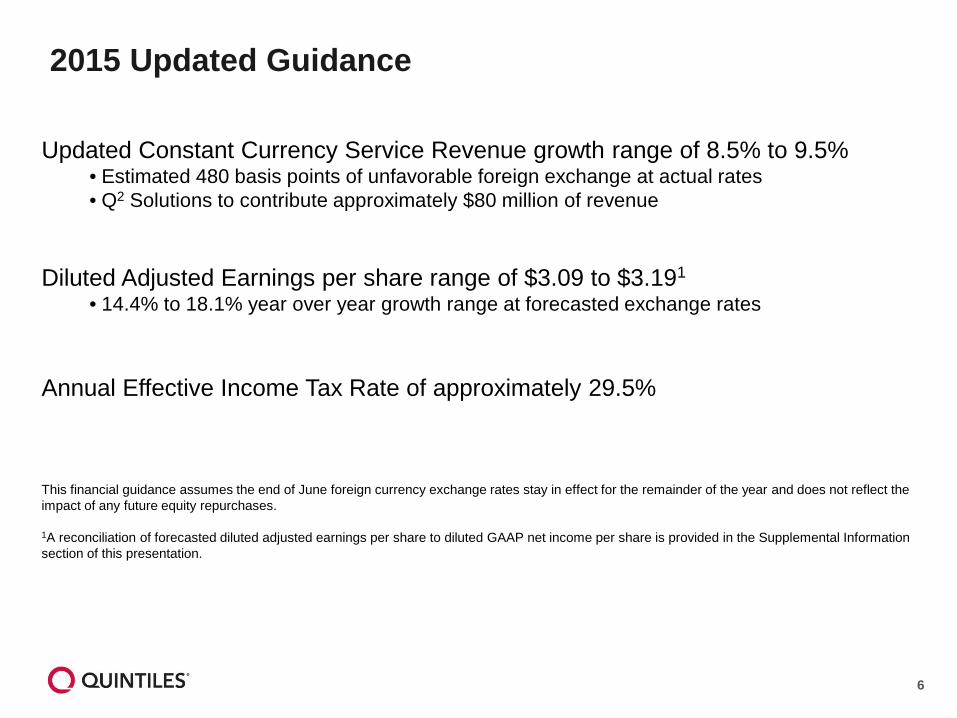
2015 Updated Guidance
Updated Constant Currency Service Revenue growth range of 8.5% to 9.5%• Estimated 480 basis points of unfavorable foreign exchange at actual rates• Q2 Solutions to contribute approximately $80 million of revenue
Diluted Adjusted Earnings per share range of $3.09 to $3.191
• 14.4% to 18.1% year over year growth range at forecasted exchange rates
Annual Effective Income Tax Rate of approximately 29.5%
This financial guidance assumes the end of June foreign currency exchange rates stay in effect for the remainder of the year and does not reflect the impact of any future equity repurchases.
1A reconciliation of forecasted diluted adjusted earnings per share to diluted GAAP net income per share is provided in the Supplemental Information section of this presentation.
7
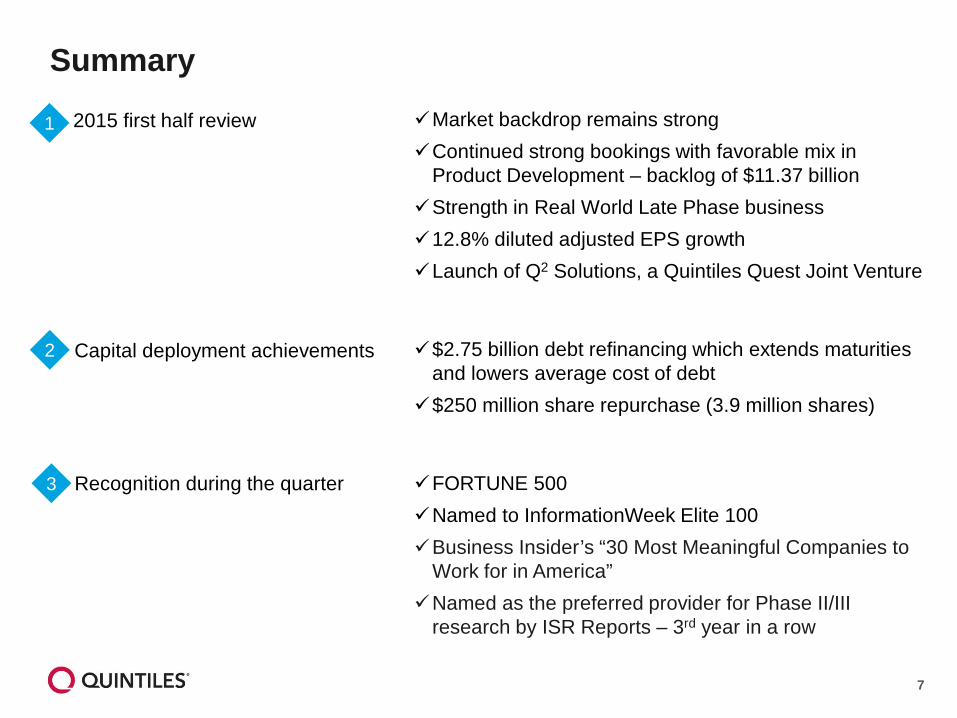
Market backdrop remains strongContinued strong bookings with favorable mix in
Product Development – backlog of $11.37 billionStrength in Real World Late Phase business12.8% diluted adjusted EPS growthLaunch of Q2 Solutions, a Quintiles Quest Joint Venture
$2.75 billion debt refinancing which extends maturities and lowers average cost of debt
$250 million share repurchase (3.9 million shares)
FORTUNE 500 Named to InformationWeek Elite 100Business Insider’s “30 Most Meaningful Companies to
Work for in America”Named as the preferred provider for Phase II/III
research by ISR Reports – 3rd year in a row
2015 first half review1
3
Capital deployment achievements
Recognition during the quarter
2
Summary
8
Supplemental InformationConstant Currency Reconciliation
Contractual Revenue Currency Mix and Foreign Exchange Analysis
Income Statement Non-GAAP Reconciliation
Adjusted EBITDA Reconciliation
Adjusted Net Income and EPS Reconciliation
Non-GAAP 2015 Guidance Reconciliation
9
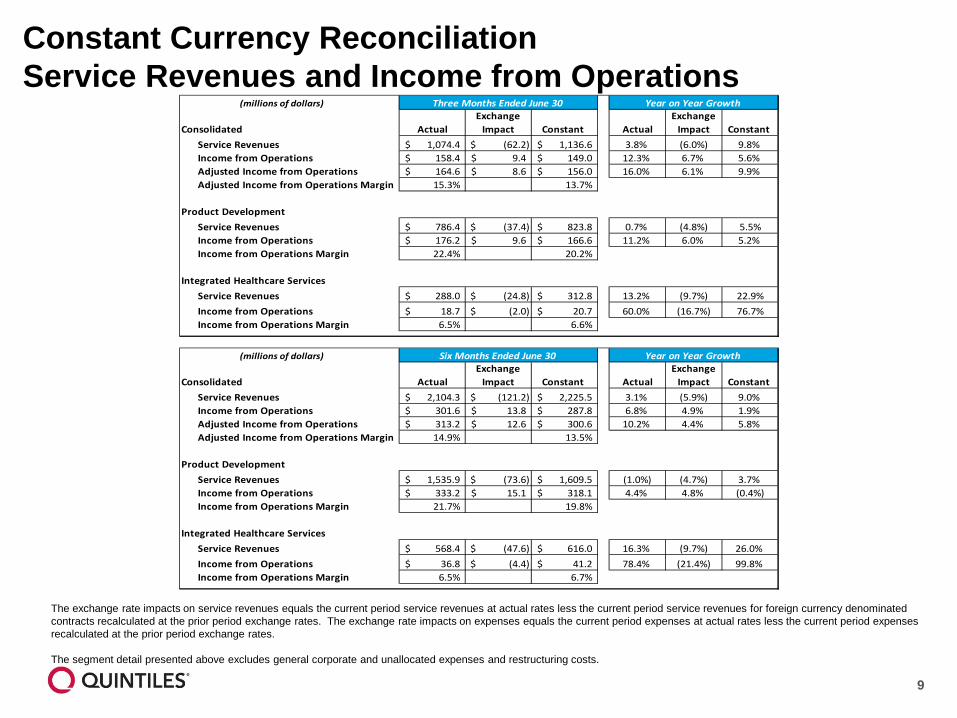
Constant Currency ReconciliationService Revenues and Income from Operations
The exchange rate impacts on service revenues equals the current period service revenues at actual rates less the current period service revenues for foreign currency denominated contracts recalculated at the prior period exchange rates. The exchange rate impacts on expenses equals the current period expenses at actual rates less the current period expenses recalculated at the prior period exchange rates.
The segment detail presented above excludes general corporate and unallocated expenses and restructuring costs.
(millions of dollars)
Consolidated ActualExchange
Impact Constant ActualExchange
Impact Constant Service Revenues 1,074.4$ (62.2)$ 1,136.6$ 3.8% (6.0%) 9.8%Income from Operations 158.4$ 9.4$ 149.0$ 12.3% 6.7% 5.6%Adjusted Income from Operations 164.6$ 8.6$ 156.0$ 16.0% 6.1% 9.9%Adjusted Income from Operations Margin 15.3% 13.7%
Product DevelopmentService Revenues 786.4$ (37.4)$ 823.8$ 0.7% (4.8%) 5.5%Income from Operations 176.2$ 9.6$ 166.6$ 11.2% 6.0% 5.2%Income from Operations Margin 22.4% 20.2%
Integrated Healthcare ServicesService Revenues 288.0$ (24.8)$ 312.8$ 13.2% (9.7%) 22.9%Income from Operations 18.7$ (2.0)$ 20.7$ 60.0% (16.7%) 76.7%Income from Operations Margin 6.5% 6.6%
Three Months Ended June 30 Year on Year Growth
(millions of dollars)
Consolidated ActualExchange
Impact Constant ActualExchange
Impact Constant Service Revenues 2,104.3$ (121.2)$ 2,225.5$ 3.1% (5.9%) 9.0%Income from Operations 301.6$ 13.8$ 287.8$ 6.8% 4.9% 1.9%Adjusted Income from Operations 313.2$ 12.6$ 300.6$ 10.2% 4.4% 5.8%Adjusted Income from Operations Margin 14.9% 13.5%
Product DevelopmentService Revenues 1,535.9$ (73.6)$ 1,609.5$ (1.0%) (4.7%) 3.7%Income from Operations 333.2$ 15.1$ 318.1$ 4.4% 4.8% (0.4%)Income from Operations Margin 21.7% 19.8%
Integrated Healthcare ServicesService Revenues 568.4$ (47.6)$ 616.0$ 16.3% (9.7%) 26.0%Income from Operations 36.8$ (4.4)$ 41.2$ 78.4% (21.4%) 99.8%Income from Operations Margin 6.5% 6.7%
Year on Year GrowthSix Months Ended June 30
10
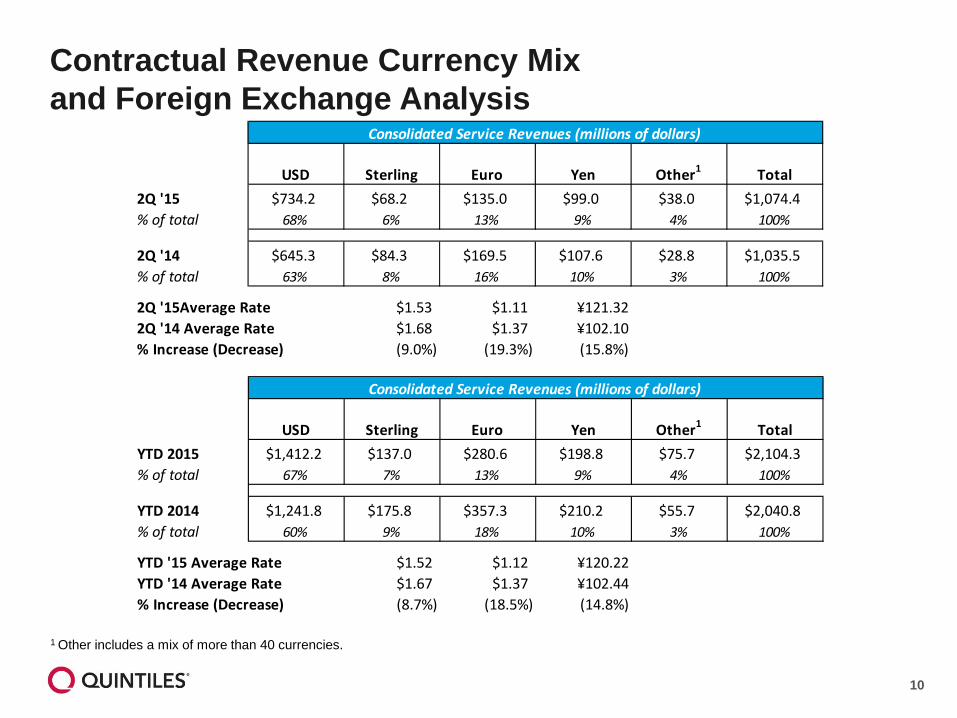
1 Other includes a mix of more than 40 currencies.
Contractual Revenue Currency Mixand Foreign Exchange Analysis
USD Sterling Euro Yen Other1 Total2Q '15 $734.2 $68.2 $135.0 $99.0 $38.0 $1,074.4% of total 68% 6% 13% 9% 4% 100%
2Q '14 $645.3 $84.3 $169.5 $107.6 $28.8 $1,035.5% of total 63% 8% 16% 10% 3% 100%
2Q '15Average Rate $1.53 $1.11 ¥121.322Q '14 Average Rate $1.68 $1.37 ¥102.10% Increase (Decrease) (9.0%) (19.3%) (15.8%)
Consolidated Service Revenues (millions of dollars)
USD Sterling Euro Yen Other1 TotalYTD 2015 $1,412.2 $137.0 $280.6 $198.8 $75.7 $2,104.3% of total 67% 7% 13% 9% 4% 100%
YTD 2014 $1,241.8 $175.8 $357.3 $210.2 $55.7 $2,040.8% of total 60% 9% 18% 10% 3% 100%
YTD '15 Average Rate $1.52 $1.12 ¥120.22YTD '14 Average Rate $1.67 $1.37 ¥102.44% Increase (Decrease) (8.7%) (18.5%) (14.8%)
Consolidated Service Revenues (millions of dollars)
11
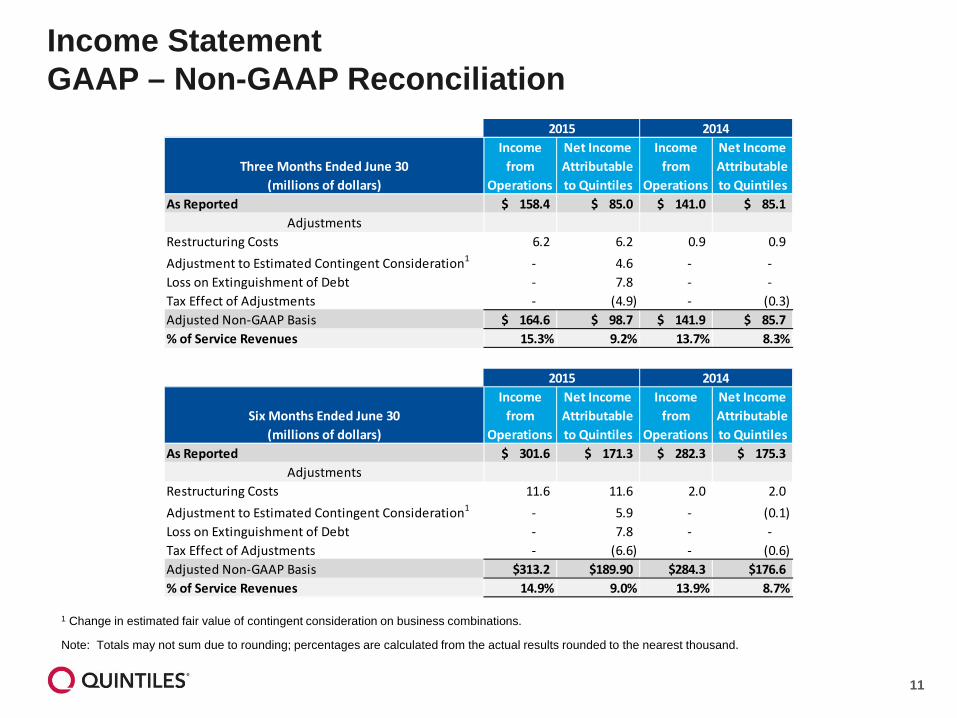
1 Change in estimated fair value of contingent consideration on business combinations.
Note: Totals may not sum due to rounding; percentages are calculated from the actual results rounded to the nearest thousand.
Income Statement GAAP – Non-GAAP Reconciliation
Three Months Ended June 30(millions of dollars)
Income from
Operations
Net Income Attributable to Quintiles
Income from
Operations
Net Income Attributable to Quintiles
As Reported $ 158.4 $ 85.0 $ 141.0 $ 85.1Adjustments
Restructuring Costs 6.2 6.2 0.9 0.9 Adjustment to Estimated Contingent Consideration1 - 4.6 - - Loss on Extinguishment of Debt - 7.8 - - Tax Effect of Adjustments - (4.9) - (0.3) Adjusted Non-GAAP Basis $ 164.6 $ 98.7 $ 141.9 $ 85.7% of Service Revenues 15.3% 9.2% 13.7% 8.3%
2015 2014
Six Months Ended June 30(millions of dollars)
Income from
Operations
Net Income Attributable to Quintiles
Income from
Operations
Net Income Attributable to Quintiles
As Reported $ 301.6 $ 171.3 $ 282.3 $ 175.3Adjustments
Restructuring Costs 11.6 11.6 2.0 2.0 Adjustment to Estimated Contingent Consideration1 - 5.9 - (0.1) Loss on Extinguishment of Debt - 7.8 - - Tax Effect of Adjustments - (6.6) - (0.6) Adjusted Non-GAAP Basis $313.2 $189.90 $284.3 $176.6% of Service Revenues 14.9% 9.0% 13.9% 8.7%
2015 2014
12
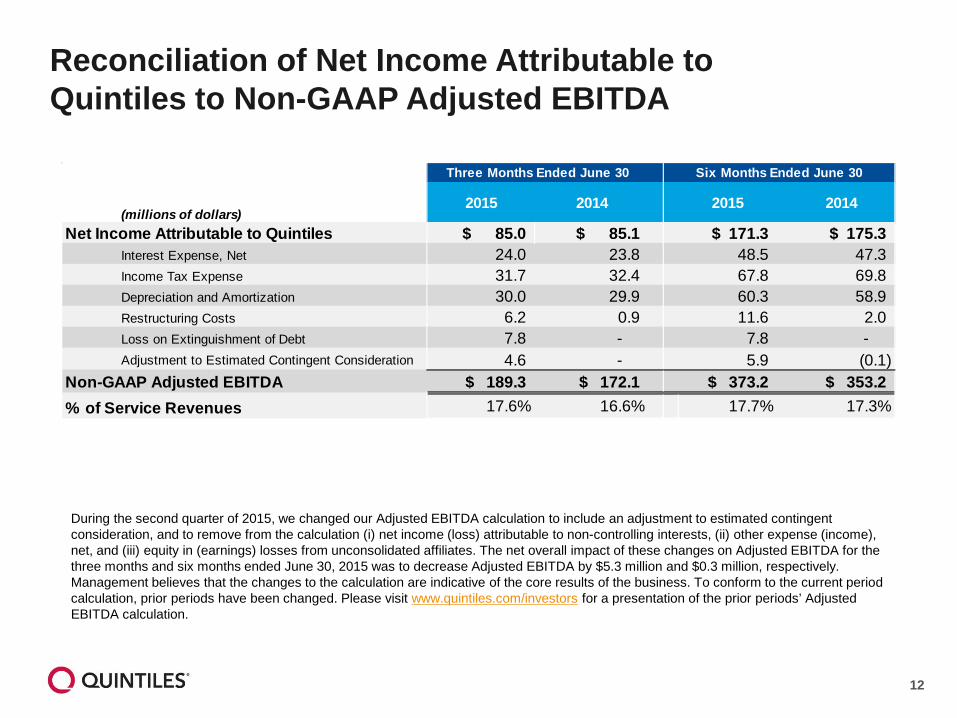
Reconciliation of Net Income Attributable to Quintiles to Non-GAAP Adjusted EBITDA
(millions of dollars)2015 2014 2015 2014
Net Income Attributable to Quintiles $ 85.0 $ 85.1 $ 171.3 $ 175.3Interest Expense, Net 24.0 23.8 48.5 47.3 Income Tax Expense 31.7 32.4 67.8 69.8 Depreciation and Amortization 30.0 29.9 60.3 58.9 Restructuring Costs 6.2 0.9 11.6 2.0 Loss on Extinguishment of Debt 7.8 - 7.8 - Adjustment to Estimated Contingent Consideration 4.6 - 5.9 (0.1)
Non-GAAP Adjusted EBITDA $ 189.3 $ 172.1 $ 373.2 $ 353.2% of Service Revenues 17.6% 16.6% 17.7% 17.3%
Three Months Ended June 30 Six Months Ended June 30
During the second quarter of 2015, we changed our Adjusted EBITDA calculation to include an adjustment to estimated contingent consideration, and to remove from the calculation (i) net income (loss) attributable to non-controlling interests, (ii) other expense (income), net, and (iii) equity in (earnings) losses from unconsolidated affiliates. The net overall impact of these changes on Adjusted EBITDA for the three months and six months ended June 30, 2015 was to decrease Adjusted EBITDA by $5.3 million and $0.3 million, respectively. Management believes that the changes to the calculation are indicative of the core results of the business. To conform to the current period calculation, prior periods have been changed. Please visit www.quintiles.com/investors for a presentation of the prior periods’ Adjusted EBITDA calculation.
13
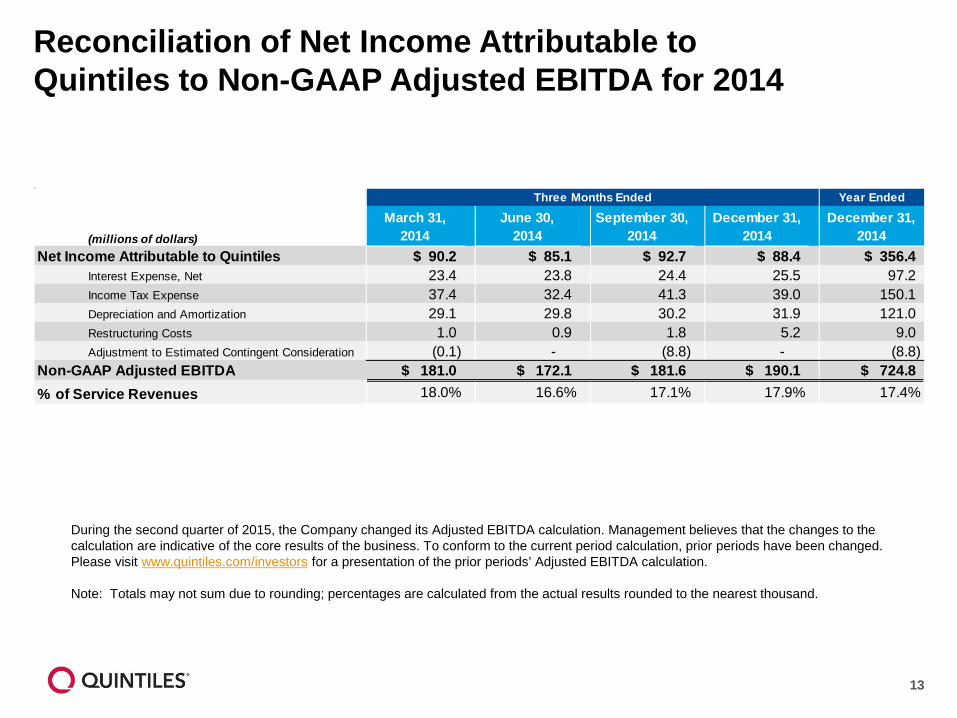
Reconciliation of Net Income Attributable to Quintiles to Non-GAAP Adjusted EBITDA for 2014
During the second quarter of 2015, the Company changed its Adjusted EBITDA calculation. Management believes that the changes to the calculation are indicative of the core results of the business. To conform to the current period calculation, prior periods have been changed. Please visit www.quintiles.com/investors for a presentation of the prior periods’ Adjusted EBITDA calculation.
Note: Totals may not sum due to rounding; percentages are calculated from the actual results rounded to the nearest thousand.
Year Ended
(millions of dollars)
March 31,2014
June 30,2014
September 30,2014
December 31,2014
December 31,2014
Net Income Attributable to Quintiles $ 90.2 $ 85.1 $ 92.7 $ 88.4 $ 356.4Interest Expense, Net 23.4 23.8 24.4 25.5 97.2 Income Tax Expense 37.4 32.4 41.3 39.0 150.1 Depreciation and Amortization 29.1 29.8 30.2 31.9 121.0 Restructuring Costs 1.0 0.9 1.8 5.2 9.0 Adjustment to Estimated Contingent Consideration (0.1) - (8.8) - (8.8)
Non-GAAP Adjusted EBITDA $ 181.0 $ 172.1 $ 181.6 $ 190.1 $ 724.8% of Service Revenues 18.0% 16.6% 17.1% 17.9% 17.4%
Three Months Ended
14
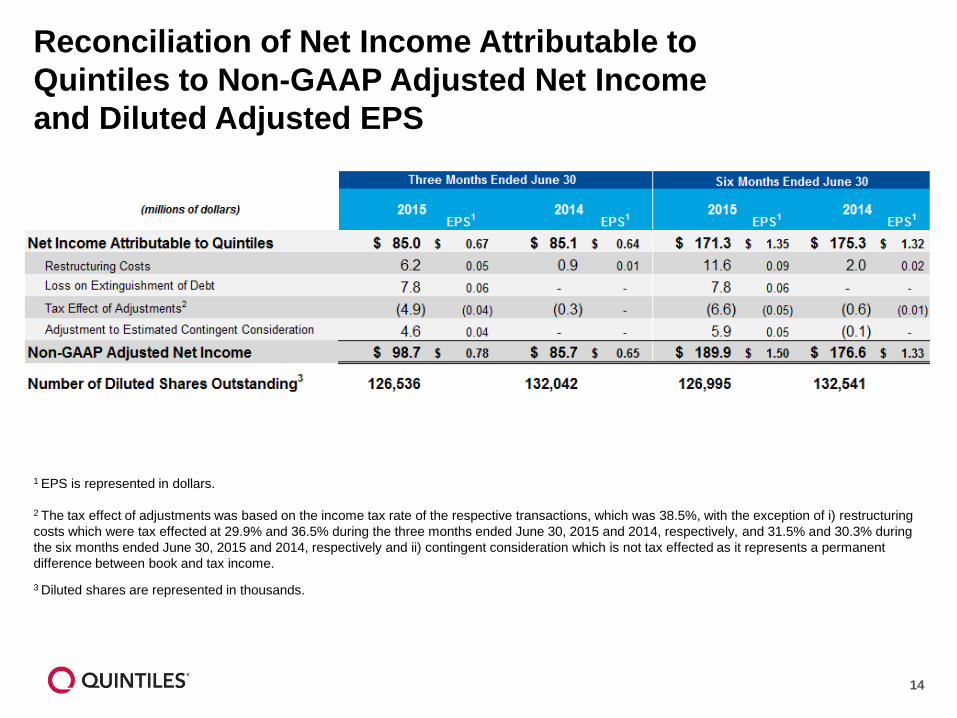
Reconciliation of Net Income Attributable to Quintiles to Non-GAAP Adjusted Net Income and Diluted Adjusted EPS
1 EPS is represented in dollars.
2 The tax effect of adjustments was based on the income tax rate of the respective transactions, which was 38.5%, with the exception of i) restructuring costs which were tax effected at 29.9% and 36.5% during the three months ended June 30, 2015 and 2014, respectively, and 31.5% and 30.3% during the six months ended June 30, 2015 and 2014, respectively and ii) contingent consideration which is not tax effected as it represents a permanent difference between book and tax income.
3 Diluted shares are represented in thousands.
15
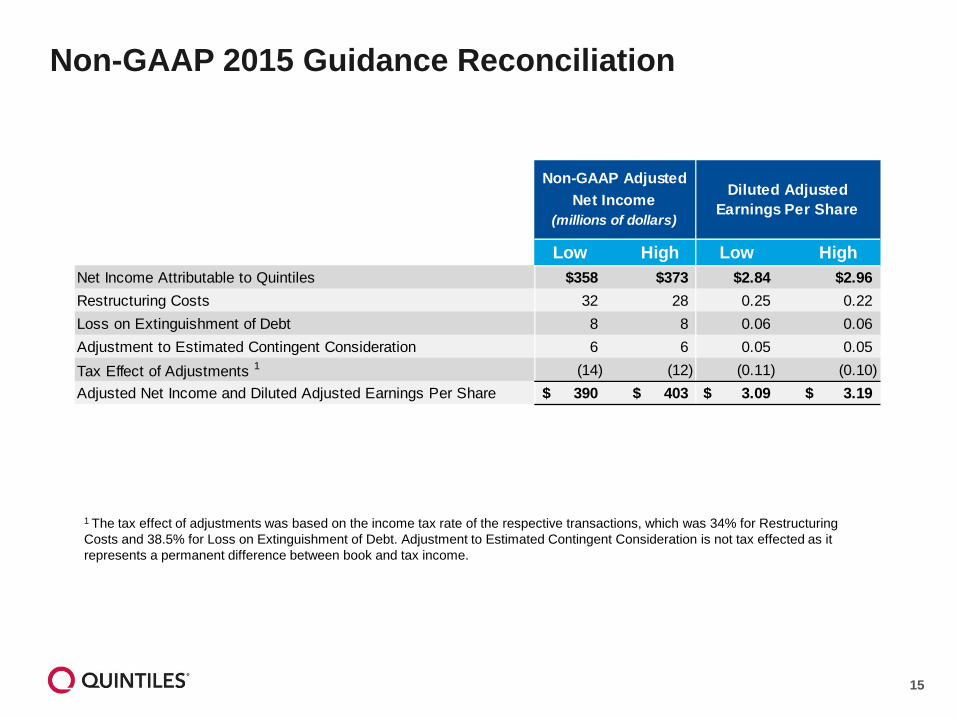
Non-GAAP 2015 Guidance Reconciliation
1 The tax effect of adjustments was based on the income tax rate of the respective transactions, which was 34% for Restructuring Costs and 38.5% for Loss on Extinguishment of Debt. Adjustment to Estimated Contingent Consideration is not tax effected as it represents a permanent difference between book and tax income.
Low High Low HighNet Income Attributable to Quintiles $358 $373 $2.84 $2.96Restructuring Costs 32 28 0.25 0.22 Loss on Extinguishment of Debt 8 8 0.06 0.06 Adjustment to Estimated Contingent Consideration 6 6 0.05 0.05 Tax Effect of Adjustments 1 (14) (12) (0.11) (0.10) Adjusted Net Income and Diluted Adjusted Earnings Per Share 390$ 403$ 3.09$ 3.19$
Non-GAAP Adjusted Net Income
(millions of dollars)
Diluted Adjusted Earnings Per Share