Embed Size (px)
Citation preview
SCA Year-end Report 2014
Jan Johansson, President and CEO
January 30, 2015 Year-end Report 2014 2
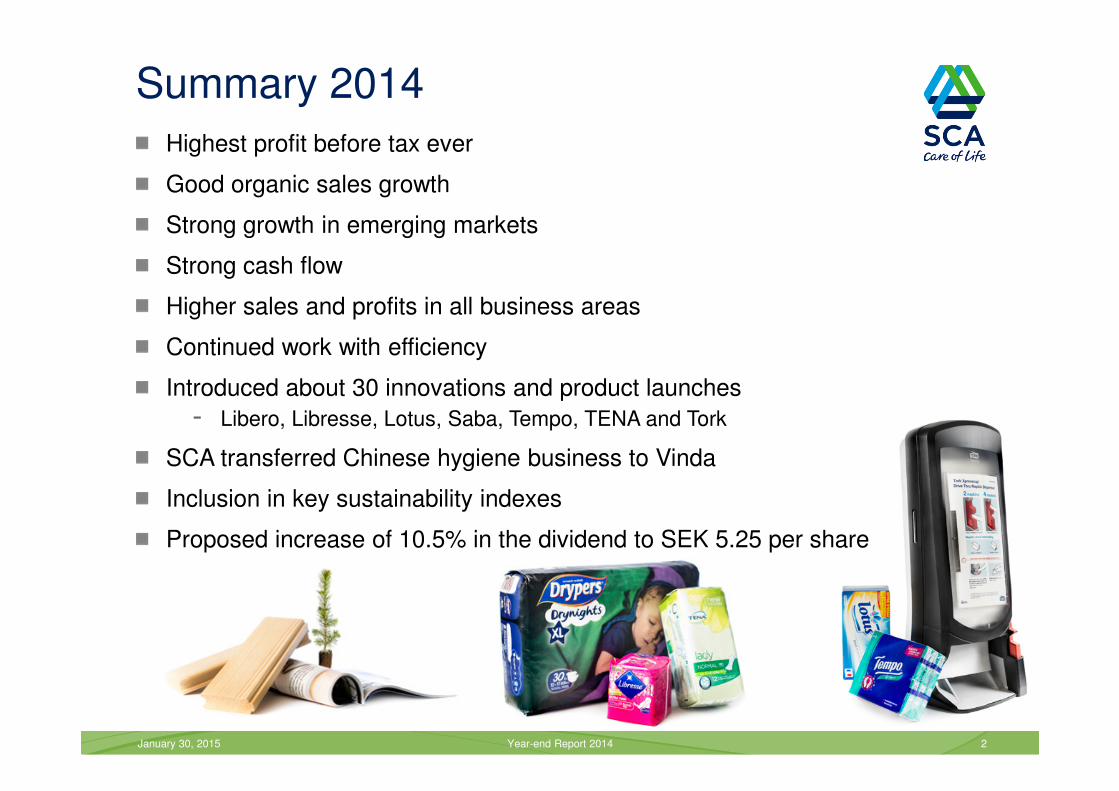
Summary 2014
Highest profit before tax ever
Good organic sales growth
Strong growth in emerging markets
Strong cash flow
Higher sales and profits in all business areas
Continued work with efficiency
Introduced about 30 innovations and product launches
- Libero, Libresse, Lotus, Saba, Tempo, TENA and Tork
SCA transferred Chinese hygiene business to Vinda
Inclusion in key sustainability indexes
Proposed increase of 10.5% in the dividend to SEK 5.25 per share
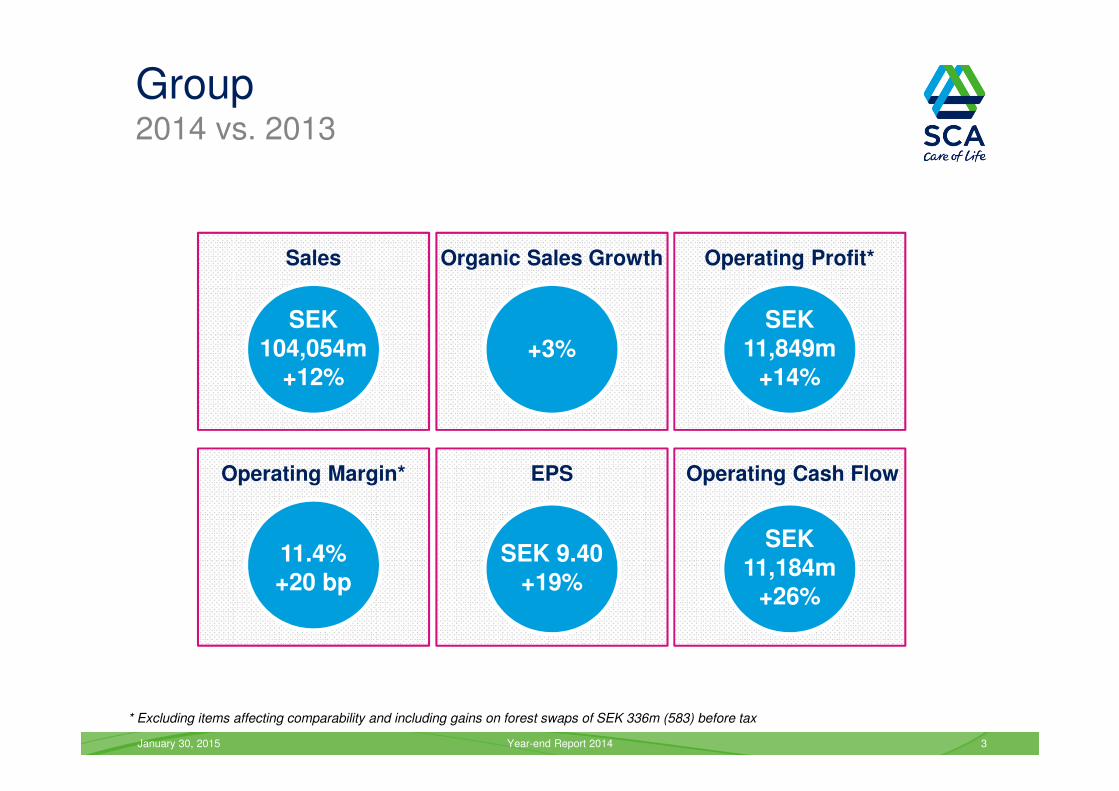
Group2014 vs. 2013
January 30, 2015 Year-end Report 2014 3
Organic Sales Growth Operating Profit*
Operating Margin* Operating Cash FlowEPS
Sales
SEK104,054m
+12%
* Excluding items affecting comparability and including gains on forest swaps of SEK 336m (583) before tax
SEK11,849m
+14%
11.4%
+20 bp
SEK 9.40
+19%
SEK
11,184m
+26%
+3%
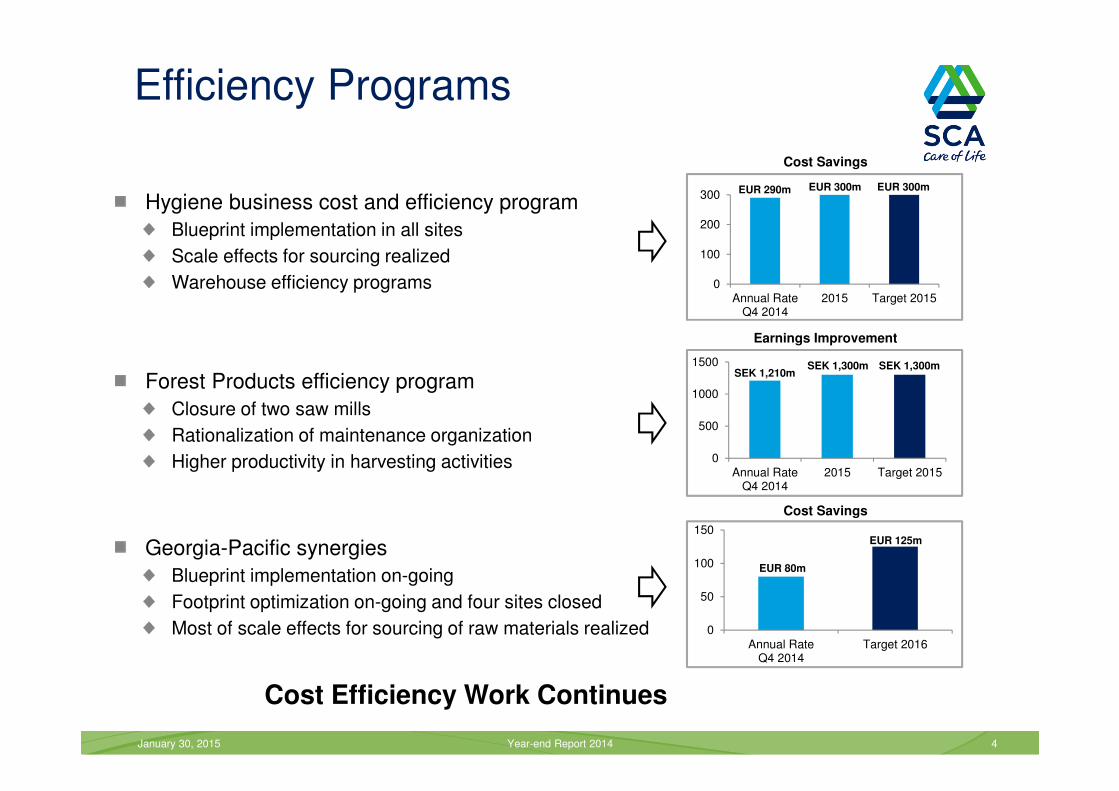
Efficiency Programs
January 30, 2015 Year-end Report 2014 4
Hygiene business cost and efficiency program
Blueprint implementation in all sites
Scale effects for sourcing realized
Warehouse efficiency programs 0
100
200
300
Annual RateQ4 2014
2015 Target 2015
Cost Savings
0
500
1000
1500
Annual RateQ4 2014
2015 Target 2015
0
50
100
150
Annual RateQ4 2014
Target 2016
EUR 290m EUR 300m EUR 300m
SEK 1,210mSEK 1,300m SEK 1,300m
EUR 80m
EUR 125m
Cost Efficiency Work Continues
Cost Savings
Earnings Improvement
Forest Products efficiency program
Closure of two saw mills
Rationalization of maintenance organization
Higher productivity in harvesting activities
Georgia-Pacific synergies
Blueprint implementation on-going
Footprint optimization on-going and four sites closed
Most of scale effects for sourcing of raw materials realized
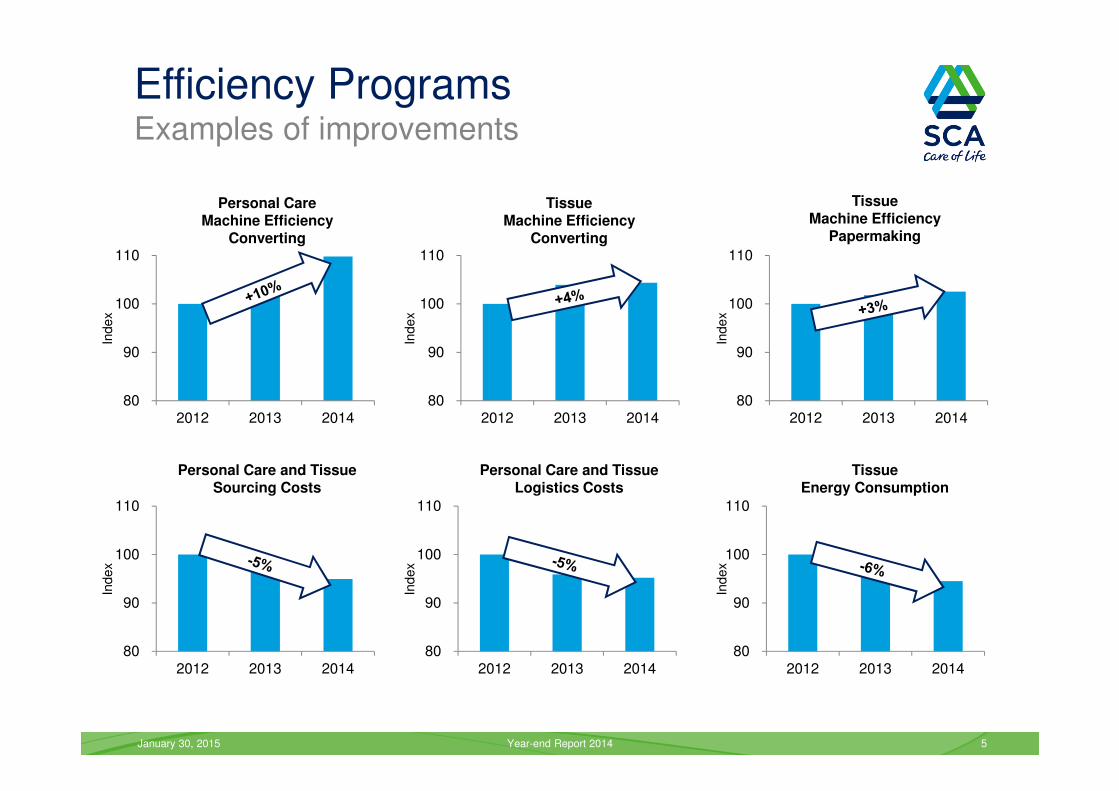
Efficiency ProgramsExamples of improvements
January 30, 2015 5Year-end Report 2014
80
90
100
110
2012 2013 2014
Personal CareMachine Efficiency
Converting
80
90
100
110
2012 2013 2014
TissueMachine Efficiency
Converting
80
90
100
110
2012 2013 2014
TissueMachine Efficiency
Papermaking
80
90
100
110
2012 2013 2014 80
90
100
110
2012 2013 2014 80
90
100
110
2012 2013 2014
Personal Care and TissueSourcing Costs
Personal Care and TissueLogistics Costs
TissueEnergy Consumption
Index
Index
Index
Index
Index
Index
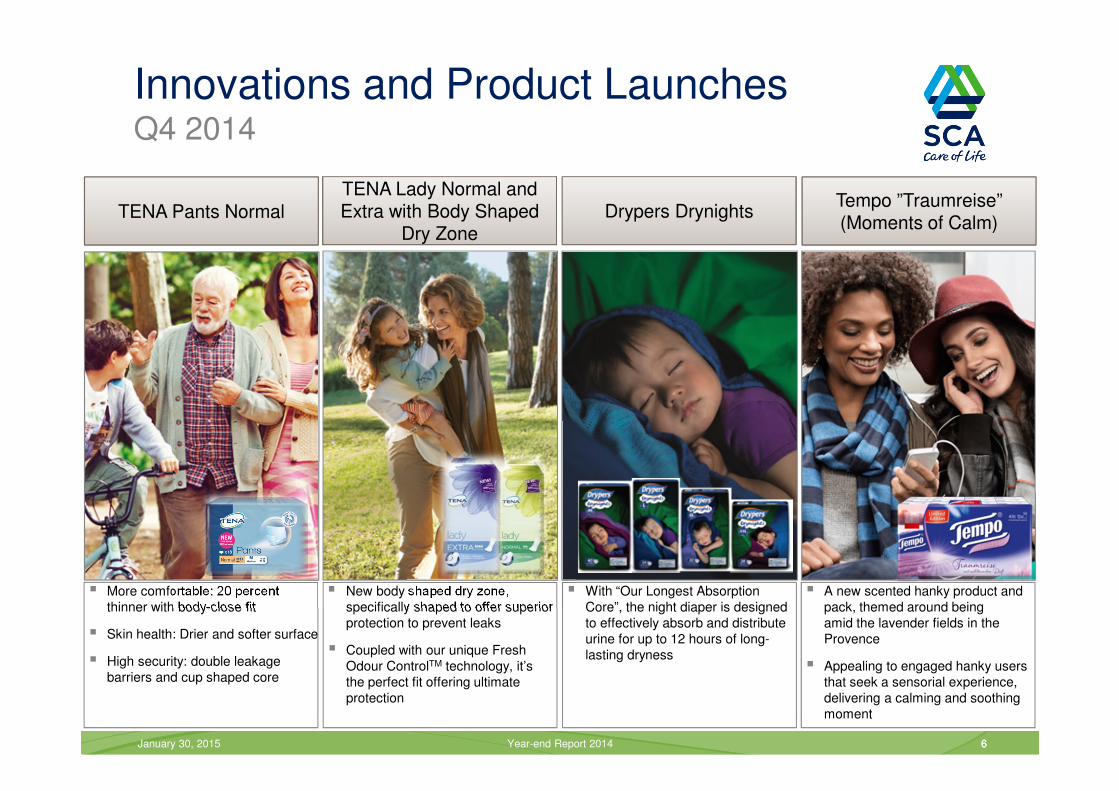
Innovations and Product Launches Q4 2014
TENA Lady Normal and Extra with Body Shaped
Dry Zone
� New body shaped dry zone,
specifically shaped to offer superior
protection to prevent leaks
� Coupled with our unique Fresh
Odour ControlTM technology, it’s
the perfect fit offering ultimate
protection
� More comfortable: 20 percent
thinner with body-close fit
� Skin health: Drier and softer surface
� High security: double leakage
barriers and cup shaped core
Year-end Report 2014 6
TENA Pants Normal
6January 30, 2015
Drypers Drynights
� With “Our Longest Absorption
Core”, the night diaper is designed
to effectively absorb and distribute
urine for up to 12 hours of long-
lasting dryness
� A new scented hanky product and
pack, themed around being
amid the lavender fields in the
Provence
� Appealing to engaged hanky users
that seek a sensorial experience,
delivering a calming and soothing
moment
Tempo ”Traumreise”(Moments of Calm)
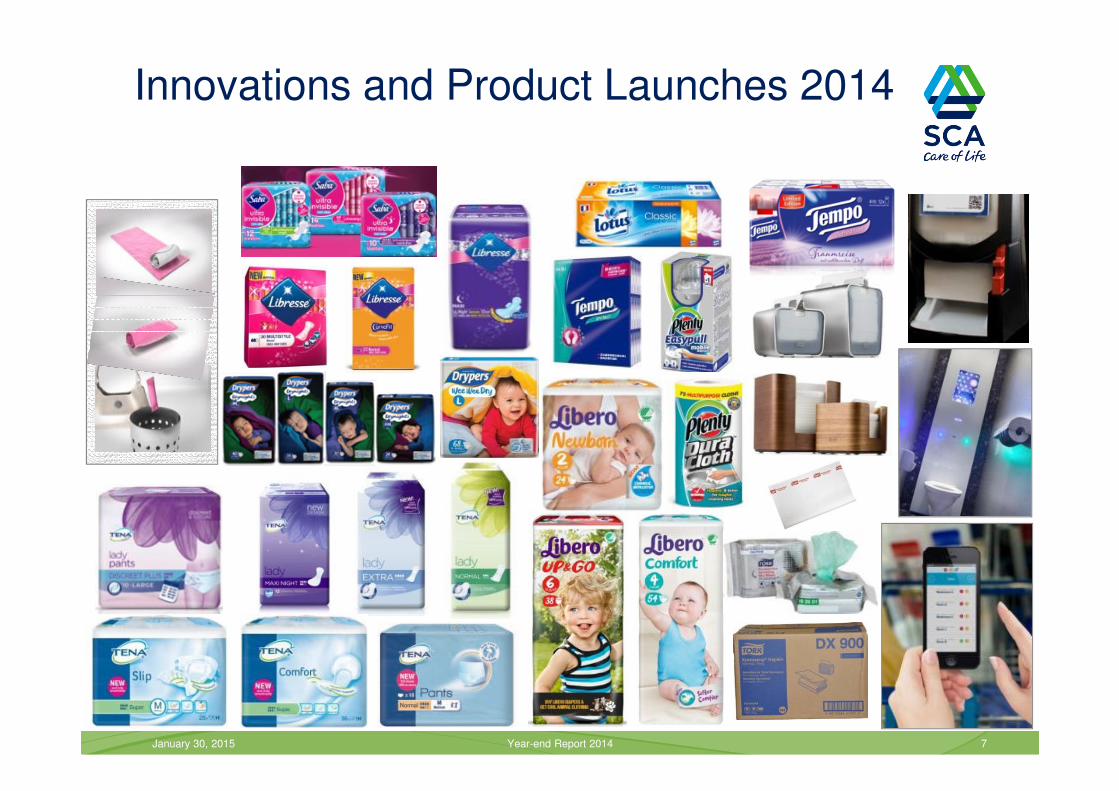
Innovations and Product Launches 2014
January 30, 2015 Year-end Report 2014 7
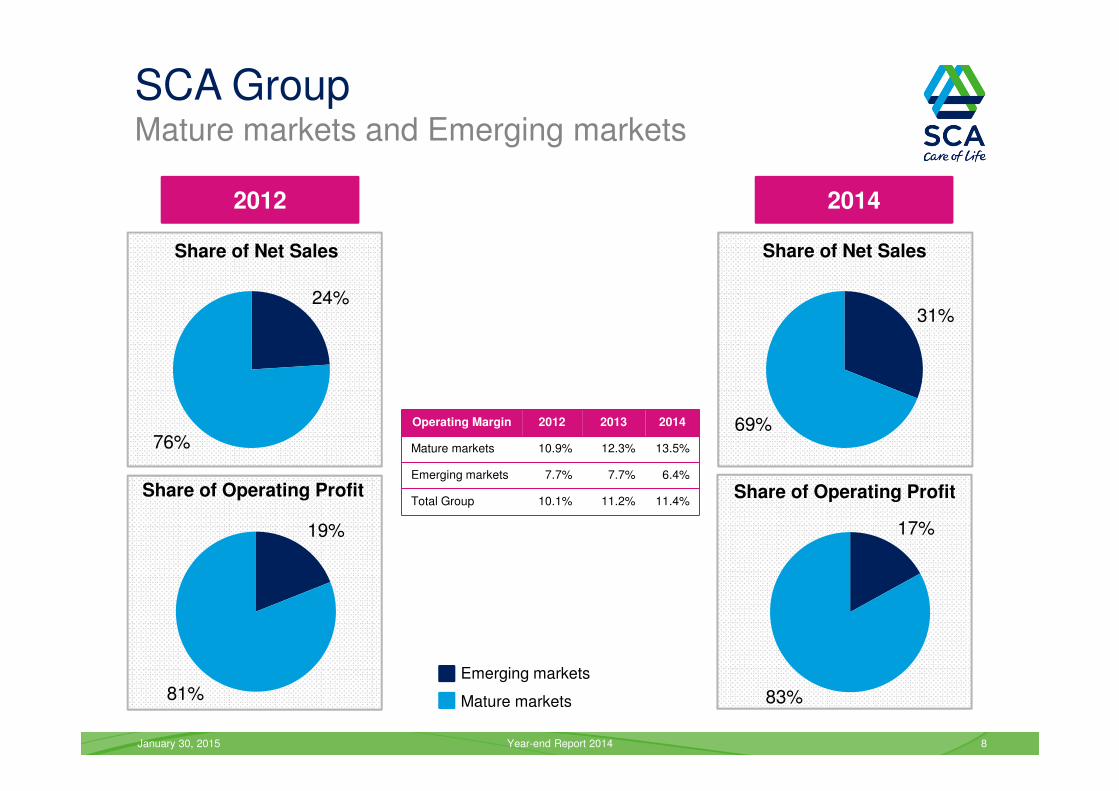
20142012
24%
76%
Share of Net Sales
31%
69%
Share of Net Sales
17%
83%
Share of Operating Profit
SCA GroupMature markets and Emerging markets
19%
81%
Share of Operating Profit
Operating Margin 2012 2013 2014
Mature markets 10.9% 12.3% 13.5%
Emerging markets 7.7% 7.7% 6.4%
Total Group 10.1% 11.2% 11.4%
January 30, 2015 Year-end Report 2014 8
Emerging markets
Mature markets
January 30, 2015 Year-end Report 2014 9
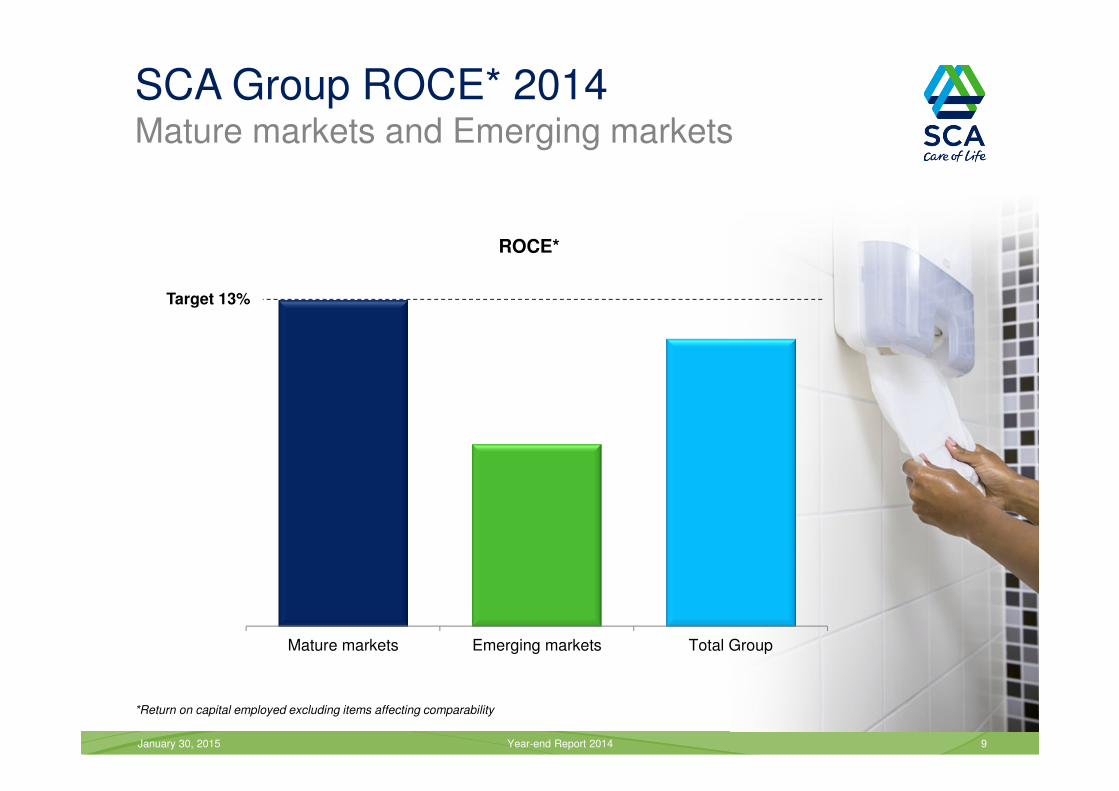
*Return on capital employed excluding items affecting comparability
SCA Group ROCE* 2014Mature markets and Emerging markets
Mature markets Emerging markets Total Group
Target 13%
ROCE*
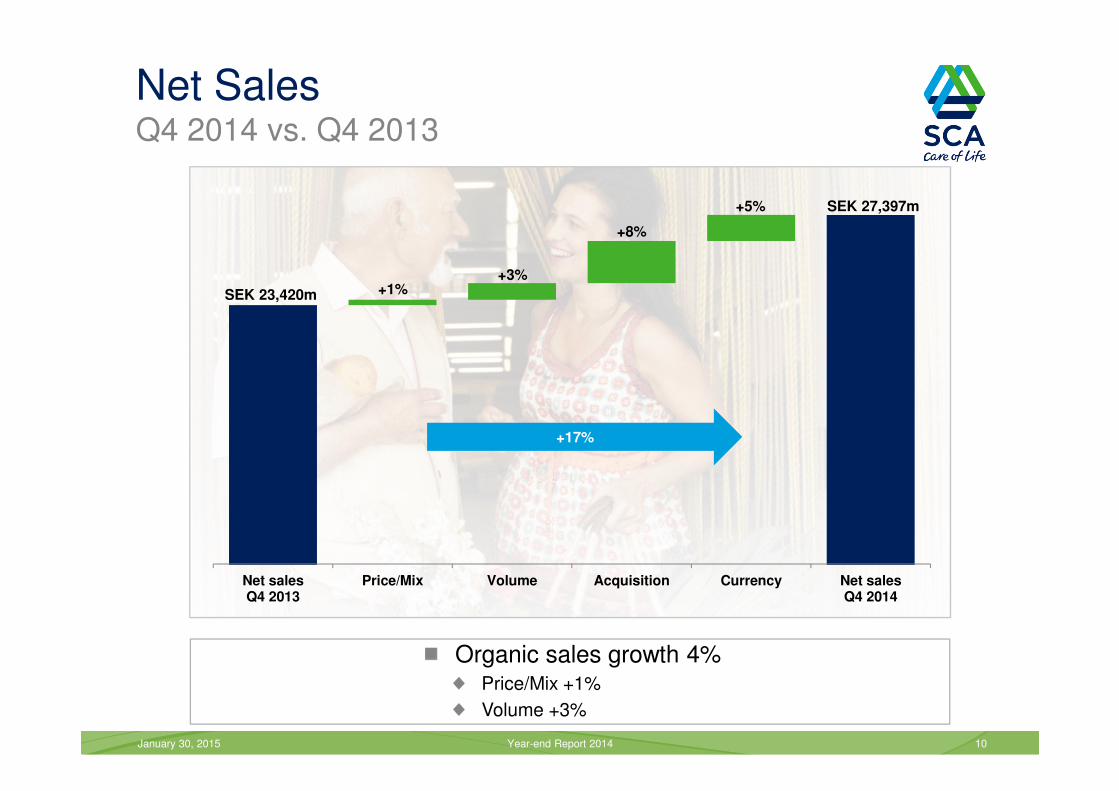
Net salesQ4 2013
Price/Mix Volume Acquisition Currency Net salesQ4 2014
Organic sales growth 4%Price/Mix +1%
Volume +3%
January 30, 2015 Year-end Report 2014 10
+1%+3%
+5%
SEK 23,420m
+8%
SEK 27,397m
Net SalesQ4 2014 vs. Q4 2013
+17%
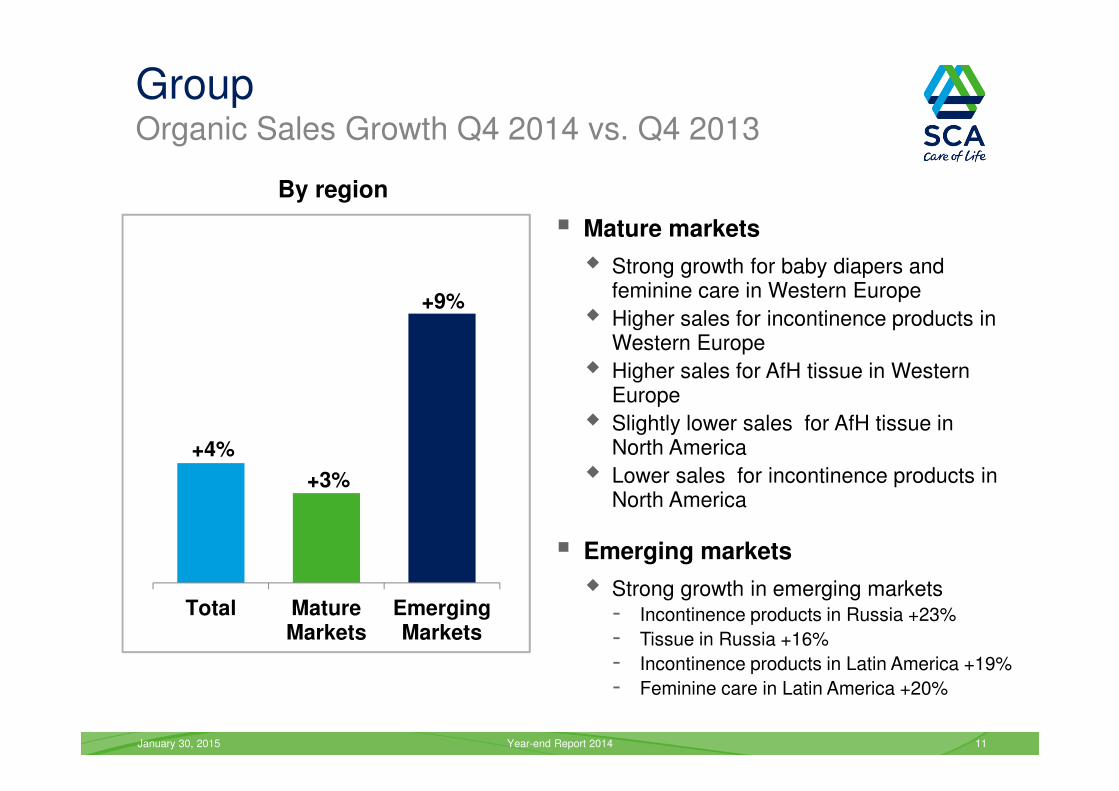
GroupOrganic Sales Growth Q4 2014 vs. Q4 2013
Total MatureMarkets
EmergingMarkets
January 30, 2015 Year-end Report 2014
By region
� Mature markets
� Strong growth for baby diapers and feminine care in Western Europe
� Higher sales for incontinence products in Western Europe
� Higher sales for AfH tissue in Western Europe
� Slightly lower sales for AfH tissue in North America
� Lower sales for incontinence products in North America
� Emerging markets
� Strong growth in emerging markets- Incontinence products in Russia +23%
- Tissue in Russia +16%
- Incontinence products in Latin America +19%
- Feminine care in Latin America +20%
11
+4%
+3%
+9%
January 30, 2015 Year-end Report 2014 12
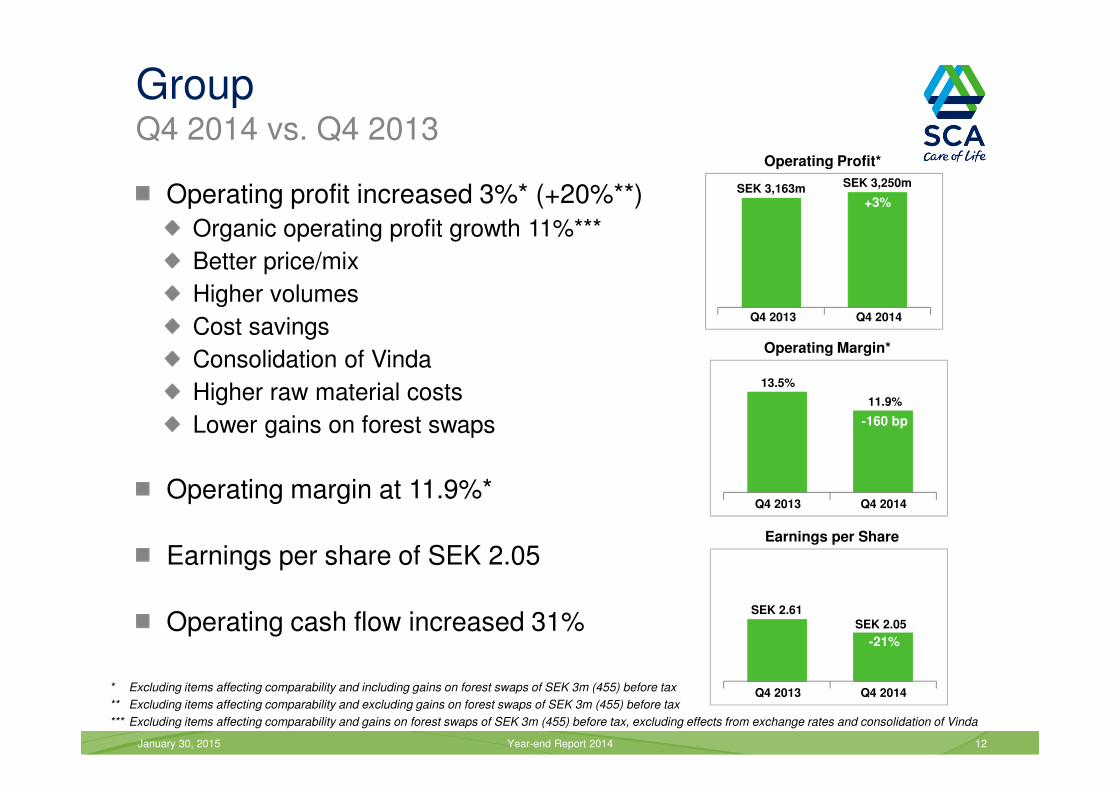
GroupQ4 2014 vs. Q4 2013
Operating profit increased 3%* (+20%**)
Organic operating profit growth 11%***
Better price/mix
Higher volumes
Cost savings
Consolidation of Vinda
Higher raw material costs
Lower gains on forest swaps
Operating margin at 11.9%*
Earnings per share of SEK 2.05
Operating cash flow increased 31%
Operating Profit*
Q4 2014
Operating Margin*
13.5%
11.9%
SEK 3,163m
* Excluding items affecting comparability and including gains on forest swaps of SEK 3m (455) before tax
** Excluding items affecting comparability and excluding gains on forest swaps of SEK 3m (455) before tax
*** Excluding items affecting comparability and gains on forest swaps of SEK 3m (455) before tax, excluding effects from exchange rates and consolidation of Vinda
Q4 2013
Q4 2014Q4 2013
SEK 3,250m
Earnings per Share
SEK 2.05
Q4 2014Q4 2013
SEK 2.61
+3%
-160 bp
-21%
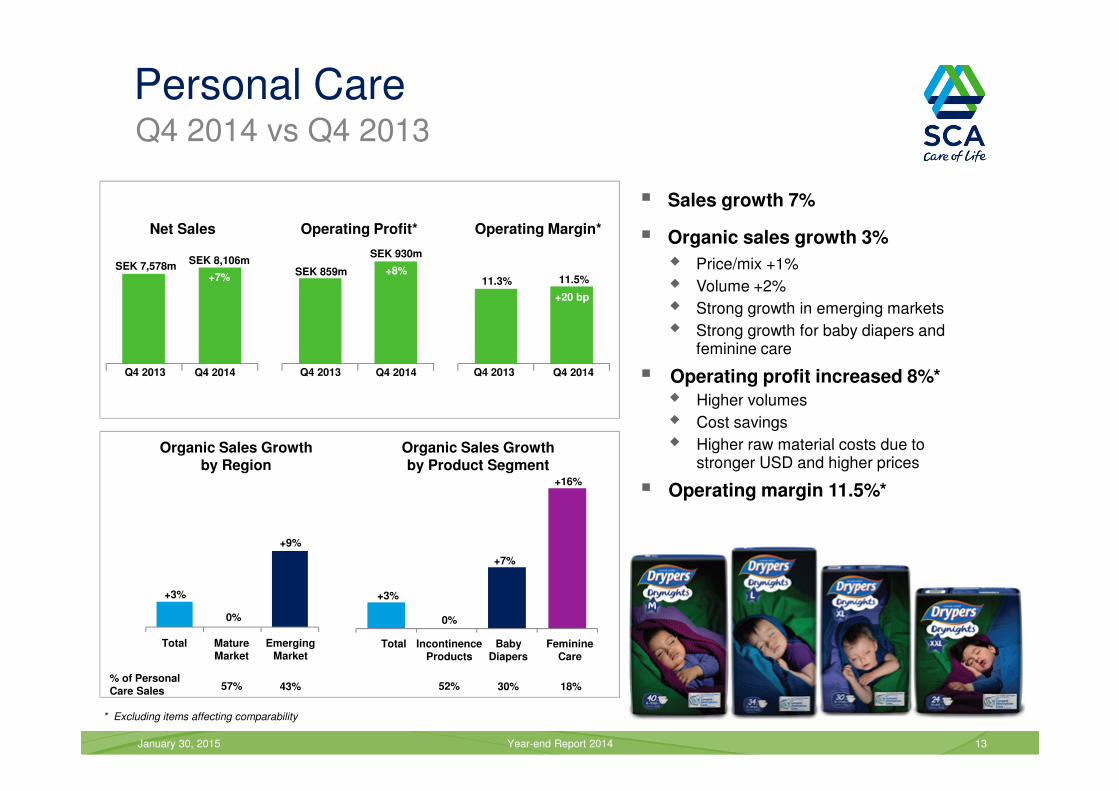
Personal CareQ4 2014 vs Q4 2013
January 30, 2015 Year-end Report 2014 13
* Excluding items affecting comparability
� Sales growth 7%
� Organic sales growth 3%
� Price/mix +1%
� Volume +2%
� Strong growth in emerging markets
� Strong growth for baby diapers and feminine care
� Operating profit increased 8%*
� Higher volumes
� Cost savings
� Higher raw material costs due to stronger USD and higher prices
� Operating margin 11.5%*
Net Sales Operating Profit*
Q4 2014Q4 2013 Q4 2014Q4 2013 Q4 2014Q4 2013
Operating Margin*
SEK 8,106mSEK 7,578m
SEK 930m
SEK 859m11.3% 11.5%
Organic Sales Growthby Region
Organic Sales Growthby Product Segment
IncontinenceProducts
BabyDiapers
FeminineCare
TotalMatureMarket
EmergingMarket
Total
0%
+3%
+7%
+16%
0%
+9%
+3%
52% 30% 18% % of Personal Care Sales 57% 43%
+7%+8%
+20 bp
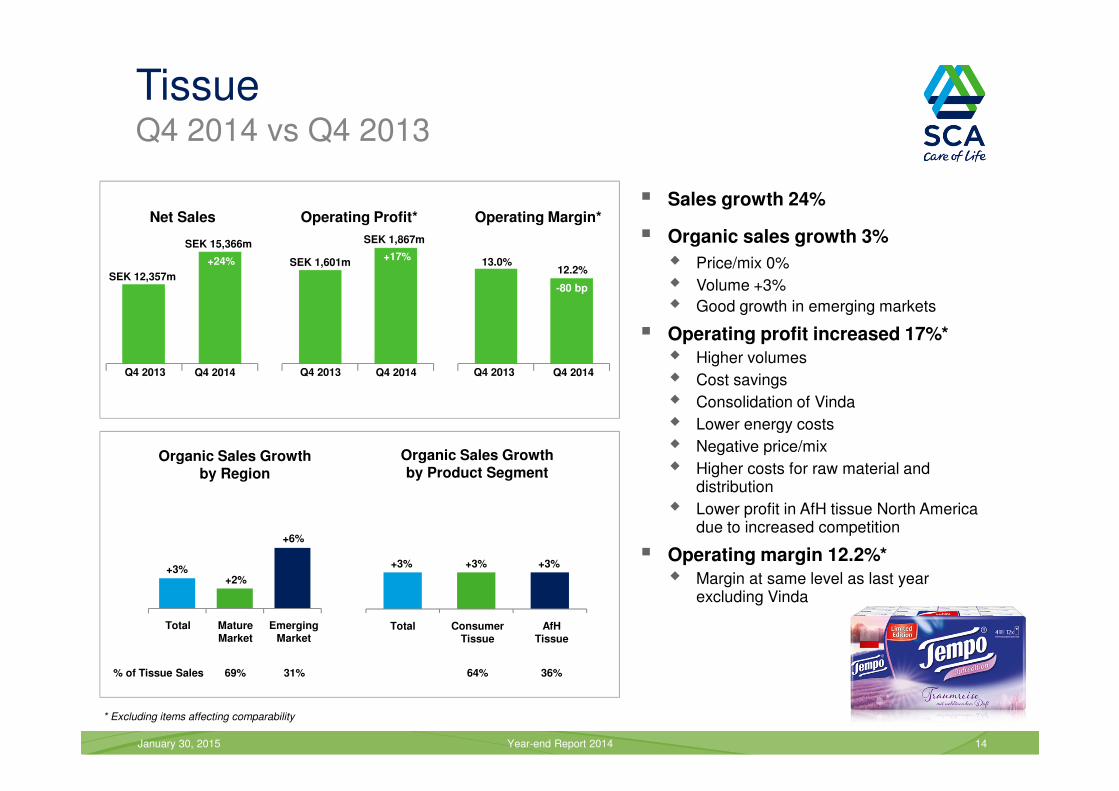
TissueQ4 2014 vs Q4 2013
January 30, 2015 Year-end Report 2014 14
* Excluding items affecting comparability
� Sales growth 24%
� Organic sales growth 3%
� Price/mix 0%
� Volume +3%
� Good growth in emerging markets
� Operating profit increased 17%*
� Higher volumes
� Cost savings
� Consolidation of Vinda
� Lower energy costs
� Negative price/mix
� Higher costs for raw material and distribution
� Lower profit in AfH tissue North America due to increased competition
� Operating margin 12.2%*
� Margin at same level as last year excluding Vinda
Net Sales Operating Profit*
Q4 2014Q4 2013 Q4 2014Q4 2013 Q4 2014Q4 2013
Operating Margin*
SEK 15,366m
SEK 12,357m
SEK 1,867m
SEK 1,601m 13.0%12.2%
Organic Sales Growthby Region
Organic Sales Growthby Product Segment
ConsumerTissue
AfHTissue
TotalMatureMarket
EmergingMarket
Total
+3%+2%
+6%
+3%
64% % of Tissue Sales 36% 69% 31%
+24% +17%
-80 bp
+3% +3%
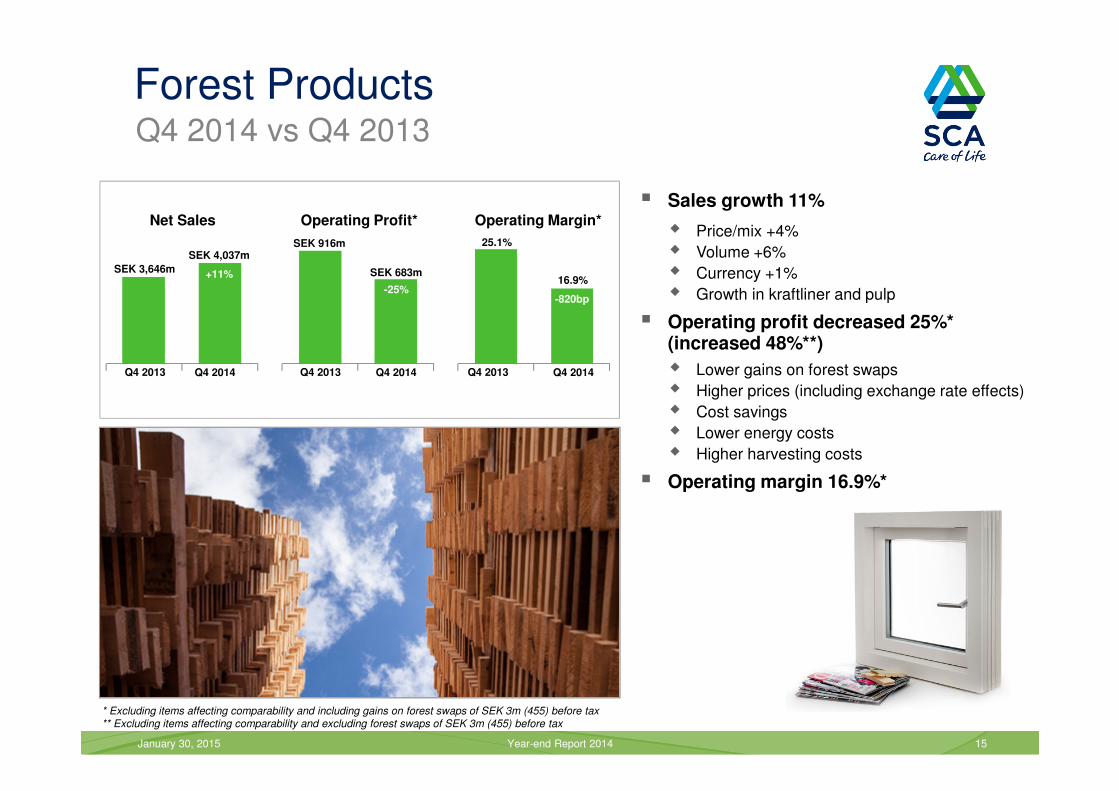
Forest ProductsQ4 2014 vs Q4 2013
January 30, 2015 Year-end Report 2014 15
* Excluding items affecting comparability and including gains on forest swaps of SEK 3m (455) before tax** Excluding items affecting comparability and excluding forest swaps of SEK 3m (455) before tax
Q4 2014
� Sales growth 11%
� Price/mix +4%
� Volume +6%
� Currency +1%
� Growth in kraftliner and pulp
� Operating profit decreased 25%*(increased 48%**)
� Lower gains on forest swaps
� Higher prices (including exchange rate effects)
� Cost savings
� Lower energy costs
� Higher harvesting costs
� Operating margin 16.9%*
Net Sales Operating Profit*
Q4 2014Q4 2013 Q4 2014Q4 2013 Q4 2013
Operating Margin*
SEK 3,646m
SEK 4,037mSEK 916m 25.1%
16.9%SEK 683m+11%
-25%-820bp
Dividend
January 30, 2015 Year-end Report 2014 16
The Board of Directors proposes
an increase in the dividend by 10.5% to
SEK 5.25 per share (4.75)
January 30, 2015 Year-end Report 2014 17
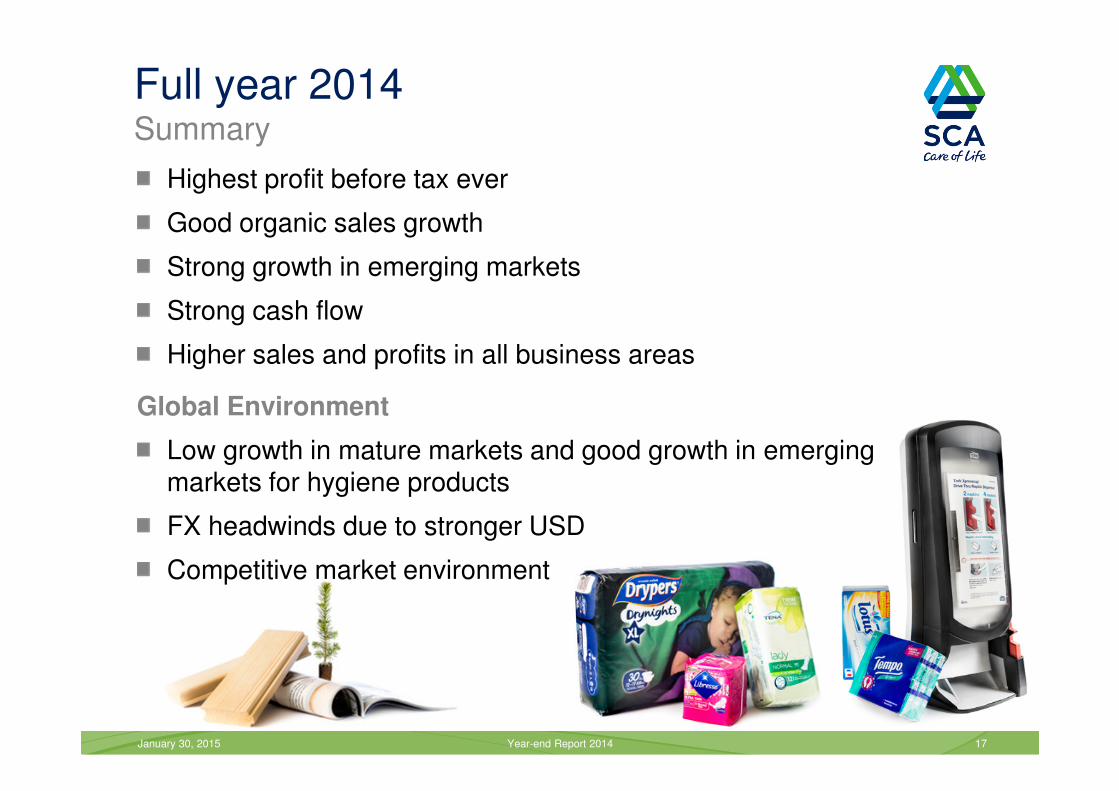
Full year 2014Summary
Highest profit before tax ever
Good organic sales growth
Strong growth in emerging markets
Strong cash flow
Higher sales and profits in all business areas
Global Environment
Low growth in mature markets and good growth in emerging markets for hygiene products
FX headwinds due to stronger USD
Competitive market environment
January 30, 2015 Year-end Report 2014 18
Q&A