Embed Size (px)
Citation preview
EECONOMIC CONOMIC AANALYSIS, NALYSIS,
SSTATISTICS, TATISTICS, PPROBABILITY AND ROBABILITY AND RRISK ISK
Hisham Haridy, PMP, PMI-RMP, PMI-SPCCP_Section VI
1. Financial & Cash Flow Analysis
2. Practical Corporate Investment Decision-Making Guide
3. Statistics & Probability
4. Optimization
5. Risk Management Fundamentals
CContentontent
5. Risk Management Fundamentals
6. Risk Management Practical Guide
7. Total Cost Management Overview
8. The International System of Units (SI)
ECONOMIC ANALYSIS, STATISTICS, PROBABILITY AND RISK
FINANCIAL AND CASH FLOW ANALYSIS FINANCIAL AND CASH FLOW ANALYSIS
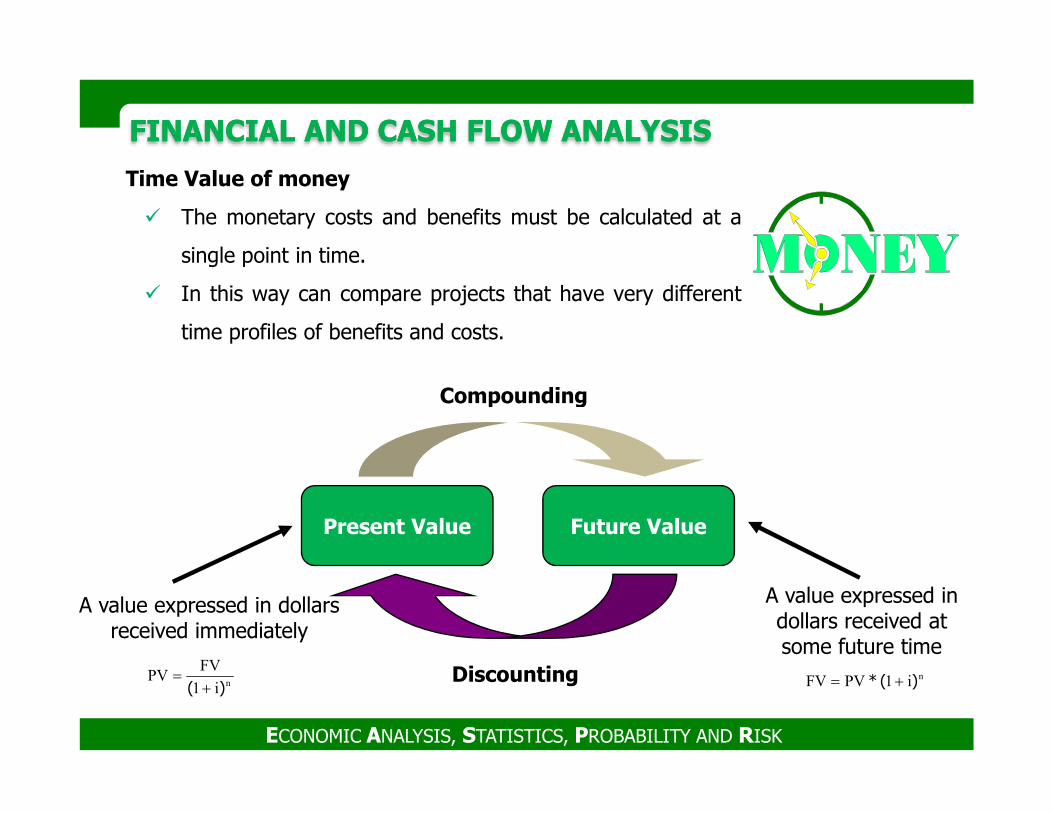
Time Value of money
� The monetary costs and benefits must be calculated at a
single point in time.
� In this way can compare projects that have very different
time profiles of benefits and costs.
Compounding
ECONOMIC ANALYSIS, STATISTICS, PROBABILITY AND RISK
Future ValuePresent Value
Compounding
Discounting
A value expressed in dollars received immediately
A value expressed in dollars received at some future time
ni1PVFV )(* +=ni1
FVPV
)( +=
FINANCIAL AND CASH FLOW ANALYSIS FINANCIAL AND CASH FLOW ANALYSIS
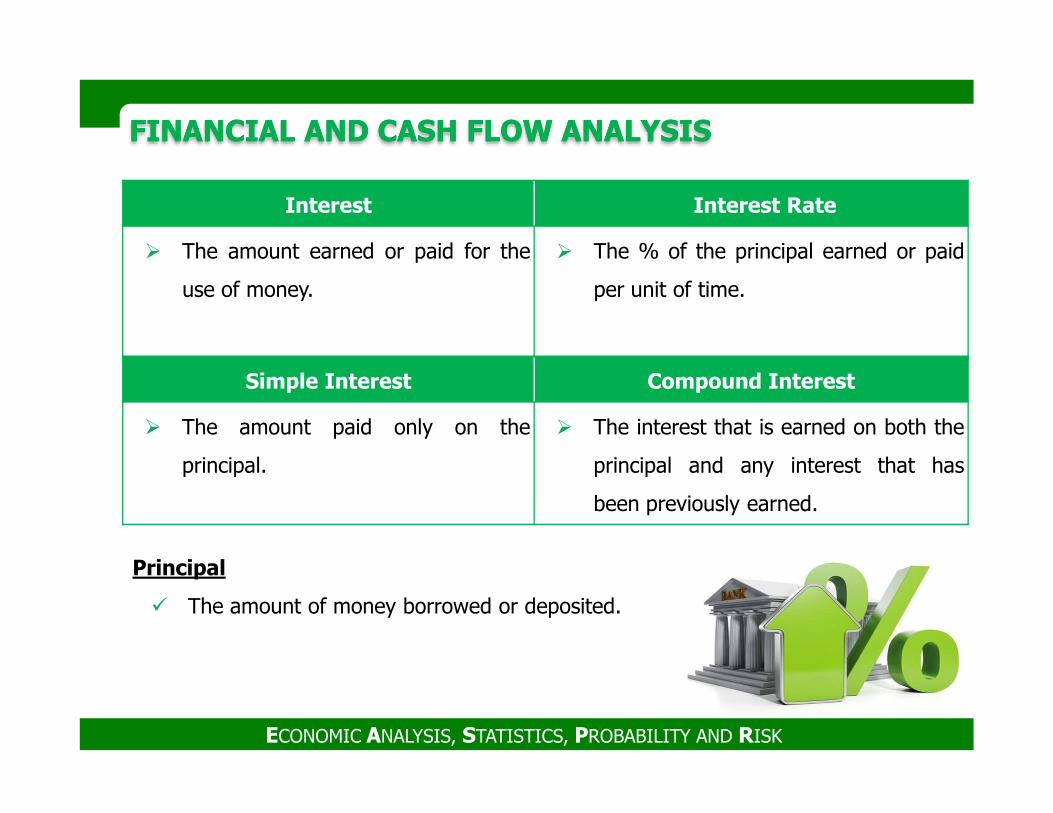
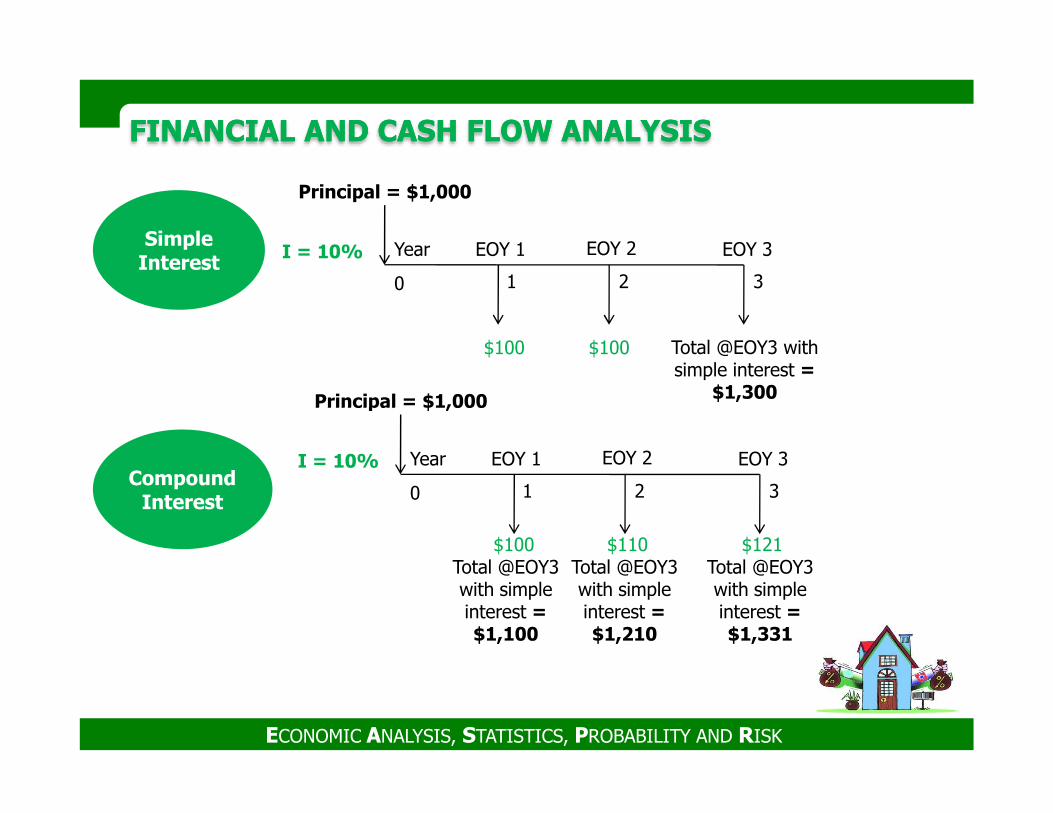
Simple Interest Compound Interest
Interest � Interest Rate
� The amount earned or paid for the
use of money.
� The % of the principal earned or paid
per unit of time.
ECONOMIC ANALYSIS, STATISTICS, PROBABILITY AND RISK
� The amount paid only on the
principal.
� The interest that is earned on both the
principal and any interest that has
been previously earned.
Principal
� The amount of money borrowed or deposited.
FINANCIAL AND CASH FLOW ANALYSIS FINANCIAL AND CASH FLOW ANALYSIS
$100 $100
I = 10%
0 1 2
EOY 1 EOY 2
Principal = $1,000
3
Total @EOY3 with simple interest =
$1,300
Year EOY 3
Principal = $1,000
Simple Interest
ECONOMIC ANALYSIS, STATISTICS, PROBABILITY AND RISK
I = 10%
0 1 2
EOY 1 EOY 2
Principal = $1,000
3
Total @EOY3 with simple interest = $1,331
Year EOY 3
$100 $110Total @EOY3 with simple interest = $1,210
Total @EOY3 with simple interest = $1,100
$121
Compound Interest
FINANCIAL AND CASH FLOW ANALYSIS FINANCIAL AND CASH FLOW ANALYSIS
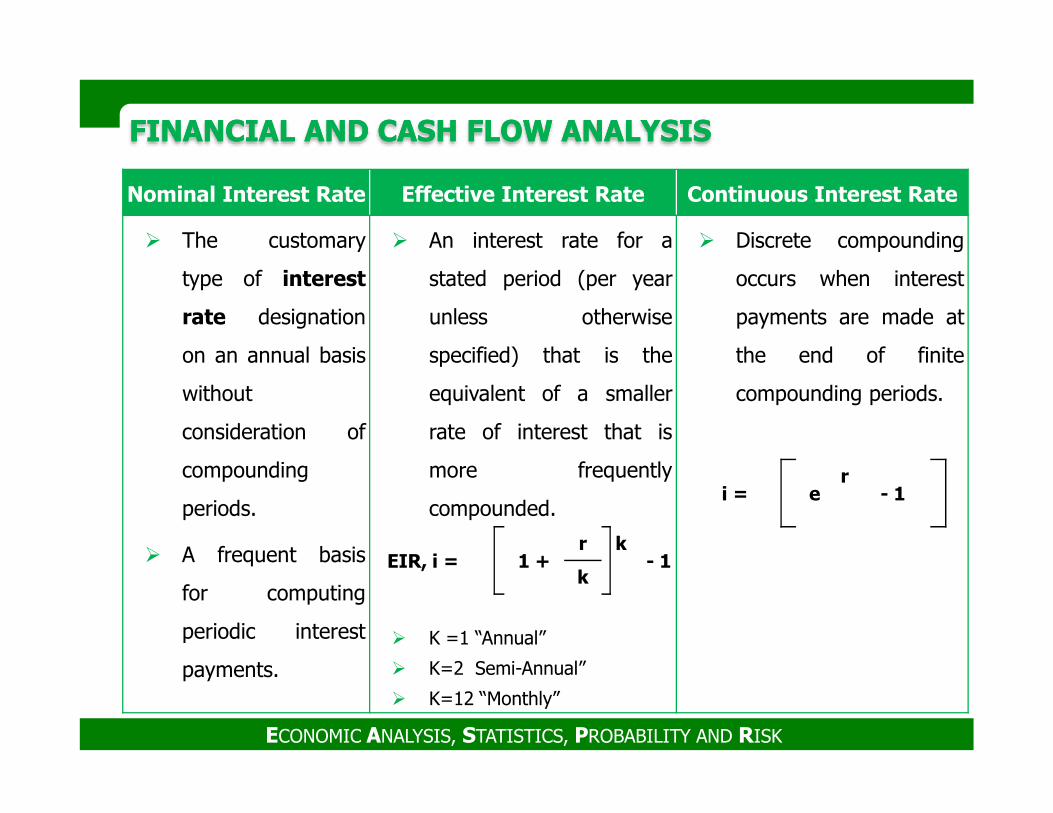
Nominal Interest Rate Effective Interest Rate Continuous Interest Rate
� The customary
type of interest
rate designation
on an annual basis
without
� An interest rate for a
stated period (per year
unless otherwise
specified) that is the
equivalent of a smaller
� Discrete compounding
occurs when interest
payments are made at
the end of finite
compounding periods.
ECONOMIC ANALYSIS, STATISTICS, PROBABILITY AND RISK
consideration of
compounding
periods.
� A frequent basis
for computing
periodic interest
payments.
rate of interest that is
more frequently
compounded.
� K =1 “Annual”
� K=2 Semi-Annual”
� K=12 “Monthly”
EIR, i = 1 +r k
- 1k
i = er
- 1
FINANCIAL AND CASH FLOW ANALYSIS FINANCIAL AND CASH FLOW ANALYSIS
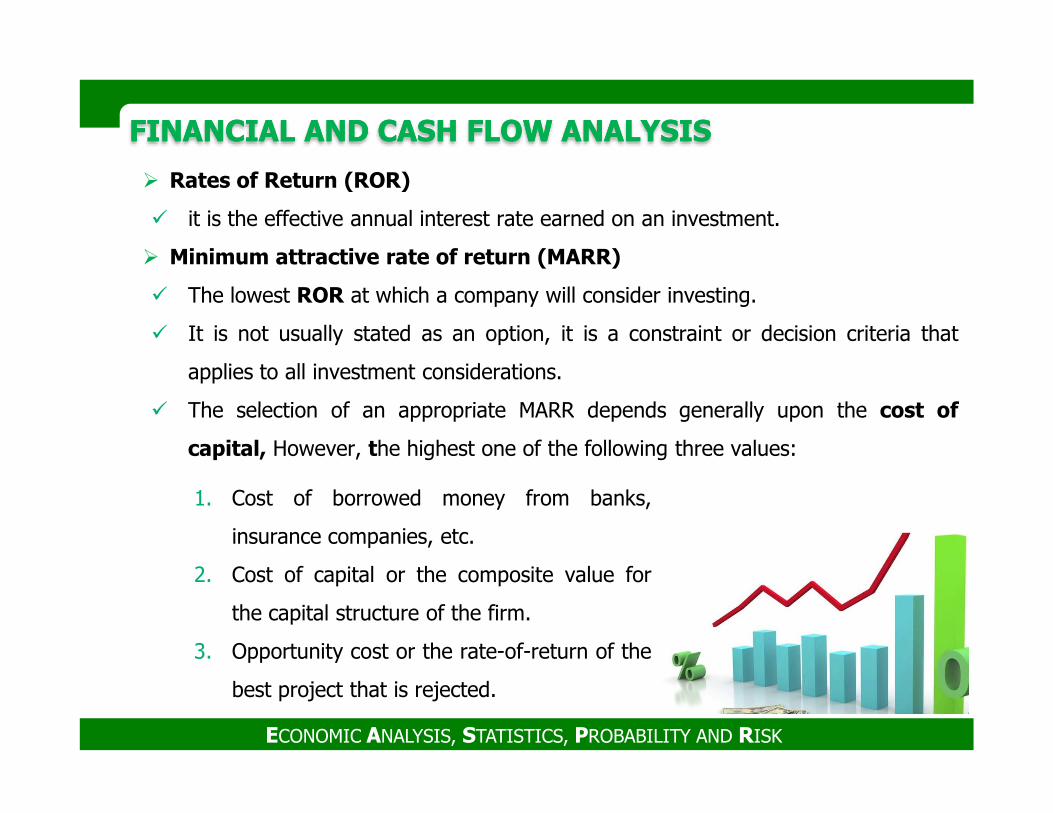
� Rates of Return (ROR)
� it is the effective annual interest rate earned on an investment.
� Minimum attractive rate of return (MARR)
� The lowest ROR at which a company will consider investing.
� It is not usually stated as an option, it is a constraint or decision criteria that
applies to all investment considerations.
� The selection of an appropriate MARR depends generally upon the cost of
ECONOMIC ANALYSIS, STATISTICS, PROBABILITY AND RISK
� The selection of an appropriate MARR depends generally upon the cost of
capital, However, the highest one of the following three values:
1. Cost of borrowed money from banks,
insurance companies, etc.
2. Cost of capital or the composite value for
the capital structure of the firm.
3. Opportunity cost or the rate-of-return of the
best project that is rejected.
FINANCIAL AND CASH FLOW ANALYSIS FINANCIAL AND CASH FLOW ANALYSIS
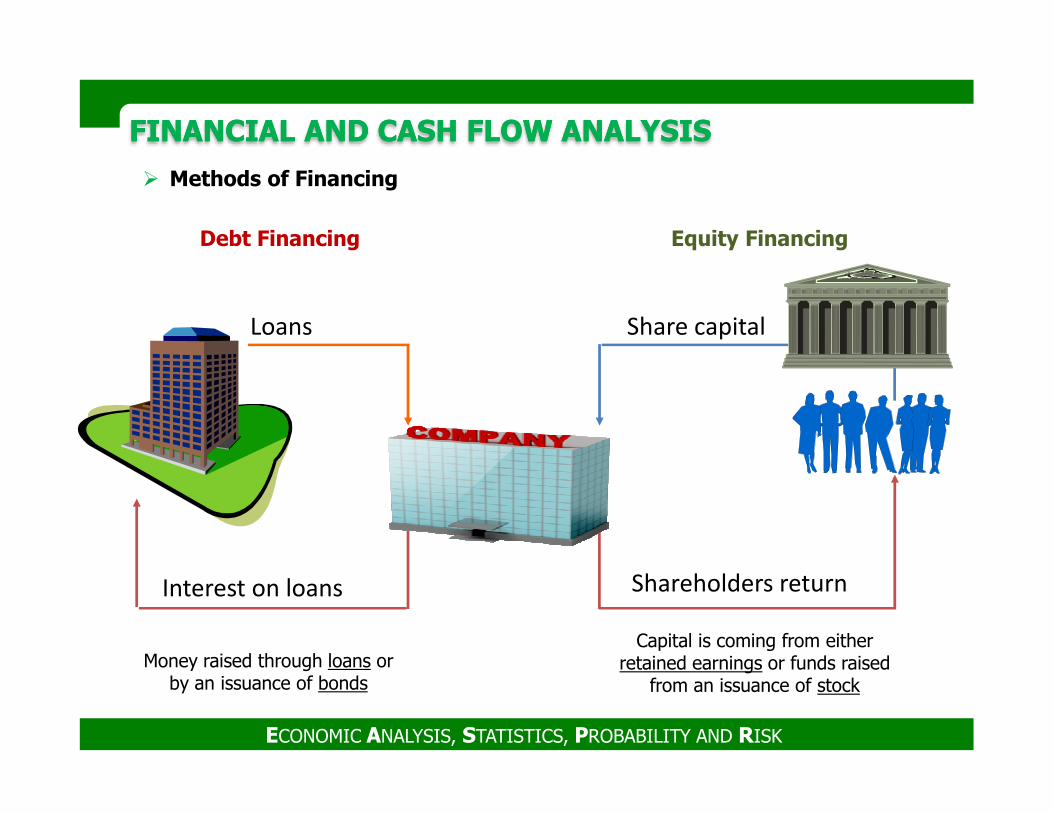
BANK
Loans Share capital
� Methods of Financing
Debt Financing Equity Financing
ECONOMIC ANALYSIS, STATISTICS, PROBABILITY AND RISK
Interest on loans Shareholders return
Money raised through loans or by an issuance of bonds
Capital is coming from either retained earnings or funds raised
from an issuance of stock
FINANCIAL AND CASH FLOW ANALYSIS FINANCIAL AND CASH FLOW ANALYSIS
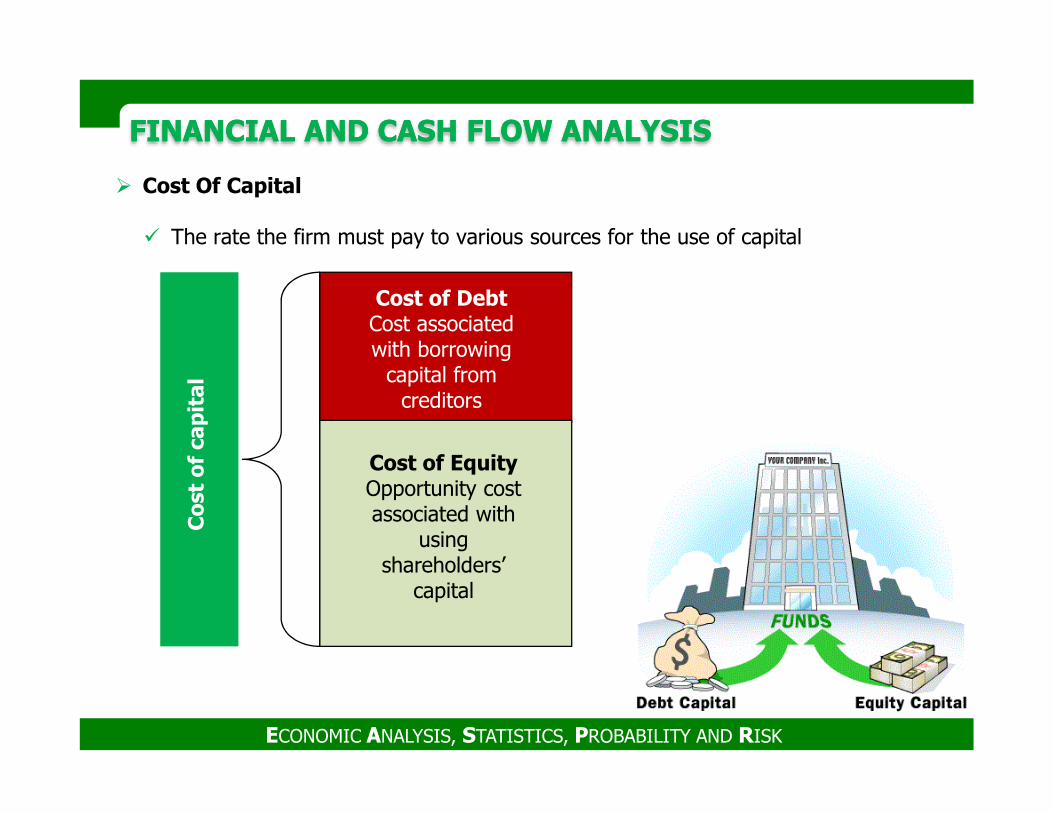
� Cost Of Capital
� The rate the firm must pay to various sources for the use of capital
Cost of DebtCost associated with borrowing
capital from creditors
Co
st o
f ca
pit
al
ECONOMIC ANALYSIS, STATISTICS, PROBABILITY AND RISK
Cost of EquityOpportunity cost associated with
using shareholders’
capital
creditors
Co
st o
f ca
pit
al
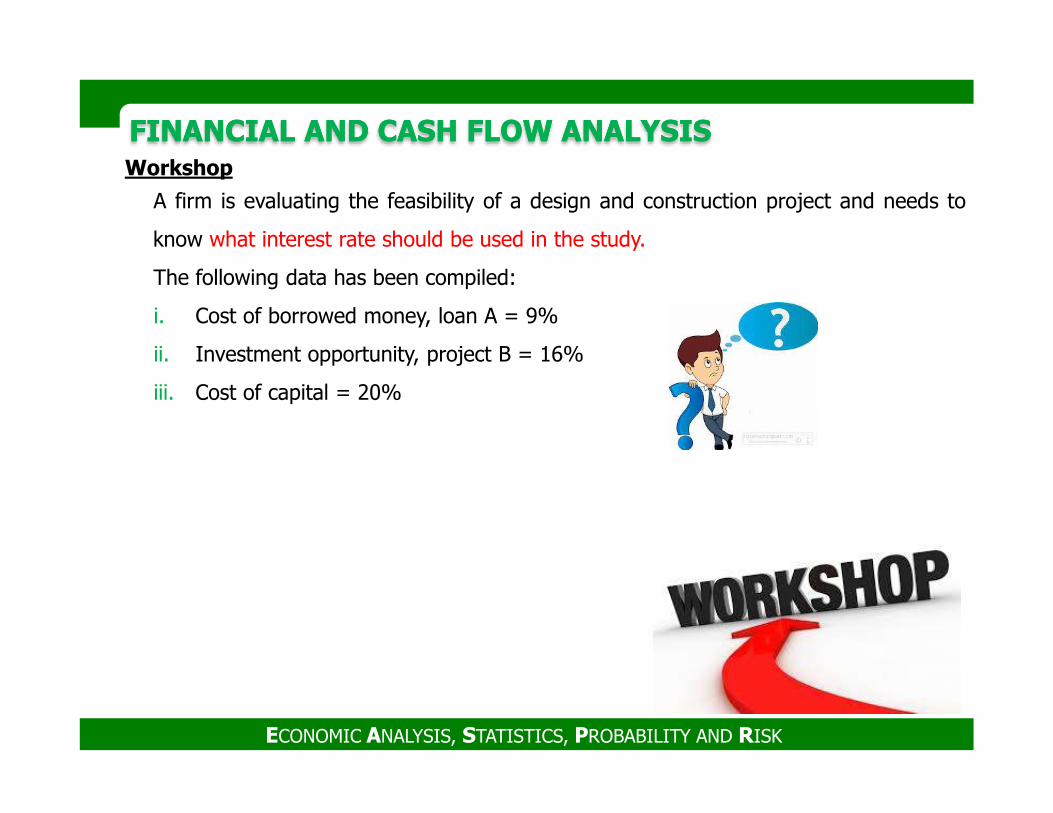
FINANCIAL AND CASH FLOW ANALYSIS FINANCIAL AND CASH FLOW ANALYSIS Workshop
A firm is evaluating the feasibility of a design and construction project and needs to
know what interest rate should be used in the study.
The following data has been compiled:
i. Cost of borrowed money, loan A = 9%
ii. Investment opportunity, project B = 16%
iii. Cost of capital = 20%
ECONOMIC ANALYSIS, STATISTICS, PROBABILITY AND RISK
FINANCIAL AND CASH FLOW ANALYSIS FINANCIAL AND CASH FLOW ANALYSIS
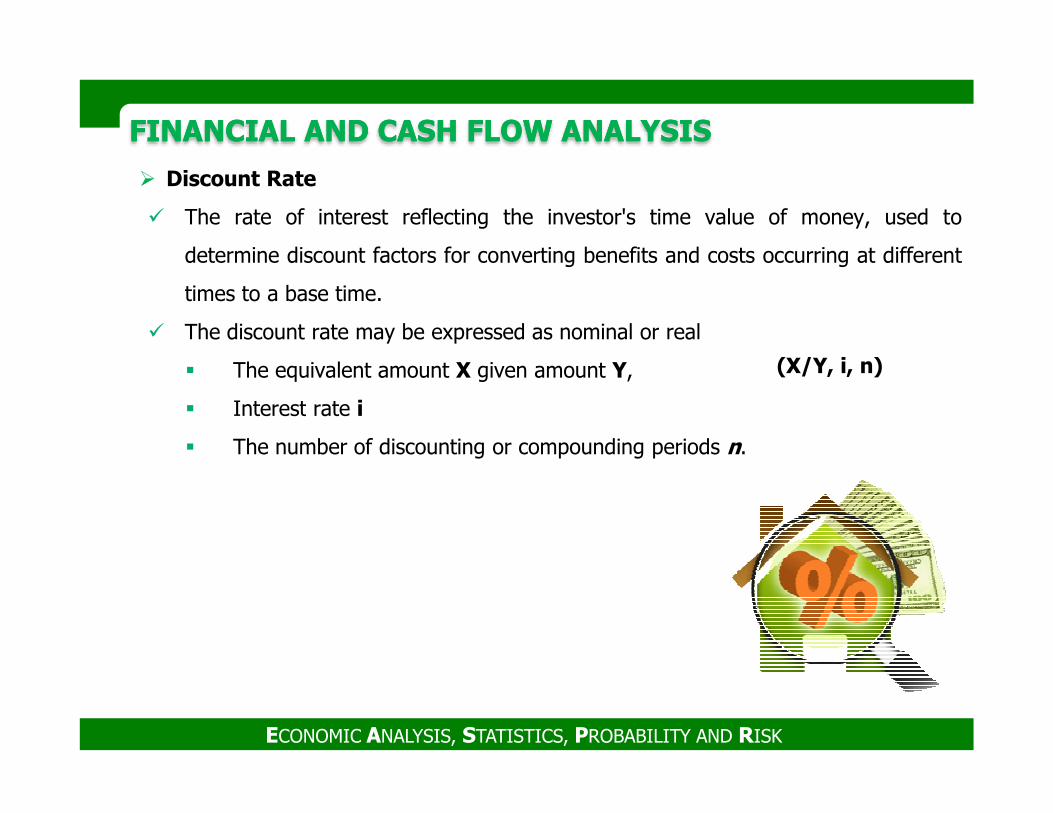
� Discount Rate
� The rate of interest reflecting the investor's time value of money, used to
determine discount factors for converting benefits and costs occurring at different
times to a base time.
� The discount rate may be expressed as nominal or real
� The equivalent amount X given amount Y,
� Interest rate i
(X/Y, i, n)
ECONOMIC ANALYSIS, STATISTICS, PROBABILITY AND RISK
� Interest rate i
� The number of discounting or compounding periods n.
FINANCIAL AND CASH FLOW ANALYSIS FINANCIAL AND CASH FLOW ANALYSIS
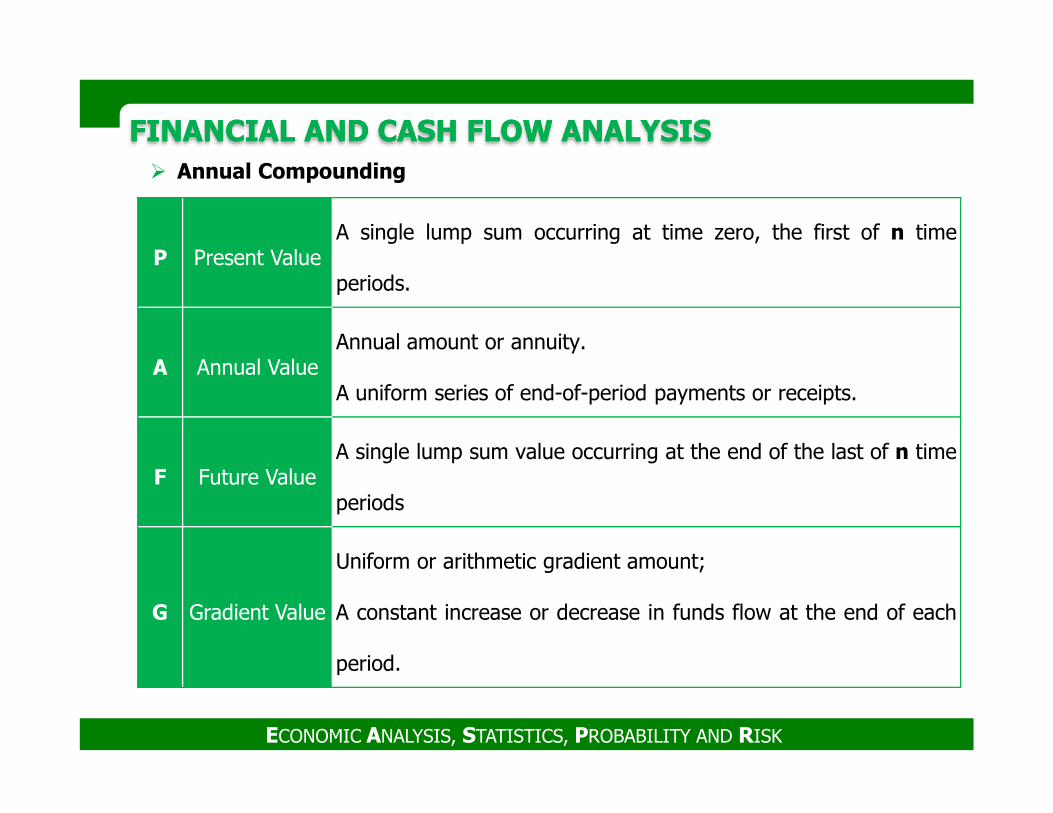
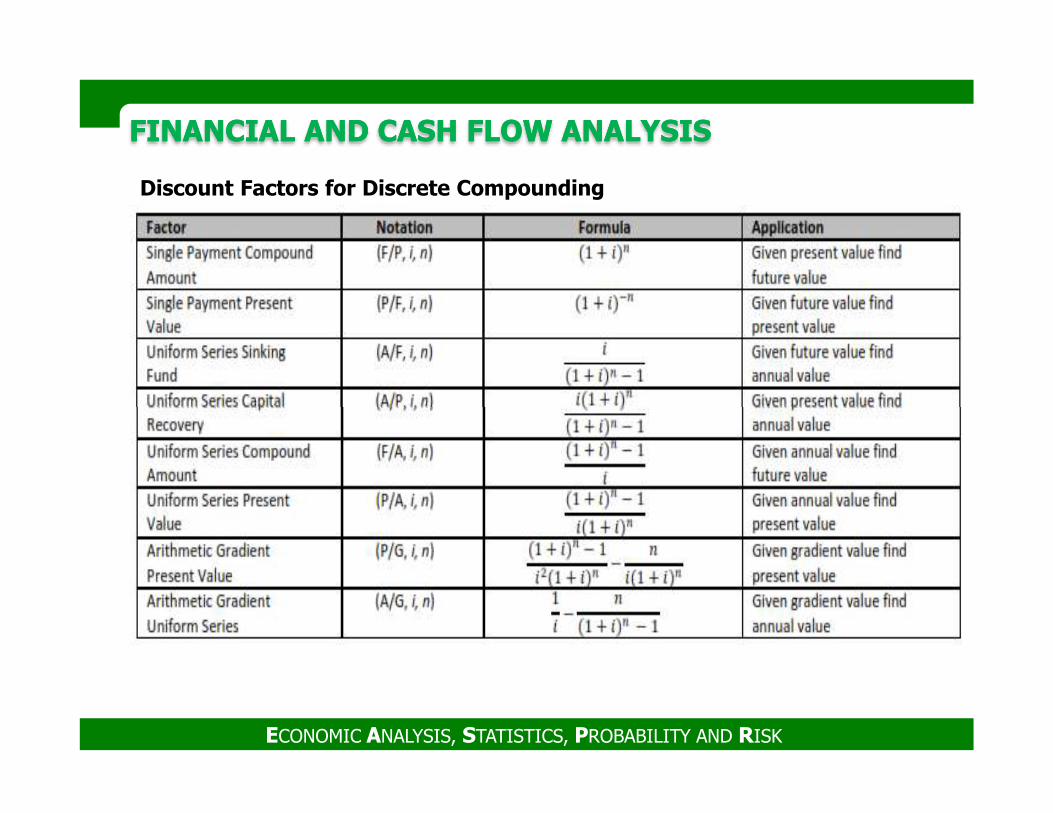
P Present Value A single lump sum occurring at time zero, the first of n time
periods.
A Annual Value Annual amount or annuity.
A uniform series of end-of-period payments or receipts.
� Annual Compounding
ECONOMIC ANALYSIS, STATISTICS, PROBABILITY AND RISK
F Future Value A single lump sum value occurring at the end of the last of n time
periods
G Gradient Value
Uniform or arithmetic gradient amount;
A constant increase or decrease in funds flow at the end of each
period.
FINANCIAL AND CASH FLOW ANALYSIS FINANCIAL AND CASH FLOW ANALYSIS
Discount Factors for Discrete Compounding
ECONOMIC ANALYSIS, STATISTICS, PROBABILITY AND RISK
FINANCIAL AND CASH FLOW ANALYSIS FINANCIAL AND CASH FLOW ANALYSIS
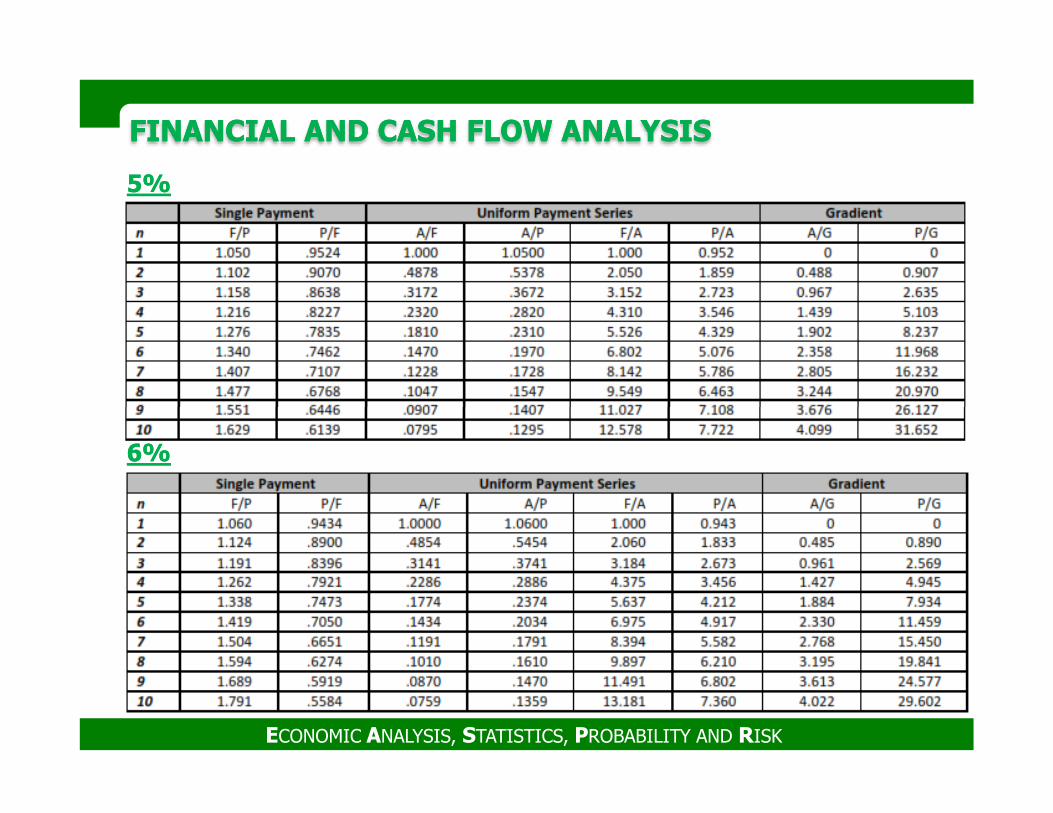
55%%
ECONOMIC ANALYSIS, STATISTICS, PROBABILITY AND RISK
66%%
FINANCIAL AND CASH FLOW ANALYSIS FINANCIAL AND CASH FLOW ANALYSIS
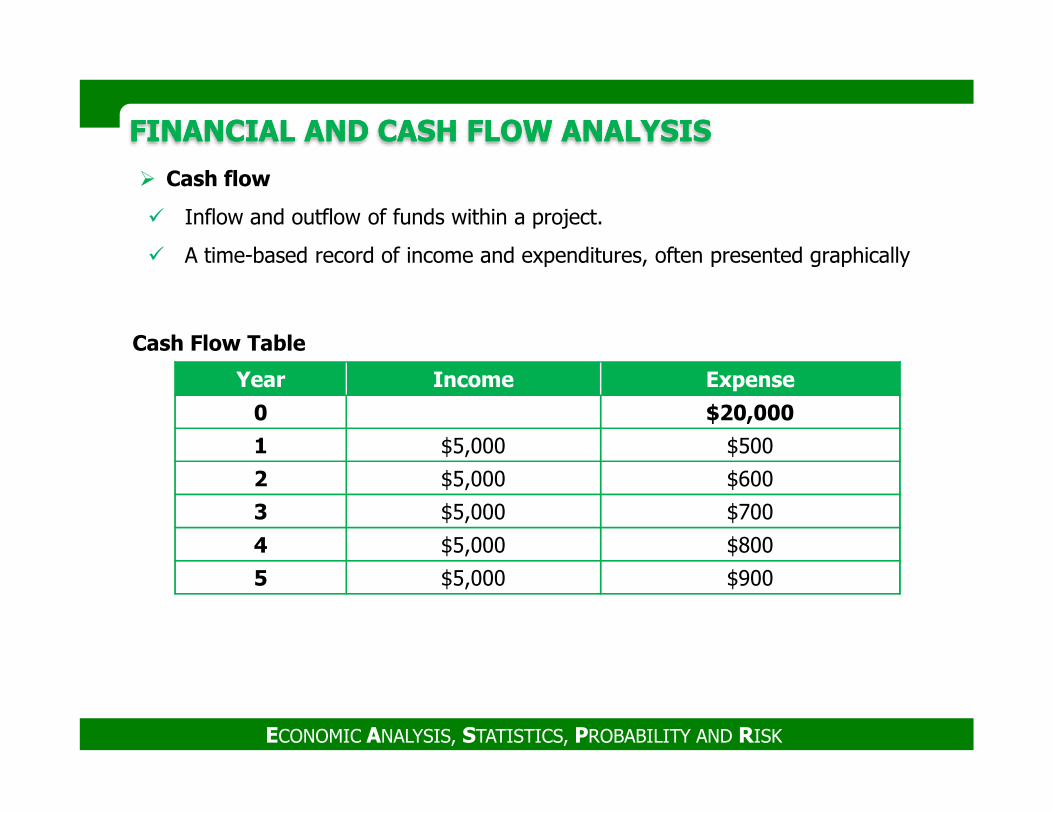
� Cash flow
� Inflow and outflow of funds within a project.
� A time-based record of income and expenditures, often presented graphically
Year Income Expense
0 $20,000
Cash Flow Table
ECONOMIC ANALYSIS, STATISTICS, PROBABILITY AND RISK
0 $20,000
1 $5,000 $500
2 $5,000 $600
3 $5,000 $700
4 $5,000 $800
5 $5,000 $900
FINANCIAL AND CASH FLOW ANALYSIS FINANCIAL AND CASH FLOW ANALYSIS
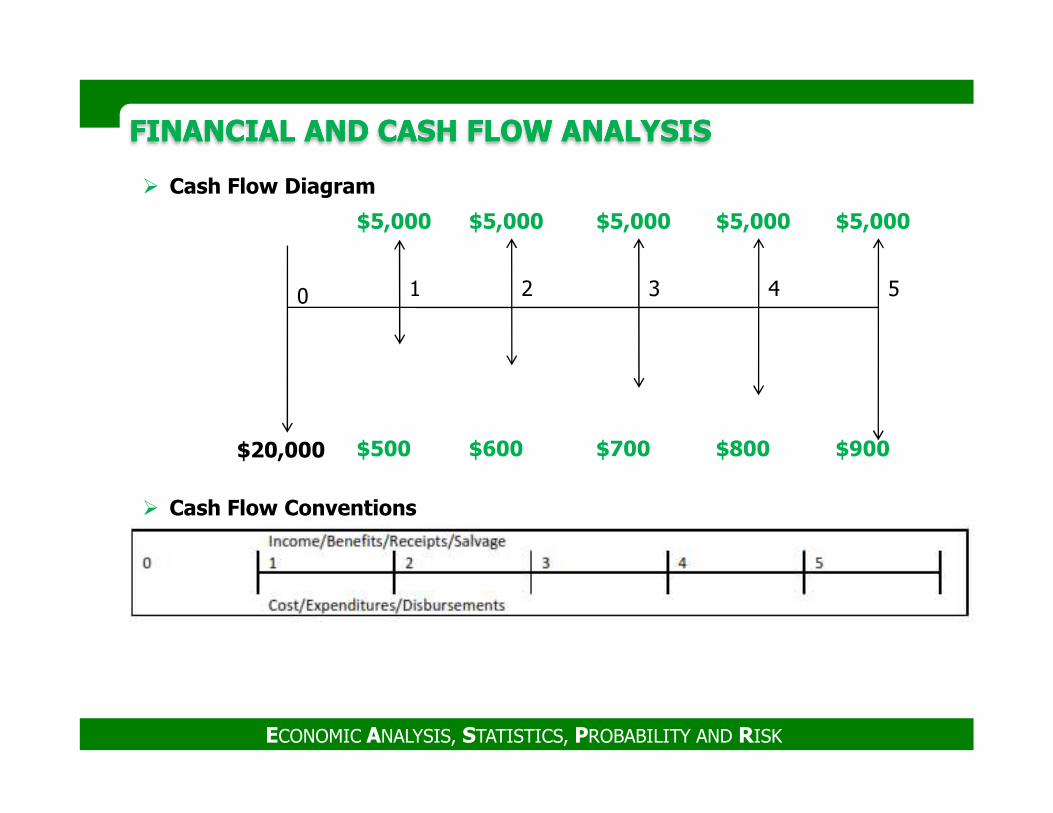
$5,000
0 1 2 3
$5,000 $5,000 $5,000 $5,000
4 5
� Cash Flow Diagram
ECONOMIC ANALYSIS, STATISTICS, PROBABILITY AND RISK
$500 $600 $700 $800 $900$20,000
� Cash Flow Conventions
FINANCIAL AND CASH FLOW ANALYSIS FINANCIAL AND CASH FLOW ANALYSIS
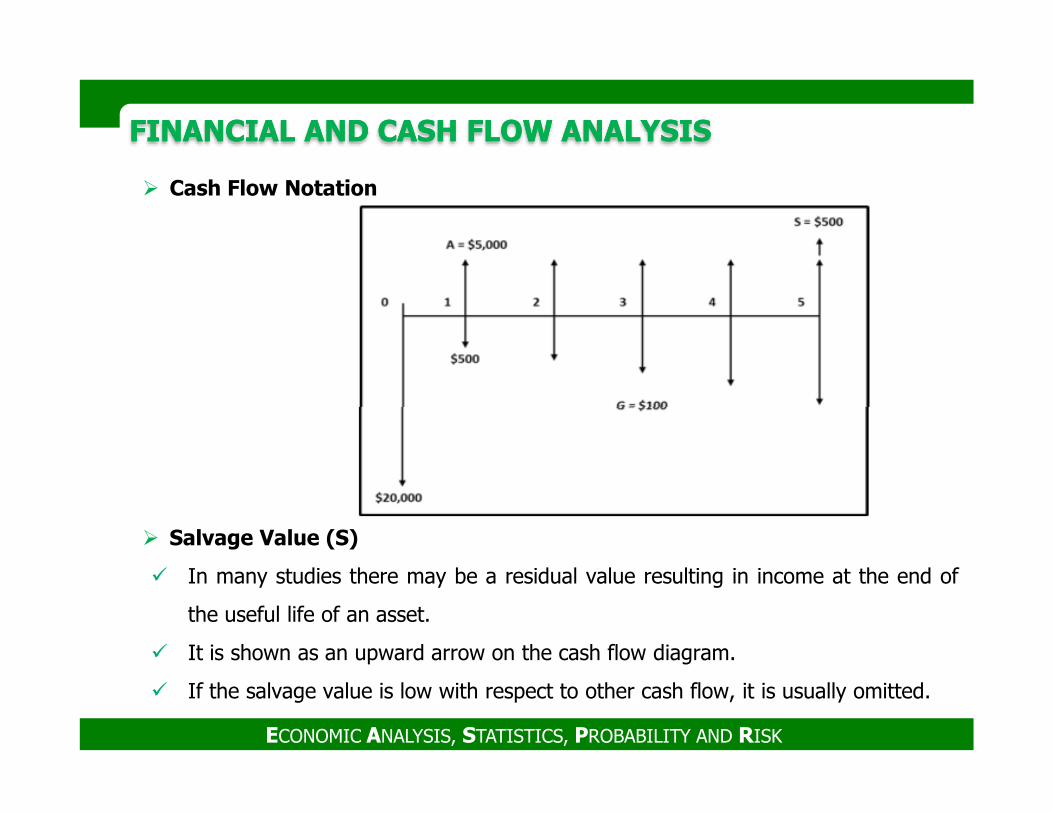
� Cash Flow Notation
ECONOMIC ANALYSIS, STATISTICS, PROBABILITY AND RISK
� Salvage Value (S)
� In many studies there may be a residual value resulting in income at the end of
the useful life of an asset.
� It is shown as an upward arrow on the cash flow diagram.
� If the salvage value is low with respect to other cash flow, it is usually omitted.
FINANCIAL AND CASH FLOW ANALYSIS FINANCIAL AND CASH FLOW ANALYSIS
CASH FLOW ANALYSIS METHODS
� There are two fundamental approaches to the analysis of a given cash flow,
1. Equivalent value
2. Rate-of-return
� Equivalent Net Value
� The equivalent net value method simply converts to one of the basic forms, (i.e.,
ECONOMIC ANALYSIS, STATISTICS, PROBABILITY AND RISK
� The equivalent net value method simply converts to one of the basic forms, (i.e.,
the equivalent present value, or annual value, using discount factors and the
required MARR).
� The "net" is the difference between all costs and all benefits (savings and other
gains).
� Thus, the Net Present Value (NPV) takes into account the time value of money
adjusting to expenditures and returns, as they occur over time, so they can be
evaluated equally.
FINANCIAL AND CASH FLOW ANALYSIS FINANCIAL AND CASH FLOW ANALYSIS
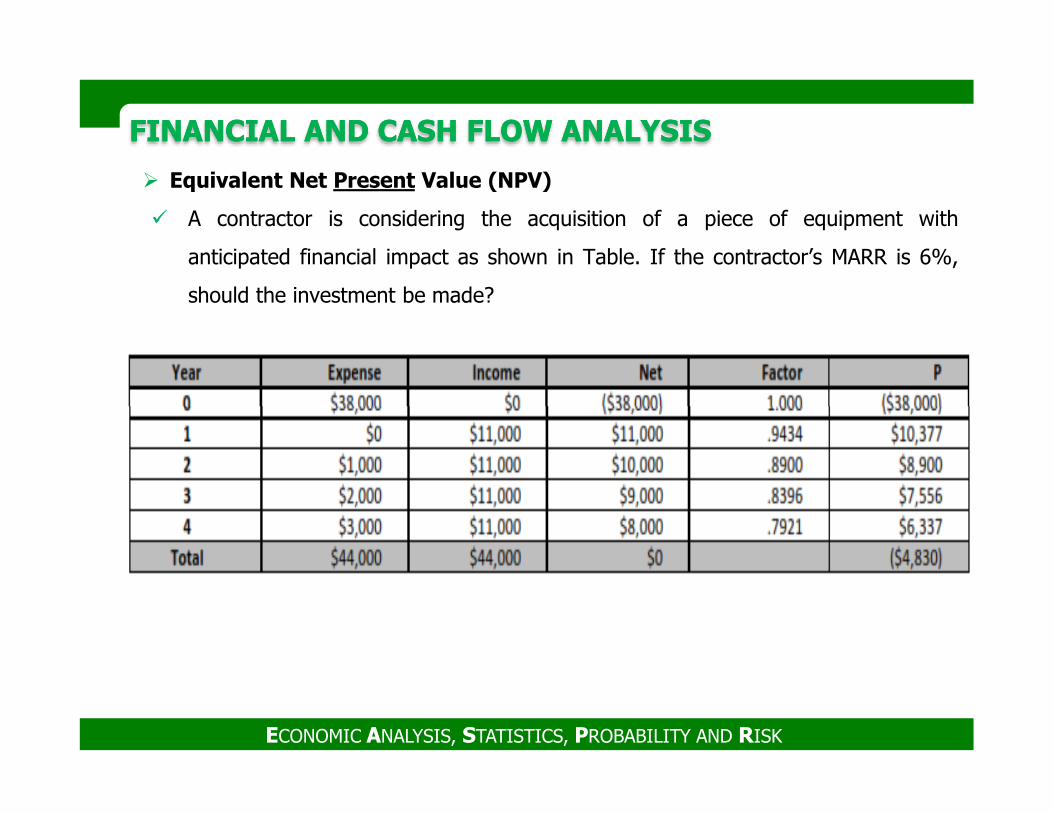
� Equivalent Net Present Value (NPV)
� A contractor is considering the acquisition of a piece of equipment with
anticipated financial impact as shown in Table. If the contractor’s MARR is 6%,
should the investment be made?
ECONOMIC ANALYSIS, STATISTICS, PROBABILITY AND RISK
FINANCIAL AND CASH FLOW ANALYSIS FINANCIAL AND CASH FLOW ANALYSIS
ECONOMIC ANALYSIS, STATISTICS, PROBABILITY AND RISK
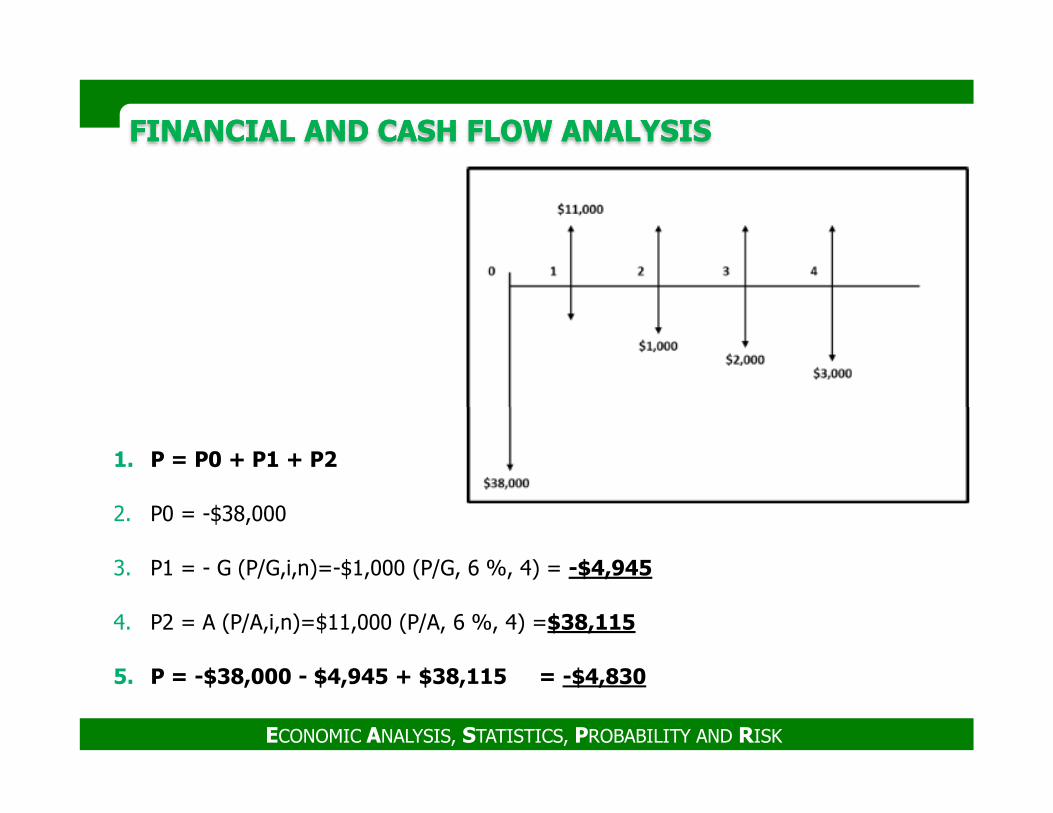
1. P = P0 + P1 + P2
2. P0 = -$38,000
3. P1 = - G (P/G,i,n)=-$1,000 (P/G, 6 %, 4) = -$4,945
4. P2 = A (P/A,i,n)=$11,000 (P/A, 6 %, 4) =$38,115
5. P = -$38,000 - $4,945 + $38,115 = -$4,830
FINANCIAL AND CASH FLOW ANALYSIS FINANCIAL AND CASH FLOW ANALYSIS
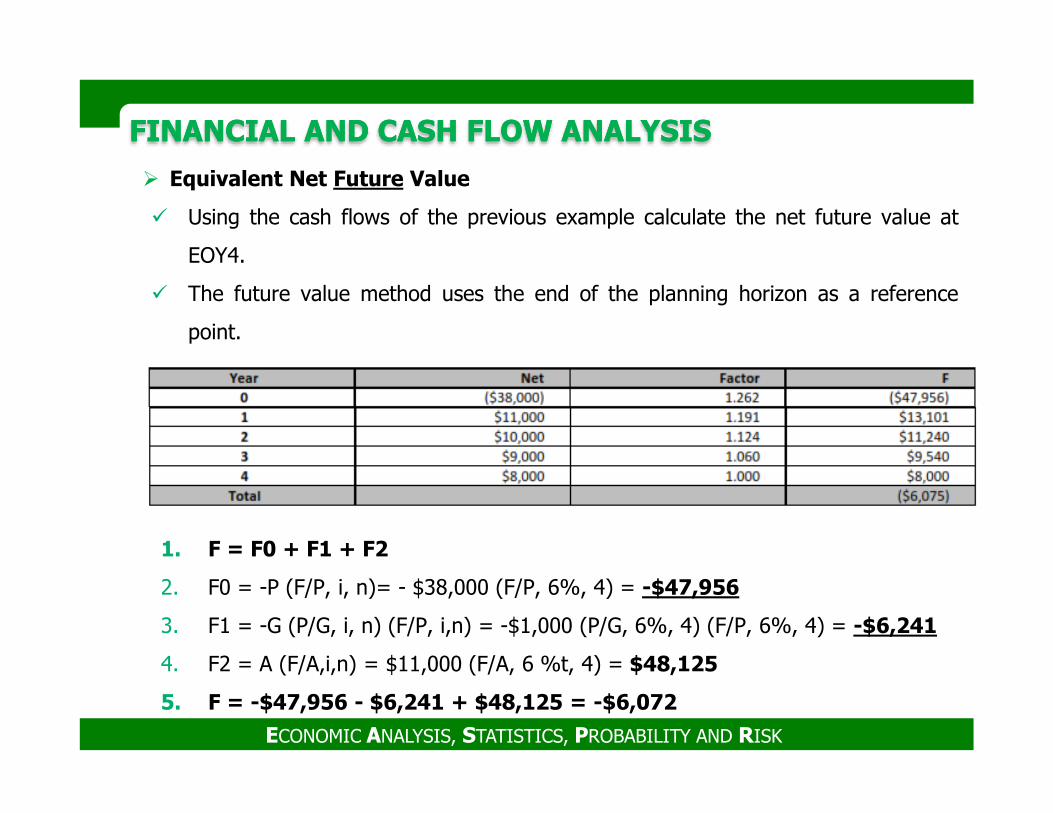
� Equivalent Net Future Value
� Using the cash flows of the previous example calculate the net future value at
EOY4.
� The future value method uses the end of the planning horizon as a reference
point.
ECONOMIC ANALYSIS, STATISTICS, PROBABILITY AND RISK
1. F = F0 + F1 + F2
2. F0 = -P (F/P, i, n)= - $38,000 (F/P, 6%, 4) = -$47,956
3. F1 = -G (P/G, i, n) (F/P, i,n) = -$1,000 (P/G, 6%, 4) (F/P, 6%, 4) = -$6,241
4. F2 = A (F/A,i,n) = $11,000 (F/A, 6 %t, 4) = $48,125
5. F = -$47,956 - $6,241 + $48,125 = -$6,072
FINANCIAL AND CASH FLOW ANALYSIS FINANCIAL AND CASH FLOW ANALYSIS
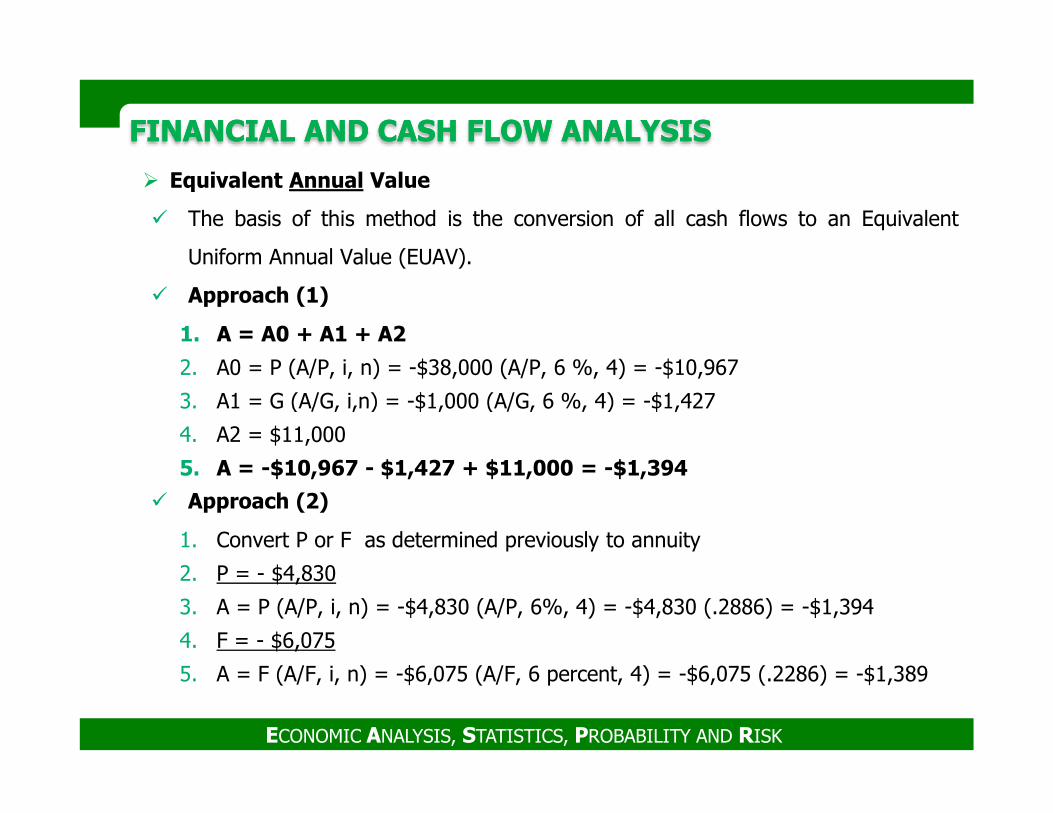
� Equivalent Annual Value
� The basis of this method is the conversion of all cash flows to an Equivalent
Uniform Annual Value (EUAV).
� Approach (1)
1. A = A0 + A1 + A2
2. A0 = P (A/P, i, n) = -$38,000 (A/P, 6 %, 4) = -$10,967
3. A1 = G (A/G, i,n) = -$1,000 (A/G, 6 %, 4) = -$1,427
ECONOMIC ANALYSIS, STATISTICS, PROBABILITY AND RISK
3. A1 = G (A/G, i,n) = -$1,000 (A/G, 6 %, 4) = -$1,427
4. A2 = $11,000
5. A = -$10,967 - $1,427 + $11,000 = -$1,394
� Approach (2)
1. Convert P or F as determined previously to annuity
2. P = - $4,830
3. A = P (A/P, i, n) = -$4,830 (A/P, 6%, 4) = -$4,830 (.2886) = -$1,394
4. F = - $6,075
5. A = F (A/F, i, n) = -$6,075 (A/F, 6 percent, 4) = -$6,075 (.2286) = -$1,389
FINANCIAL AND CASH FLOW ANALYSIS FINANCIAL AND CASH FLOW ANALYSIS
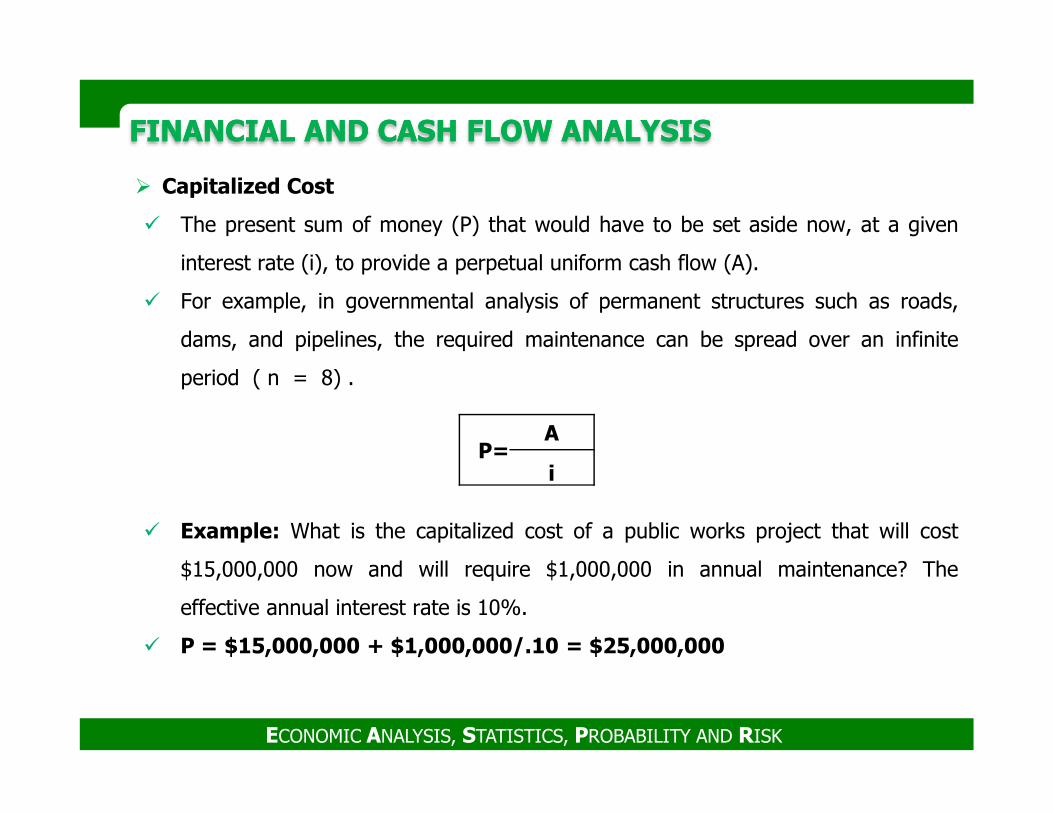
� Capitalized Cost
� The present sum of money (P) that would have to be set aside now, at a given
interest rate (i), to provide a perpetual uniform cash flow (A).
� For example, in governmental analysis of permanent structures such as roads,
dams, and pipelines, the required maintenance can be spread over an infinite
period ( n = 8) .
ECONOMIC ANALYSIS, STATISTICS, PROBABILITY AND RISK
� Example: What is the capitalized cost of a public works project that will cost
$15,000,000 now and will require $1,000,000 in annual maintenance? The
effective annual interest rate is 10%.
� P = $15,000,000 + $1,000,000/.10 = $25,000,000
P=A
i
FINANCIAL AND CASH FLOW ANALYSIS FINANCIAL AND CASH FLOW ANALYSIS
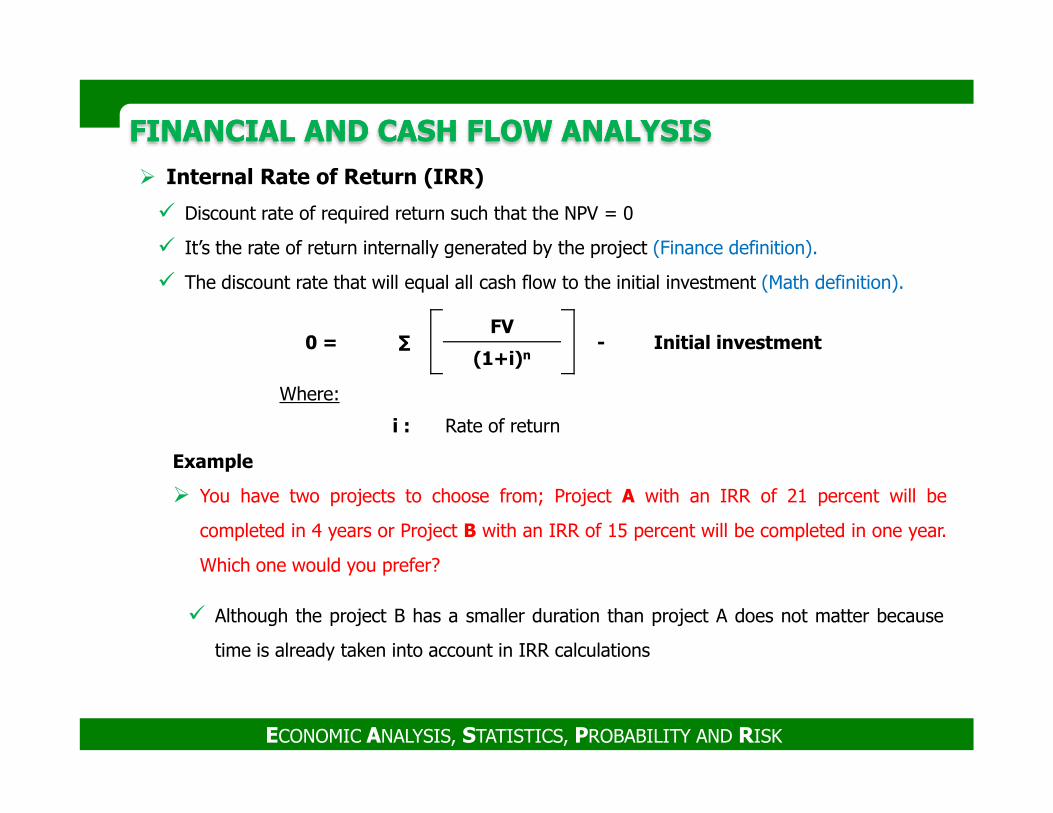
� Internal Rate of Return (IRR)
� Discount rate of required return such that the NPV = 0
� It’s the rate of return internally generated by the project (Finance definition).
� The discount rate that will equal all cash flow to the initial investment (Math definition).
0 = ∑FV
- Initial investment(1+i)n
Where:
ECONOMIC ANALYSIS, STATISTICS, PROBABILITY AND RISK
� Although the project B has a smaller duration than project A does not matter because
time is already taken into account in IRR calculations
Example
� You have two projects to choose from; Project A with an IRR of 21 percent will be
completed in 4 years or Project B with an IRR of 15 percent will be completed in one year.
Which one would you prefer?
i : Rate of return
FINANCIAL AND CASH FLOW ANALYSIS FINANCIAL AND CASH FLOW ANALYSIS
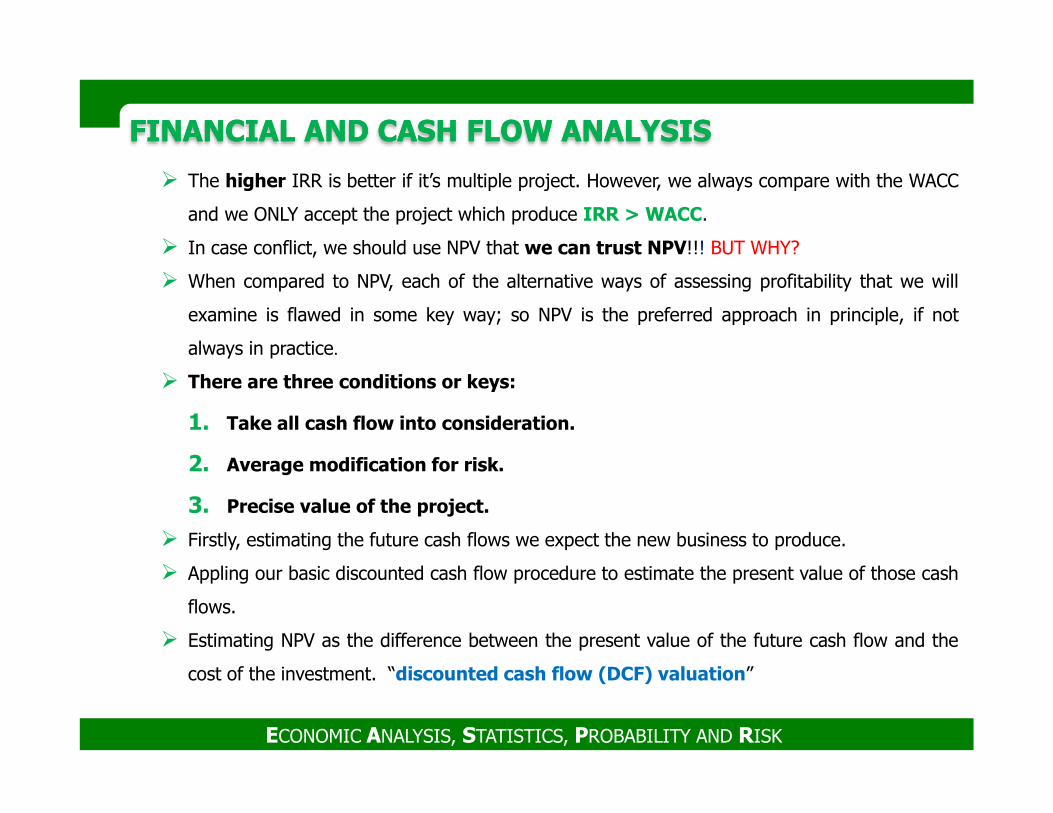
� The higher IRR is better if it’s multiple project. However, we always compare with the WACC
and we ONLY accept the project which produce IRR > WACC.
� In case conflict, we should use NPV that we can trust NPV!!! BUT WHY?
� When compared to NPV, each of the alternative ways of assessing profitability that we will
examine is flawed in some key way; so NPV is the preferred approach in principle, if not
always in practice.
� There are three conditions or keys:
ECONOMIC ANALYSIS, STATISTICS, PROBABILITY AND RISK
1. Take all cash flow into consideration.
2. Average modification for risk.
3. Precise value of the project.
� Firstly, estimating the future cash flows we expect the new business to produce.
� Appling our basic discounted cash flow procedure to estimate the present value of those cash
flows.
� Estimating NPV as the difference between the present value of the future cash flow and the
cost of the investment. “discounted cash flow (DCF) valuation”
FINANCIAL AND CASH FLOW ANALYSIS FINANCIAL AND CASH FLOW ANALYSIS
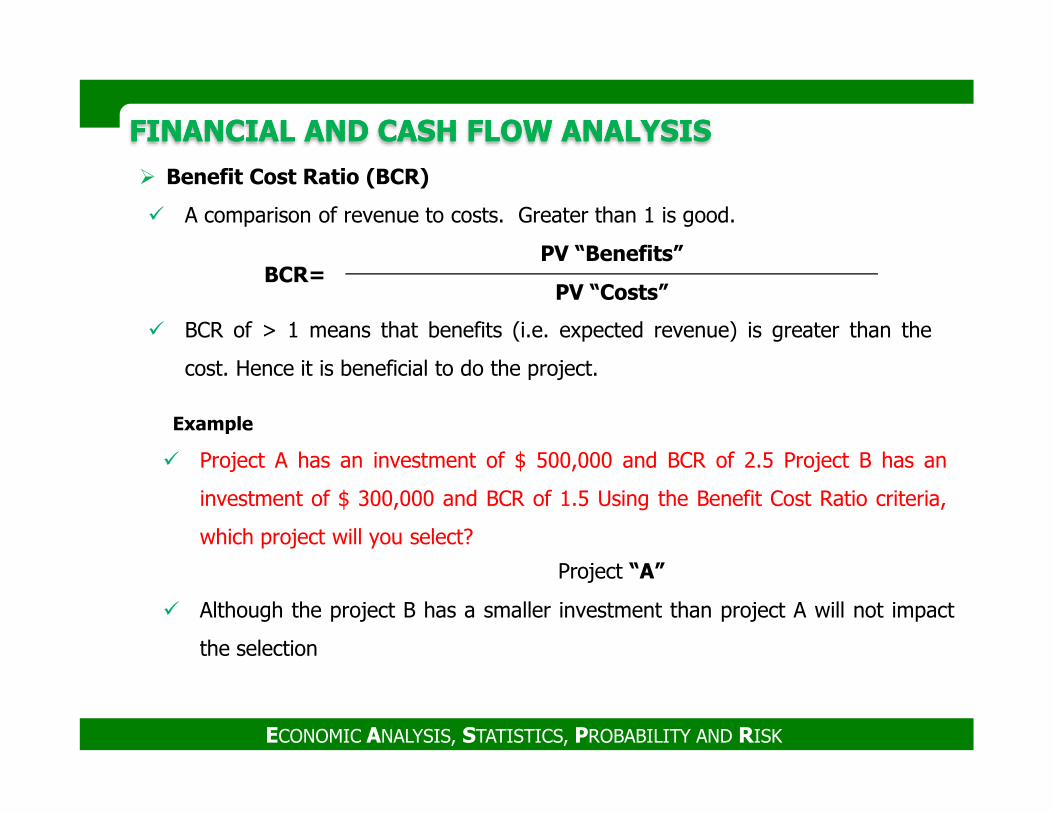
� Benefit Cost Ratio (BCR)
� A comparison of revenue to costs. Greater than 1 is good.
� BCR of > 1 means that benefits (i.e. expected revenue) is greater than the
cost. Hence it is beneficial to do the project.
BCR=PV “Benefits”
PV “Costs”
ECONOMIC ANALYSIS, STATISTICS, PROBABILITY AND RISK
Project “A”
Example
� Project A has an investment of $ 500,000 and BCR of 2.5 Project B has an
investment of $ 300,000 and BCR of 1.5 Using the Benefit Cost Ratio criteria,
which project will you select?
� Although the project B has a smaller investment than project A will not impact
the selection
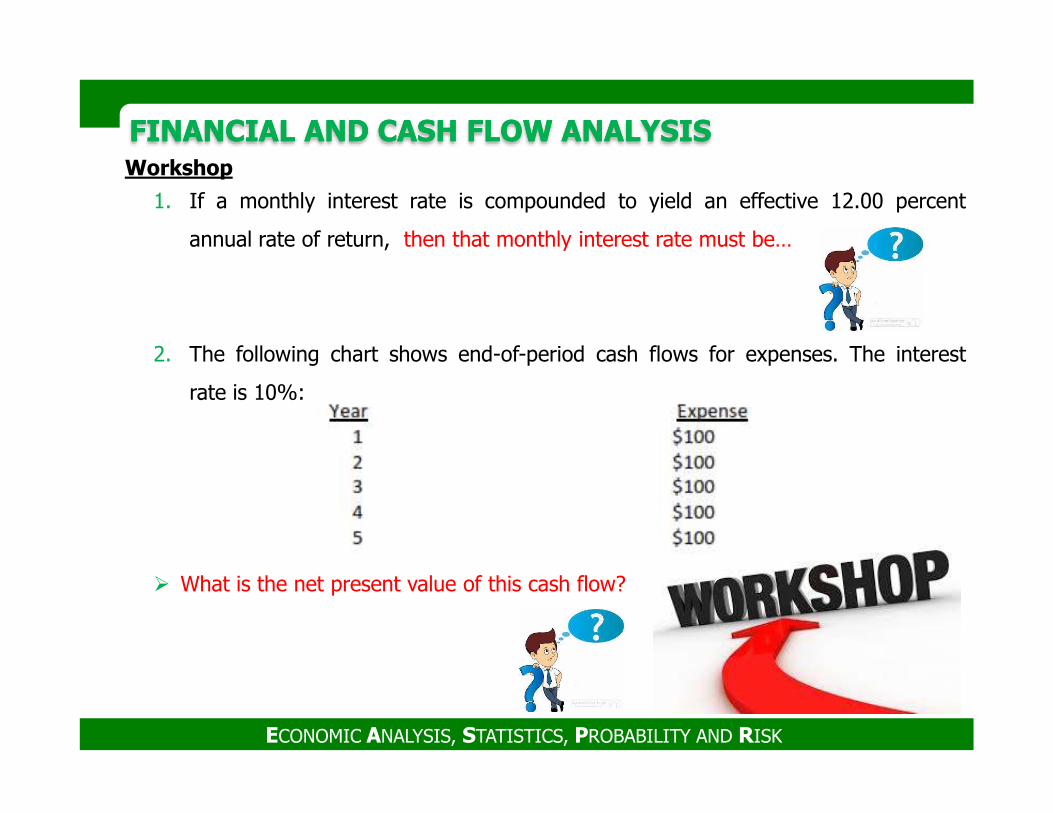
FINANCIAL AND CASH FLOW ANALYSIS FINANCIAL AND CASH FLOW ANALYSIS Workshop
1. If a monthly interest rate is compounded to yield an effective 12.00 percent
annual rate of return, then that monthly interest rate must be…
2. The following chart shows end-of-period cash flows for expenses. The interest
rate is 10%:
ECONOMIC ANALYSIS, STATISTICS, PROBABILITY AND RISK
� What is the net present value of this cash flow?
FINANCIAL AND CASH FLOW ANALYSIS FINANCIAL AND CASH FLOW ANALYSIS Workshop
3. To finance part of an owner’s new manufacturing facility, the board of directors
decides to issue 2,000 bonds with a face value of $1,000, all of which are due in
15 years. The bond coupons shall pay 8% per annum, and the coupons are
payable semiannually. If buyers expect a compounded 10% rate-of-return on their
investment, what should they pay for the bonds?
ECONOMIC ANALYSIS, STATISTICS, PROBABILITY AND RISK
FINANCIAL AND CASH FLOW ANALYSIS FINANCIAL AND CASH FLOW ANALYSIS Workshop
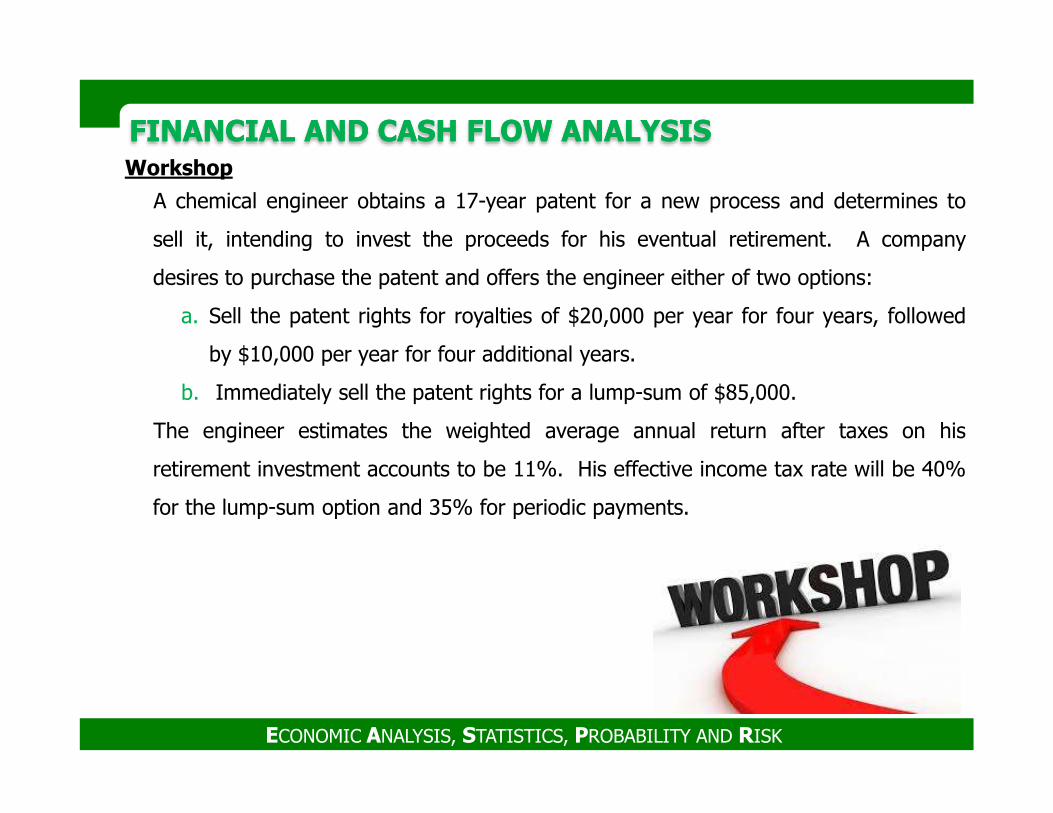
A chemical engineer obtains a 17-year patent for a new process and determines to
sell it, intending to invest the proceeds for his eventual retirement. A company
desires to purchase the patent and offers the engineer either of two options:
a. Sell the patent rights for royalties of $20,000 per year for four years, followed
by $10,000 per year for four additional years.
b. Immediately sell the patent rights for a lump-sum of $85,000.
ECONOMIC ANALYSIS, STATISTICS, PROBABILITY AND RISK
The engineer estimates the weighted average annual return after taxes on his
retirement investment accounts to be 11%. His effective income tax rate will be 40%
for the lump-sum option and 35% for periodic payments.
FINANCIAL AND CASH FLOW ANALYSIS FINANCIAL AND CASH FLOW ANALYSIS Workshop
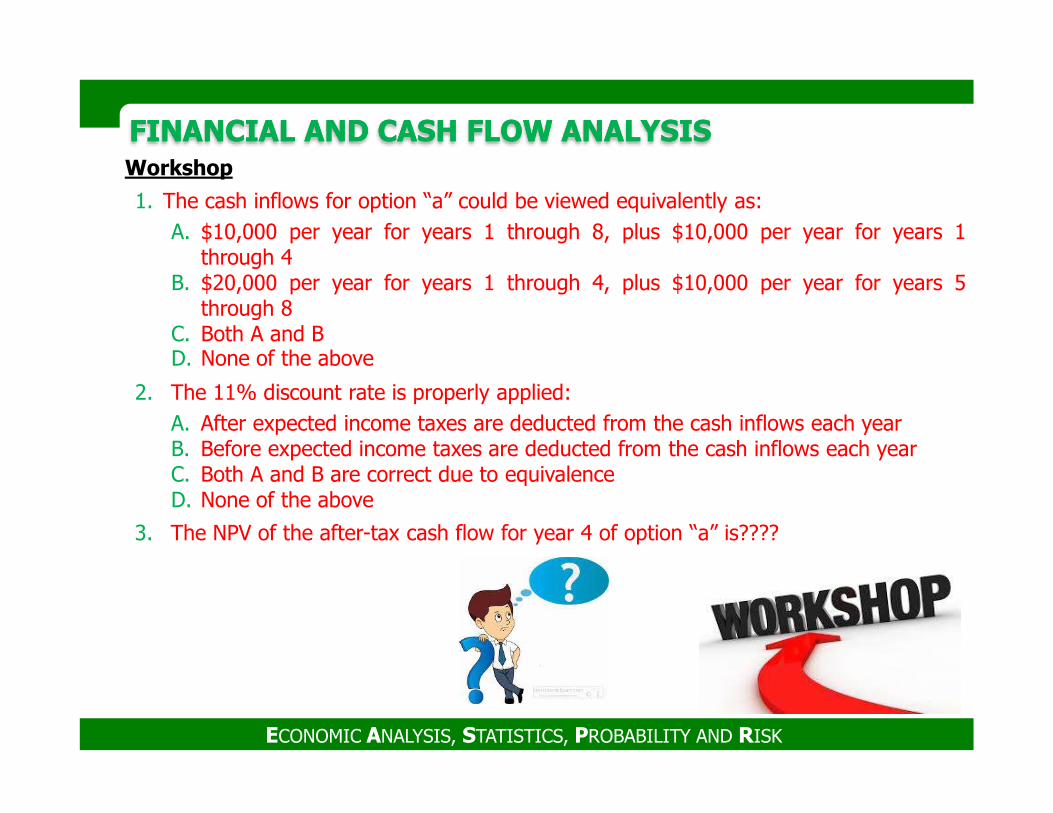
1. The cash inflows for option “a” could be viewed equivalently as:A. $10,000 per year for years 1 through 8, plus $10,000 per year for years 1
through 4B. $20,000 per year for years 1 through 4, plus $10,000 per year for years 5
through 8C. Both A and BD. None of the above
2. The 11% discount rate is properly applied:
ECONOMIC ANALYSIS, STATISTICS, PROBABILITY AND RISK
A. After expected income taxes are deducted from the cash inflows each yearB. Before expected income taxes are deducted from the cash inflows each yearC. Both A and B are correct due to equivalenceD. None of the above
3. The NPV of the after-tax cash flow for year 4 of option “a” is????
FINANCIAL AND CASH FLOW ANALYSIS FINANCIAL AND CASH FLOW ANALYSIS
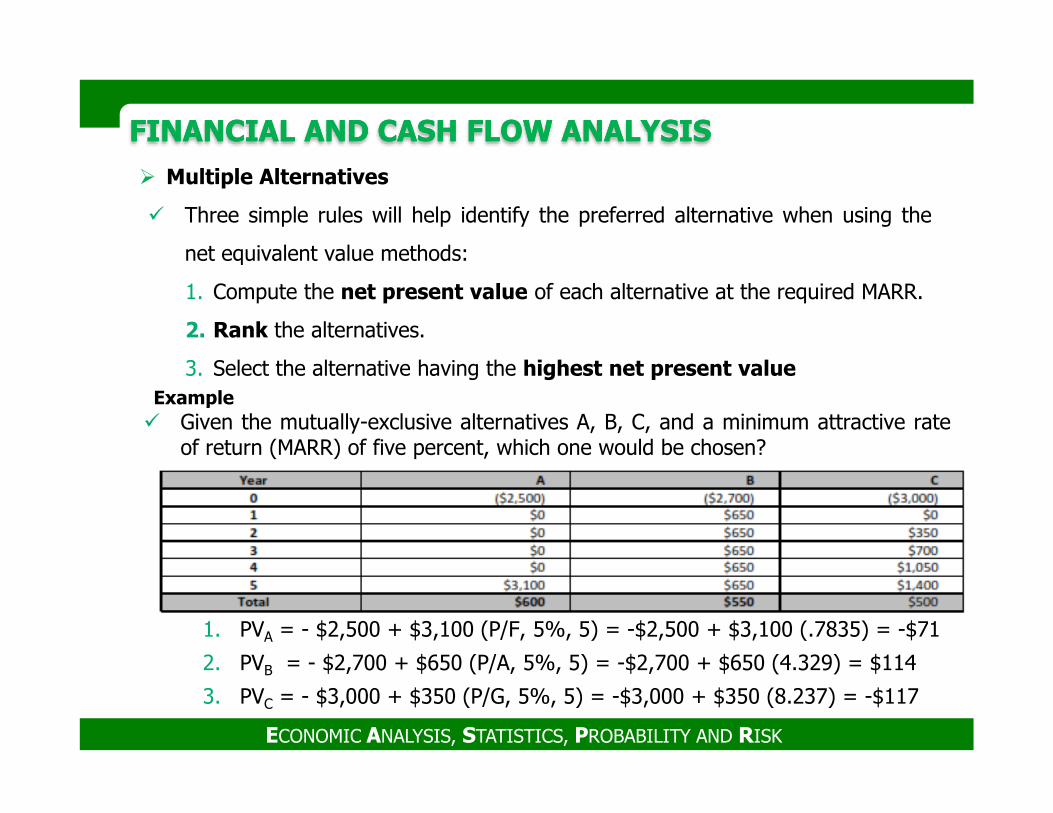
� Multiple Alternatives
� Three simple rules will help identify the preferred alternative when using the
net equivalent value methods:
1. Compute the net present value of each alternative at the required MARR.
2. Rank the alternatives.
3. Select the alternative having the highest net present valueExample
ECONOMIC ANALYSIS, STATISTICS, PROBABILITY AND RISK
Example� Given the mutually-exclusive alternatives A, B, C, and a minimum attractive rate
of return (MARR) of five percent, which one would be chosen?
1. PVA = - $2,500 + $3,100 (P/F, 5%, 5) = -$2,500 + $3,100 (.7835) = -$71
2. PVB = - $2,700 + $650 (P/A, 5%, 5) = -$2,700 + $650 (4.329) = $114
3. PVC = - $3,000 + $350 (P/G, 5%, 5) = -$3,000 + $350 (8.237) = -$117
FINANCIAL AND CASH FLOW ANALYSIS FINANCIAL AND CASH FLOW ANALYSIS
� Incremental Analysis
� This technique is based on the paired comparison of alternatives.
� The following steps should be followed in an incremental rate-of return analysis:
1. Identify all alternatives.
2. Calculate the ROR for each alternative and discard any alternative with ROR <
MARR.
3. Arrange remaining alternatives in ascending order of initial cost.
ECONOMIC ANALYSIS, STATISTICS, PROBABILITY AND RISK
3. Arrange remaining alternatives in ascending order of initial cost.
4. Calculate the ROR on the difference between the first two (lowest initial cost)
alternatives (if this ∆ROR = MARR, retain the higher cost alternative, otherwise
retain the lower cost alternative).
5. Select the retained alternative from the previous step, compare it to the next
higher alternative using the calculation of step 4 and calculate the rate-of-return
on their difference (if this ∆ROR = MARR, retain the higher cost alternative,
otherwise retain the lower cost alternative).
6. Repeat this process until all alternatives have been evaluated.
PRACTICAL CORPORATE INVESTMENT DECISION-MAKING GUIDE
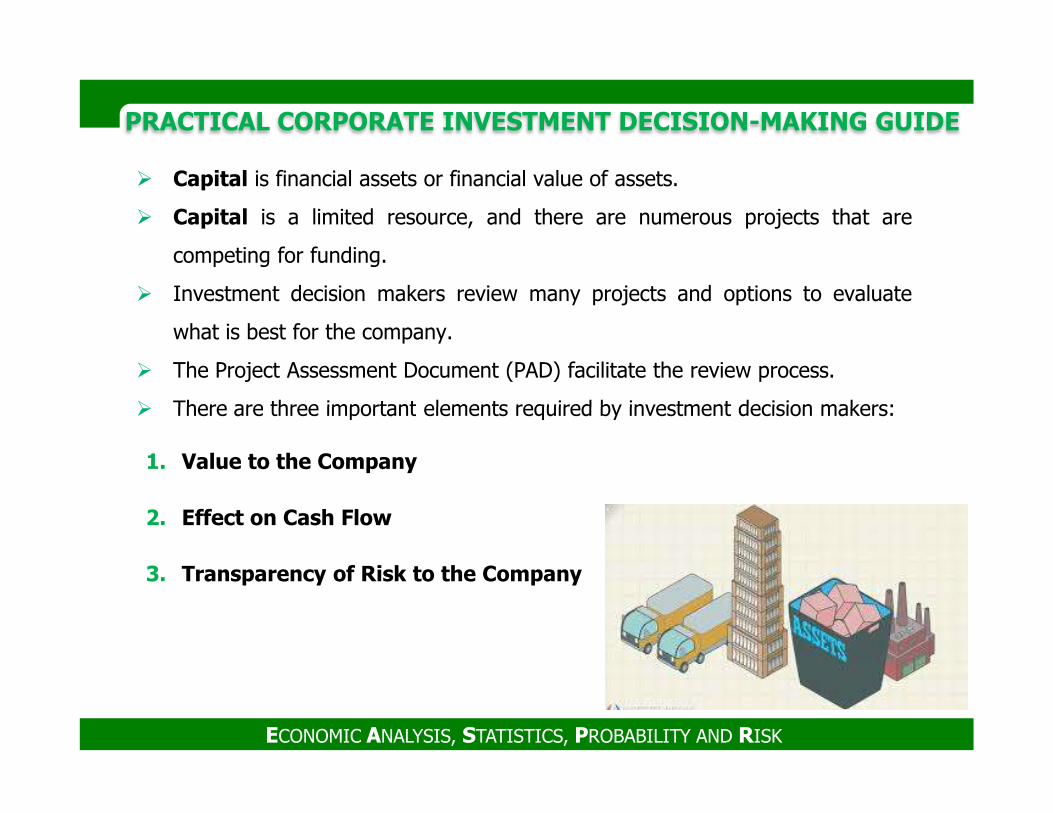
� Capital is financial assets or financial value of assets.
� Capital is a limited resource, and there are numerous projects that are
competing for funding.
� Investment decision makers review many projects and options to evaluate
what is best for the company.
� The Project Assessment Document (PAD) facilitate the review process.
� There are three important elements required by investment decision makers:
ECONOMIC ANALYSIS, STATISTICS, PROBABILITY AND RISK
� There are three important elements required by investment decision makers:
1. Value to the Company
2. Effect on Cash Flow
3. Transparency of Risk to the Company
PRACTICAL CORPORATE INVESTMENT DECISION-MAKING GUIDE
i. Value to the Company
� Company’s market and operating condition.
� A project aligned with the core values (strategic vision) of the company.
� Business lines that are difficult to sustain and that pull a company away from its
strategic vision will erode the cash flow of the company over time.
ii. Effect on Cash Flow
� Cash flow analysis is generally more important than profit analysis.
ECONOMIC ANALYSIS, STATISTICS, PROBABILITY AND RISK
� Cash flow analysis is generally more important than profit analysis.
� It is important to determine the viability of company.
� Projects must support and improve the cash flow of a company.
� Not all projects generate profit, but they can improve the cash flow of a company.
iii. Transparency of Risk to the Company
� A transparent, clear, and realistic accounting of risks is vital to assessing a project.
� It is far better to fund a well-defined (but less profitable) project than to fund
(gamble on) a highly profitable project with uncertain risks.
PRACTICAL CORPORATE INVESTMENT DECISION-MAKING GUIDE
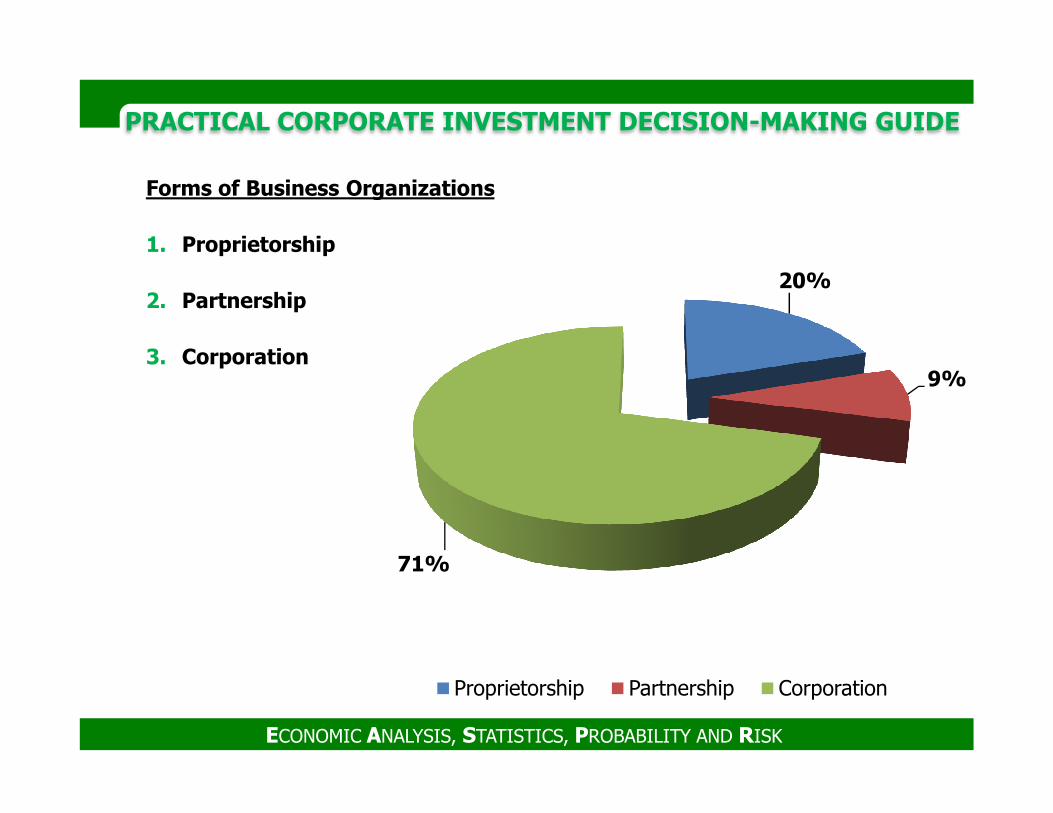
Forms of Business Organizations
1. Proprietorship
2. Partnership
3. Corporation
20%
9%
ECONOMIC ANALYSIS, STATISTICS, PROBABILITY AND RISK
71%
Proprietorship Partnership Corporation
PRACTICAL CORPORATE INVESTMENT DECISION-MAKING GUIDE
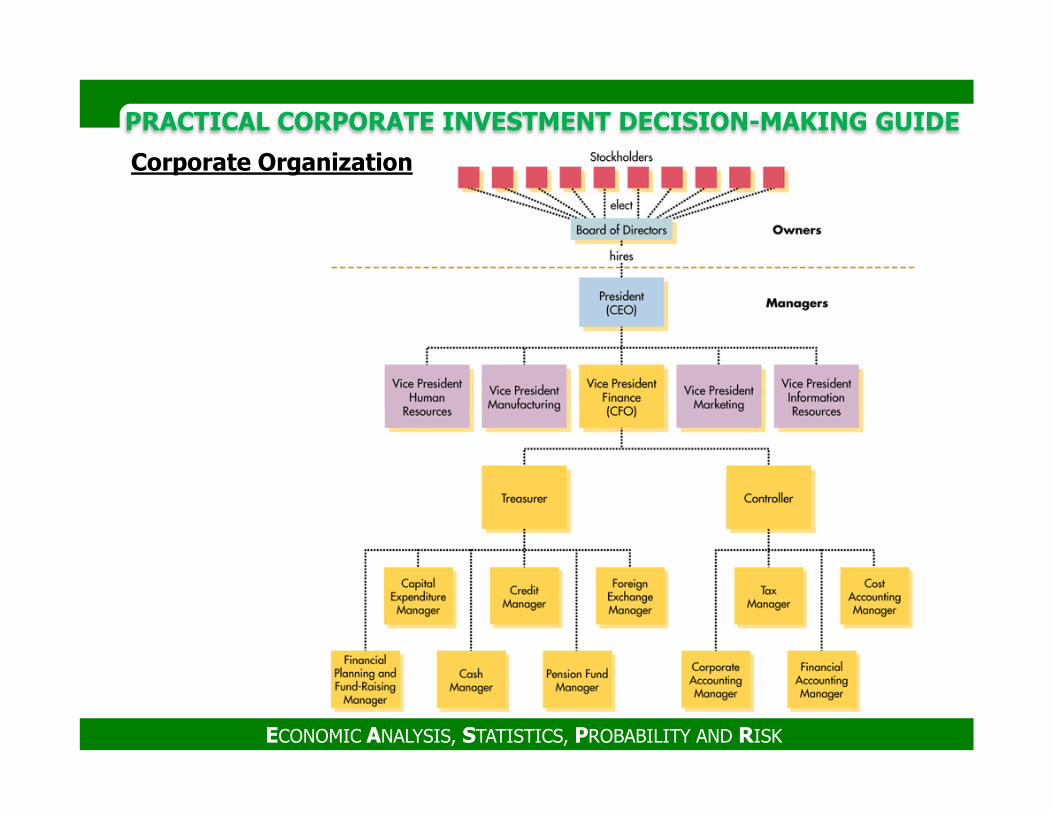
Corporate Organization
ECONOMIC ANALYSIS, STATISTICS, PROBABILITY AND RISK
PRACTICAL CORPORATE INVESTMENT DECISION-MAKING GUIDE
Goals of the Corporation
� Primary Goal
� MAXIMIZE Stockholder Wealth = MAXIMIZE Stock Price
� Managerial Incentives
Controlled by competitive forces
ECONOMIC ANALYSIS, STATISTICS, PROBABILITY AND RISK
� Controlled by competitive forces
� Social Responsibility
� Must be mandated initially to reduce disadvantages
� Stock Price Maximization and Social Welfare
� Maximizing stock = benefiting society
PRACTICAL CORPORATE INVESTMENT DECISION-MAKING GUIDE
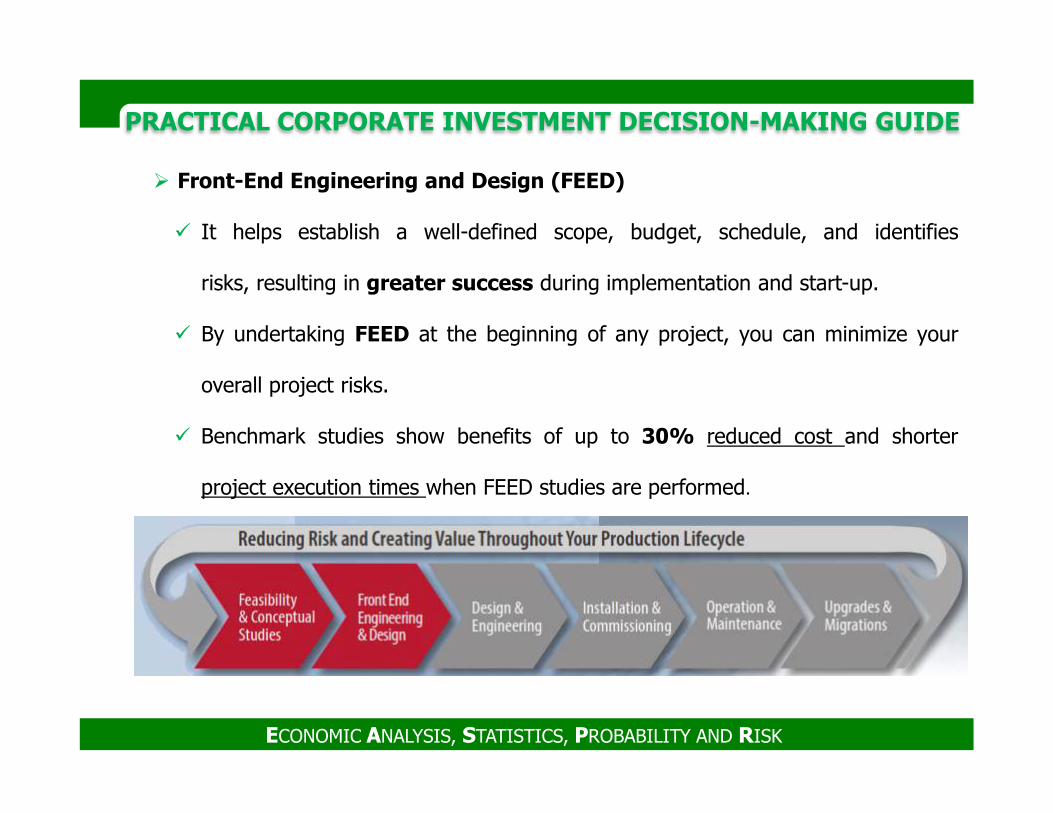
� Front-End Engineering and Design (FEED)
� It helps establish a well-defined scope, budget, schedule, and identifies
risks, resulting in greater success during implementation and start-up.
� By undertaking FEED at the beginning of any project, you can minimize your
overall project risks.
ECONOMIC ANALYSIS, STATISTICS, PROBABILITY AND RISK
� Benchmark studies show benefits of up to 30% reduced cost and shorter
project execution times when FEED studies are performed.
PRACTICAL CORPORATE INVESTMENT DECISION-MAKING GUIDE
� Front End Loading (FEL) or Pre-Project Planning (PPP)
� Defining the project scope and plans in a way that assures the best practical
level of definition is achieved as needed to support a project decision gate.
� FEL is pre-project planning to develop sufficient strategic information to
assess risks to make decisions concerning resources and insure success.
� The optimal critical success factors that define FEL are determined based upon
the project’s outcome as assessed by the key performance indicators.
ECONOMIC ANALYSIS, STATISTICS, PROBABILITY AND RISK
the project’s outcome as assessed by the key performance indicators.
� The key performance indicators
� By which an organization can measure the progress being made to ensure that
the critical success factors are being achieved.
PRACTICAL CORPORATE INVESTMENT DECISION-MAKING GUIDE
� Average Annual Rate of Return (AARR)
� The measure (%) of profitability of an asset over a period of time.
� It is the average yearly profit over the operating lifecycle of a facility and
dividing it by the final cost of the project.
� It compares to the corporate discount rate of a company.
� Investment
ECONOMIC ANALYSIS, STATISTICS, PROBABILITY AND RISK
� Investment
� The act of contributing money or capital into an enterprise with the expectation
of future profit.
� Investments have a limited decision time-frame to determine the impact of a
20-year life cycle on the company cash flow.
PRACTICAL CORPORATE INVESTMENT DECISION-MAKING GUIDE
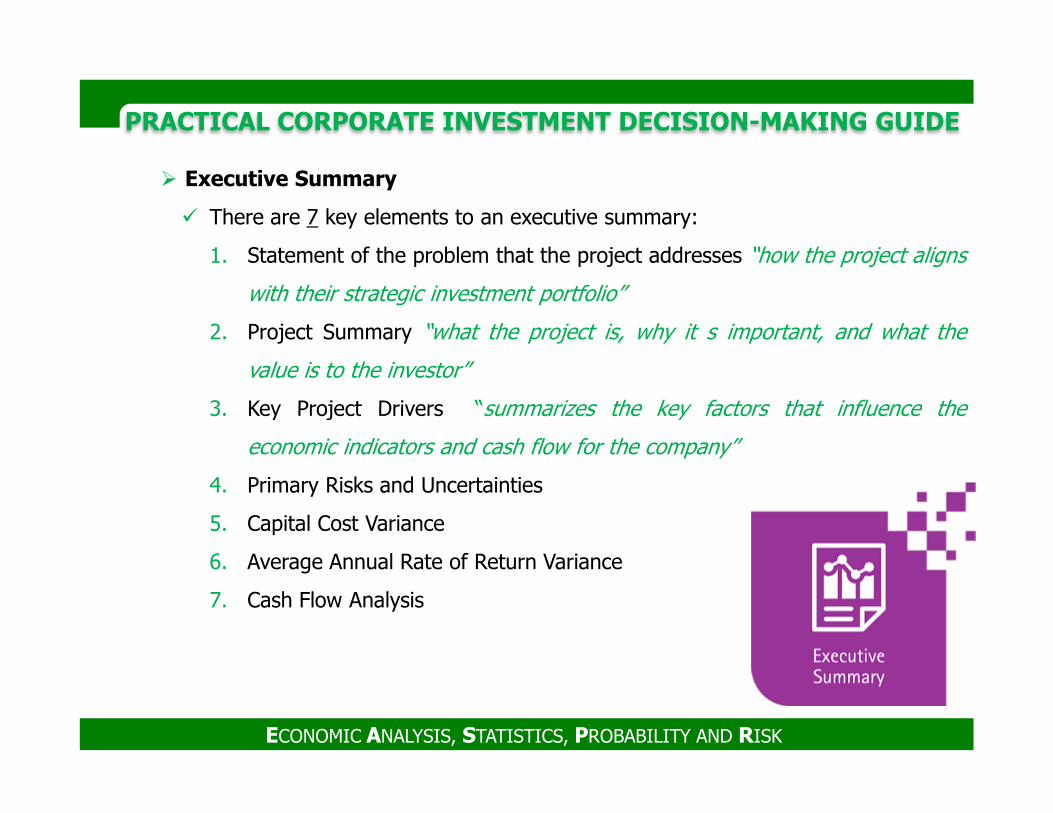
� Executive Summary
� There are 7 key elements to an executive summary:
1. Statement of the problem that the project addresses “how the project aligns
with their strategic investment portfolio”
2. Project Summary “what the project is, why it s important, and what the
value is to the investor”
3. Key Project Drivers “summarizes the key factors that influence the
ECONOMIC ANALYSIS, STATISTICS, PROBABILITY AND RISK
3. Key Project Drivers “summarizes the key factors that influence the
economic indicators and cash flow for the company”
4. Primary Risks and Uncertainties
5. Capital Cost Variance
6. Average Annual Rate of Return Variance
7. Cash Flow Analysis
PRACTICAL CORPORATE INVESTMENT DECISION-MAKING GUIDE
ECONOMIC ANALYSIS, STATISTICS, PROBABILITY AND RISK
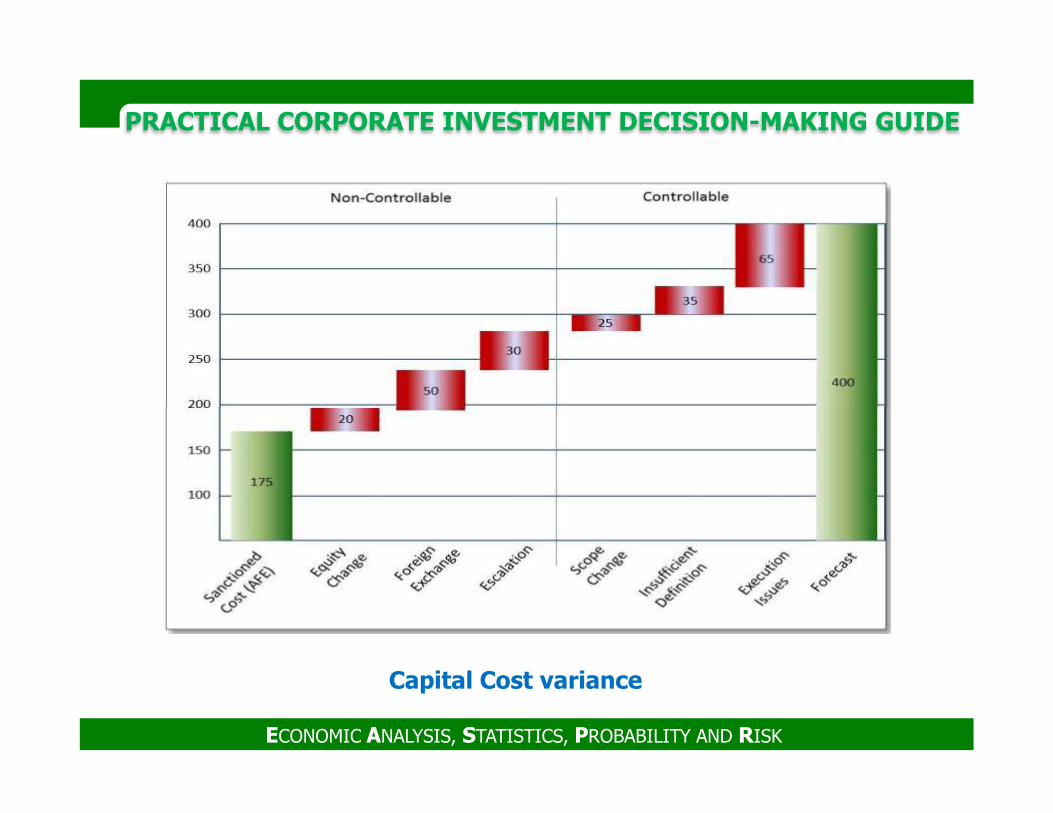
Capital Cost variance
PRACTICAL CORPORATE INVESTMENT DECISION-MAKING GUIDE
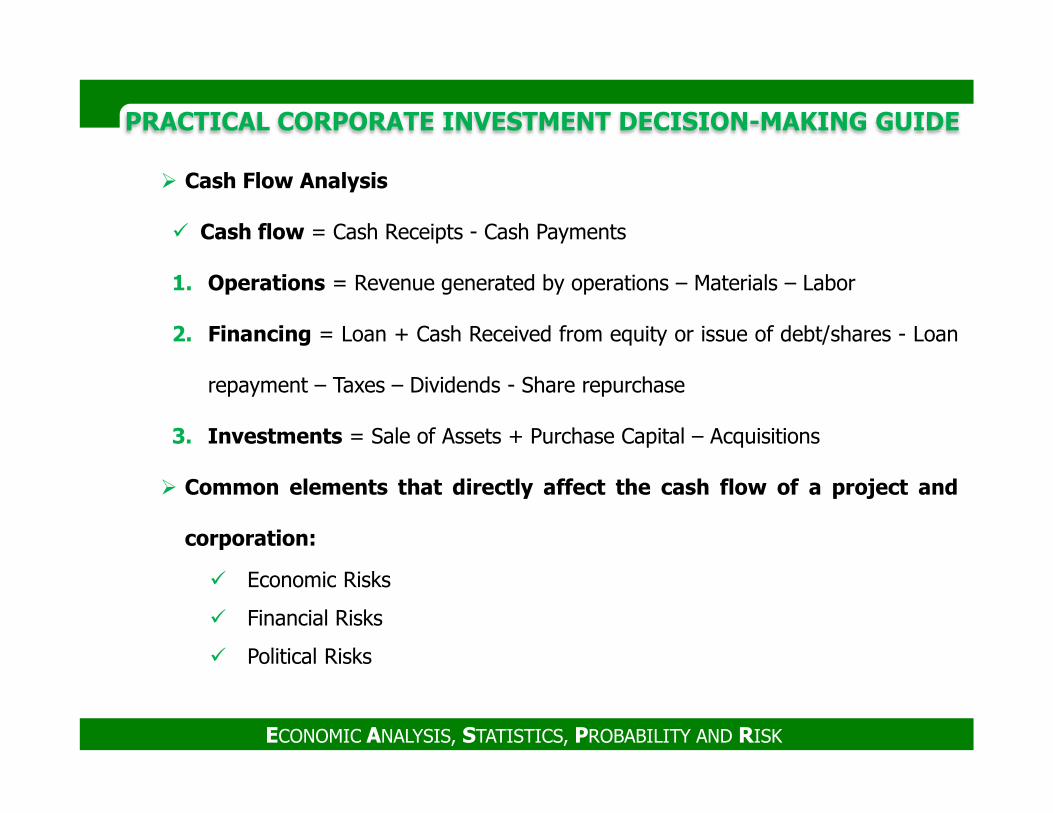
� Cash Flow Analysis
� Cash flow = Cash Receipts - Cash Payments
1. Operations = Revenue generated by operations – Materials – Labor
2. Financing = Loan + Cash Received from equity or issue of debt/shares - Loan
repayment – Taxes – Dividends - Share repurchase
ECONOMIC ANALYSIS, STATISTICS, PROBABILITY AND RISK
3. Investments = Sale of Assets + Purchase Capital – Acquisitions
� Common elements that directly affect the cash flow of a project and
corporation:
� Economic Risks
� Financial Risks
� Political Risks
PRACTICAL CORPORATE INVESTMENT DECISION-MAKING GUIDE
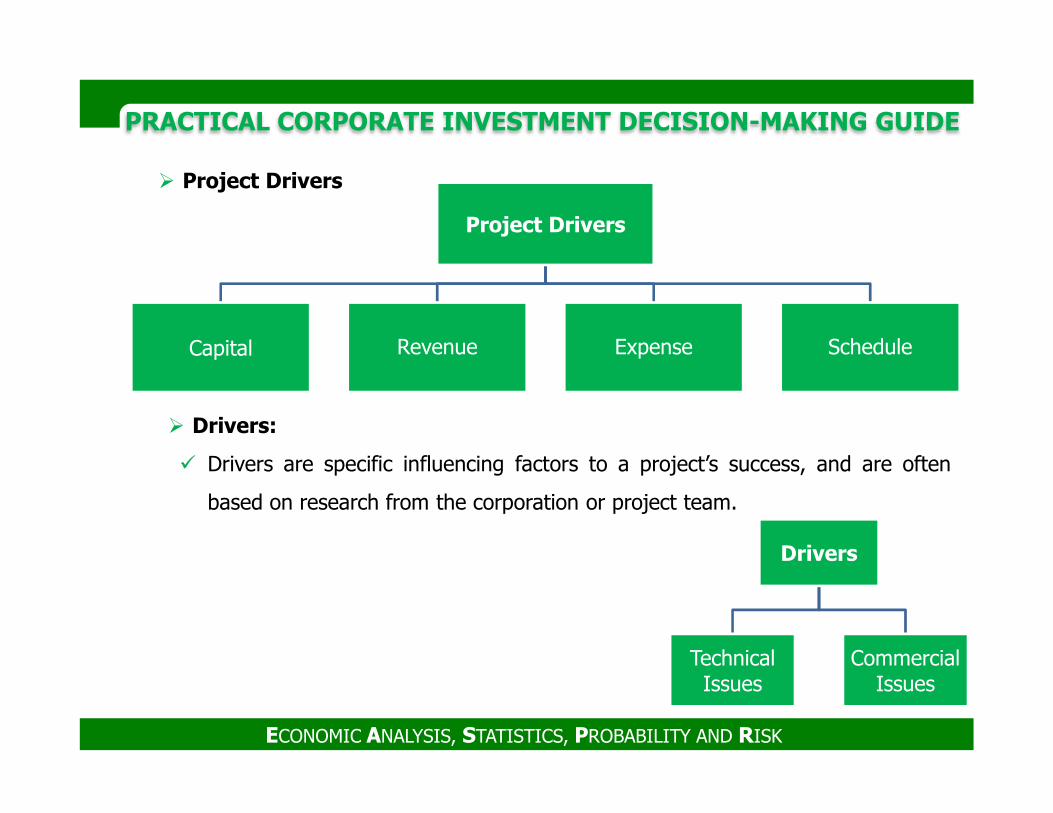
Project Drivers
Capital Revenue Expense Schedule
� Project Drivers
ECONOMIC ANALYSIS, STATISTICS, PROBABILITY AND RISK
� Drivers:
� Drivers are specific influencing factors to a project’s success, and are often
based on research from the corporation or project team.
Drivers
Technical Issues
Commercial Issues
PRACTICAL CORPORATE INVESTMENT DECISION-MAKING GUIDE
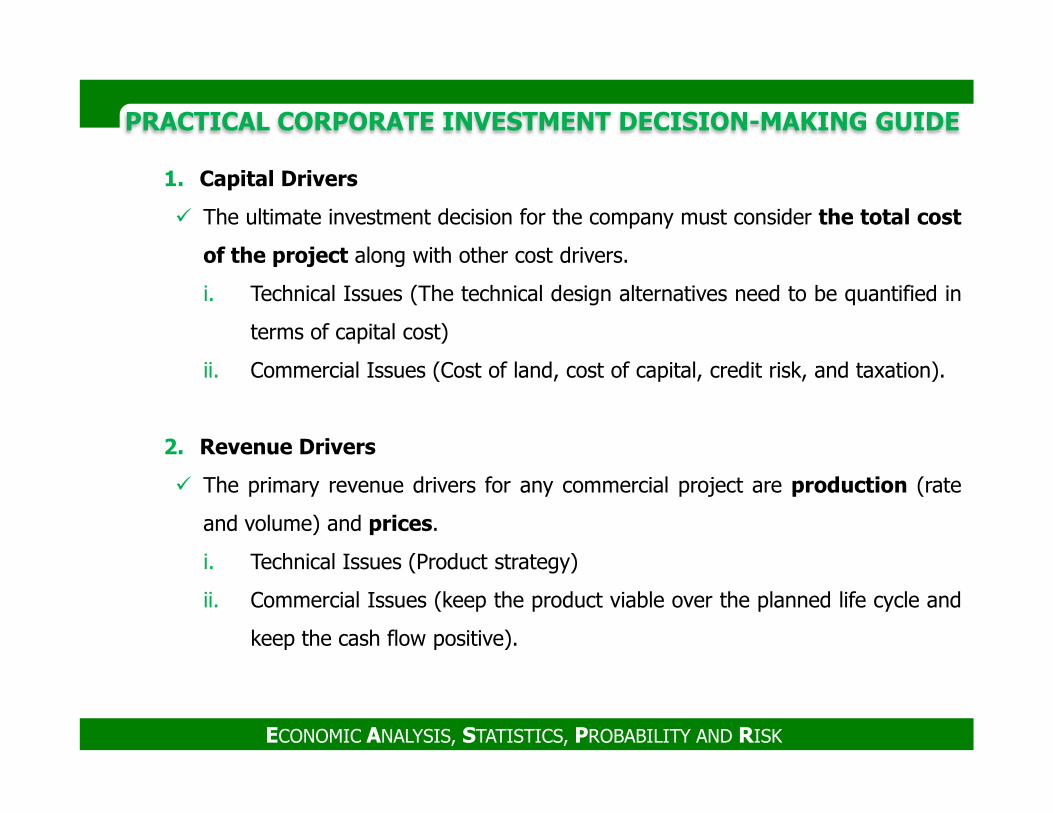
1. Capital Drivers
� The ultimate investment decision for the company must consider the total cost
of the project along with other cost drivers.
i. Technical Issues (The technical design alternatives need to be quantified in
terms of capital cost)
ii. Commercial Issues (Cost of land, cost of capital, credit risk, and taxation).
ECONOMIC ANALYSIS, STATISTICS, PROBABILITY AND RISK
2. Revenue Drivers
� The primary revenue drivers for any commercial project are production (rate
and volume) and prices.
i. Technical Issues (Product strategy)
ii. Commercial Issues (keep the product viable over the planned life cycle and
keep the cash flow positive).
PRACTICAL CORPORATE INVESTMENT DECISION-MAKING GUIDE
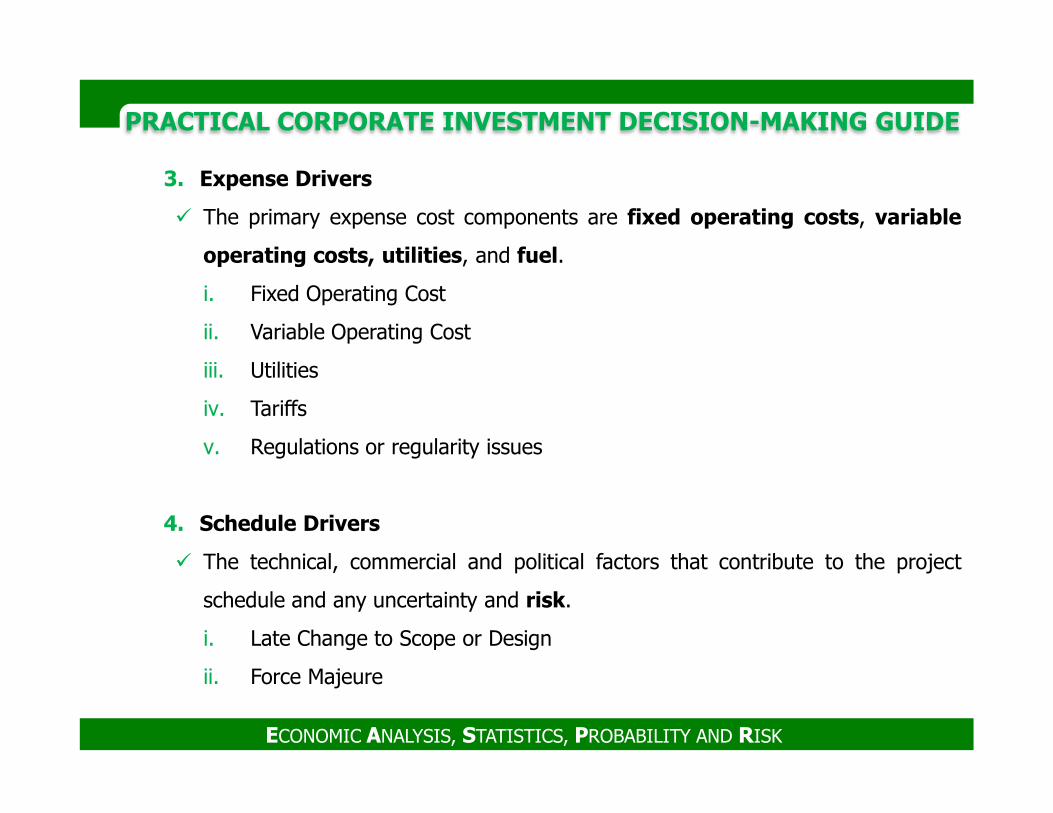
3. Expense Drivers
� The primary expense cost components are fixed operating costs, variable
operating costs, utilities, and fuel.
i. Fixed Operating Cost
ii. Variable Operating Cost
iii. Utilities
iv. Tariffs
ECONOMIC ANALYSIS, STATISTICS, PROBABILITY AND RISK
iv. Tariffs
v. Regulations or regularity issues
4. Schedule Drivers
� The technical, commercial and political factors that contribute to the project
schedule and any uncertainty and risk.
i. Late Change to Scope or Design
ii. Force Majeure
PRACTICAL CORPORATE INVESTMENT DECISION-MAKING GUIDE
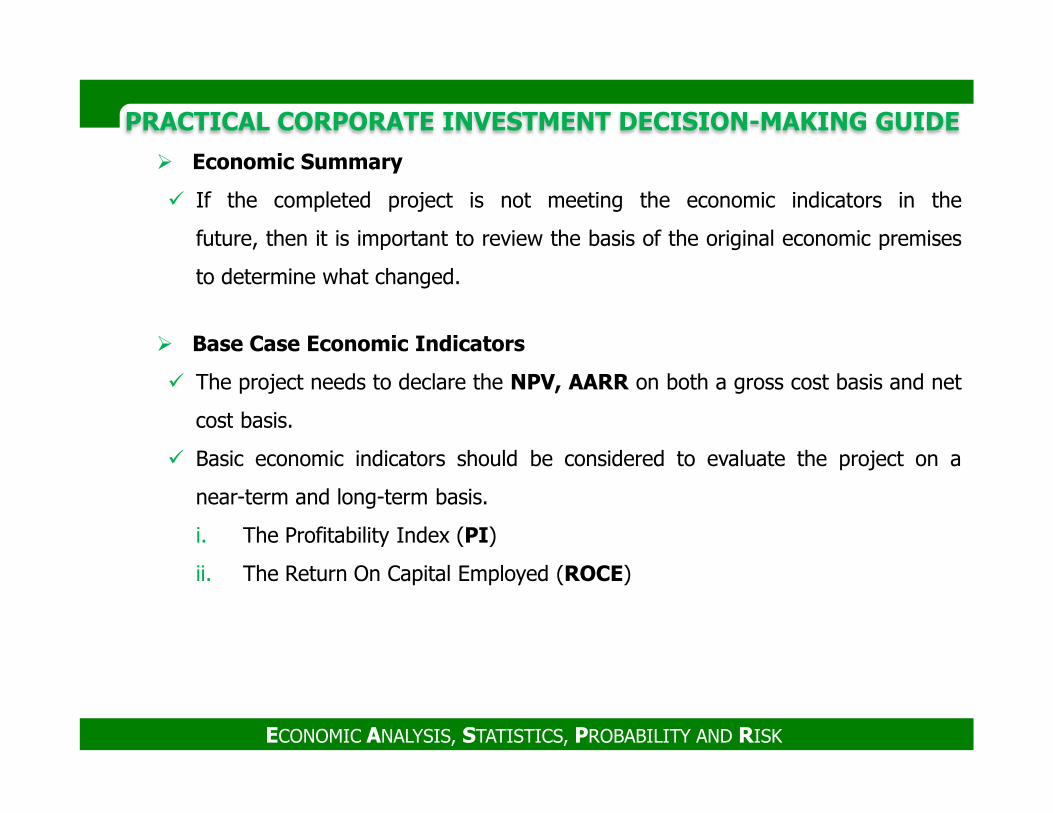
� Economic Summary
� If the completed project is not meeting the economic indicators in the
future, then it is important to review the basis of the original economic premises
to determine what changed.
� Base Case Economic Indicators
� The project needs to declare the NPV, AARR on both a gross cost basis and net
cost basis.
ECONOMIC ANALYSIS, STATISTICS, PROBABILITY AND RISK
cost basis.
� Basic economic indicators should be considered to evaluate the project on a
near-term and long-term basis.
i. The Profitability Index (PI)
ii. The Return On Capital Employed (ROCE)
PRACTICAL CORPORATE INVESTMENT DECISION-MAKING GUIDE
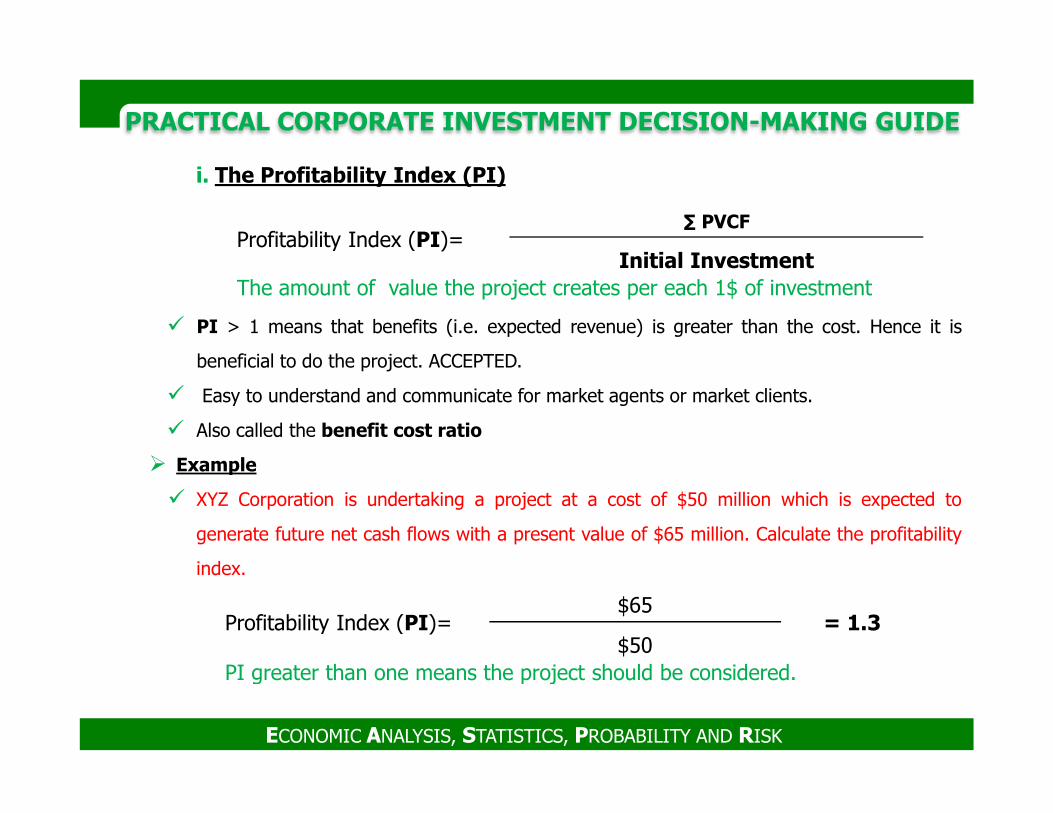
i. The Profitability Index (PI)
� PI > 1 means that benefits (i.e. expected revenue) is greater than the cost. Hence it is
beneficial to do the project. ACCEPTED.
� Easy to understand and communicate for market agents or market clients.
Profitability Index (PI)=∑ PVCF
Initial InvestmentThe amount of value the project creates per each 1$ of investment
ECONOMIC ANALYSIS, STATISTICS, PROBABILITY AND RISK
� Also called the benefit cost ratio
� Example
� XYZ Corporation is undertaking a project at a cost of $50 million which is expected to
generate future net cash flows with a present value of $65 million. Calculate the profitability
index.
Profitability Index (PI)=$65
= 1.3$50
PI greater than one means the project should be considered.
PRACTICAL CORPORATE INVESTMENT DECISION-MAKING GUIDE
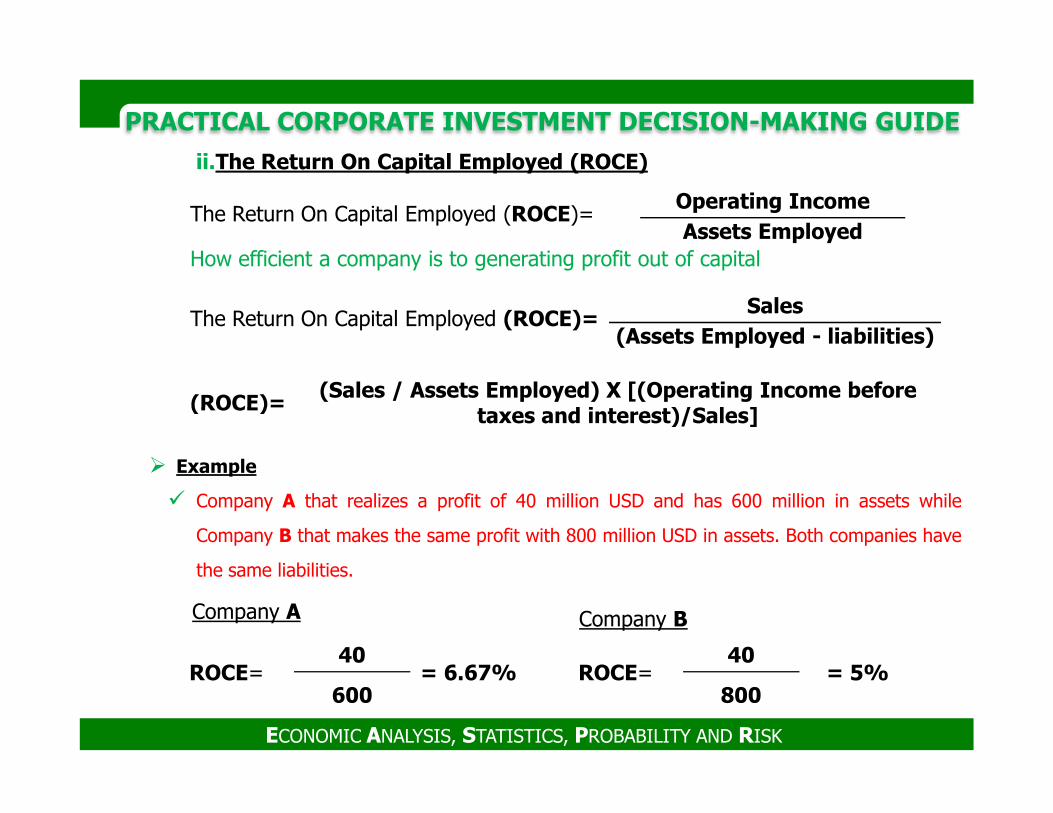
ii.The Return On Capital Employed (ROCE)
The Return On Capital Employed (ROCE)=Operating Income
Assets EmployedHow efficient a company is to generating profit out of capital
The Return On Capital Employed (ROCE)=Sales
(Assets Employed - liabilities)
(ROCE)=(Sales / Assets Employed) X [(Operating Income before
taxes and interest)/Sales]
ECONOMIC ANALYSIS, STATISTICS, PROBABILITY AND RISK
� Example
� Company A that realizes a profit of 40 million USD and has 600 million in assets while
Company B that makes the same profit with 800 million USD in assets. Both companies have
the same liabilities.
ROCE=40
= 6.67%600
ROCE=40
= 5%800
Company A Company B
(ROCE)=taxes and interest)/Sales]
PRACTICAL CORPORATE INVESTMENT DECISION-MAKING GUIDE
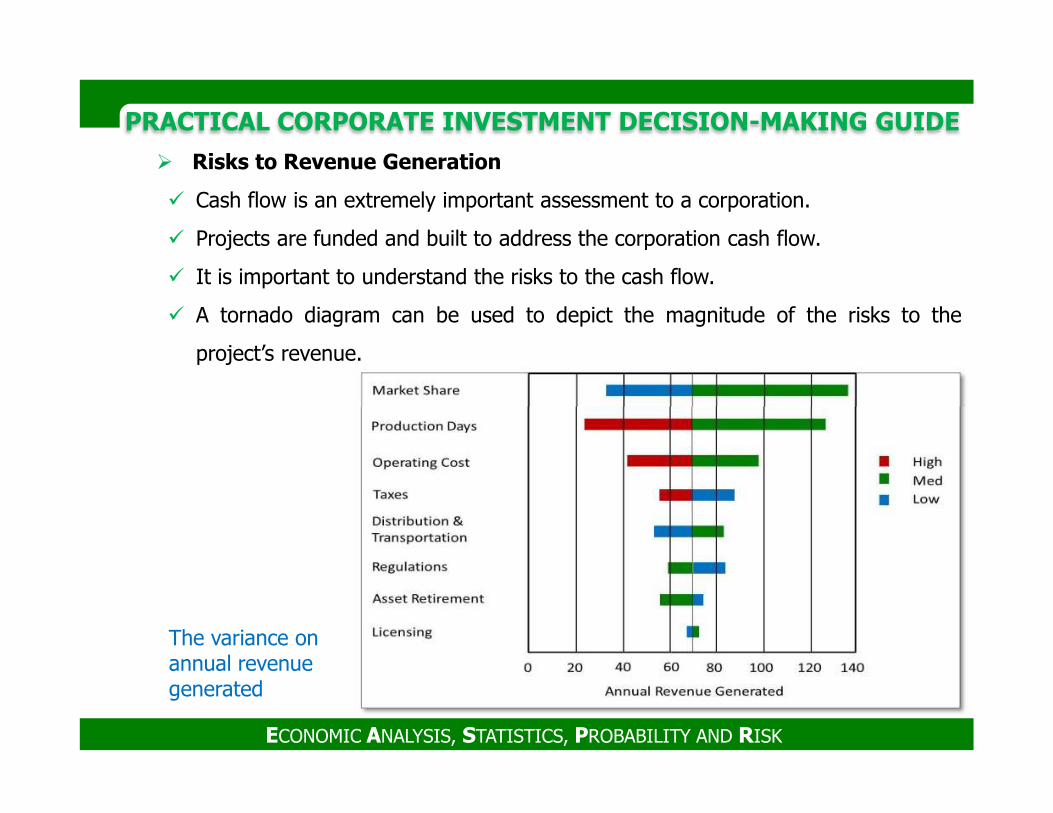
� Risks to Revenue Generation
� Cash flow is an extremely important assessment to a corporation.
� Projects are funded and built to address the corporation cash flow.
� It is important to understand the risks to the cash flow.
� A tornado diagram can be used to depict the magnitude of the risks to the
project’s revenue.
ECONOMIC ANALYSIS, STATISTICS, PROBABILITY AND RISK
The variance on annual revenue generated
STATISTICS & PROBABILITY STATISTICS & PROBABILITY
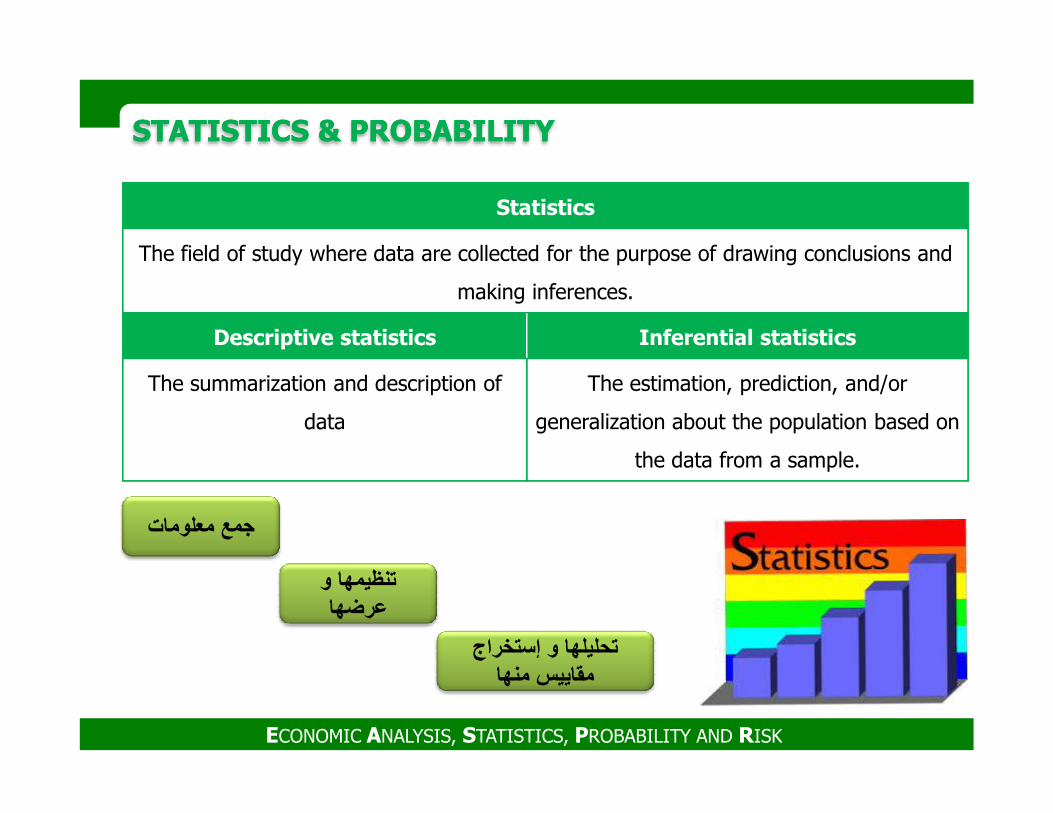
Statistics
The field of study where data are collected for the purpose of drawing conclusions and
making inferences.
Descriptive statistics Inferential statistics
The summarization and description of The estimation, prediction, and/or
ECONOMIC ANALYSIS, STATISTICS, PROBABILITY AND RISK
data generalization about the population based on
the data from a sample.
جمع معلومات
تنظيمھا و عرضھا
تحليلھا و إستخراج مقاييس منھا
STATISTICS & PROBABILITY STATISTICS & PROBABILITY
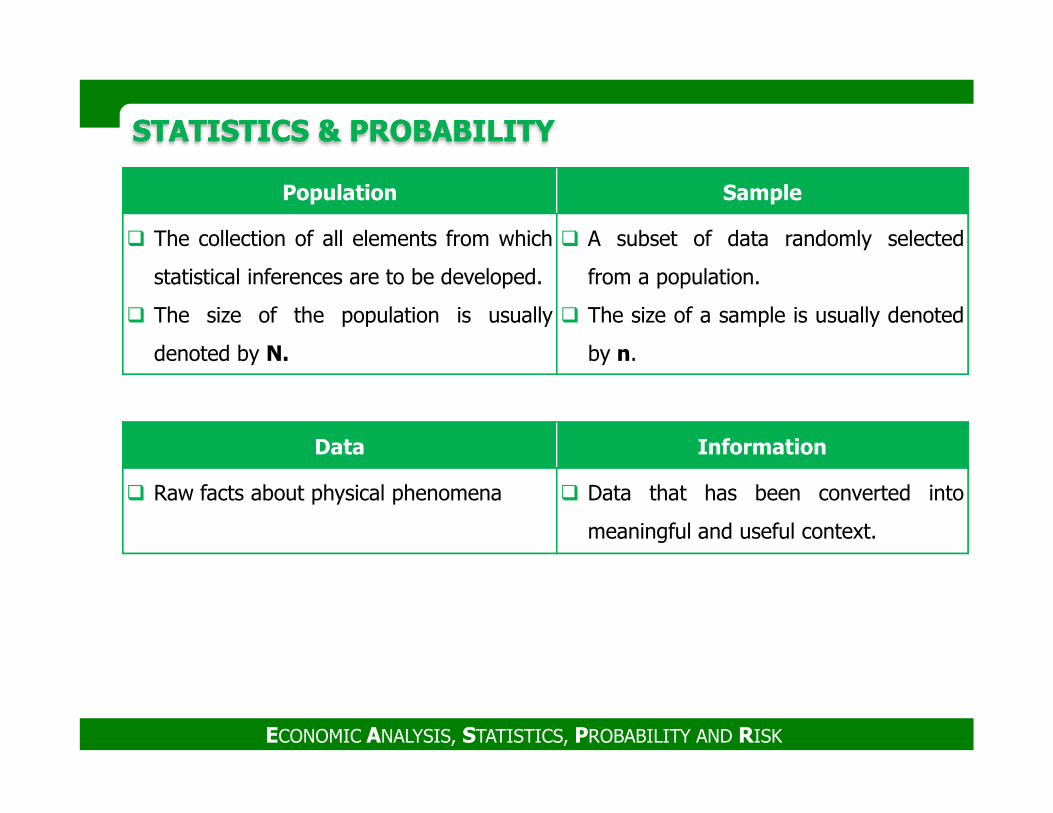
Population Sample
� The collection of all elements from which
statistical inferences are to be developed.
� The size of the population is usually
denoted by N.
� A subset of data randomly selected
from a population.
� The size of a sample is usually denoted
by n.
ECONOMIC ANALYSIS, STATISTICS, PROBABILITY AND RISK
Data Information
� Raw facts about physical phenomena � Data that has been converted into
meaningful and useful context.
Quantitative
Discrete
Continuous
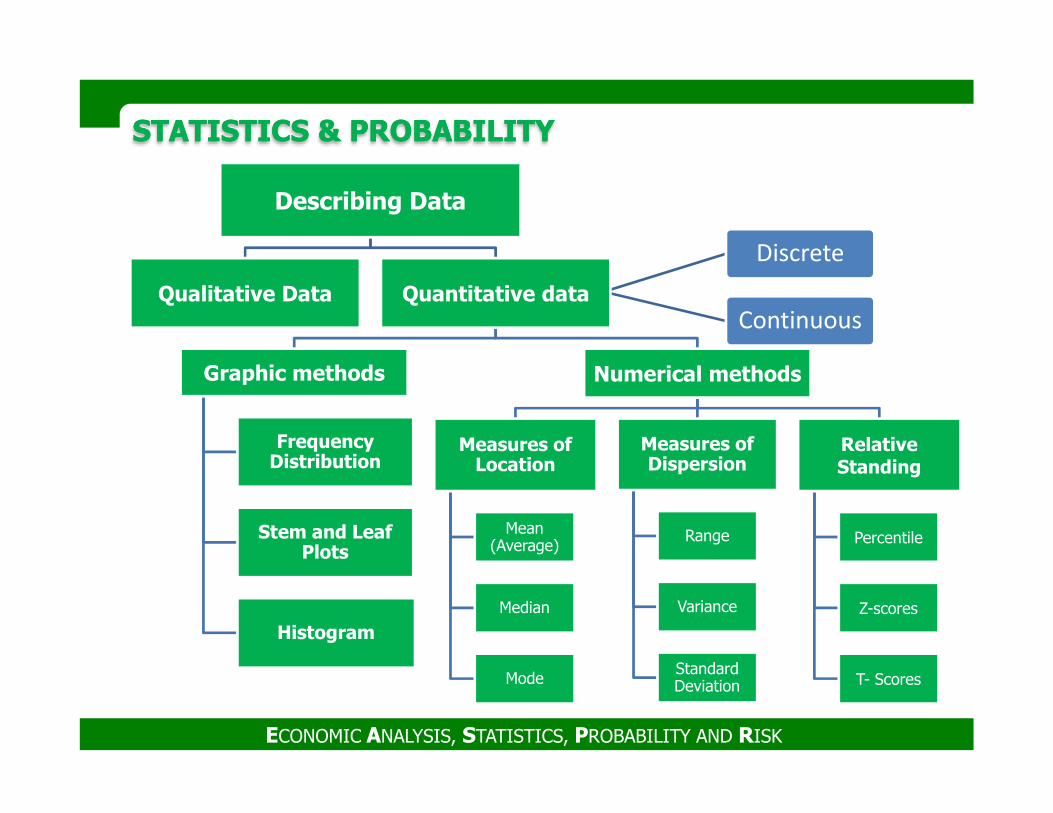
STATISTICS & PROBABILITY STATISTICS & PROBABILITY
Describing Data
Qualitative Data Quantitative data
Graphic methods Numerical methods
ECONOMIC ANALYSIS, STATISTICS, PROBABILITY AND RISK
Frequency Distribution
Stem and Leaf Plots
Histogram
Measures of Location
Mean (Average)
Median
Mode
Measures of Dispersion
Range
Variance
Standard Deviation
Relative Standing
Percentile
Z-scores
T- Scores
STATISTICS & PROBABILITY STATISTICS & PROBABILITY
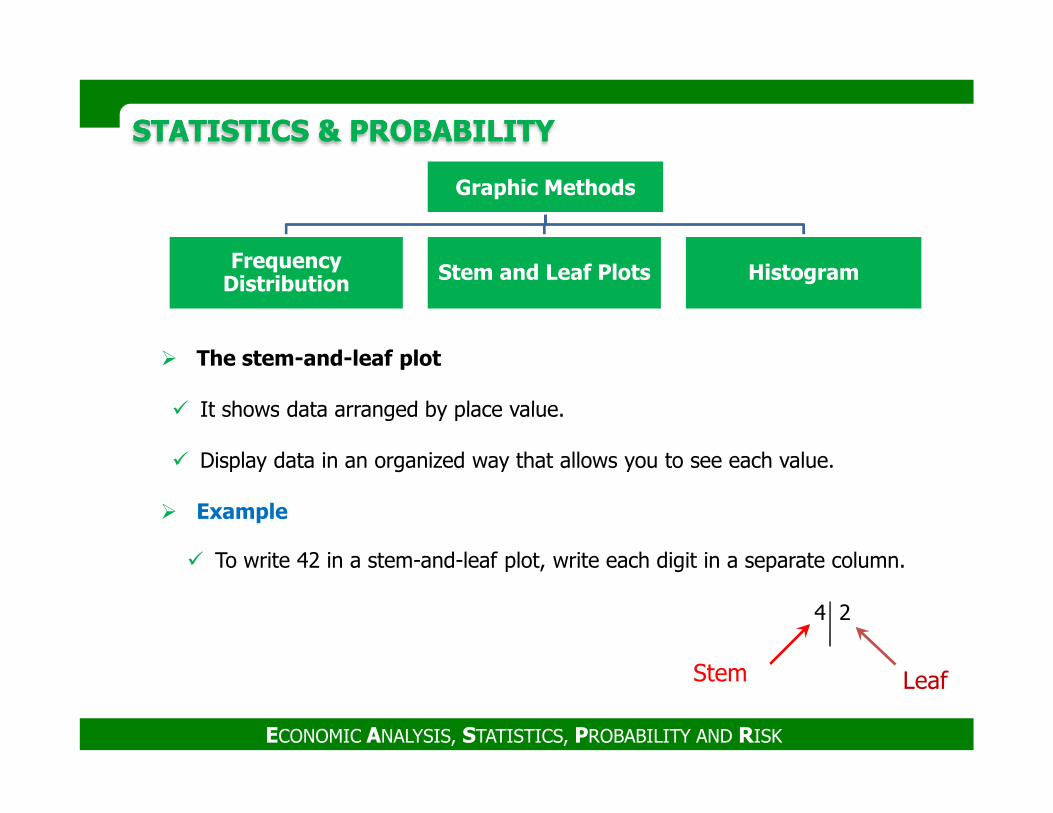
Graphic Methods
Frequency Distribution Stem and Leaf Plots Histogram
� The stem-and-leaf plot
� It shows data arranged by place value.
ECONOMIC ANALYSIS, STATISTICS, PROBABILITY AND RISK
� It shows data arranged by place value.
� Display data in an organized way that allows you to see each value.
� Example
4 2
� To write 42 in a stem-and-leaf plot, write each digit in a separate column.
Stem Leaf
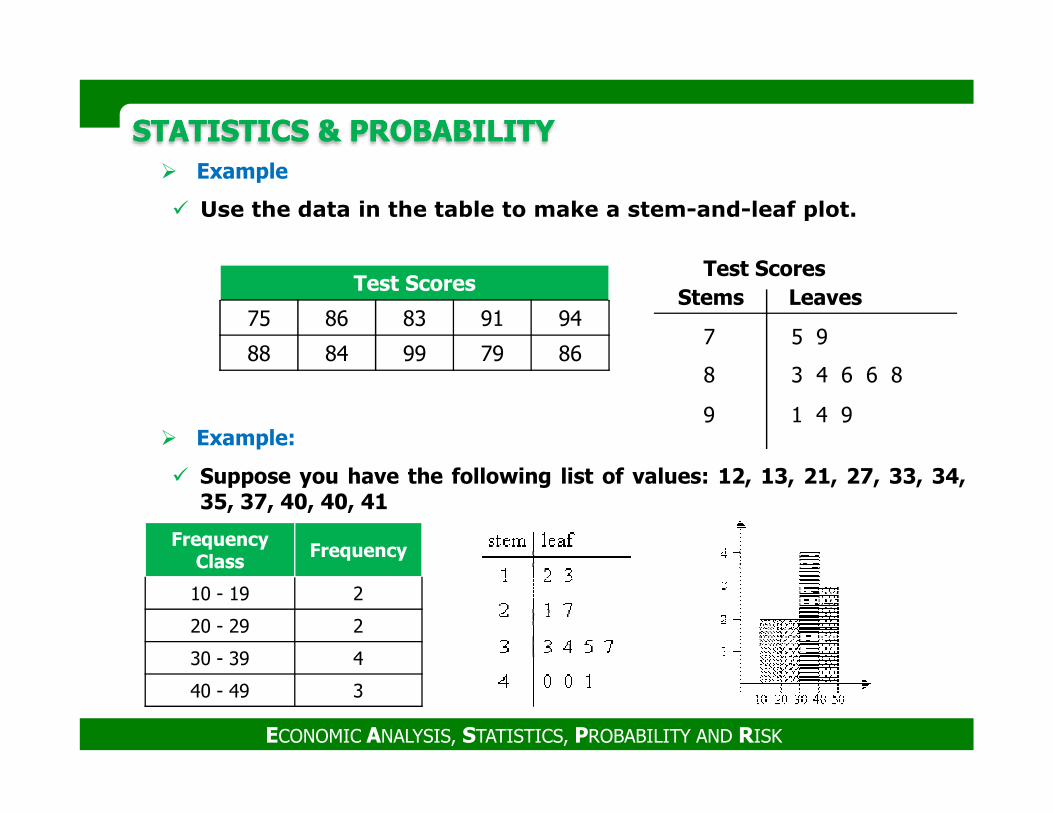
STATISTICS & PROBABILITY STATISTICS & PROBABILITY � Example
� Use the data in the table to make a stem-and-leaf plot.
Test Scores
75 86 83 91 94
88 84 99 79 86
StemsTest Scores
Leaves
7
8
9
5 9
3 4 6 6 8
1 4 9
ECONOMIC ANALYSIS, STATISTICS, PROBABILITY AND RISK
9 1 4 9
FrequencyClass
Frequency
10 - 19 2
20 - 29 2
30 - 39 4
40 - 49 3
� Example:
� Suppose you have the following list of values: 12, 13, 21, 27, 33, 34,35, 37, 40, 40, 41
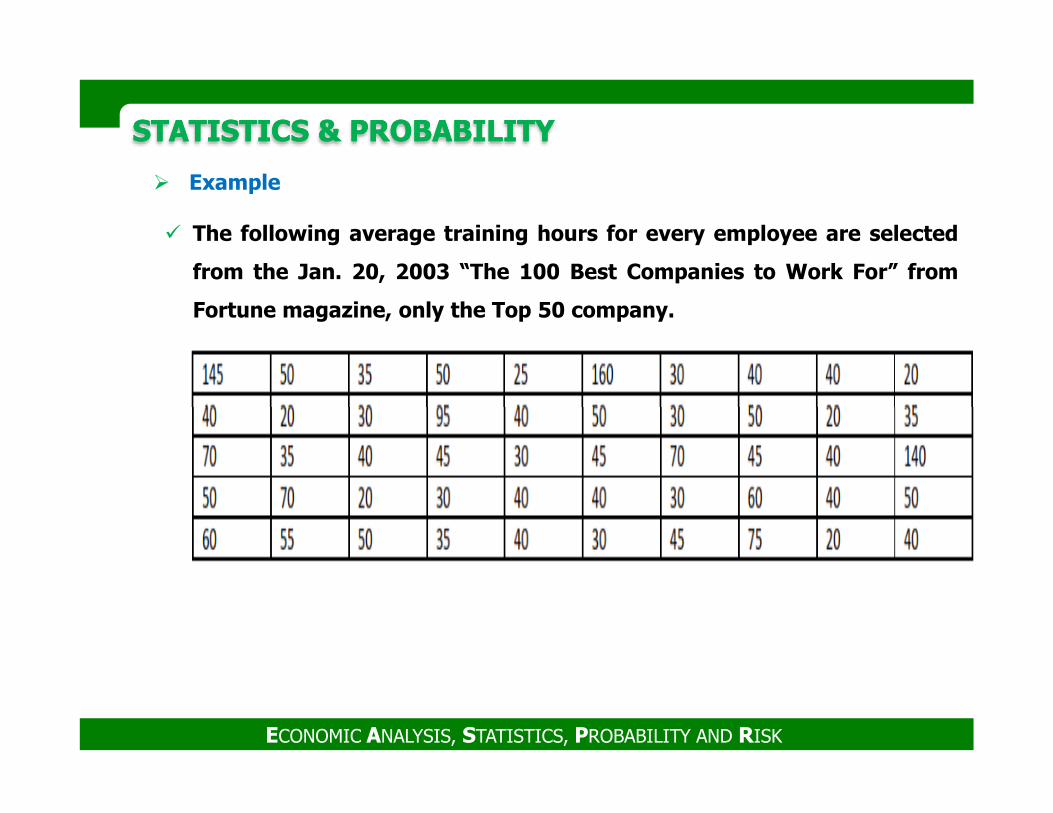
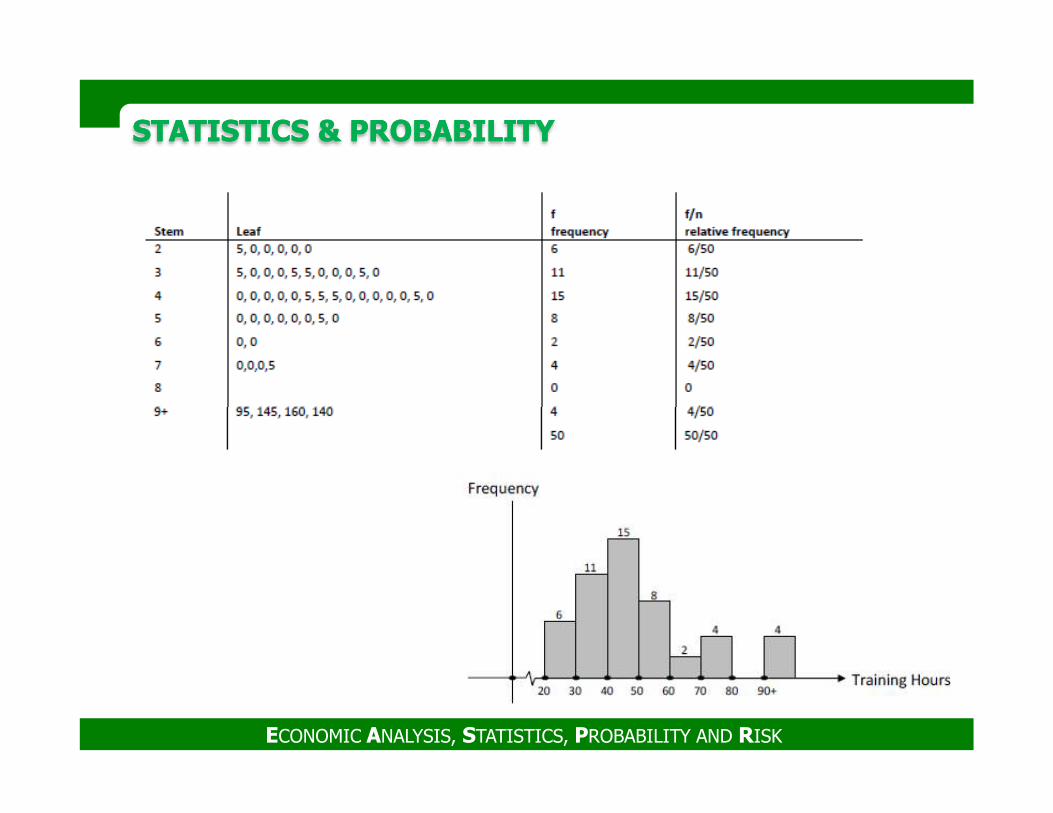
� Example
� The following average training hours for every employee are selected
from the Jan. 20, 2003 “The 100 Best Companies to Work For” from
Fortune magazine, only the Top 50 company.
STATISTICS & PROBABILITY STATISTICS & PROBABILITY
ECONOMIC ANALYSIS, STATISTICS, PROBABILITY AND RISK
STATISTICS & PROBABILITY STATISTICS & PROBABILITY
ECONOMIC ANALYSIS, STATISTICS, PROBABILITY AND RISK
� The sum of measurements
divided by the number of
measurements
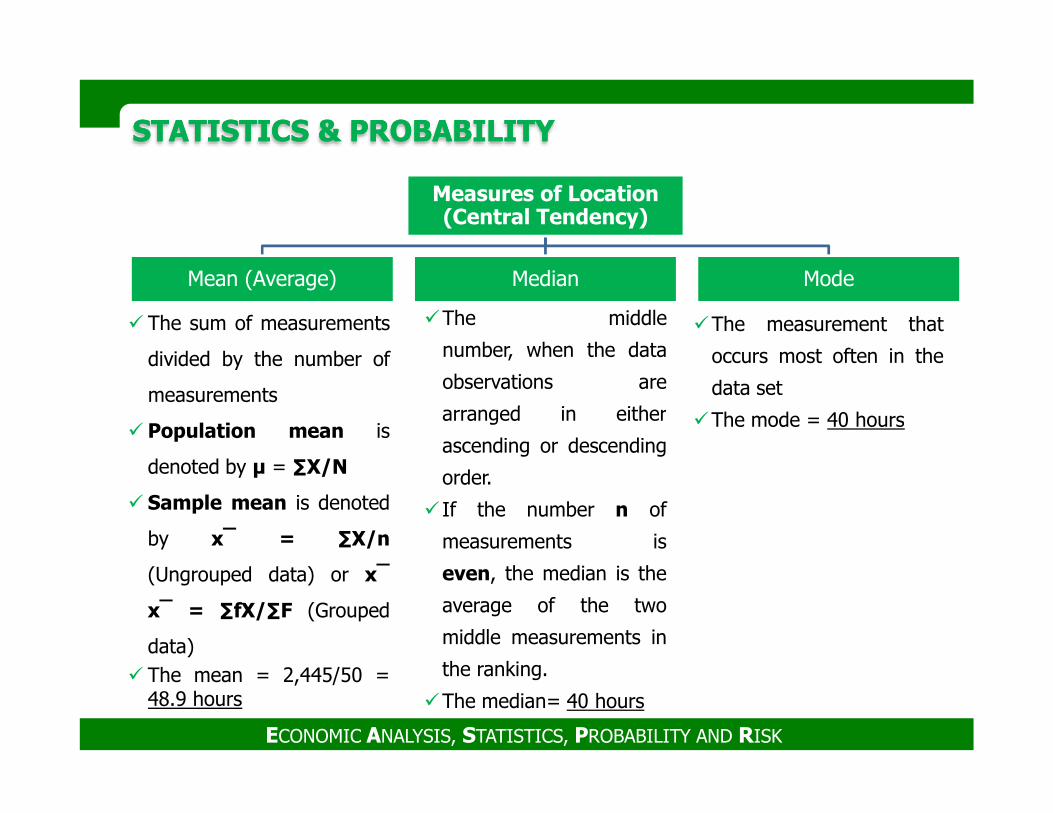
STATISTICS & PROBABILITY STATISTICS & PROBABILITY
Measures of Location (Central Tendency)
Mean (Average) Median Mode
�The middle
number, when the data
observations are
arranged in either
�The measurement that
occurs most often in the
data set
The mode = 40 hours� Population mean is
denoted by µ = ∑X/N
� Sample mean is denoted
by x‾ = ∑X/n
(Ungrouped data) or x‾
x‾ = ∑fX/∑F (Grouped
data)� The mean = 2,445/50 =
48.9 hours
ECONOMIC ANALYSIS, STATISTICS, PROBABILITY AND RISK
arranged in either
ascending or descending
order.
� If the number n of
measurements is
even, the median is the
average of the two
middle measurements in
the ranking.
�The median= 40 hours
�The mode = 40 hours
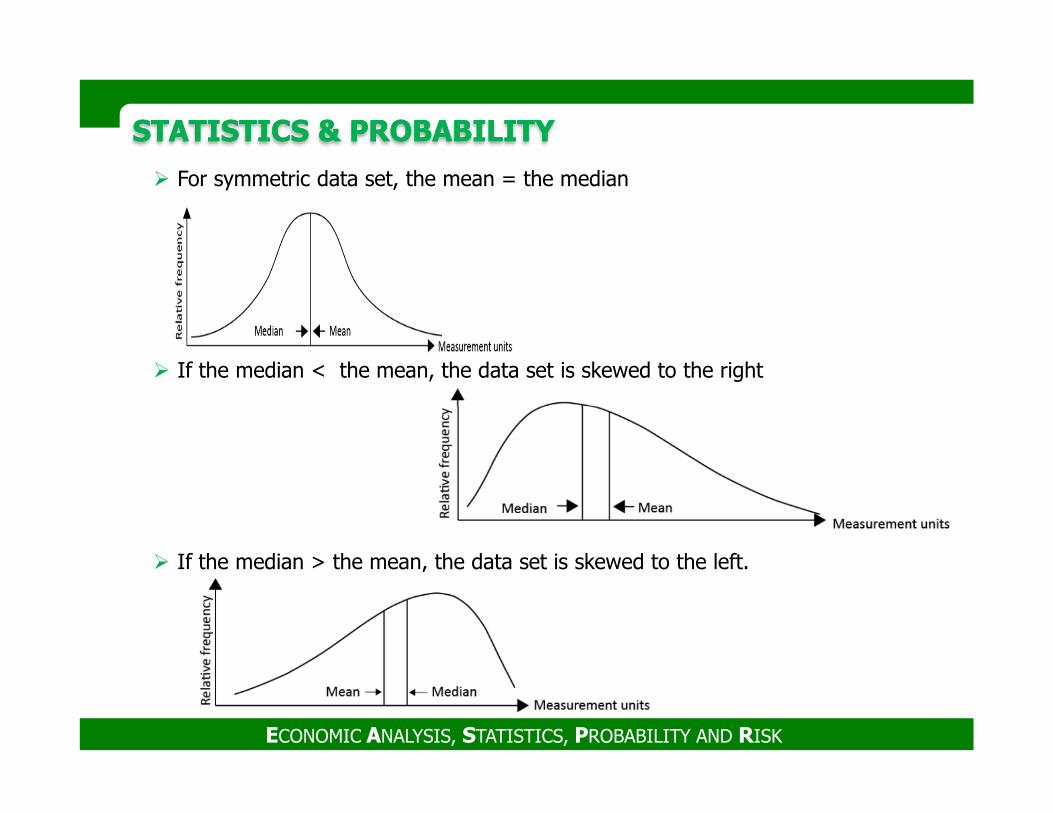
� For symmetric data set, the mean = the median
� If the median < the mean, the data set is skewed to the right
STATISTICS & PROBABILITY STATISTICS & PROBABILITY
� If the median > the mean, the data set is skewed to the left.
ECONOMIC ANALYSIS, STATISTICS, PROBABILITY AND RISK
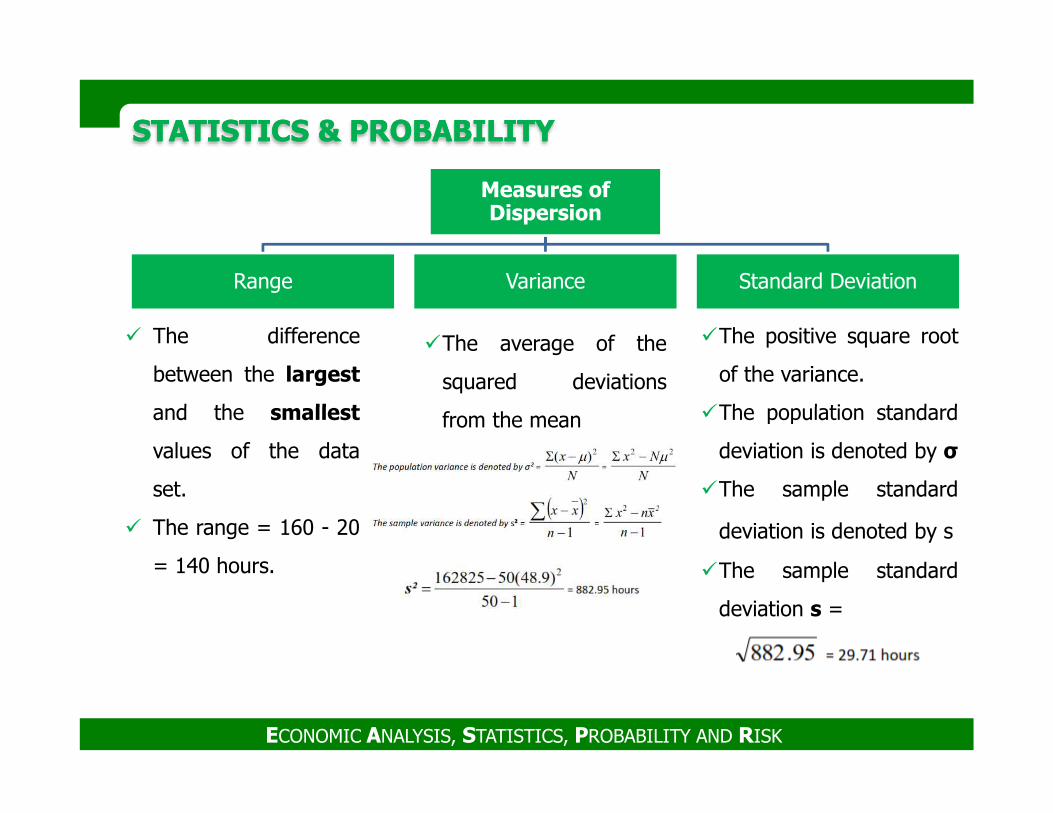
� The difference
between the largest
and the smallest
STATISTICS & PROBABILITY STATISTICS & PROBABILITY
Measures of Dispersion
Range Variance Standard Deviation
�The average of the
squared deviations
from the mean
�The positive square root
of the variance.
�The population standardand the smallest
values of the data
set.
� The range = 160 - 20
= 140 hours.
ECONOMIC ANALYSIS, STATISTICS, PROBABILITY AND RISK
from the mean �The population standard
deviation is denoted by σ
�The sample standard
deviation is denoted by s
�The sample standard
deviation s =
STATISTICS & PROBABILITY STATISTICS & PROBABILITY
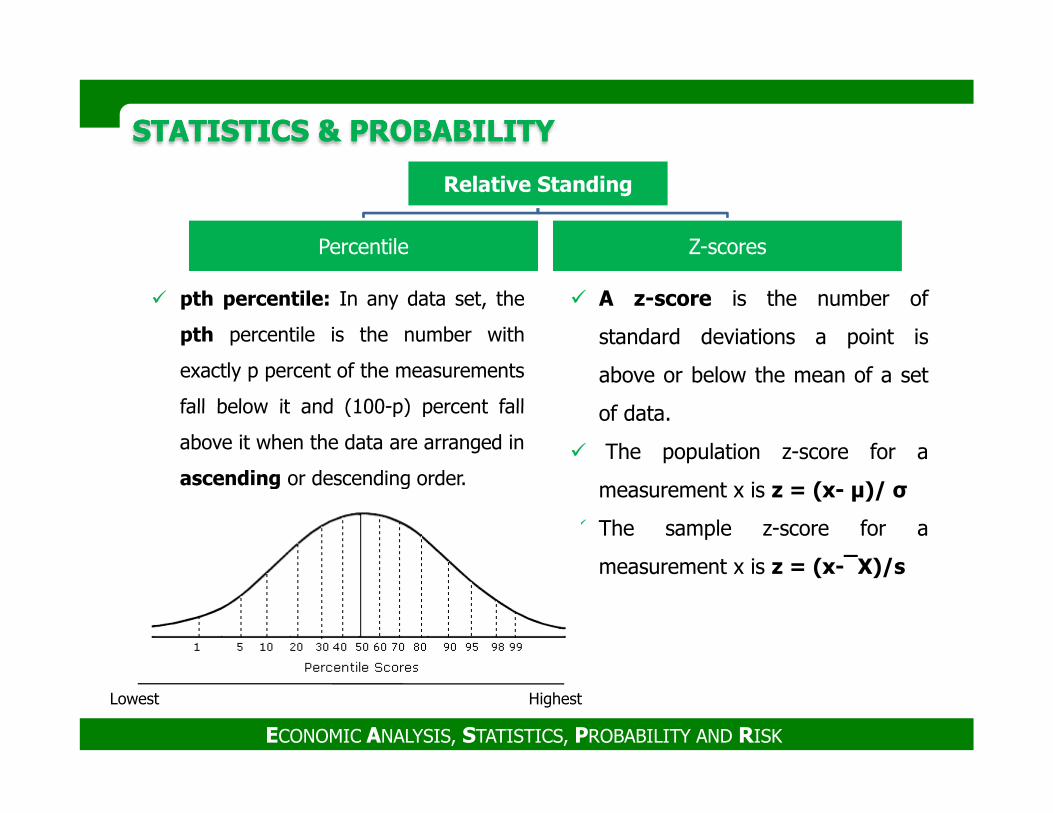
Relative Standing
Percentile Z-scores
� pth percentile: In any data set, the
pth percentile is the number with
exactly p percent of the measurements
fall below it and (100-p) percent fall
� A z-score is the number of
standard deviations a point is
above or below the mean of a set
of data.
ECONOMIC ANALYSIS, STATISTICS, PROBABILITY AND RISK
fall below it and (100-p) percent fall
above it when the data are arranged in
ascending or descending order.
of data.
� The population z-score for a
measurement x is z = (x- µ)/ σ
� The sample z-score for a
measurement x is z = (x-‾X)/s
Lowest Highest
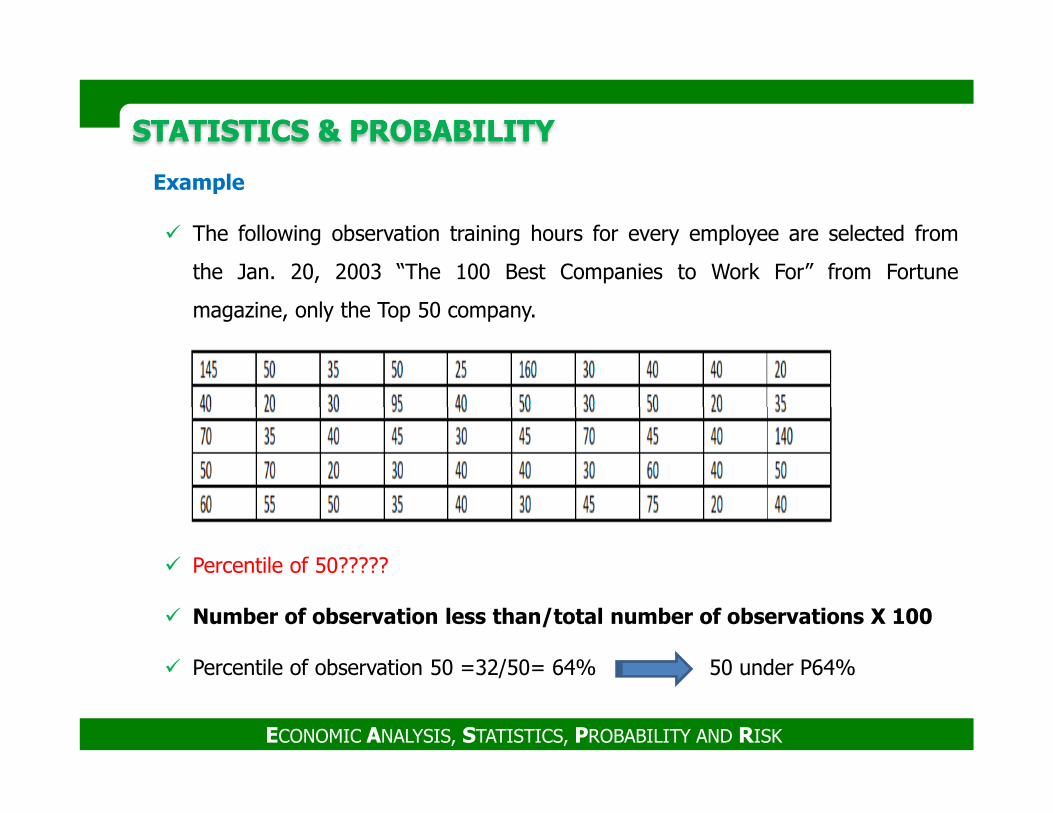
Example
� The following observation training hours for every employee are selected from
the Jan. 20, 2003 “The 100 Best Companies to Work For” from Fortune
magazine, only the Top 50 company.
STATISTICS & PROBABILITY STATISTICS & PROBABILITY
� Percentile of 50?????
� Number of observation less than/total number of observations X 100
� Percentile of observation 50 =32/50= 64% 50 under P64%
ECONOMIC ANALYSIS, STATISTICS, PROBABILITY AND RISK
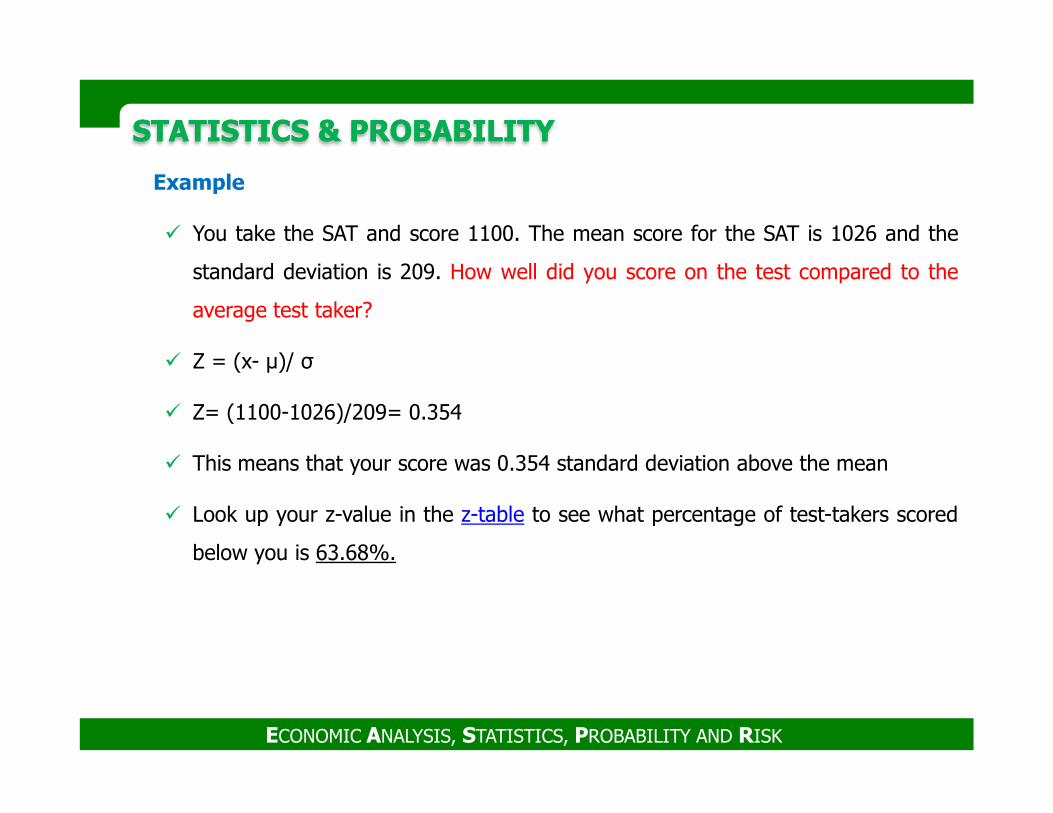
Example
� You take the SAT and score 1100. The mean score for the SAT is 1026 and the
standard deviation is 209. How well did you score on the test compared to the
average test taker?
� Z = (x- µ)/ σ
� Z= (1100-1026)/209= 0.354
STATISTICS & PROBABILITY STATISTICS & PROBABILITY
� Z= (1100-1026)/209= 0.354
� This means that your score was 0.354 standard deviation above the mean
� Look up your z-value in the z-table to see what percentage of test-takers scored
below you is 63.68%.
ECONOMIC ANALYSIS, STATISTICS, PROBABILITY AND RISK
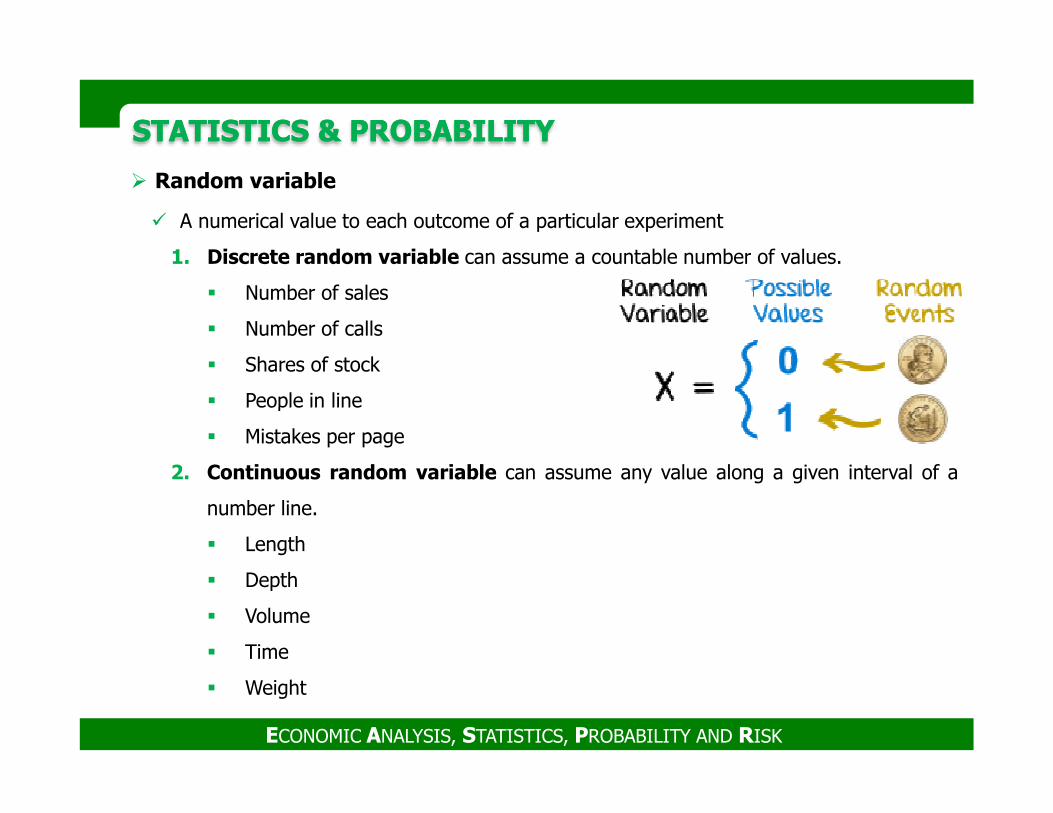
STATISTICS & PROBABILITY STATISTICS & PROBABILITY
� Random variable
� A numerical value to each outcome of a particular experiment
1. Discrete random variable can assume a countable number of values.
� Number of sales
� Number of calls
� Shares of stock
� People in line
ECONOMIC ANALYSIS, STATISTICS, PROBABILITY AND RISK
� People in line
� Mistakes per page
2. Continuous random variable can assume any value along a given interval of a
number line.
� Length
� Depth
� Volume
� Time
� Weight
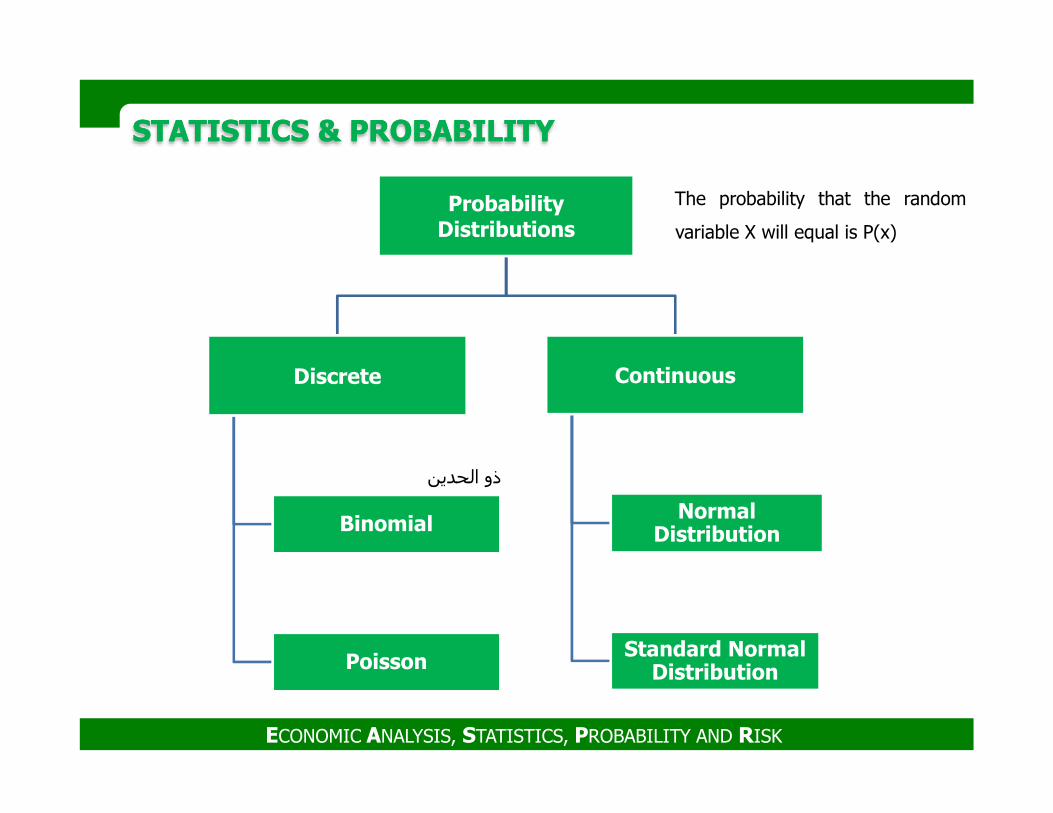
STATISTICS & PROBABILITY STATISTICS & PROBABILITY
Probability Distributions
Discrete Continuous
The probability that the random
variable X will equal is P(x)
ECONOMIC ANALYSIS, STATISTICS, PROBABILITY AND RISK
Binomial
Poisson
Normal Distribution
Standard Normal Distribution
الحدين ذو
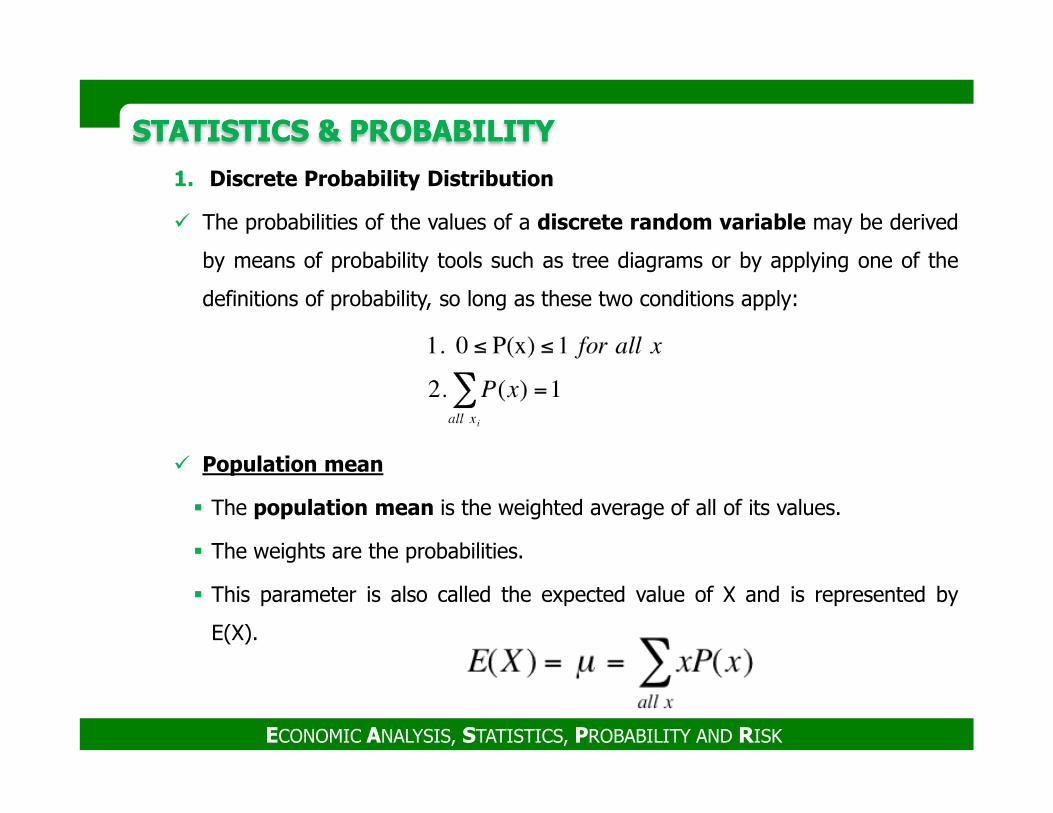
STATISTICS & PROBABILITY STATISTICS & PROBABILITY
1. Discrete Probability Distribution
� The probabilities of the values of a discrete random variable may be derived
by means of probability tools such as tree diagrams or by applying one of the
definitions of probability, so long as these two conditions apply:
ECONOMIC ANALYSIS, STATISTICS, PROBABILITY AND RISK
� Population mean
� The population mean is the weighted average of all of its values.
� The weights are the probabilities.
� This parameter is also called the expected value of X and is represented by
E(X).
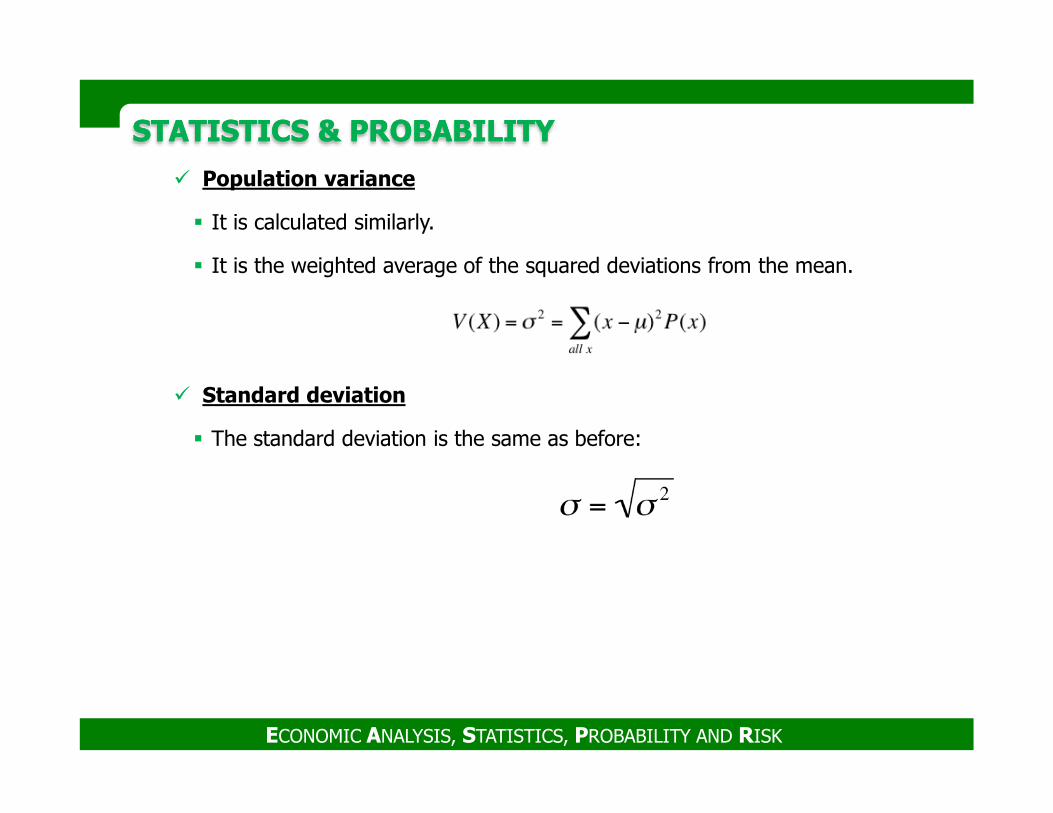
STATISTICS & PROBABILITY STATISTICS & PROBABILITY
� Population variance
� It is calculated similarly.
� It is the weighted average of the squared deviations from the mean.
� Standard deviation
ECONOMIC ANALYSIS, STATISTICS, PROBABILITY AND RISK
� The standard deviation is the same as before:
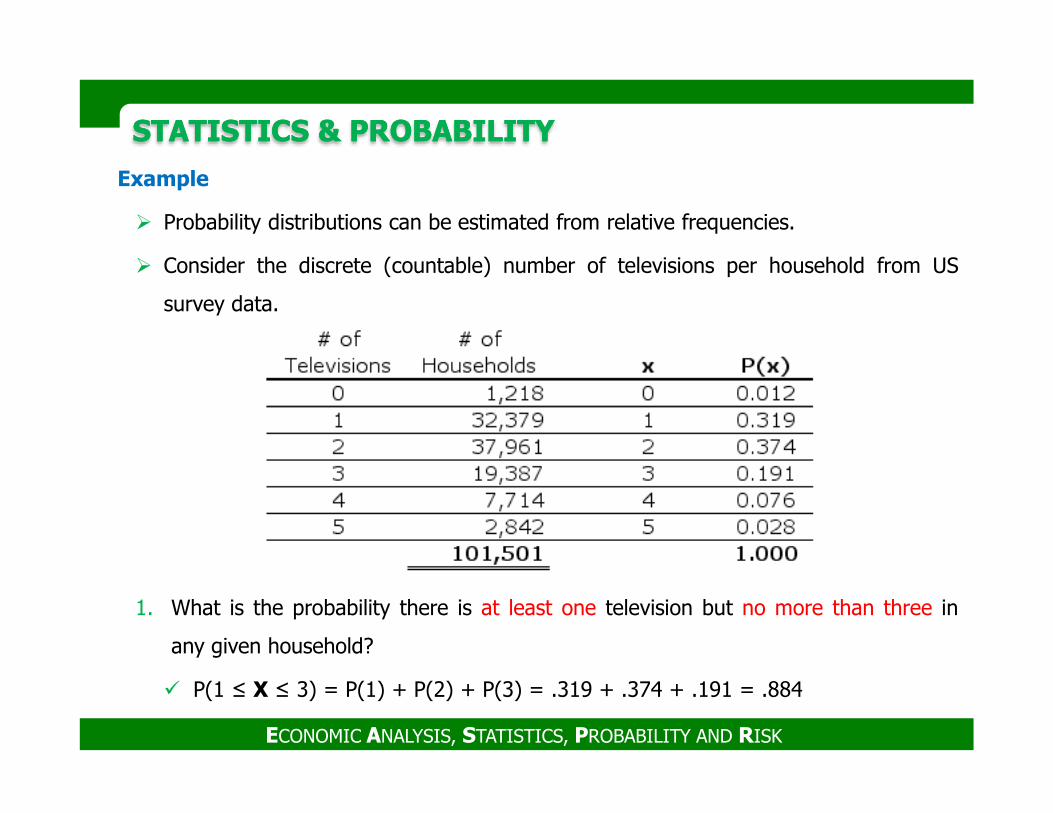
STATISTICS & PROBABILITY STATISTICS & PROBABILITY
Example
� Probability distributions can be estimated from relative frequencies.
� Consider the discrete (countable) number of televisions per household from US
survey data.
ECONOMIC ANALYSIS, STATISTICS, PROBABILITY AND RISK
1. What is the probability there is at least one television but no more than three in
any given household?
� P(1 ≤ X ≤ 3) = P(1) + P(2) + P(3) = .319 + .374 + .191 = .884
STATISTICS & PROBABILITY STATISTICS & PROBABILITY
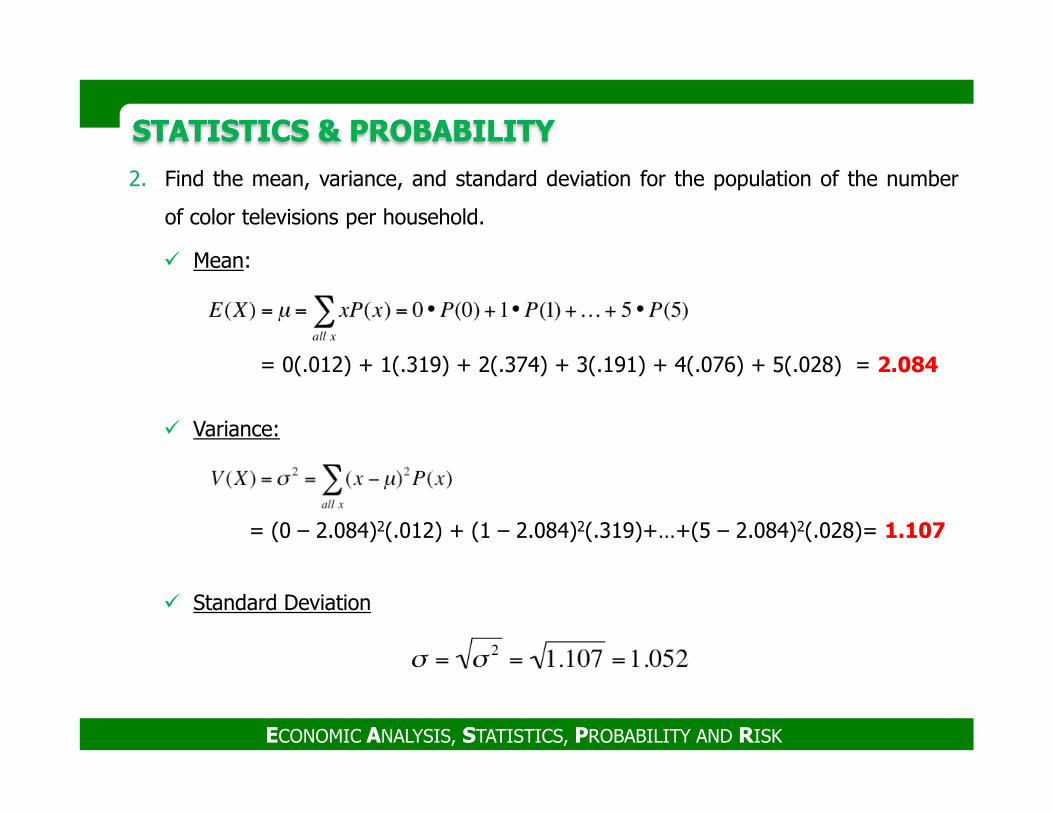
2. Find the mean, variance, and standard deviation for the population of the number
of color televisions per household.
� Mean:
= 0(.012) + 1(.319) + 2(.374) + 3(.191) + 4(.076) + 5(.028) = 2.084
ECONOMIC ANALYSIS, STATISTICS, PROBABILITY AND RISK
� Variance:
� Standard Deviation
= (0 – 2.084)2(.012) + (1 – 2.084)2(.319)+…+(5 – 2.084)2(.028)= 1.107
STATISTICS & PROBABILITY STATISTICS & PROBABILITY
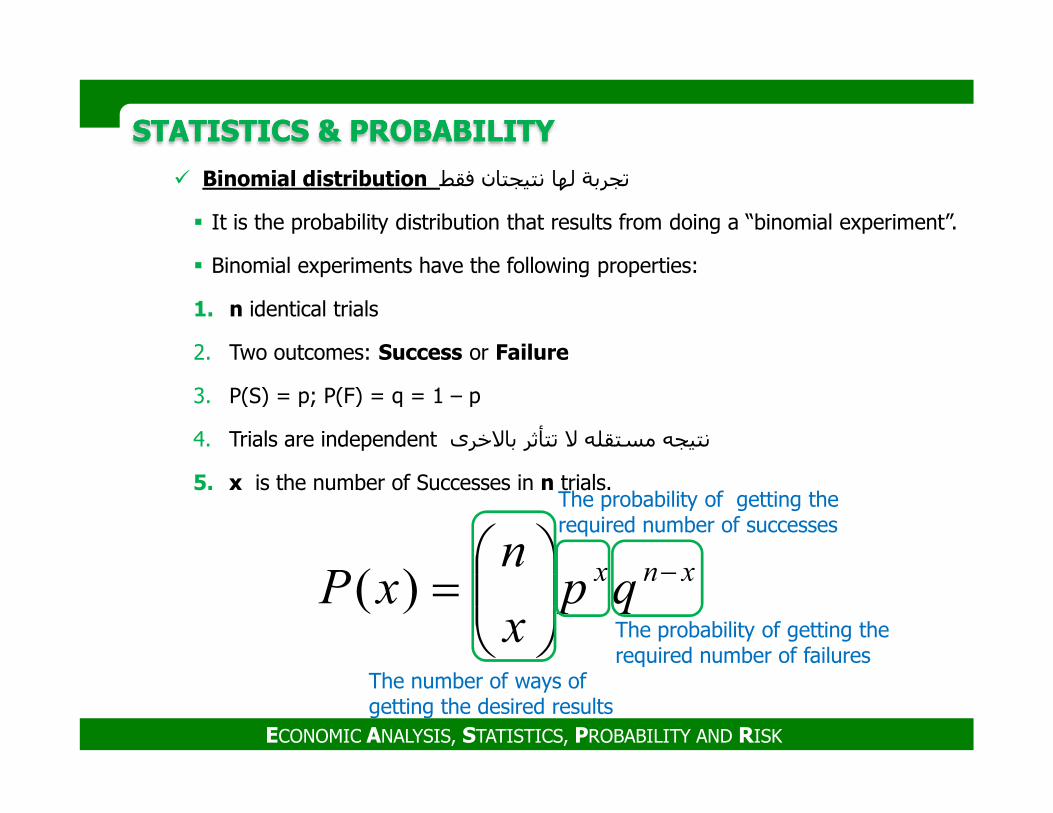
� Binomial distribution تجربة لھا نتيجتان فقط
� It is the probability distribution that results from doing a “binomial experiment”.
� Binomial experiments have the following properties:
1. n identical trials
2. Two outcomes: Success or Failure
3. P(S) = p; P(F) = q = 1 – p
ECONOMIC ANALYSIS, STATISTICS, PROBABILITY AND RISK
3. P(S) = p; P(F) = q = 1 – p
4. Trials are independent باwخرى تتأثر w مستقله نتيجه
5. x is the number of Successes in n trials.
xnxqp
x
nxP
−
=)(
The number of ways of getting the desired results
The probability of getting the required number of successes
The probability of getting the required number of failures
STATISTICS & PROBABILITY STATISTICS & PROBABILITY
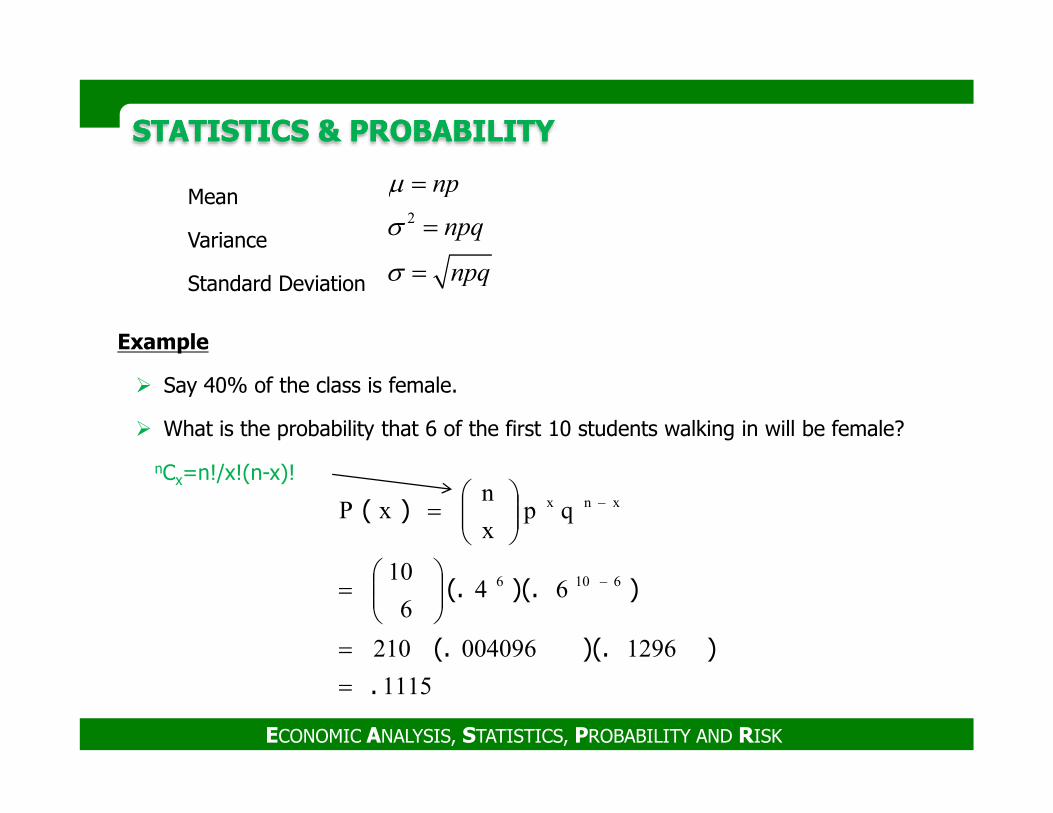
Example
� Say 40% of the class is female.
Mean
Variance
Standard Deviation
2
np
npq
npq
µ
σ
σ
=
=
=
ECONOMIC ANALYSIS, STATISTICS, PROBABILITY AND RISK
� What is the probability that 6 of the first 10 students walking in will be female?
1115
1296004096210
646
10
qpx
nxP
6106
xnx
.
))(.(.
))(.(.
)(
=
=
=
=
−
−
nCx=n!/x!(n-x)!
STATISTICS & PROBABILITY STATISTICS & PROBABILITY
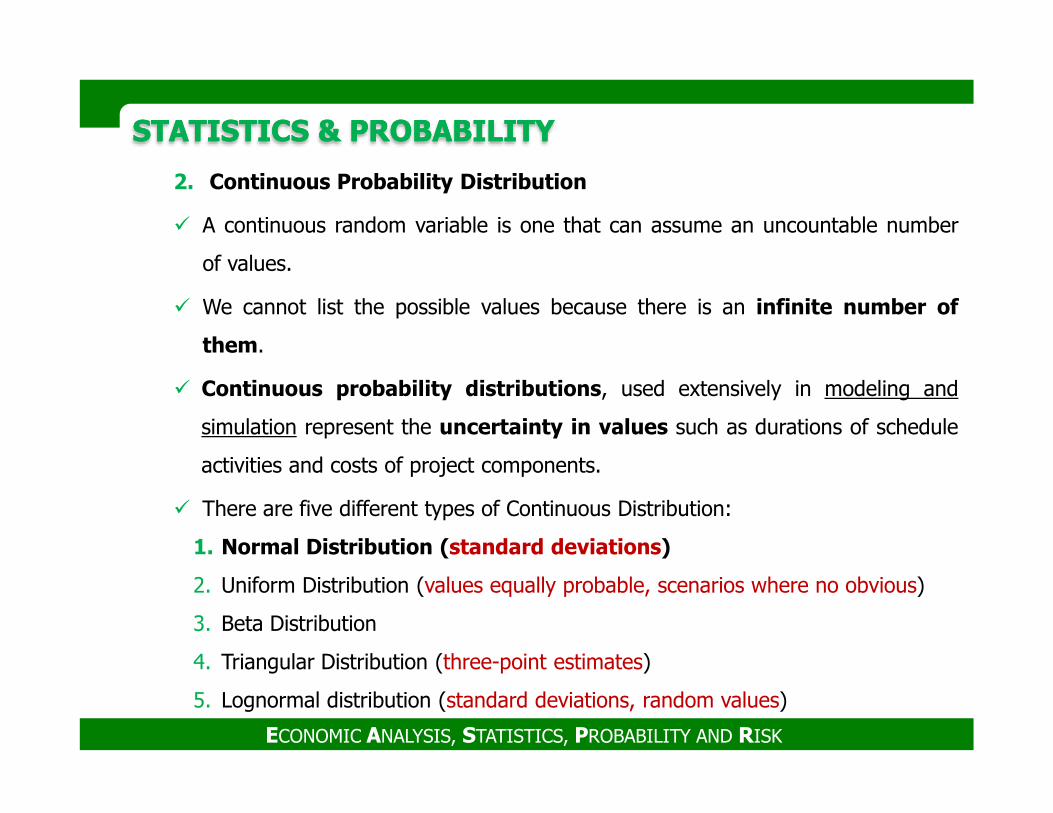
2. Continuous Probability Distribution
� A continuous random variable is one that can assume an uncountable number
of values.
� We cannot list the possible values because there is an infinite number of
them.
� Continuous probability distributions, used extensively in modeling and
ECONOMIC ANALYSIS, STATISTICS, PROBABILITY AND RISK
simulation represent the uncertainty in values such as durations of schedule
activities and costs of project components.
� There are five different types of Continuous Distribution:
1. Normal Distribution (standard deviations)
2. Uniform Distribution (values equally probable, scenarios where no obvious)
3. Beta Distribution
4. Triangular Distribution (three-point estimates)
5. Lognormal distribution (standard deviations, random values)
STATISTICS & PROBABILITY STATISTICS & PROBABILITY
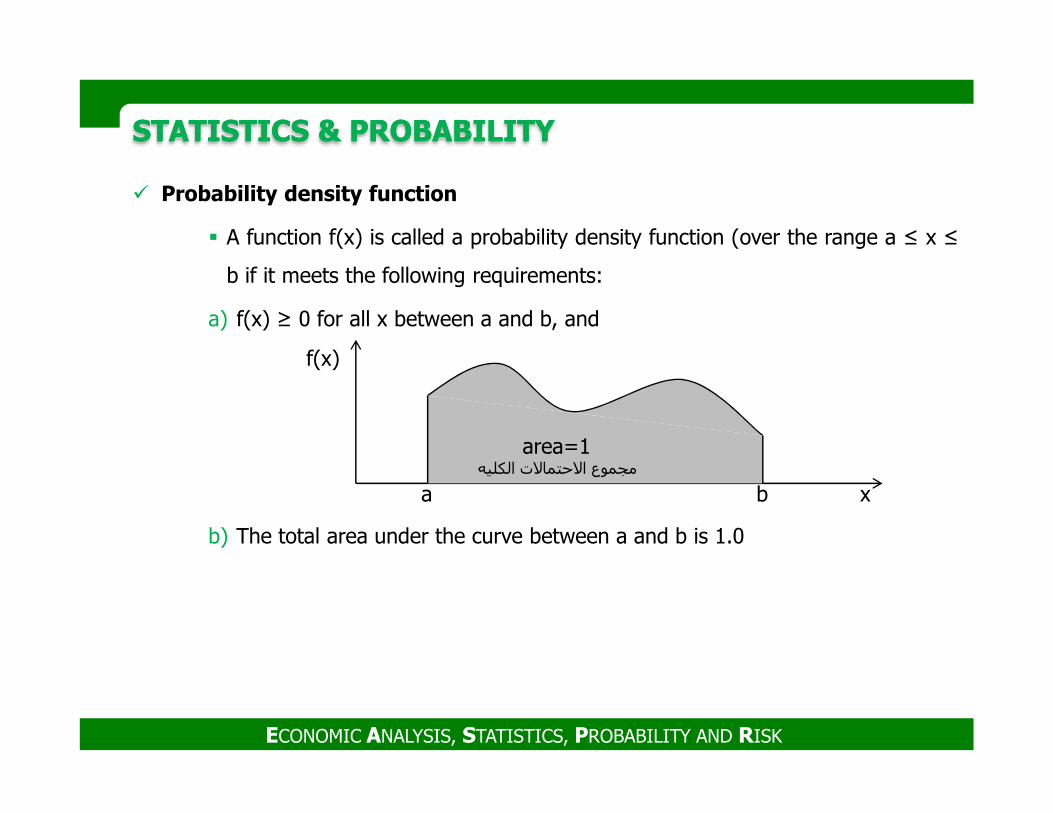
� Probability density function
� A function f(x) is called a probability density function (over the range a ≤ x ≤
b if it meets the following requirements:
a) f(x) ≥ 0 for all x between a and b, and
f(x)
ECONOMIC ANALYSIS, STATISTICS, PROBABILITY AND RISK
b) The total area under the curve between a and b is 1.0
xba
area=1مجموع اwحتماwت الكليه
STATISTICS & PROBABILITY STATISTICS & PROBABILITY
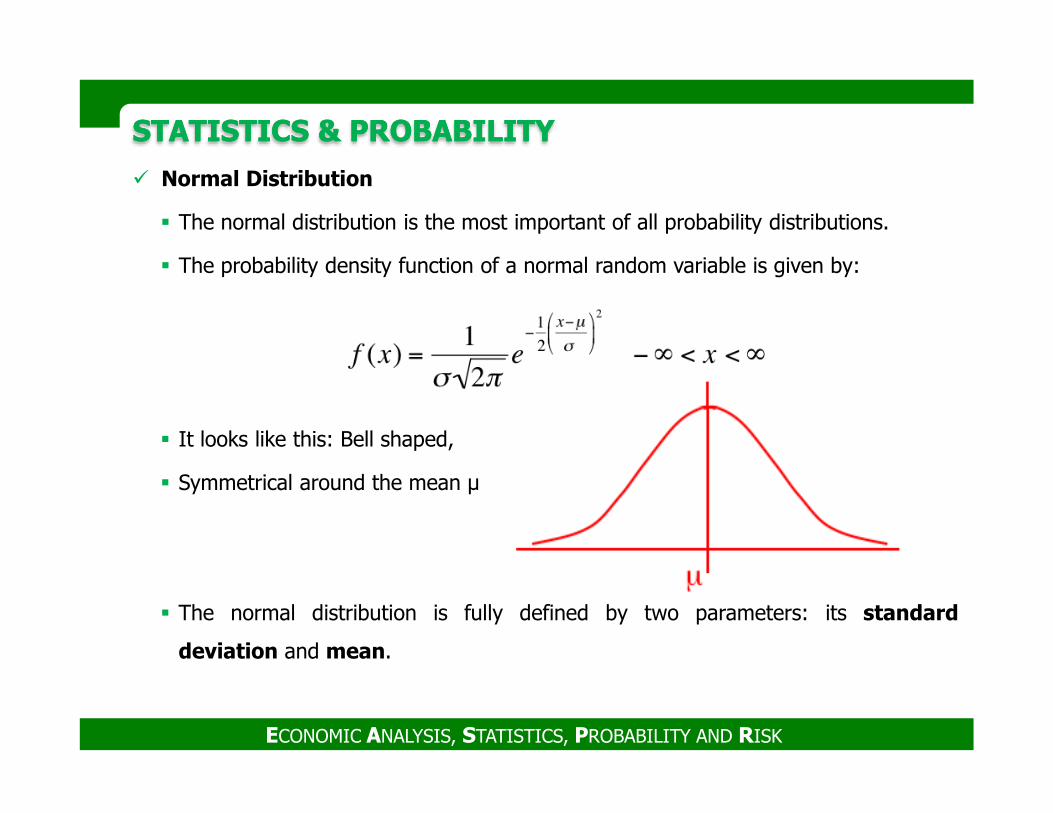
� Normal Distribution
� The normal distribution is the most important of all probability distributions.
� The probability density function of a normal random variable is given by:
ECONOMIC ANALYSIS, STATISTICS, PROBABILITY AND RISK
� It looks like this: Bell shaped,
� Symmetrical around the mean µ
� The normal distribution is fully defined by two parameters: its standard
deviation and mean.
STATISTICS & PROBABILITY STATISTICS & PROBABILITY
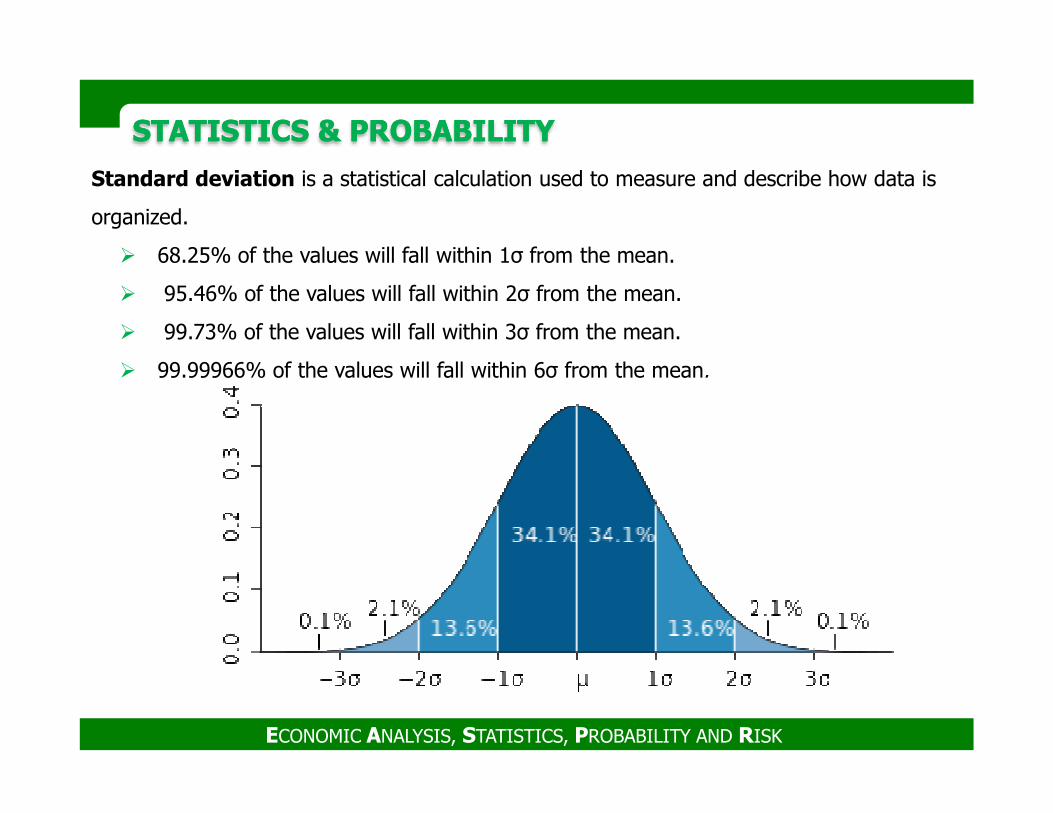
Standard deviation is a statistical calculation used to measure and describe how data is
organized.
� 68.25% of the values will fall within 1σ from the mean.
� 95.46% of the values will fall within 2σ from the mean.
� 99.73% of the values will fall within 3σ from the mean.
� 99.99966% of the values will fall within 6σ from the mean.
ECONOMIC ANALYSIS, STATISTICS, PROBABILITY AND RISK
STATISTICS & PROBABILITY STATISTICS & PROBABILITY
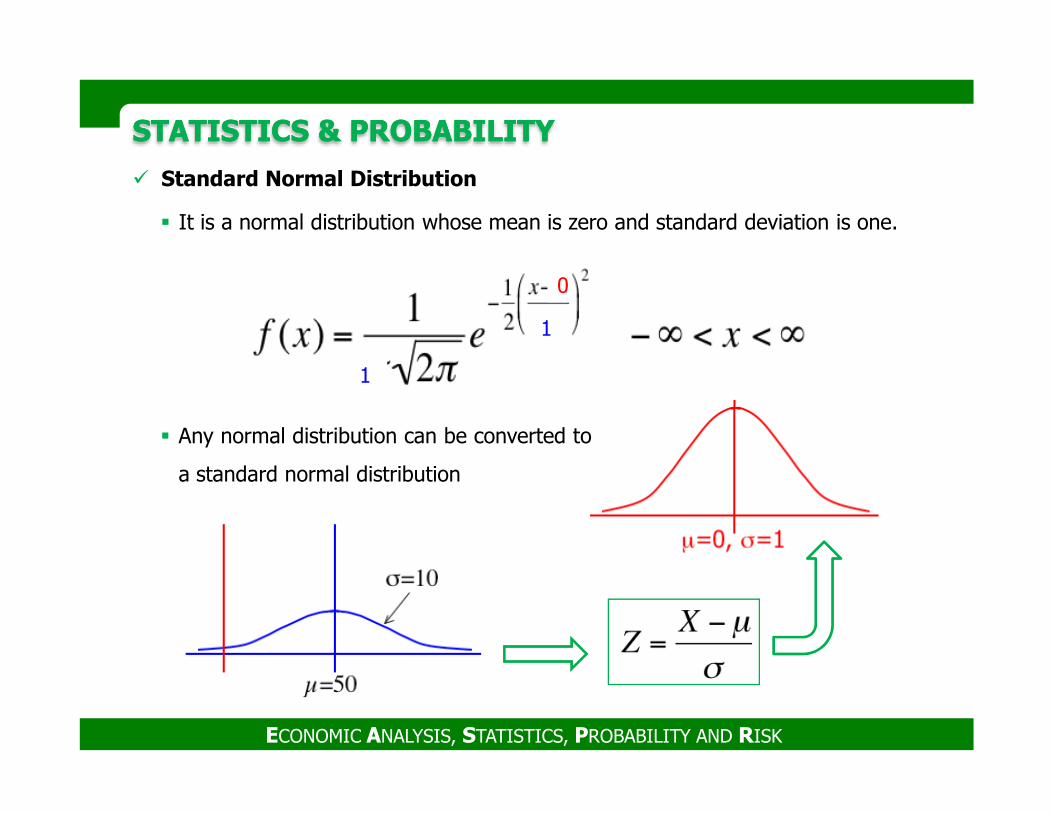
� Standard Normal Distribution
� It is a normal distribution whose mean is zero and standard deviation is one.
0
1
1
ECONOMIC ANALYSIS, STATISTICS, PROBABILITY AND RISK
� Any normal distribution can be converted to
a standard normal distribution
STATISTICS & PROBABILITY STATISTICS & PROBABILITY
Example
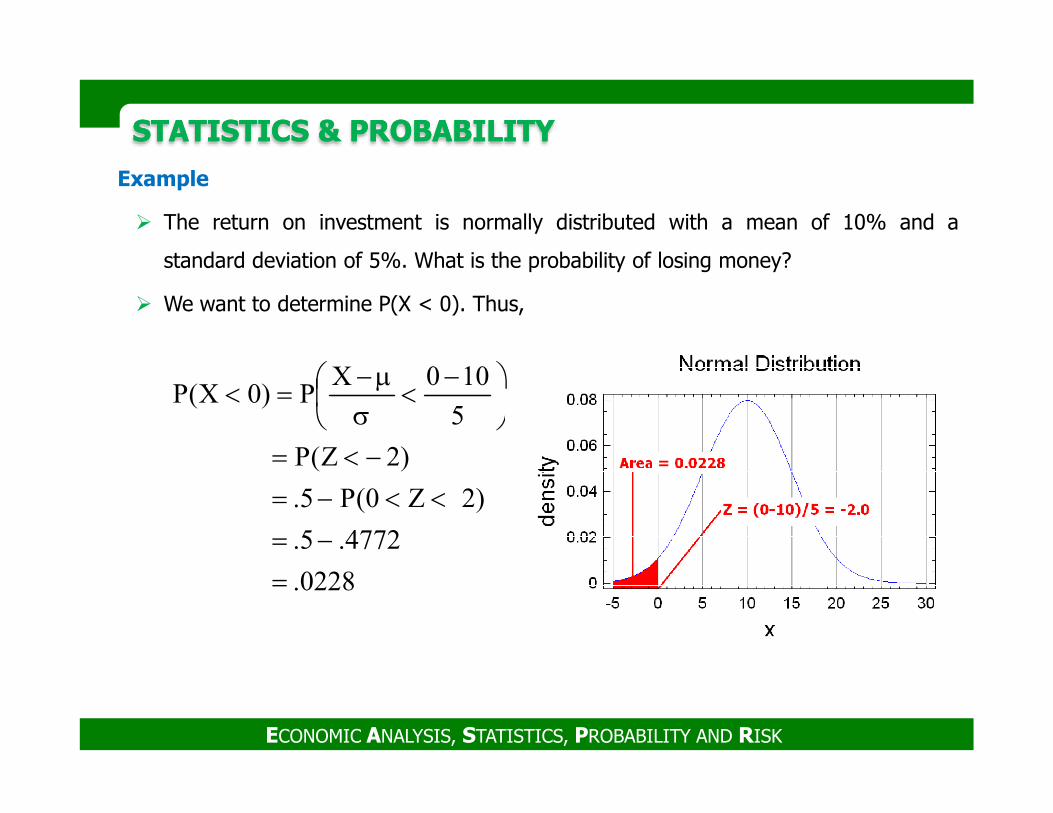
� The return on investment is normally distributed with a mean of 10% and a
standard deviation of 5%. What is the probability of losing money?
� We want to determine P(X < 0). Thus,
5
100XP)0X(P
−<
σµ−
=<
ECONOMIC ANALYSIS, STATISTICS, PROBABILITY AND RISK
0228.
4772.5.
)2Z0(P5.
)2Z(P
5P)0X(P
=
−=
<<−=
−<=
<σ
=<
Regression Analysis
� Regression analysis is a statistical process for estimating the relationships among
STATISTICS & PROBABILITY STATISTICS & PROBABILITY
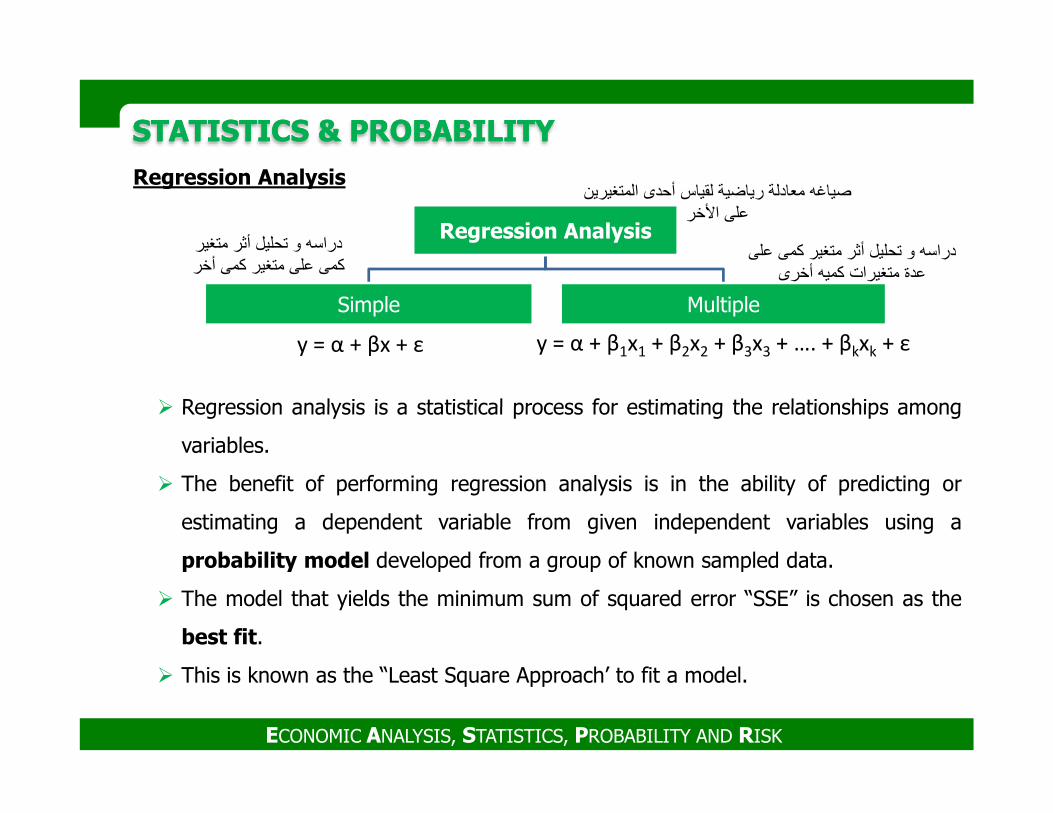
Regression Analysis
Simple Multiple
دراسه و تحليل أثر متغير كمى على متغير كمى أخر
صياغه معادلة رياضية لقياس أحدى المتغيرين على ا خر
دراسه و تحليل أثر متغير كمى على عدة متغيرات كميه أخرى
y = α + β1x1 + β2x2 + β3x3 + …. + βkxk + εy = α + βx + ε
� Regression analysis is a statistical process for estimating the relationships among
variables.
� The benefit of performing regression analysis is in the ability of predicting or
estimating a dependent variable from given independent variables using a
probability model developed from a group of known sampled data.
� The model that yields the minimum sum of squared error “SSE” is chosen as the
best fit.
� This is known as the “Least Square Approach’ to fit a model.
ECONOMIC ANALYSIS, STATISTICS, PROBABILITY AND RISK
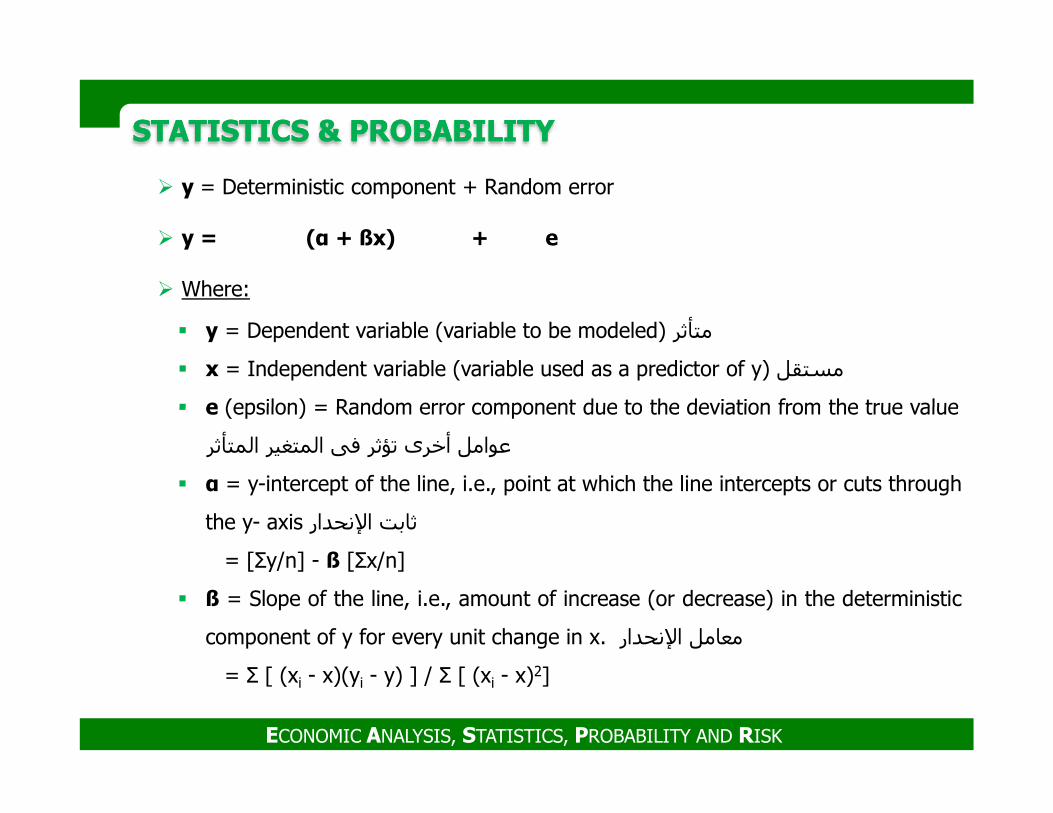
� y = Deterministic component + Random error
� y = (α + ßx) + e
� Where:
� y = Dependent variable (variable to be modeled) متأثر
� x = Independent variable (variable used as a predictor of y) مستقل
� e (epsilon) = Random error component due to the deviation from the true value
STATISTICS & PROBABILITY STATISTICS & PROBABILITY
� e (epsilon) = Random error component due to the deviation from the true value
المتأثر المتغير فى تؤثر أخرى عوامل
� α = y-intercept of the line, i.e., point at which the line intercepts or cuts through
the y- axis ا�نحدار ثابت
= [Σy/n] - ß [Σx/n]
� ß = Slope of the line, i.e., amount of increase (or decrease) in the deterministic
component of y for every unit change in x. ا�نحدار معامل
= Σ [ (xi - x)(yi - y) ] / Σ [ (xi - x)2]
ECONOMIC ANALYSIS, STATISTICS, PROBABILITY AND RISK
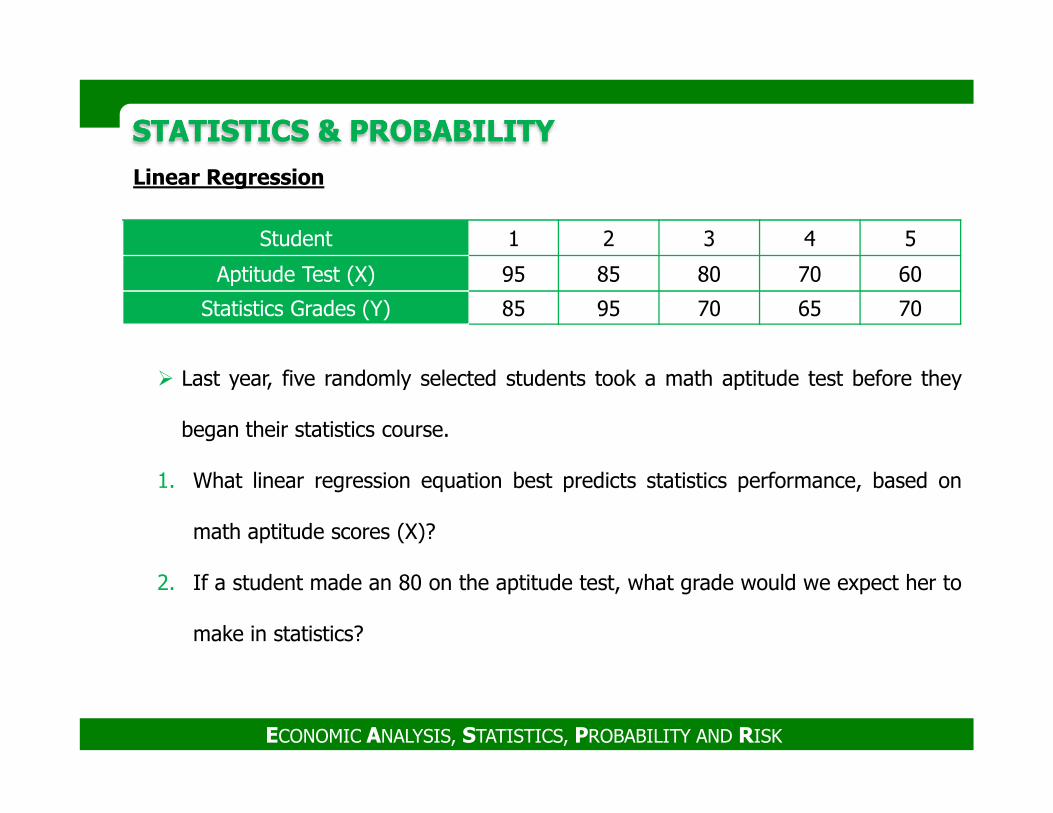
Linear Regression
� Last year, five randomly selected students took a math aptitude test before they
STATISTICS & PROBABILITY STATISTICS & PROBABILITY
Student 1 2 3 4 5
Aptitude Test (X) 95 85 80 70 60
Statistics Grades (Y) 85 95 70 65 70
began their statistics course.
1. What linear regression equation best predicts statistics performance, based on
math aptitude scores (X)?
2. If a student made an 80 on the aptitude test, what grade would we expect her to
make in statistics?
ECONOMIC ANALYSIS, STATISTICS, PROBABILITY AND RISK
STATISTICS & PROBABILITY STATISTICS & PROBABILITY
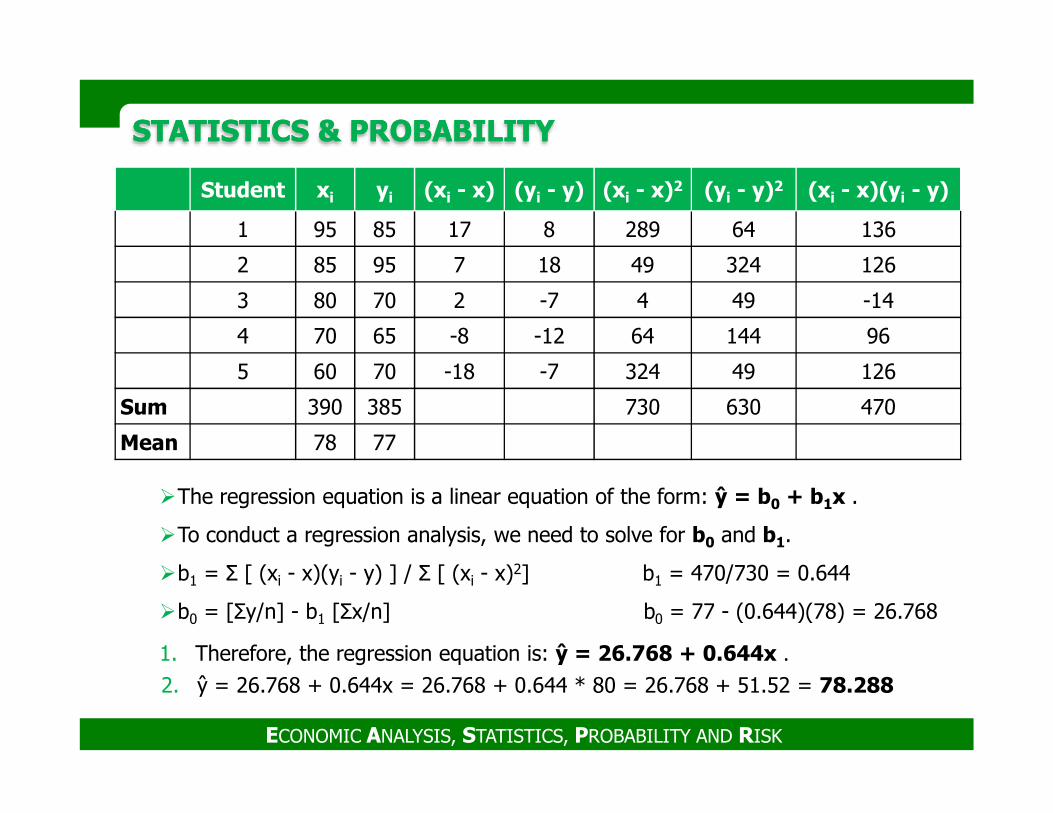
Student xi yi (xi - x) (yi - y) (xi - x)2 (yi - y)2 (xi - x)(yi - y)
1 95 85 17 8 289 64 136
2 85 95 7 18 49 324 126
3 80 70 2 -7 4 49 -14
4 70 65 -8 -12 64 144 96
5 60 70 -18 -7 324 49 126
Sum 390 385 730 630 470
�The regression equation is a linear equation of the form: ŷ = b0 + b1x .
�To conduct a regression analysis, we need to solve for b0 and b1.
�b1 = Σ [ (xi - x)(yi - y) ] / Σ [ (xi - x)2] b1 = 470/730 = 0.644
�b0 = [Σy/n] - b1 [Σx/n] b0 = 77 - (0.644)(78) = 26.768
1. Therefore, the regression equation is: ŷ = 26.768 + 0.644x .
2. ŷ = 26.768 + 0.644x = 26.768 + 0.644 * 80 = 26.768 + 51.52 = 78.288
ECONOMIC ANALYSIS, STATISTICS, PROBABILITY AND RISK
Sum 390 385 730 630 470
Mean 78 77
Correlation (r)
STATISTICS & PROBABILITY STATISTICS & PROBABILITY
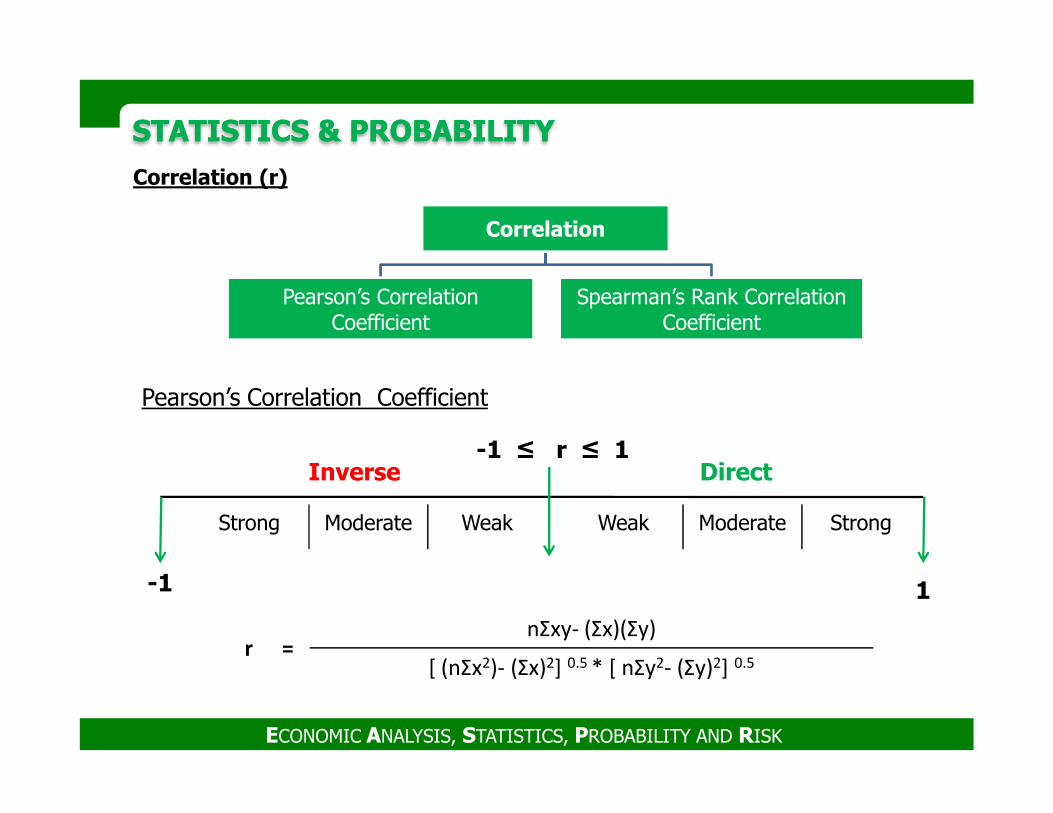
Correlation
Pearson’s Correlation Coefficient
Spearman’s Rank Correlation Coefficient
Pearson’s Correlation Coefficient
ECONOMIC ANALYSIS, STATISTICS, PROBABILITY AND RISK
Strong Moderate Weak Weak Moderate Strong
-1 ≤ r ≤ 1
-1 1
DirectInverse
Pearson’s Correlation Coefficient
r =
nΣxy- (Σx)(Σy)
[ (nΣx2)- (Σx)2] 0.5 * [ nΣy2- (Σy)2] 0.5
OPTIMIZATION OPTIMIZATION
� Optimization is the process of determining the BEST performance for a system.
� Models are simplified representations of reality by simple or complex systems
used to optimize the performance of the real system.
� There are numerous techniques for optimization such as;
1. Linear Programming
ECONOMIC ANALYSIS, STATISTICS, PROBABILITY AND RISK
2. Monte Carlo Simulation
3. Sensitivity Analysis
OPTIMIZATION OPTIMIZATION
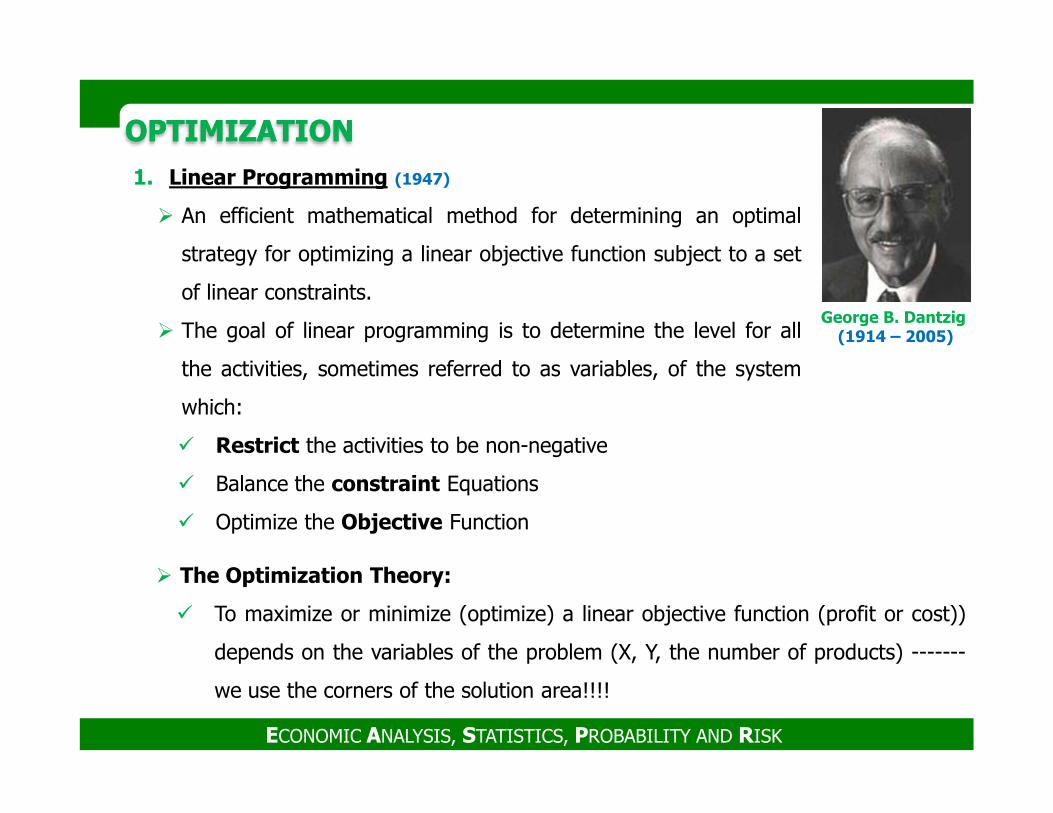
1. Linear Programming (1947)
� An efficient mathematical method for determining an optimal
strategy for optimizing a linear objective function subject to a set
of linear constraints.
� The goal of linear programming is to determine the level for all
the activities, sometimes referred to as variables, of the system
which:
George B. Dantzig(1914 – 2005)
ECONOMIC ANALYSIS, STATISTICS, PROBABILITY AND RISK
which:
� Restrict the activities to be non-negative
� Balance the constraint Equations
� Optimize the Objective Function
� The Optimization Theory:
� To maximize or minimize (optimize) a linear objective function (profit or cost))
depends on the variables of the problem (X, Y, the number of products) -------
we use the corners of the solution area!!!!
OPTIMIZATION OPTIMIZATION
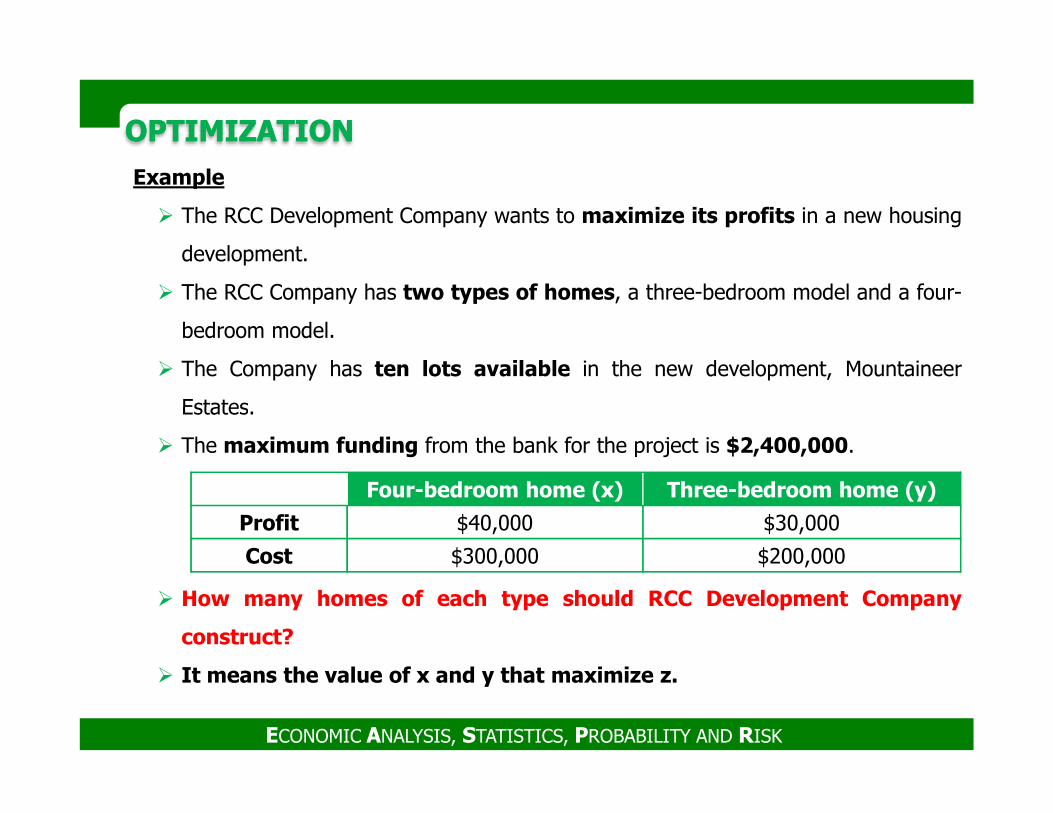
Example
� The RCC Development Company wants to maximize its profits in a new housing
development.
� The RCC Company has two types of homes, a three-bedroom model and a four-
bedroom model.
� The Company has ten lots available in the new development, Mountaineer
Estates.
ECONOMIC ANALYSIS, STATISTICS, PROBABILITY AND RISK
Estates.
� The maximum funding from the bank for the project is $2,400,000.
� How many homes of each type should RCC Development Company
construct?
� It means the value of x and y that maximize z.
Four-bedroom home (x) Three-bedroom home (y)
Profit $40,000 $30,000
Cost $300,000 $200,000
OPTIMIZATION OPTIMIZATION
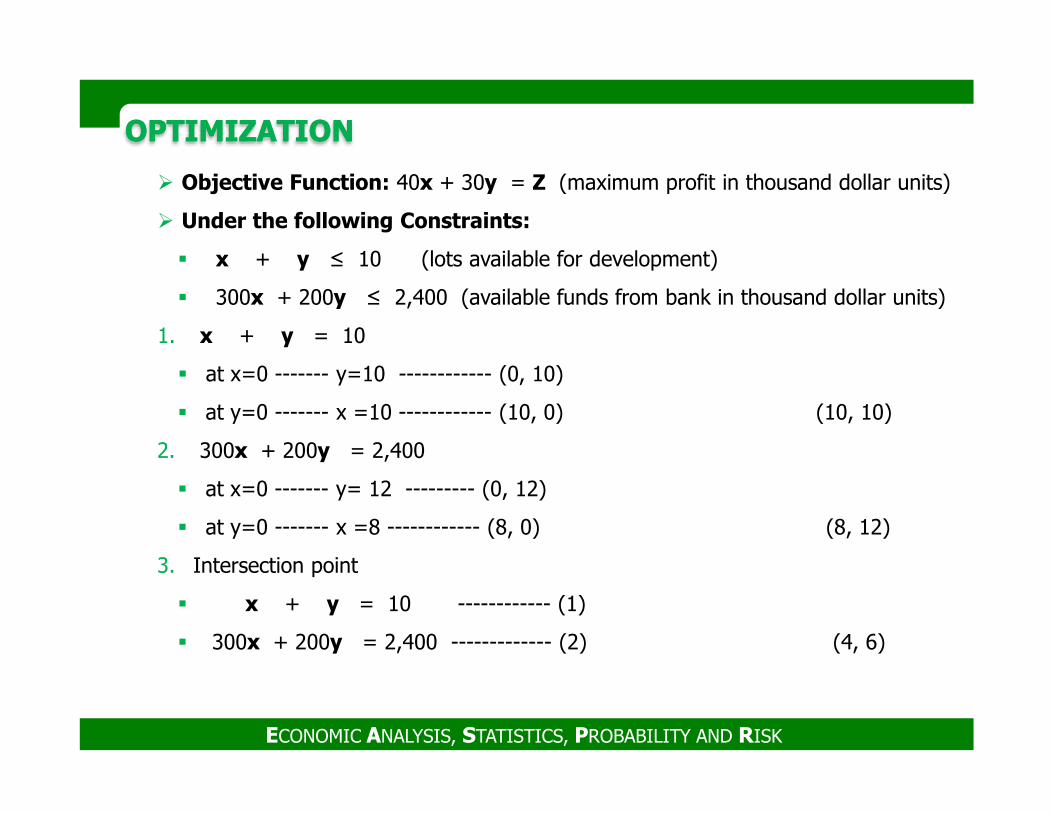
� Objective Function: 40x + 30y = Z (maximum profit in thousand dollar units)
� Under the following Constraints:
� x + y ≤ 10 (lots available for development)
� 300x + 200y ≤ 2,400 (available funds from bank in thousand dollar units)
1. x + y = 10
� at x=0 ------- y=10 ------------ (0, 10)
� at y=0 ------- x =10 ------------ (10, 0) (10, 10)
ECONOMIC ANALYSIS, STATISTICS, PROBABILITY AND RISK
� at y=0 ------- x =10 ------------ (10, 0) (10, 10)
2. 300x + 200y = 2,400
� at x=0 ------- y= 12 --------- (0, 12)
� at y=0 ------- x =8 ------------ (8, 0) (8, 12)
3. Intersection point
� x + y = 10 ------------ (1)
� 300x + 200y = 2,400 ------------- (2) (4, 6)
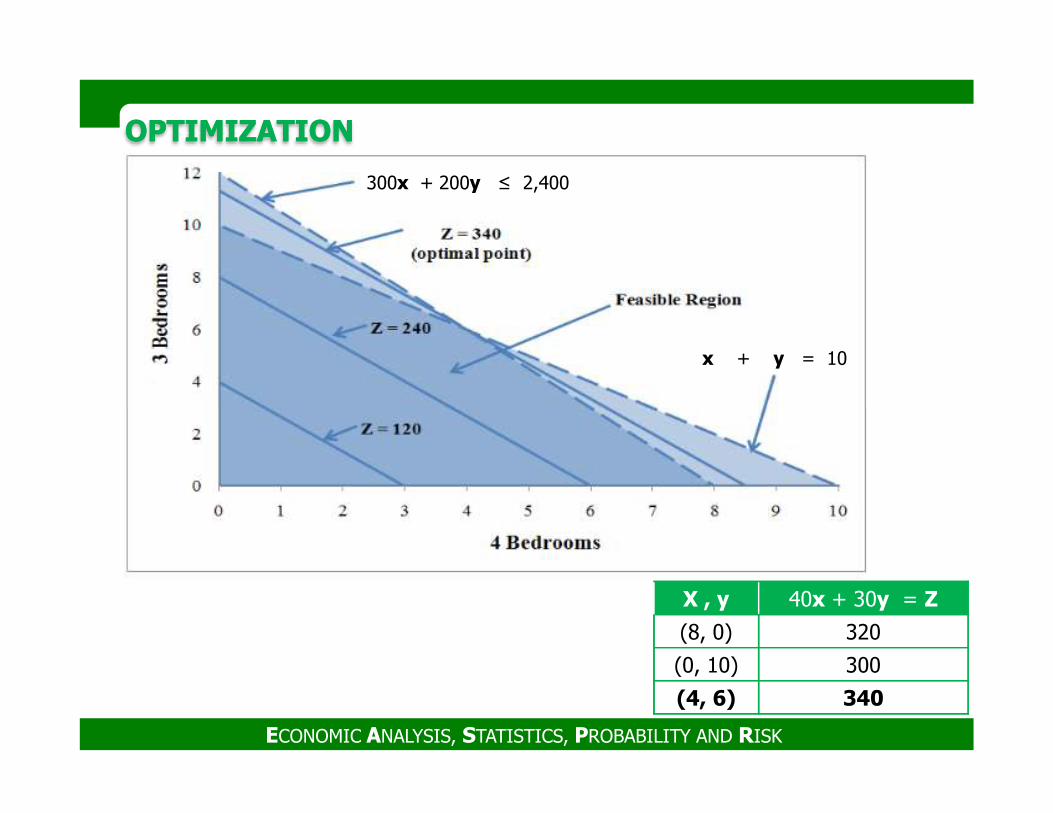
OPTIMIZATION OPTIMIZATION
300x + 200y ≤ 2,400
x + y = 10
ECONOMIC ANALYSIS, STATISTICS, PROBABILITY AND RISK
X , y 40x + 30y = Z
(8, 0) 320
(0, 10) 300
(4, 6) 340
OPTIMIZATION OPTIMIZATION
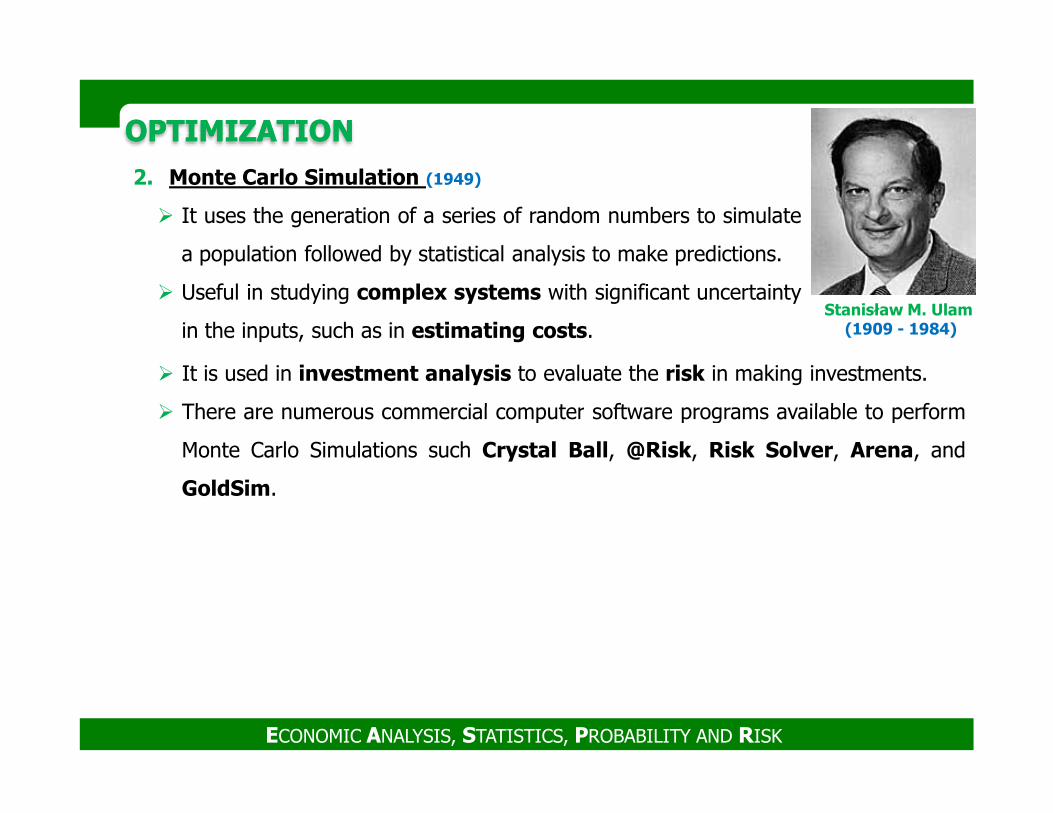
2. Monte Carlo Simulation (1949)
� It uses the generation of a series of random numbers to simulate
a population followed by statistical analysis to make predictions.
� Useful in studying complex systems with significant uncertainty
in the inputs, such as in estimating costs.
� It is used in investment analysis to evaluate the risk in making investments.
� There are numerous commercial computer software programs available to perform
Stanisław M. Ulam(1909 - 1984)
ECONOMIC ANALYSIS, STATISTICS, PROBABILITY AND RISK
� There are numerous commercial computer software programs available to perform
Monte Carlo Simulations such Crystal Ball, @Risk, Risk Solver, Arena, and
GoldSim.
OPTIMIZATION OPTIMIZATION
3. Sensitivity Analysis
� A technique used to quantify the variation in the solution with respect to the
variables and the constants used in the formulation of the problem.
� Sensitivity analysis is done to investigate the impact of changes in variables and
assumptions made for constants used upon the solution obtained, often referred
to as the base case.
� The purpose is to determine which variables and constants have the most
ECONOMIC ANALYSIS, STATISTICS, PROBABILITY AND RISK
� The purpose is to determine which variables and constants have the most
influence upon the solution.
RISK MANAGEMENT FUNDAMENTALSRISK MANAGEMENT FUNDAMENTALS
Risk
� AACE Recommended Practice 10S-90
1. The possibility of suffering harm or loss (American Heritage Dictionary,
Houghton Mifflin Co.)
2. Uncertainty of an event which if occurred would result in a negative
or positive effect on the project (Project Management Institute).
� AACE Recommended Practice 10S-90, Cost Engineering Terminology, 2009
ECONOMIC ANALYSIS, STATISTICS, PROBABILITY AND RISK
� AACE Recommended Practice 10S-90, Cost Engineering Terminology, 2009
1. An ambiguous term that can mean any of the following:
� All uncertainty (threats + opportunities)
� Undesirable outcomes (uncertainty = risks + opportunities)
� The net impact or effect of uncertainty (threats – opportunities).
2. Probability of an undesirable outcome.
3. In total cost management, an uncertain event or condition that could
affect a project objective or business goal.
RISK MANAGEMENT FUNDAMENTALSRISK MANAGEMENT FUNDAMENTALS
Risk Management (TCM 7.6.1 Description)
�Risk management is the process of identifying risk factors (risk assessment),
analyzing and quantifying the properties of those factors (risk analysis), treating
the impact of the factors on planned asset or project performance and developing a
risk management plan (risk treatment), and implementing the risk management
plan (risk control).
�The goal of risk management is to increase the probability that a planned asset or
ECONOMIC ANALYSIS, STATISTICS, PROBABILITY AND RISK
�The goal of risk management is to increase the probability that a planned asset or
project outcome will occur without decreasing the value of the asset or project.
�Risk management presumes that deviations from plans may result in unintended
results (positive or negative) that should be identified and managed.
RISK MANAGEMENT FUNDAMENTALSRISK MANAGEMENT FUNDAMENTALS
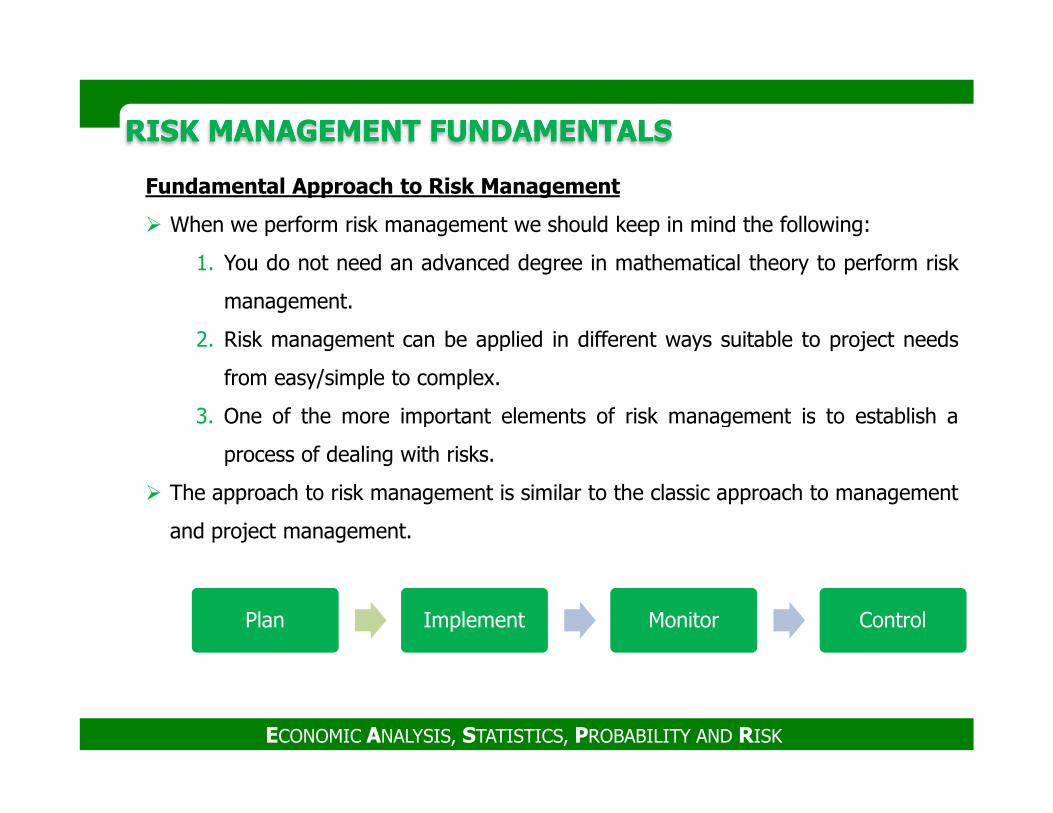
Fundamental Approach to Risk Management
� When we perform risk management we should keep in mind the following:
1. You do not need an advanced degree in mathematical theory to perform risk
management.
2. Risk management can be applied in different ways suitable to project needs
from easy/simple to complex.
3. One of the more important elements of risk management is to establish a
ECONOMIC ANALYSIS, STATISTICS, PROBABILITY AND RISK
3. One of the more important elements of risk management is to establish a
process of dealing with risks.
� The approach to risk management is similar to the classic approach to management
and project management.
Plan Implement Monitor Control
RISK MANAGEMENT FUNDAMENTALSRISK MANAGEMENT FUNDAMENTALS
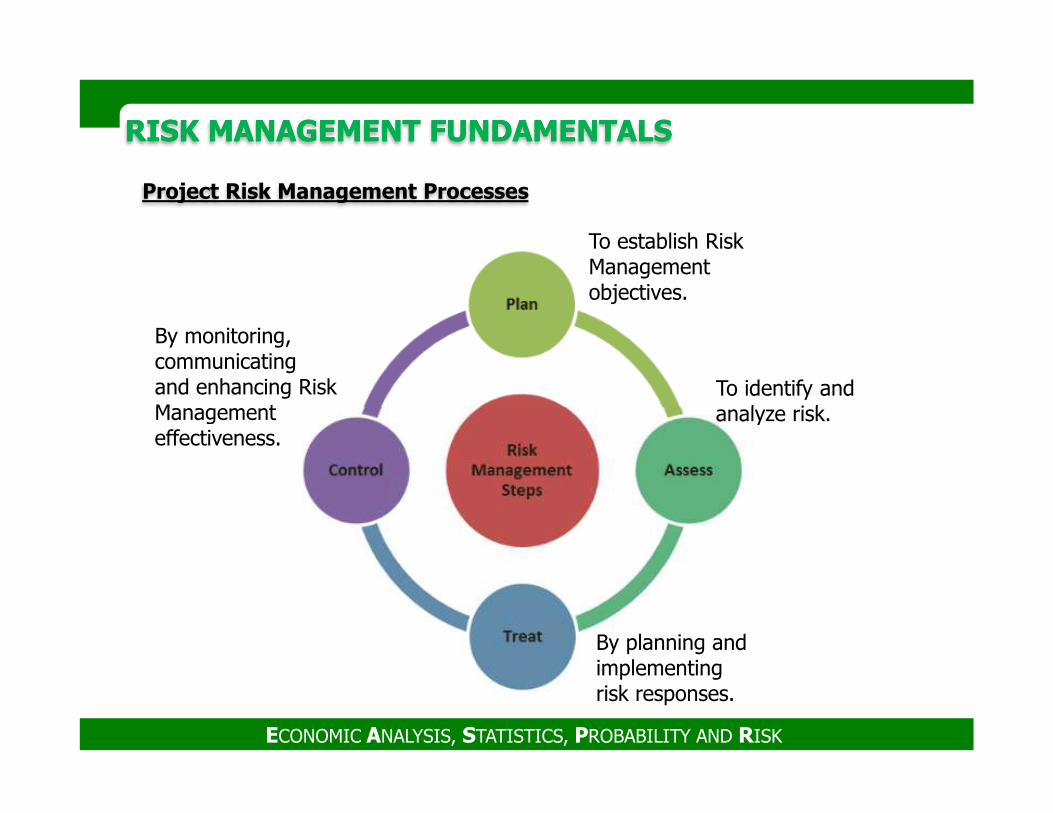
Project Risk Management Processes
To establish Risk Management objectives.
By monitoring, communicating and enhancing Risk Management
To identify and analyze risk.
ECONOMIC ANALYSIS, STATISTICS, PROBABILITY AND RISK
Management effectiveness.
analyze risk.
By planning and implementing risk responses.
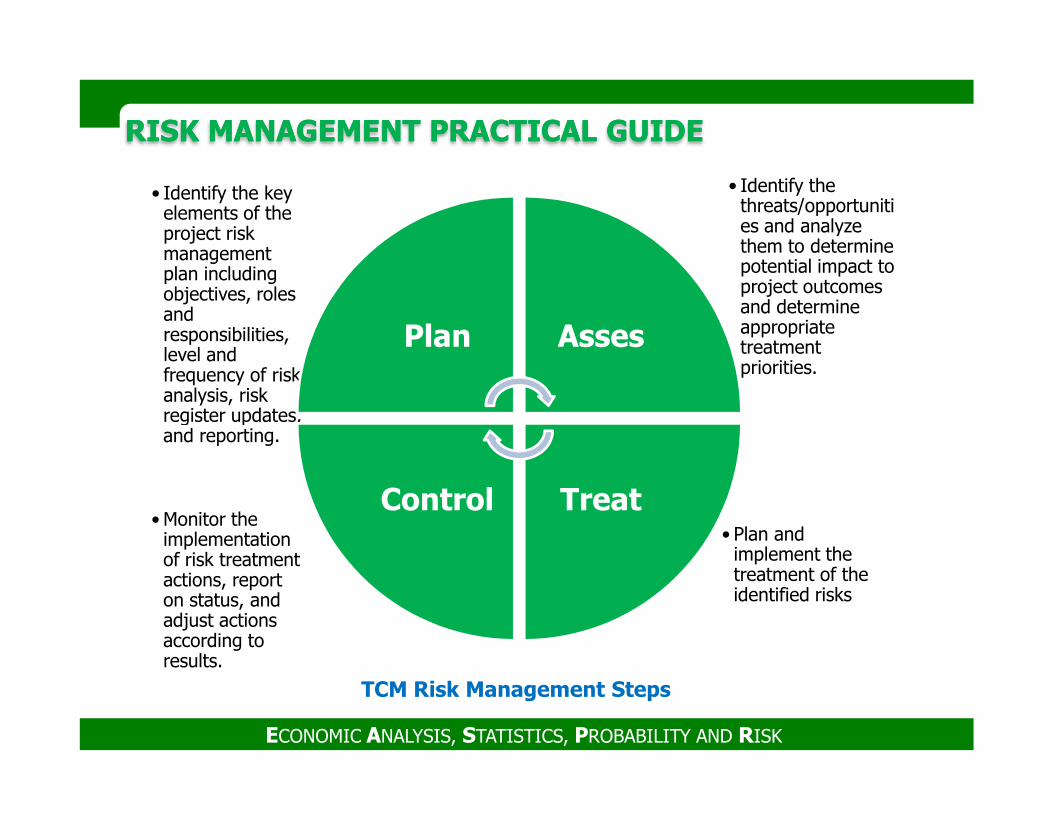
RISK MANAGEMENT PRACTICAL GUIDERISK MANAGEMENT PRACTICAL GUIDE
• Identify the threats/opportunities and analyze them to determine potential impact to project outcomes and determine appropriate treatment priorities.
• Identify the key elements of the project risk management plan including objectives, roles and responsibilities, level and frequency of risk analysis, risk register updates,
Plan Asses
ECONOMIC ANALYSIS, STATISTICS, PROBABILITY AND RISK
TCM Risk Management Steps
• Plan and implement the treatment of the identified risks
• Monitor the implementation of risk treatment actions, report on status, and adjust actions according to results.
register updates, and reporting.
TreatControl
RISK MANAGEMENT FUNDAMENTALSRISK MANAGEMENT FUNDAMENTALS1. Risk Planning
� Establish the approach, form, content
� Define results of risk management
� Define key terms
� Establish criteria for risk identification and assessment, analysis approaches and
general risk treatment strategies
� The outline of the risk management implementation should be in the project
ECONOMIC ANALYSIS, STATISTICS, PROBABILITY AND RISK
� The outline of the risk management implementation should be in the project
plan at the start of basic engineering.
� The final version of the risk management plan should be reviewed and
approved early in detailed engineering.
� The first workshops should take place during project development (prior to the
start of detailed design).
� The earlier a project can recognize and implement risk management treatment
the more effective it will be.
RISK MANAGEMENT FUNDAMENTALSRISK MANAGEMENT FUNDAMENTALS2. Risk Assessment
a) Risk Identification
b) Risk Analysis (Qualitative and Quantitative)
� The steps:
1. The risk management lead notifies the participants and schedules the
meetings and interviews.
2. Meetings and interviews to identify threats and opportunities are conducted,
ECONOMIC ANALYSIS, STATISTICS, PROBABILITY AND RISK
2. Meetings and interviews to identify threats and opportunities are conducted,
based on the risk management criteria formulated in planning, approved by
management, and distributed to participants (i.e., risk identification).
3. Threat or opportunity items and any additional needed resources are
quantified and evaluated by the appropriate subject matter experts. The
results of analysis are prepared to support the treatment phase (i.e., risk
analysis).
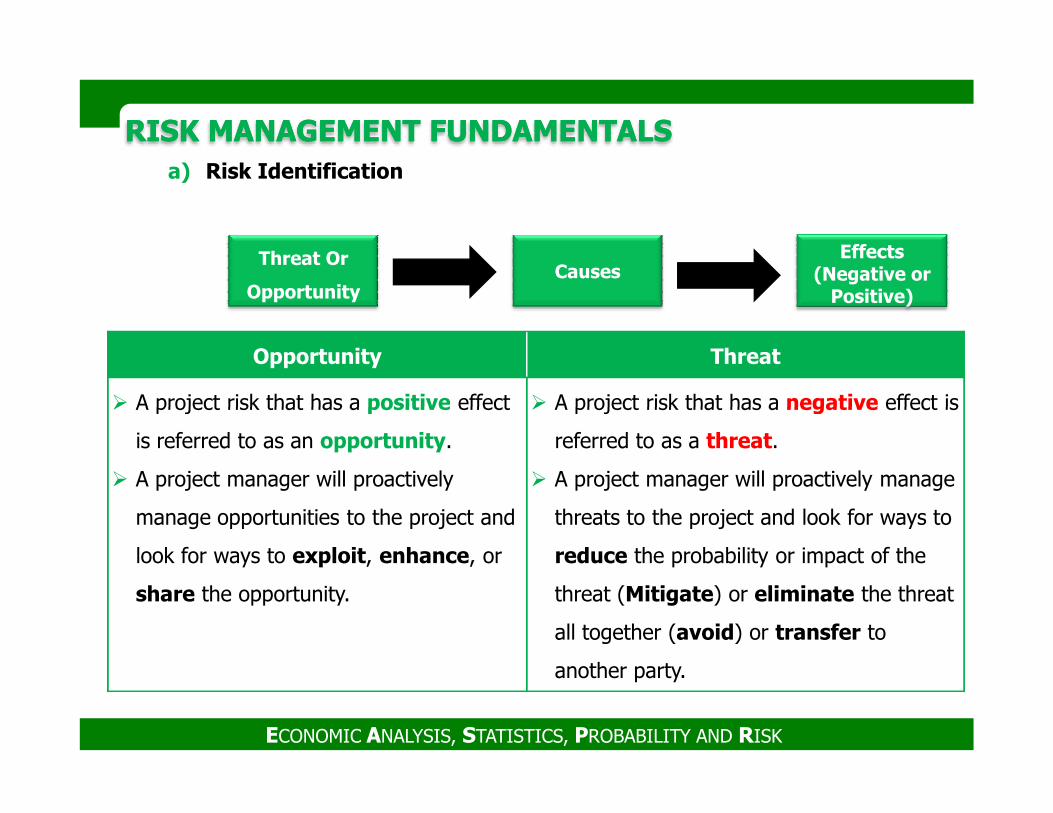
RISK MANAGEMENT FUNDAMENTALSRISK MANAGEMENT FUNDAMENTALSa) Risk Identification
Threat Or
OpportunityCauses
Effects (Negative or
Positive)
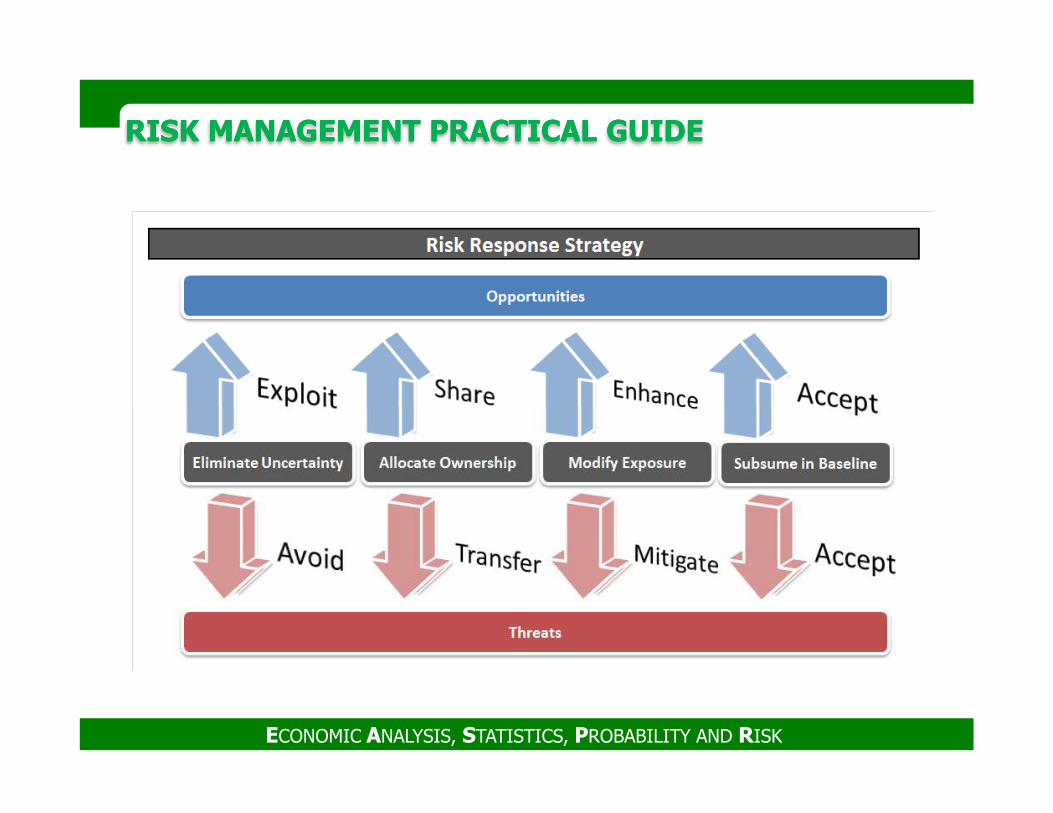
Opportunity Threat
� A project risk that has a positive effect � A project risk that has a negative effect is
ECONOMIC ANALYSIS, STATISTICS, PROBABILITY AND RISK
� A project risk that has a positive effect
is referred to as an opportunity.
� A project manager will proactively
manage opportunities to the project and
look for ways to exploit, enhance, or
share the opportunity.
� A project risk that has a negative effect is
referred to as a threat.
� A project manager will proactively manage
threats to the project and look for ways to
reduce the probability or impact of the
threat (Mitigate) or eliminate the threat
all together (avoid) or transfer to
another party.
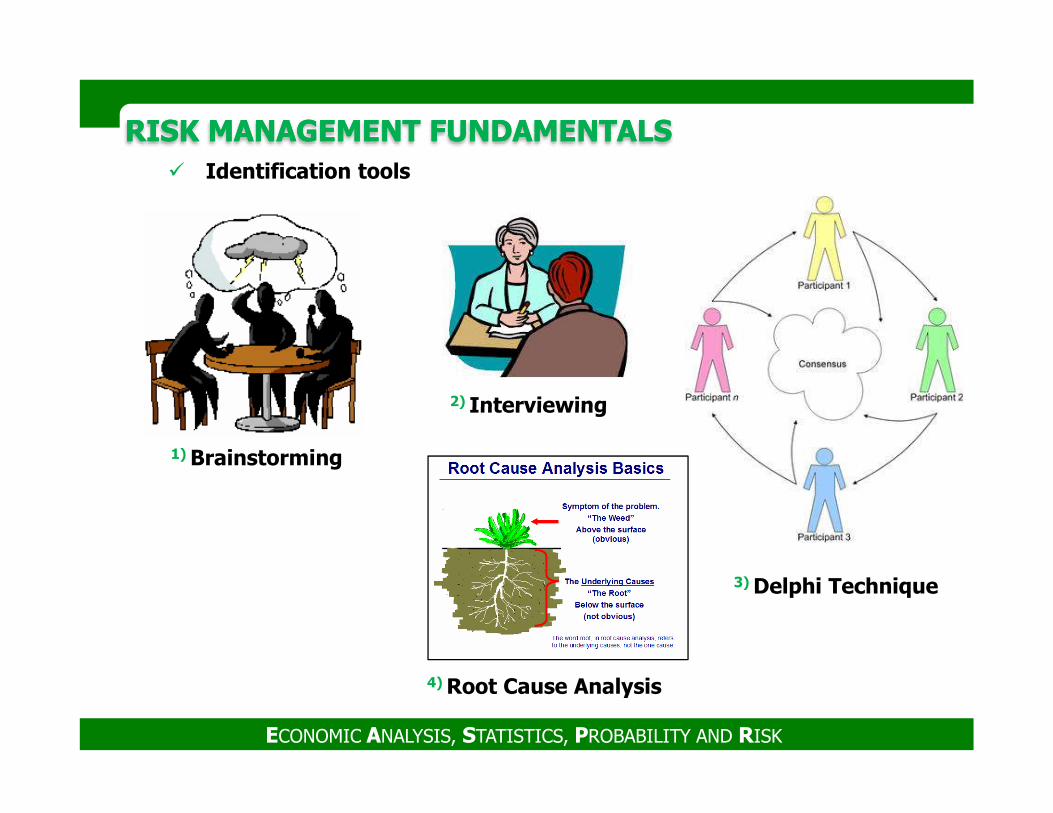
RISK MANAGEMENT FUNDAMENTALSRISK MANAGEMENT FUNDAMENTALS� Identification tools
2) Interviewing
ECONOMIC ANALYSIS, STATISTICS, PROBABILITY AND RISK
1) Brainstorming
3) Delphi Technique
2) Interviewing
4) Root Cause Analysis
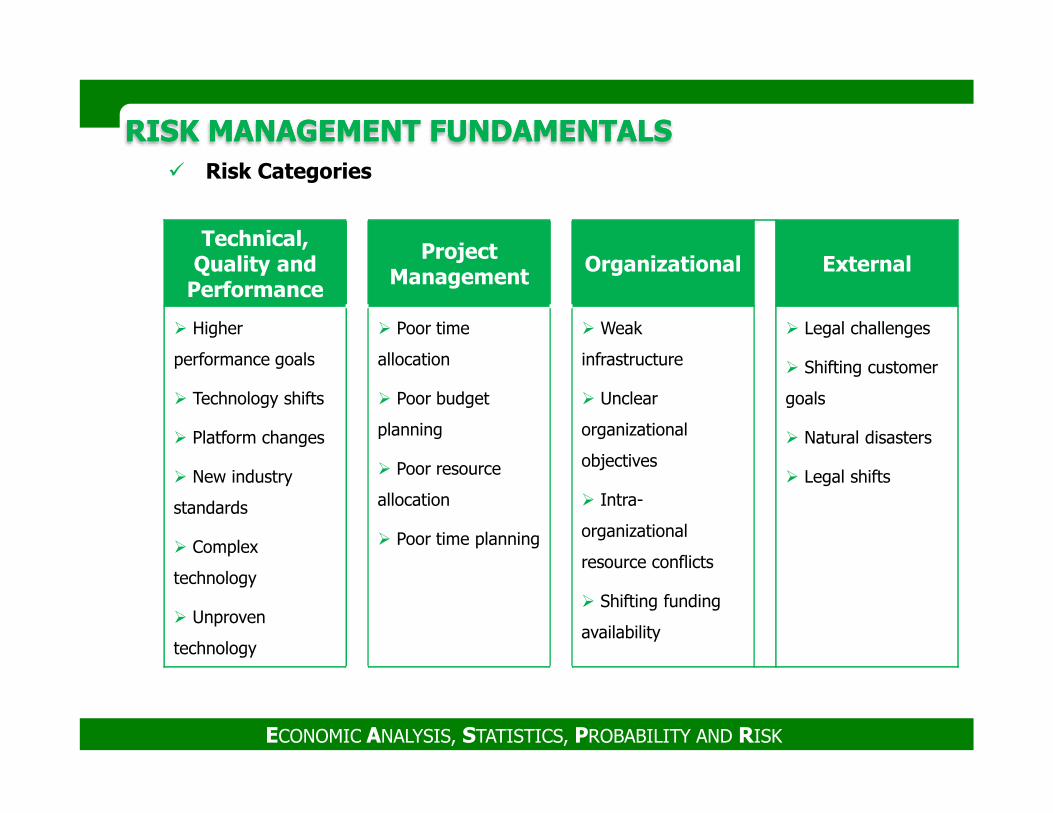
RISK MANAGEMENT FUNDAMENTALSRISK MANAGEMENT FUNDAMENTALS� Risk Categories
Technical, Quality and
Performance
Project Management
Organizational External
� Higher
performance goals
� Technology shifts
� Poor time
allocation
� Poor budget
� Weak
infrastructure
� Unclear
� Legal challenges
� Shifting customer
goals
ECONOMIC ANALYSIS, STATISTICS, PROBABILITY AND RISK
� Technology shifts
� Platform changes
� New industry
standards
� Complex
technology
� Unproven
technology
� Poor budget
planning
� Poor resource
allocation
� Poor time planning
� Unclear
organizational
objectives
� Intra-
organizational
resource conflicts
� Shifting funding
availability
goals
� Natural disasters
� Legal shifts
RISK MANAGEMENT FUNDAMENTALSRISK MANAGEMENT FUNDAMENTALS
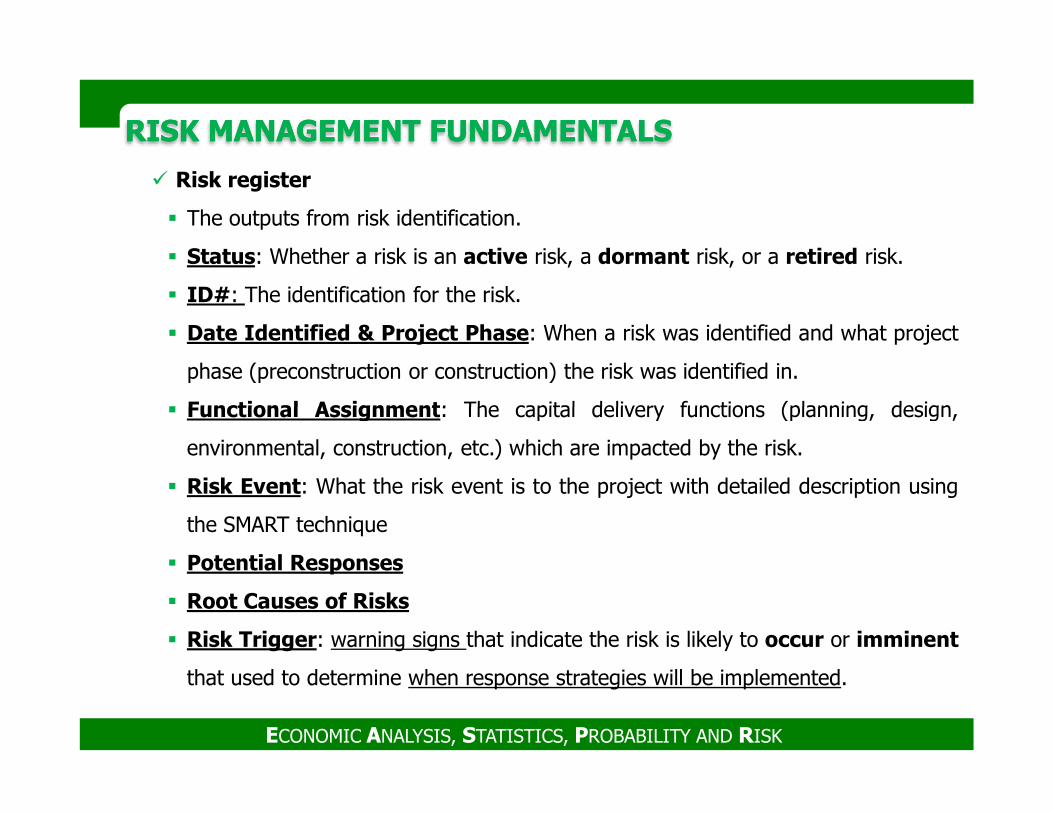
� Risk register
� The outputs from risk identification.
� Status: Whether a risk is an active risk, a dormant risk, or a retired risk.
� ID#: The identification for the risk.
� Date Identified & Project Phase: When a risk was identified and what project
phase (preconstruction or construction) the risk was identified in.
� Functional Assignment: The capital delivery functions (planning, design,
ECONOMIC ANALYSIS, STATISTICS, PROBABILITY AND RISK
� Functional Assignment: The capital delivery functions (planning, design,
environmental, construction, etc.) which are impacted by the risk.
� Risk Event: What the risk event is to the project with detailed description using
the SMART technique
� Potential Responses
� Root Causes of Risks
� Risk Trigger: warning signs that indicate the risk is likely to occur or imminent
that used to determine when response strategies will be implemented.
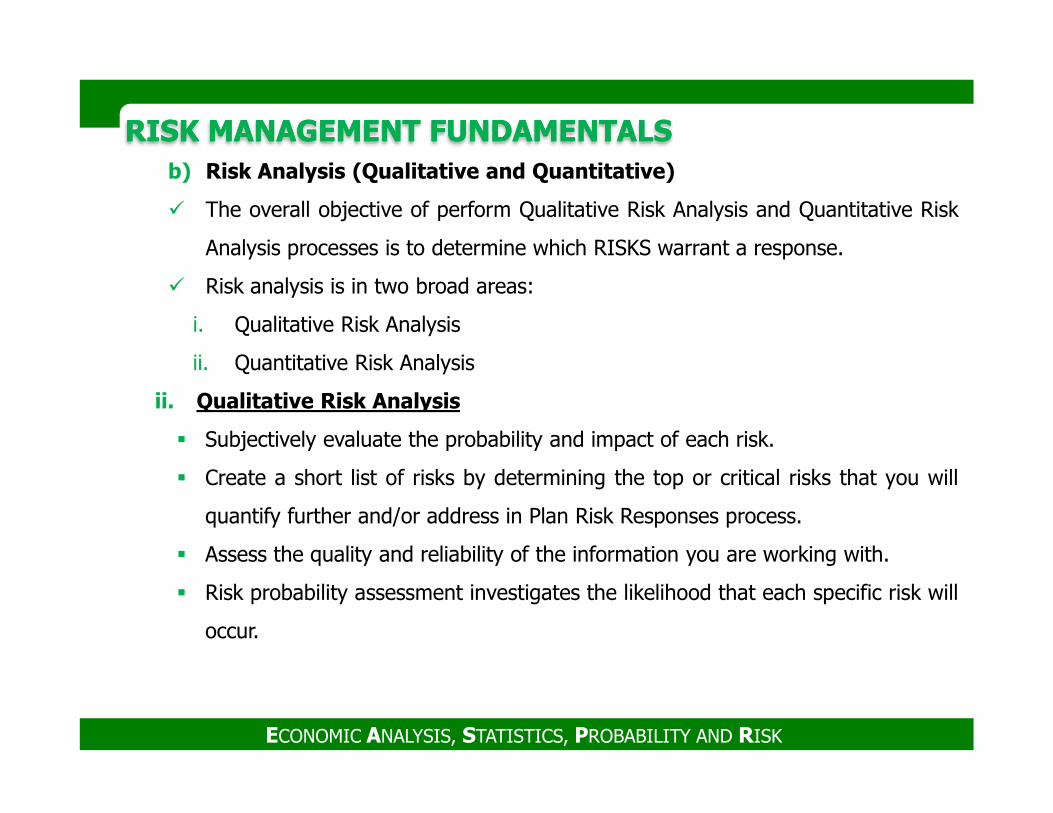
RISK MANAGEMENT FUNDAMENTALSRISK MANAGEMENT FUNDAMENTALSb) Risk Analysis (Qualitative and Quantitative)
� The overall objective of perform Qualitative Risk Analysis and Quantitative Risk
Analysis processes is to determine which RISKS warrant a response.
� Risk analysis is in two broad areas:
i. Qualitative Risk Analysis
ii. Quantitative Risk Analysis
ii. Qualitative Risk Analysis
ECONOMIC ANALYSIS, STATISTICS, PROBABILITY AND RISK
ii. Qualitative Risk Analysis
� Subjectively evaluate the probability and impact of each risk.
� Create a short list of risks by determining the top or critical risks that you will
quantify further and/or address in Plan Risk Responses process.
� Assess the quality and reliability of the information you are working with.
� Risk probability assessment investigates the likelihood that each specific risk will
occur.
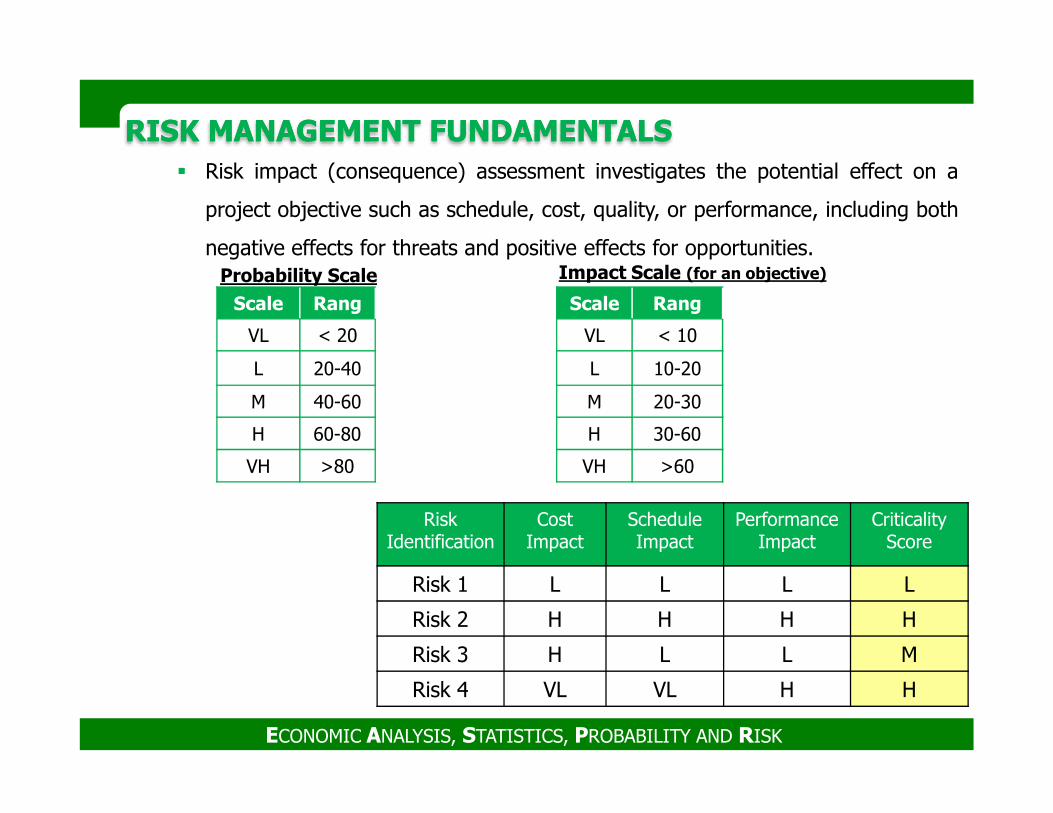
RISK MANAGEMENT FUNDAMENTALSRISK MANAGEMENT FUNDAMENTALS� Risk impact (consequence) assessment investigates the potential effect on a
project objective such as schedule, cost, quality, or performance, including both
negative effects for threats and positive effects for opportunities.Probability Scale
Scale Rang
VL < 20
L 20-40
M 40-60
Impact Scale (for an objective)
Scale Rang
VL < 10
L 10-20
M 20-30
ECONOMIC ANALYSIS, STATISTICS, PROBABILITY AND RISK
Risk Identification
Cost Impact
Schedule Impact
Performance Impact
Criticality Score
Risk 1 L L L L
Risk 2 H H H H
Risk 3 H L L M
Risk 4 VL VL H H
M 40-60
H 60-80
VH >80
M 20-30
H 30-60
VH >60
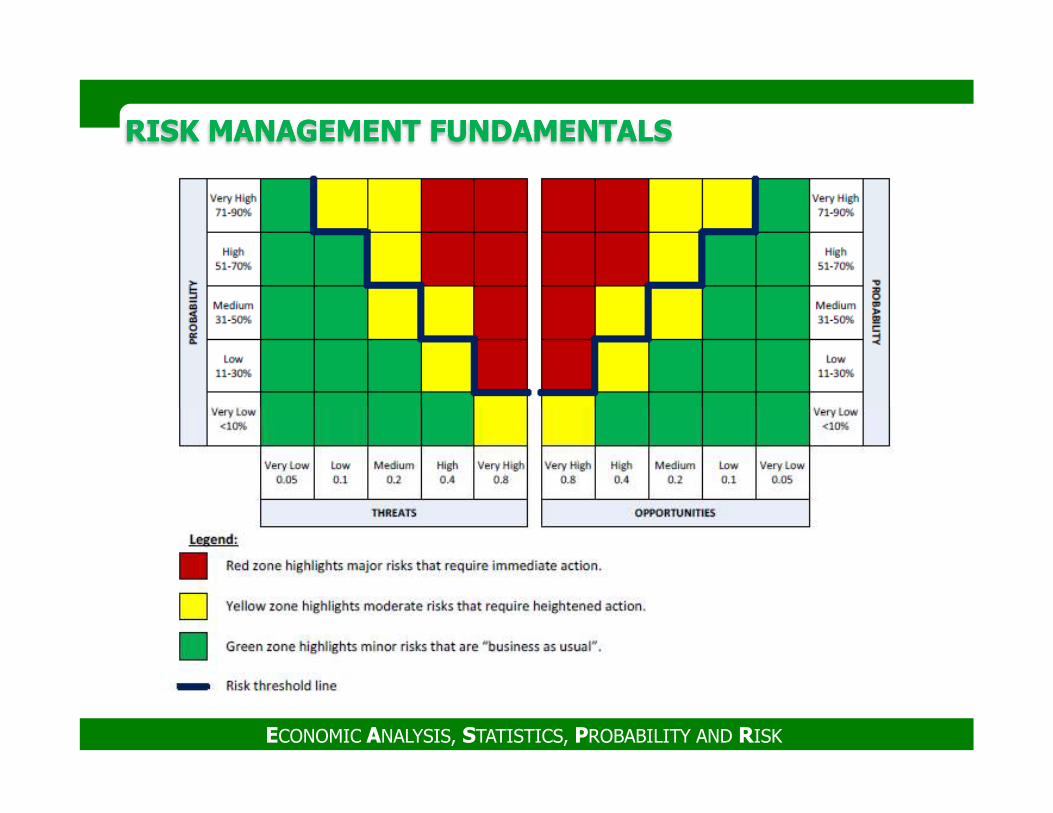
RISK MANAGEMENT FUNDAMENTALSRISK MANAGEMENT FUNDAMENTALS� Evaluation of each risk’s importance and, hence, priority for attention is
typically conducted using a look-up table or a probability and impact
matrix.
� P-I matrix can be based on ordinal very)ترتيبي low, low, medium, high, and
very high ) or cardinal /1.)العدد .3/ .5/ .7/ .9 or 1/ 2/ 3/ 4/ 5) scales.
� The organization should determine which combinations of probability and
impact result in a classification of high risk “red condition”, moderate risk
ECONOMIC ANALYSIS, STATISTICS, PROBABILITY AND RISK
impact result in a classification of high risk “red condition”, moderate risk
“yellow condition”, and low risk “green condition”.
� For consistency with other risk assessment terms, a 1-5 scale for
probability is used.
RISK MANAGEMENT FUNDAMENTALSRISK MANAGEMENT FUNDAMENTALS
ECONOMIC ANALYSIS, STATISTICS, PROBABILITY AND RISK
RISK MANAGEMENT FUNDAMENTALSRISK MANAGEMENT FUNDAMENTALSii. Quantitative Risk Analysis
� Quantitative risk analysis is the application of mathematical techniques and
models to numerically establish the probability of risk and the consequences of
risk.
� Objectively evaluate the probability and impact of each risk.
� Decide which risks warrant a response.
� Determine the level of risk the project currently has and whether that level of
ECONOMIC ANALYSIS, STATISTICS, PROBABILITY AND RISK
� Determine the level of risk the project currently has and whether that level of
risk is acceptable for the expected gain from the product of the project.
� Determine how much the project will cost and how long it will take if no further
risk management actions are taken to decrease project risk.
� Determine which risk require response planning.
� Determine the probability of achieving cost or schedule objectives for the
project.
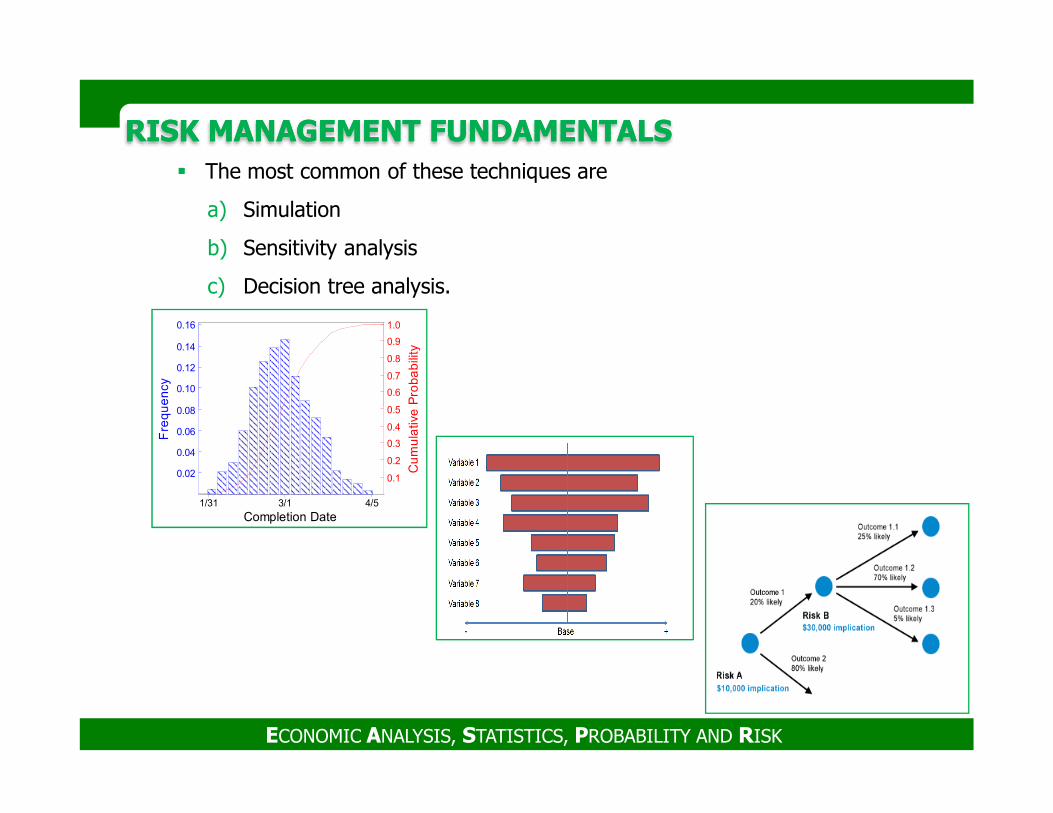
RISK MANAGEMENT FUNDAMENTALSRISK MANAGEMENT FUNDAMENTALS� The most common of these techniques are
a) Simulation
b) Sensitivity analysis
c) Decision tree analysis.
Fre
qu
en
cy
Cu
mu
lativ
e P
rob
ab
ility
0.5
0.6
0.7
0.8
0.9
1.0
0.08
0.10
0.12
0.14
0.16
ECONOMIC ANALYSIS, STATISTICS, PROBABILITY AND RISK
Completion Date
Fre
qu
en
cy
Cu
mu
lativ
e P
rob
ab
ility
3/11/31 4/5
0.1
0.2
0.3
0.4
0.5
0.02
0.04
0.06
0.08
RISK MANAGEMENT FUNDAMENTALSRISK MANAGEMENT FUNDAMENTALS
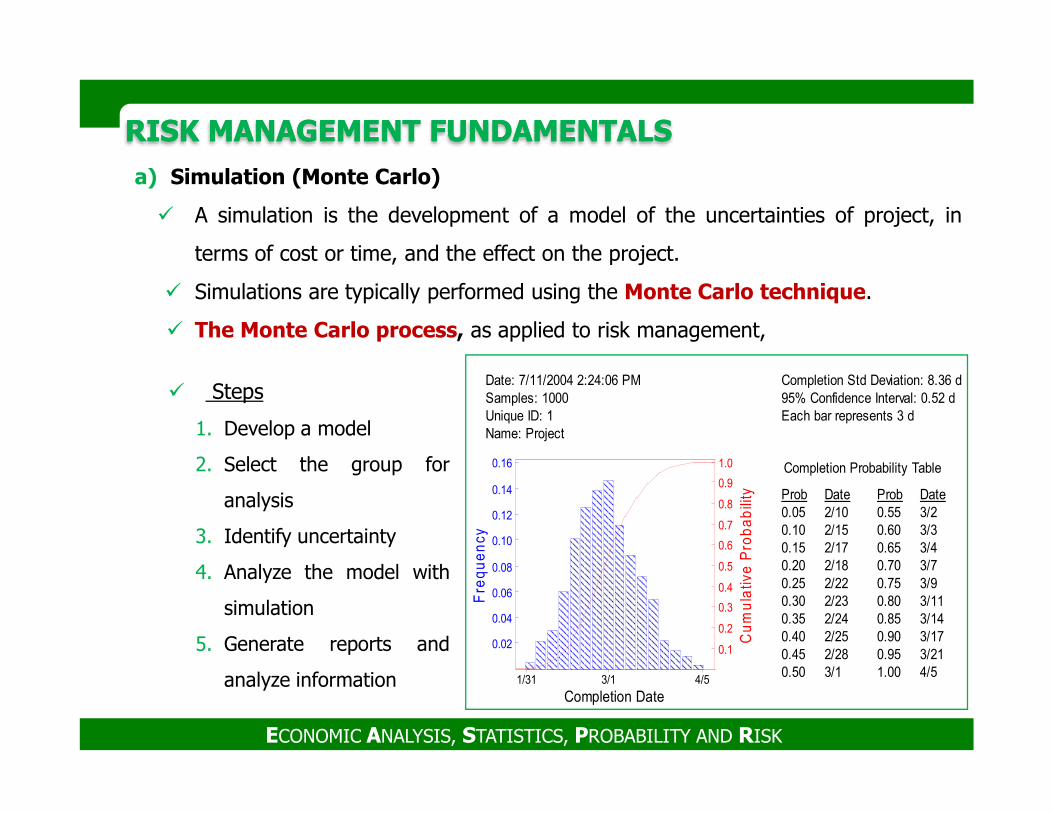
Date: 7/11/2004 2:24:06 PMSamples: 1000
Completion Std Deviation: 8.36 d95% Confidence Interval: 0.52 d� Steps
a) Simulation (Monte Carlo)
� A simulation is the development of a model of the uncertainties of project, in
terms of cost or time, and the effect on the project.
� Simulations are typically performed using the Monte Carlo technique.
� The Monte Carlo process, as applied to risk management,
ECONOMIC ANALYSIS, STATISTICS, PROBABILITY AND RISK
Unique ID: 1Name: Project
Each bar represents 3 d
Completion Date
Fre
qu
en
cy
Cu
mu
lativ
e P
rob
ab
ility
3/11/31 4/5
0.1
0.2
0.3
0.4
0.5
0.6
0.7
0.8
0.9
1.0
0.02
0.04
0.06
0.08
0.10
0.12
0.14
0.16 Completion Probability Table
Prob ProbDate Date0.05 2/100.10 2/150.15 2/170.20 2/180.25 2/220.30 2/230.35 2/240.40 2/250.45 2/280.50 3/1
0.55 3/20.60 3/30.65 3/40.70 3/70.75 3/90.80 3/110.85 3/140.90 3/170.95 3/211.00 4/5
1. Develop a model
2. Select the group for
analysis
3. Identify uncertainty
4. Analyze the model with
simulation
5. Generate reports and
analyze information
RISK MANAGEMENT FUNDAMENTALSRISK MANAGEMENT FUNDAMENTALS
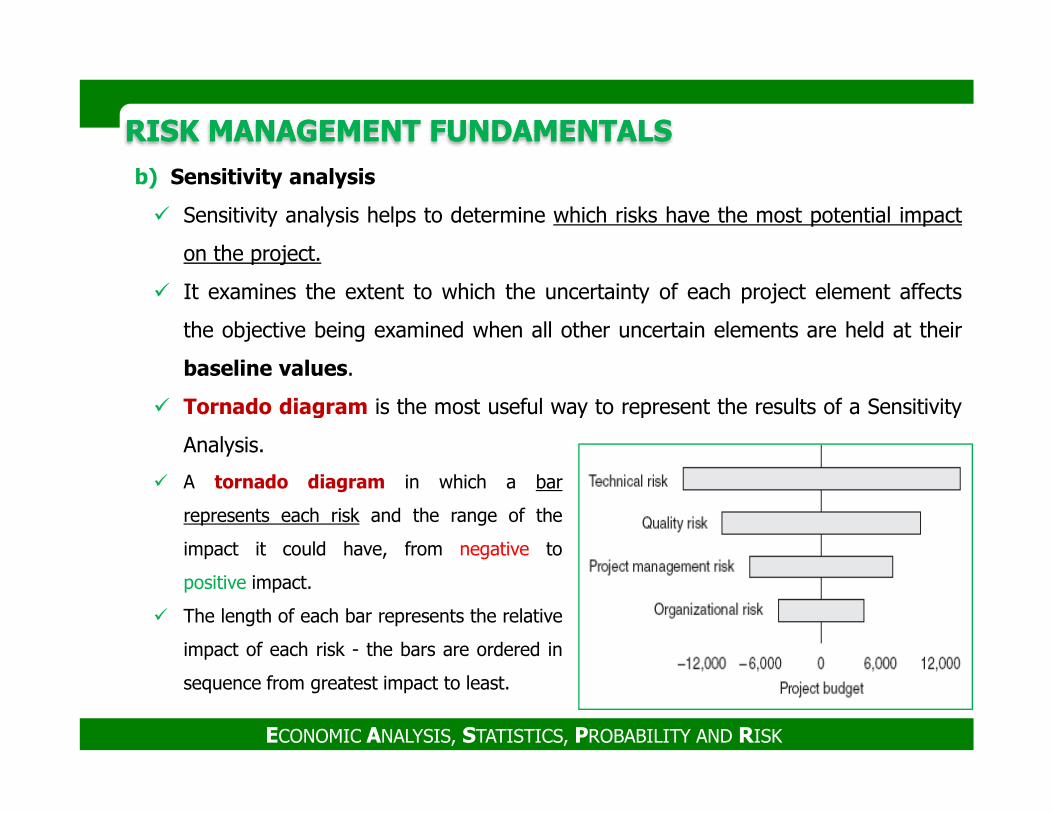
b) Sensitivity analysis
� Sensitivity analysis helps to determine which risks have the most potential impact
on the project.
� It examines the extent to which the uncertainty of each project element affects
the objective being examined when all other uncertain elements are held at their
baseline values.
� Tornado diagram is the most useful way to represent the results of a Sensitivity
ECONOMIC ANALYSIS, STATISTICS, PROBABILITY AND RISK
� Tornado diagram is the most useful way to represent the results of a Sensitivity
Analysis.
� A tornado diagram in which a bar
represents each risk and the range of the
impact it could have, from negative to
positive impact.
� The length of each bar represents the relative
impact of each risk - the bars are ordered in
sequence from greatest impact to least.
RISK MANAGEMENT FUNDAMENTALSRISK MANAGEMENT FUNDAMENTALS
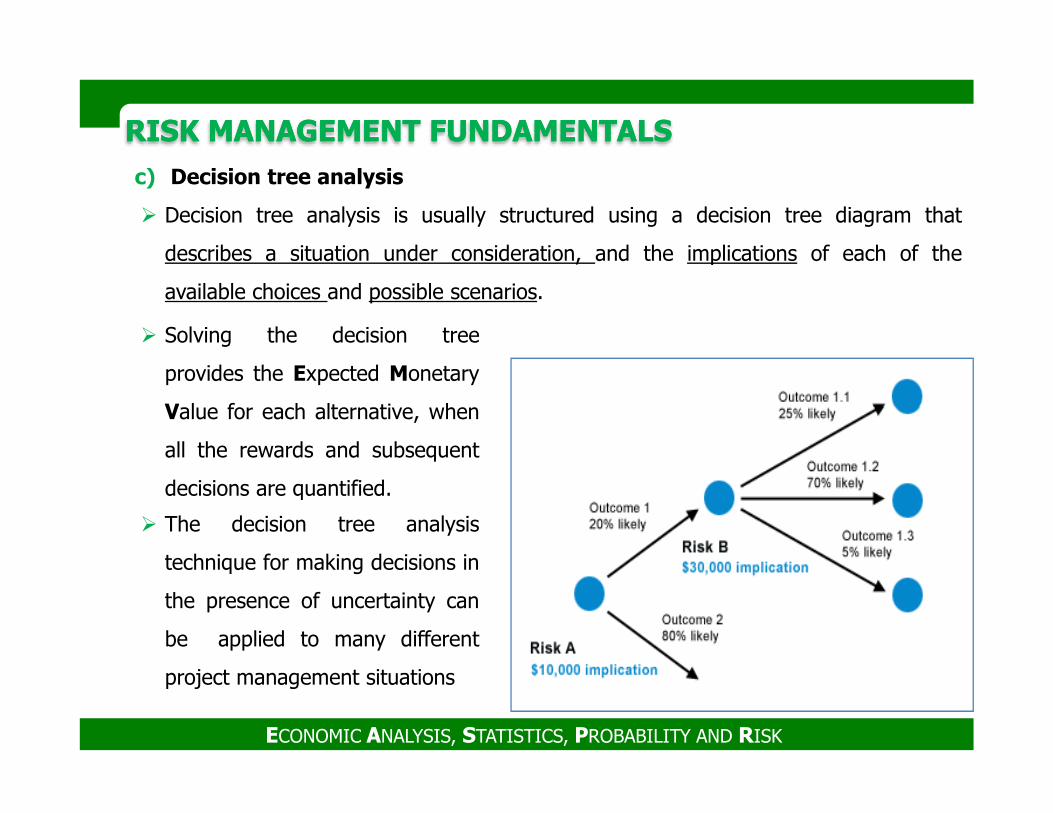
c) Decision tree analysis
� Decision tree analysis is usually structured using a decision tree diagram that
describes a situation under consideration, and the implications of each of the
available choices and possible scenarios.
� Solving the decision tree
provides the Expected Monetary
Value for each alternative, when
ECONOMIC ANALYSIS, STATISTICS, PROBABILITY AND RISK
Value for each alternative, when
all the rewards and subsequent
decisions are quantified.
� The decision tree analysis
technique for making decisions in
the presence of uncertainty can
be applied to many different
project management situations
RISK MANAGEMENT FUNDAMENTALSRISK MANAGEMENT FUNDAMENTALSRisk Management Software
1. Cost Risk Analysis
� Crystal Ball, Oracle Corp.
� @Risk, Palisade Corp.
� Risk Solver, Frontline Systems Inc.
2. Schedule Risk Analysis
� @Risk for Project, Palisade Corp.
ECONOMIC ANALYSIS, STATISTICS, PROBABILITY AND RISK
� @Risk for Project, Palisade Corp.
� Primavera, Oracle Corp.
RISK MANAGEMENT FUNDAMENTALSRISK MANAGEMENT FUNDAMENTALS
Contingency
� An amount added to an estimate to allow for items, conditions, or events for which
the state, occurrence, or effect is uncertain and that experience shows will likely
result, in aggregate, in additional costs.
� Typically, estimates using statistical analysis or judgment, based on past asset or
project experience.
� Contingency usually excludes:
ECONOMIC ANALYSIS, STATISTICS, PROBABILITY AND RISK
� Contingency usually excludes:
� Major scope changes such as changes in end product specification, capacities,
building sizes, and location of the asset or project.
� Extraordinary events such as major strikes and natural disasters.
� Management reserves.
� Escalation and currency effects.
RISK MANAGEMENT PRACTICAL GUIDERISK MANAGEMENT PRACTICAL GUIDE
3. Risk Treatment
� The risk management team and other members would develop recommendations
and decisions on how to treat those risks.
� Risks should be assigned risk owners who will be responsible for overseeing the
implementation of the risk treatment action, which should be reflected in a risk
register.
� Key actions performed during the risk treatment phase include (TCM Framework ):
ECONOMIC ANALYSIS, STATISTICS, PROBABILITY AND RISK
� Key actions performed during the risk treatment phase include (TCM Framework ):
1. Evaluating all appropriate response strategies.
2. Selecting an appropriate risk response plan strategy (or combination of strategies).
3. Developing action items in support of the selected response.
4. Validating proposed actions with assigned actionees, including dates for implementation.
5. Ascertaining post-response targets and gains.
6. Ascertaining response plan resource requirements.
7. Updating project schedule or budget if the anticipated treatment value gain is positive.
8. Identifying any secondary threats or opportunities that may arise from the response.
RISK MANAGEMENT PRACTICAL GUIDERISK MANAGEMENT PRACTICAL GUIDE
ECONOMIC ANALYSIS, STATISTICS, PROBABILITY AND RISK
RISK MANAGEMENT PRACTICAL GUIDERISK MANAGEMENT PRACTICAL GUIDE
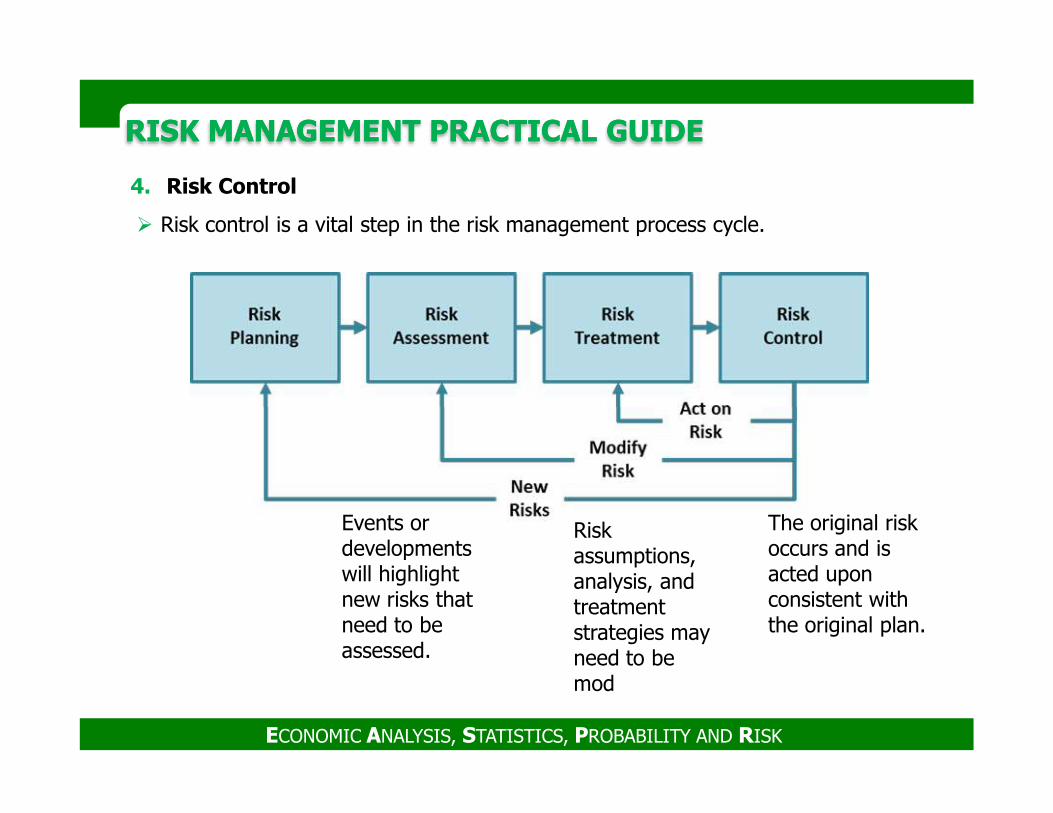
4. Risk Control
� Risk control is a vital step in the risk management process cycle.
ECONOMIC ANALYSIS, STATISTICS, PROBABILITY AND RISK
The original risk occurs and is acted upon consistent with the original plan.
Risk assumptions, analysis, and treatment strategies may need to be mod
Events or developments will highlight new risks that need to be assessed.
RISK MANAGEMENT PRACTICAL GUIDERISK MANAGEMENT PRACTICAL GUIDE
� Risk reassessment
� Additional Risk Identification, Qualitative Risk Analysis, Quantitative Risk Analysis,
and Risk Response Planning.
� Control Risks often results in identification of new risks, reassessment of
current risks, and the closing of risks that are outdated.
� Project risk reassessments should be regularly scheduled.
� The results of such reassessments may include newly identifications, additional
ECONOMIC ANALYSIS, STATISTICS, PROBABILITY AND RISK
� The results of such reassessments may include newly identifications, additional
qualitative or quantitative risk analysis, and further risk response planning.
� There are two major times when a risk reassessment might occur:
a) When new risks are identified.
b) When changes occur on the project.
RISK MANAGEMENT PRACTICAL GUIDERISK MANAGEMENT PRACTICAL GUIDE
� Risk Audit
� Risk audits examine and document the effectiveness of risk responses in dealing
with identified risks and their root causes, as well as the effectiveness of the risk
management process.
� It is arranged by project manager and results in identification of lessons learned for
the project and for other project in the organization.
� Risk audits are evidence of how seriously risk should be taken on a project.
ECONOMIC ANALYSIS, STATISTICS, PROBABILITY AND RISK
� Risk audits are evidence of how seriously risk should be taken on a project.
� A risk audit includes:
a) Reviewing if the right risk owners have been assigned to each risk
b) Determining if the risk owners are effective.
c) Examining and documenting the effectiveness of contingency plans and
fallback plans
RISK MANAGEMENT PRACTICAL GUIDERISK MANAGEMENT PRACTICAL GUIDE
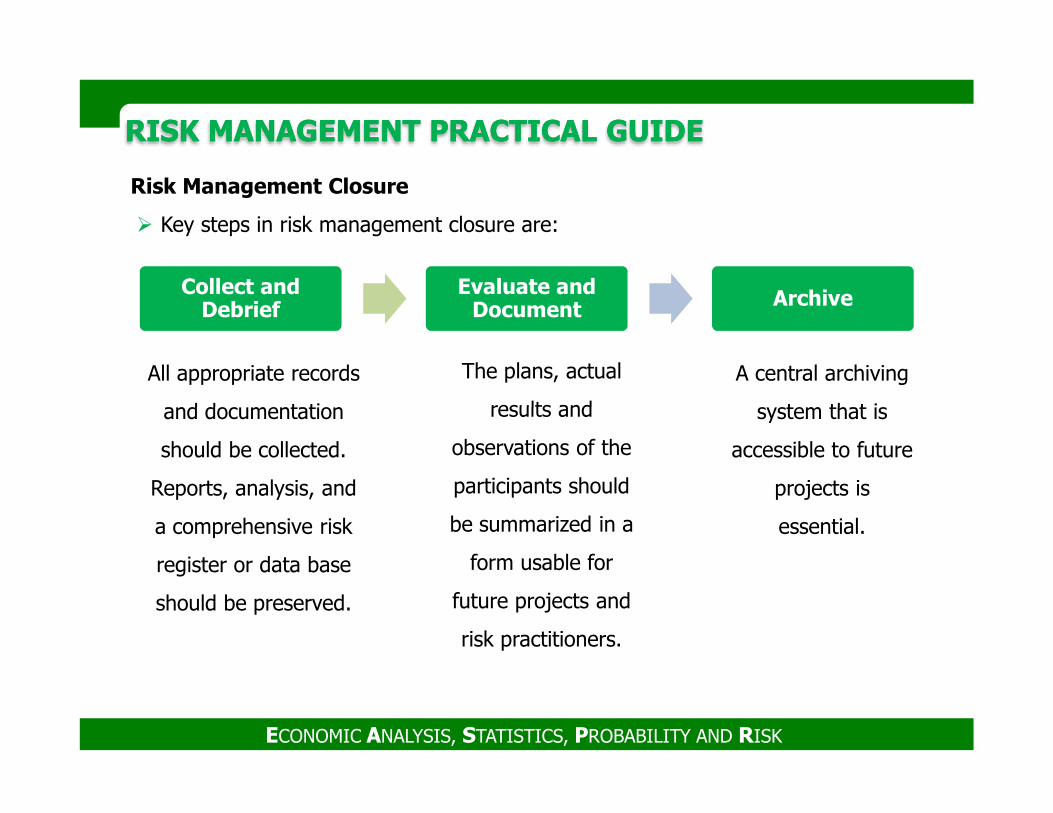
Risk Management Closure
� Key steps in risk management closure are:
Collect and Debrief
Evaluate and Document Archive
All appropriate records
and documentation
The plans, actual
results and
A central archiving
system that is
ECONOMIC ANALYSIS, STATISTICS, PROBABILITY AND RISK
and documentation
should be collected.
Reports, analysis, and
a comprehensive risk
register or data base
should be preserved.
results and
observations of the
participants should
be summarized in a
form usable for
future projects and
risk practitioners.
system that is
accessible to future
projects is
essential.
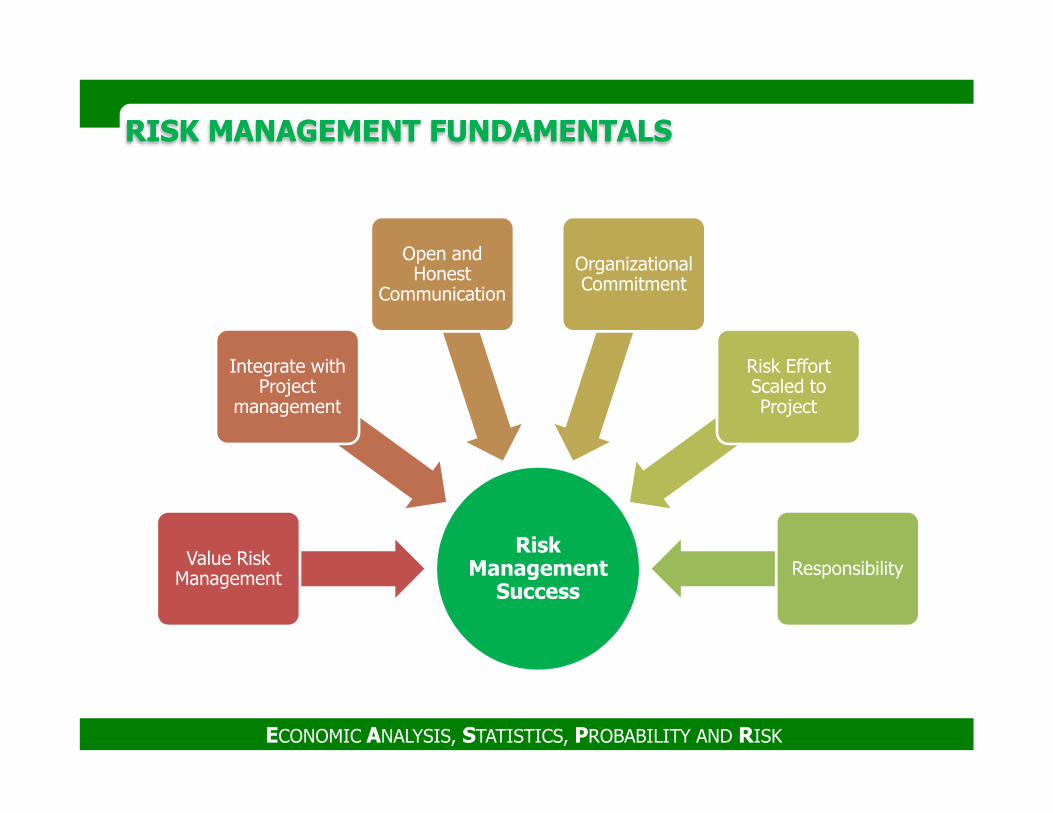
RISK MANAGEMENT FUNDAMENTALSRISK MANAGEMENT FUNDAMENTALS
Integrate with Project
management
Open and Honest
Communication
Organizational Commitment
Risk Effort Scaled to Project
ECONOMIC ANALYSIS, STATISTICS, PROBABILITY AND RISK
Risk Management
Success
Value Risk Management
management Project
Responsibility
TOTAL COST MANAGEMENT OVERVIEWTOTAL COST MANAGEMENT OVERVIEW
� Total Cost Management (TCM) is described as the “sum of the practices and
processes that an enterprise uses to manage the total lifecycle cost
investment in its portfolio of strategic assets”.
� TCM attempts to illustrate the integration of all the various skills and knowledge
areas that are required for processes to support overall management of both
strategic assets as well as the individual projects, undertaken to create and
develop those assets.
ECONOMIC ANALYSIS, STATISTICS, PROBABILITY AND RISK
develop those assets.
� TCM is accomplished through the application of:
� Cost engineering and cost management principles
� Proven methodologies
� The latest technologies in support of the management process
TOTAL COST MANAGEMENT OVERVIEWTOTAL COST MANAGEMENT OVERVIEW
� Strategic Assets are physical or intellectual property that has long-term or lasting
value to an enterprise.
� They are expected to provide a positive economic benefit and are created
through the investment of money, time, and resources. Examples include:
� Buildings
� Software applications
Retail products
ECONOMIC ANALYSIS, STATISTICS, PROBABILITY AND RISK
� Retail products
� Theater production
� It is important to note that TCM recognizes the term “cost” as going beyond the
traditional monetary definition to include any investment of resources in the
enterprise’s assets.
� TCM is a comprehensive approach to managing the total resource investment in
assets.
TOTAL COST MANAGEMENT OVERVIEWTOTAL COST MANAGEMENT OVERVIEW
� Total Cost Management Processes
� Plan-Do-Check-Act (PDCA) Management Cycle
� Often referred to as the Deming or Shewhart Cycle
� Generally accepted, quality driven, continuous improvement model.
� The AACE International Total Cost Management process is divided into two (2)
aspects:
1. Strategic Asset Management (SAM) Process
ECONOMIC ANALYSIS, STATISTICS, PROBABILITY AND RISK
1. Strategic Asset Management (SAM) Process
� The macro process of managing the total lifecycle cost investment of resources in
an enterprise’s complete portfolio of strategic assets.
� This process focuses on initiating and managing the overall portfolio of projects in
a way that addresses the strategic objectives of the enterprise.
� This process is typically business-led.
TOTAL COST MANAGEMENT OVERVIEWTOTAL COST MANAGEMENT OVERVIEW
2. Project Control Process
� This is a technical-led a process for controlling the investment of resources in an
asset during project execution.
� Project Control is the recursive process nested within the “DO” step of the
Strategic Asset Management (SAM) Process cycle.
� Unlike SAM, which is always ongoing, a project is a temporary undertaking with a
defined beginning and an end. Projects are how asset investment decisions are
ECONOMIC ANALYSIS, STATISTICS, PROBABILITY AND RISK
defined beginning and an end. Projects are how asset investment decisions are
put into effect.
� Ultimately, at the end of a project, a usable or operational asset is returned to the
� enterprise’s asset portfolio. Project Control is focused on delivering an asset that
meets all of the business objectives identified by the strategic asset planning
process; it is about “doing the project right”
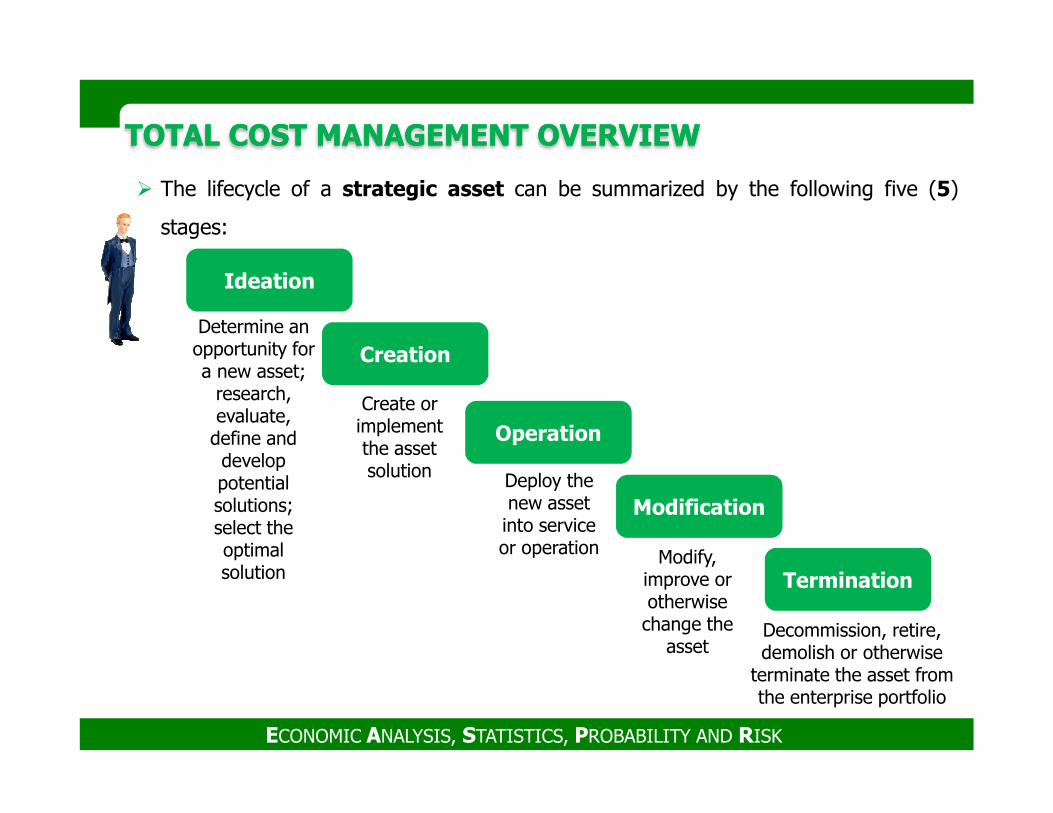
TOTAL COST MANAGEMENT OVERVIEWTOTAL COST MANAGEMENT OVERVIEW
� The lifecycle of a strategic asset can be summarized by the following five (5)
stages:
Creation
Ideation
Determine an opportunity for a new asset;
research, evaluate,
Create or
ECONOMIC ANALYSIS, STATISTICS, PROBABILITY AND RISK
Operation
Modification
evaluate, define and developpotential solutions; select the optimal solution
Create or implement the asset solution
Modify, improve or otherwise change the
asset
Deploy the new asset into service or operation
Termination
Decommission, retire, demolish or otherwise
terminate the asset from the enterprise portfolio
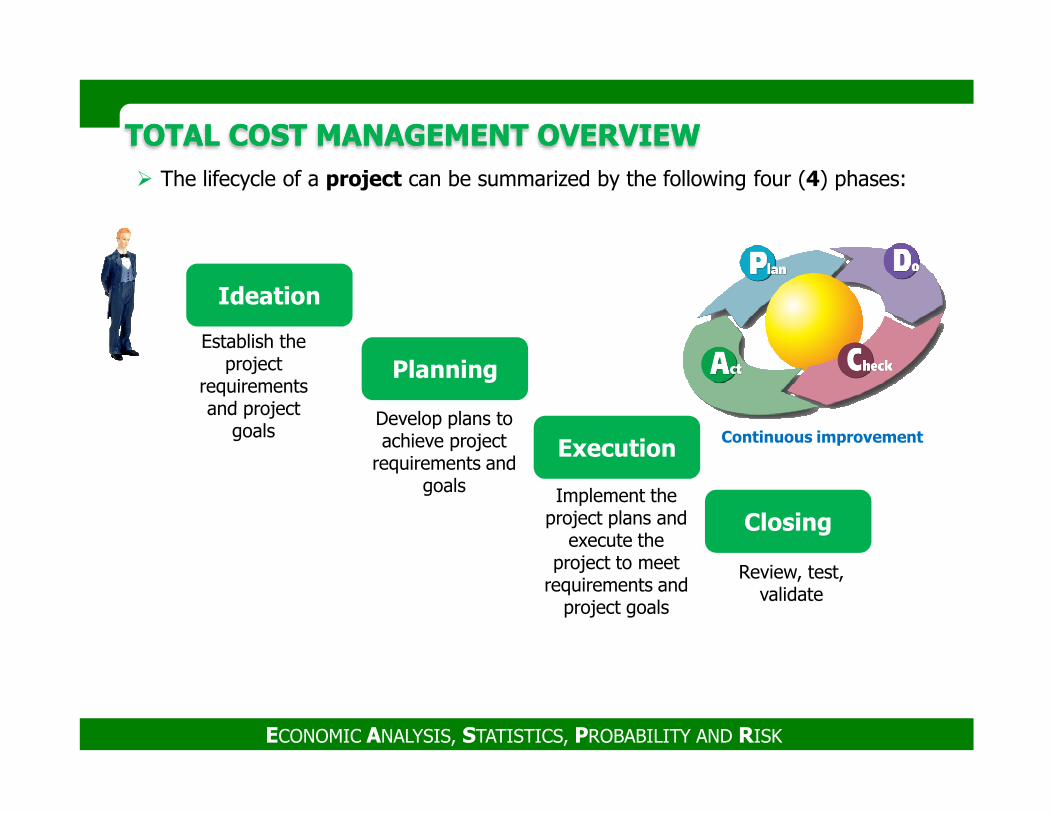
TOTAL COST MANAGEMENT OVERVIEWTOTAL COST MANAGEMENT OVERVIEW
� The lifecycle of a project can be summarized by the following four (4) phases:
Planning
Ideation
Establish the project
requirements and project Develop plans to
ECONOMIC ANALYSIS, STATISTICS, PROBABILITY AND RISK
Execution
Closing
Continuous improvement
and project goals
Develop plans to achieve project
requirements and goals
Review, test, validate
Implement the project plans and
execute the project to meet
requirements and project goals
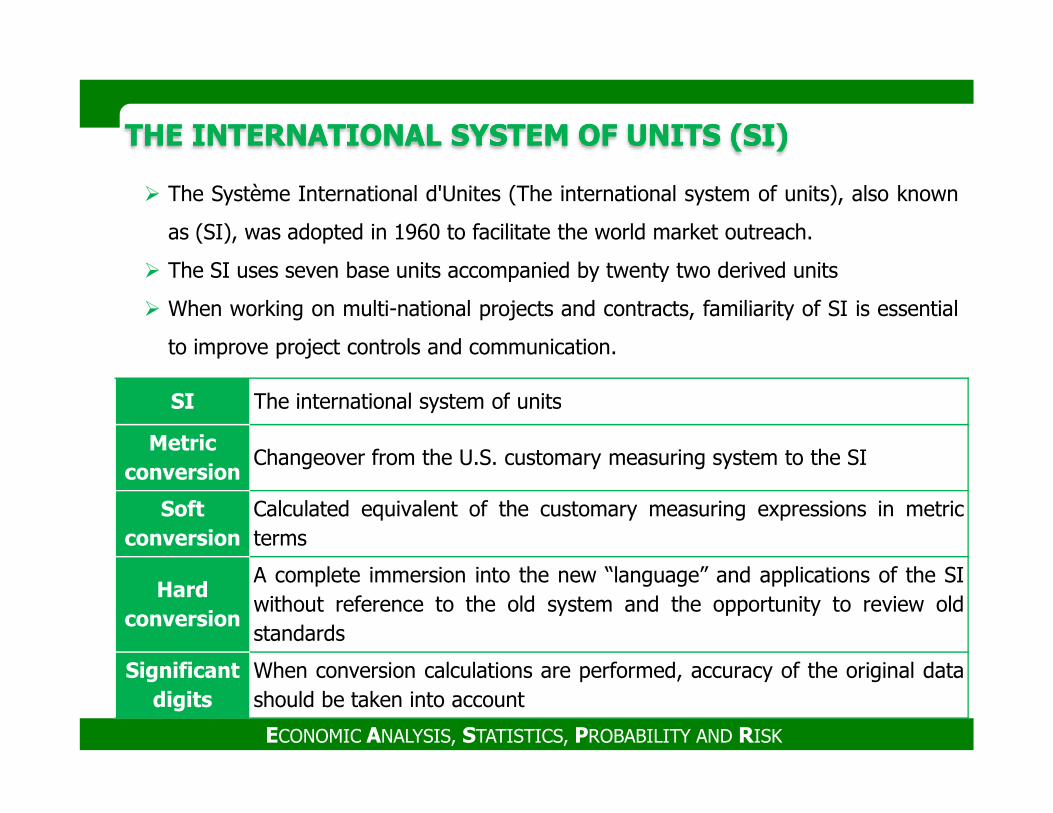
THE INTERNATIONAL SYSTEM OF UNITS (SI)THE INTERNATIONAL SYSTEM OF UNITS (SI)
� The Système International d'Unites (The international system of units), also known
as (SI), was adopted in 1960 to facilitate the world market outreach.
� The SI uses seven base units accompanied by twenty two derived units
� When working on multi-national projects and contracts, familiarity of SI is essential
to improve project controls and communication.
SI The international system of units
ECONOMIC ANALYSIS, STATISTICS, PROBABILITY AND RISK
SI The international system of units
Metric conversion
Changeover from the U.S. customary measuring system to the SI
Soft conversion
Calculated equivalent of the customary measuring expressions in metricterms
Hard conversion
A complete immersion into the new “language” and applications of the SIwithout reference to the old system and the opportunity to review oldstandards
Significant digits
When conversion calculations are performed, accuracy of the original datashould be taken into account
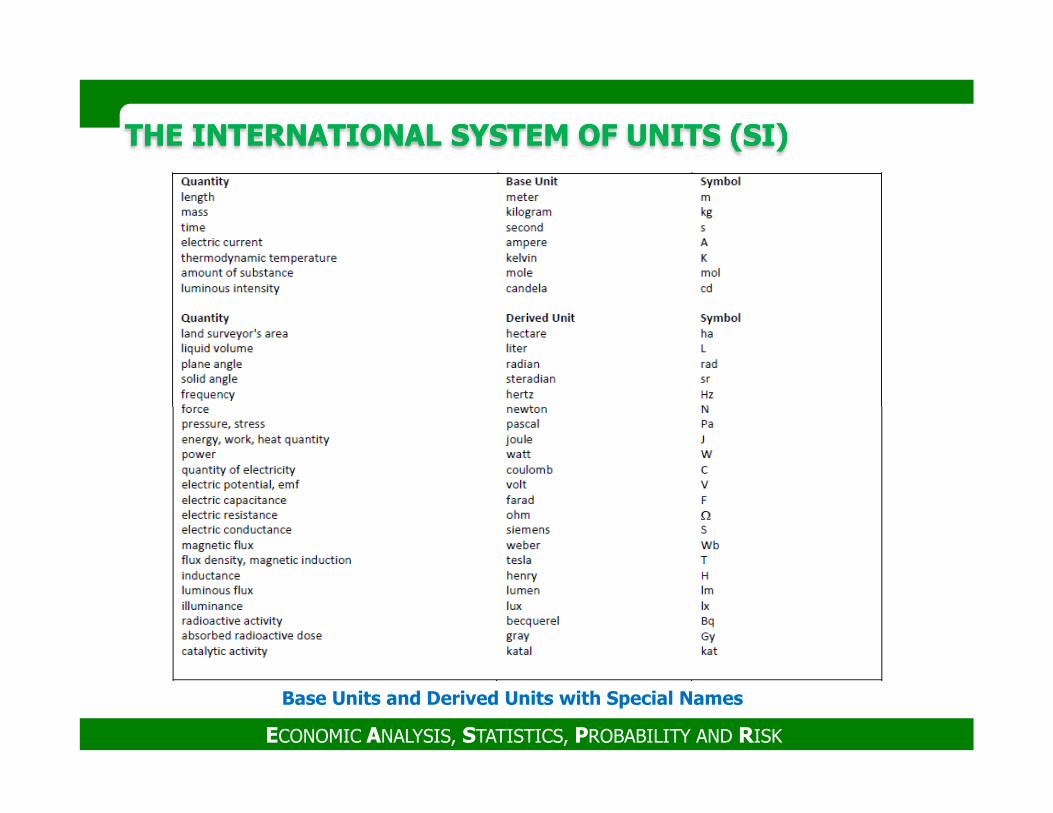
THE INTERNATIONAL SYSTEM OF UNITS (SI)THE INTERNATIONAL SYSTEM OF UNITS (SI)
ECONOMIC ANALYSIS, STATISTICS, PROBABILITY AND RISK
Base Units and Derived Units with Special Names
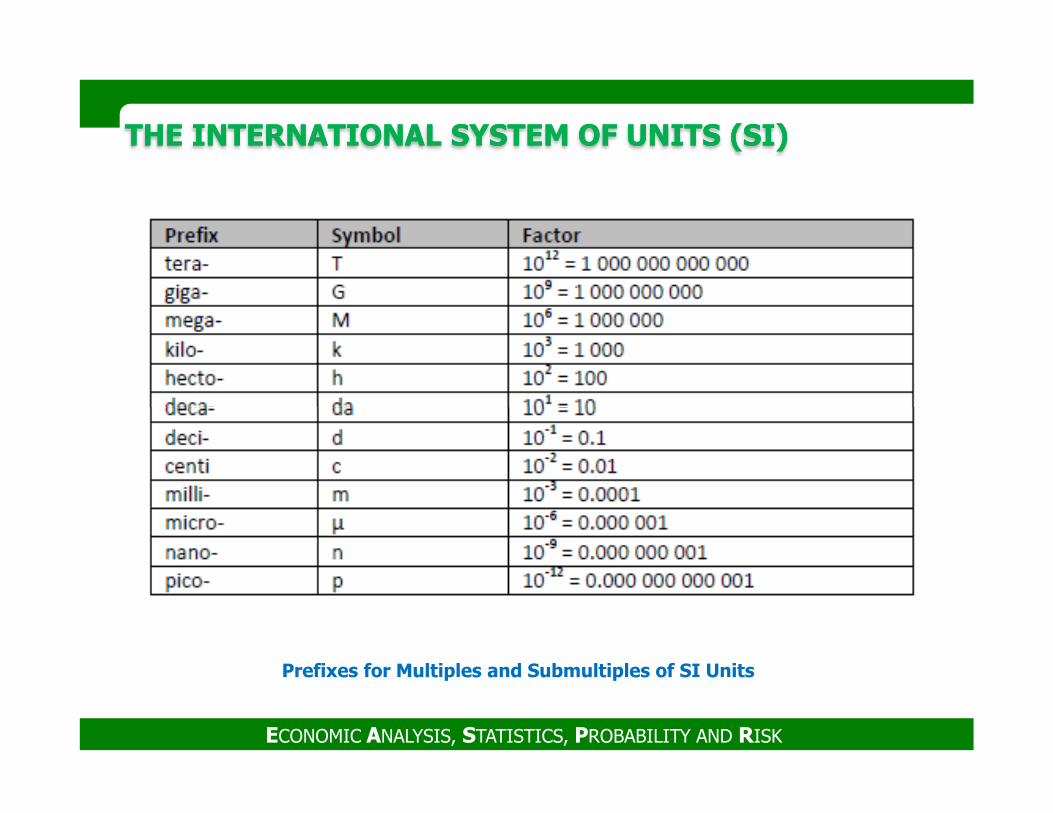
THE INTERNATIONAL SYSTEM OF UNITS (SI)THE INTERNATIONAL SYSTEM OF UNITS (SI)
ECONOMIC ANALYSIS, STATISTICS, PROBABILITY AND RISK
Prefixes for Multiples and Submultiples of SI Units
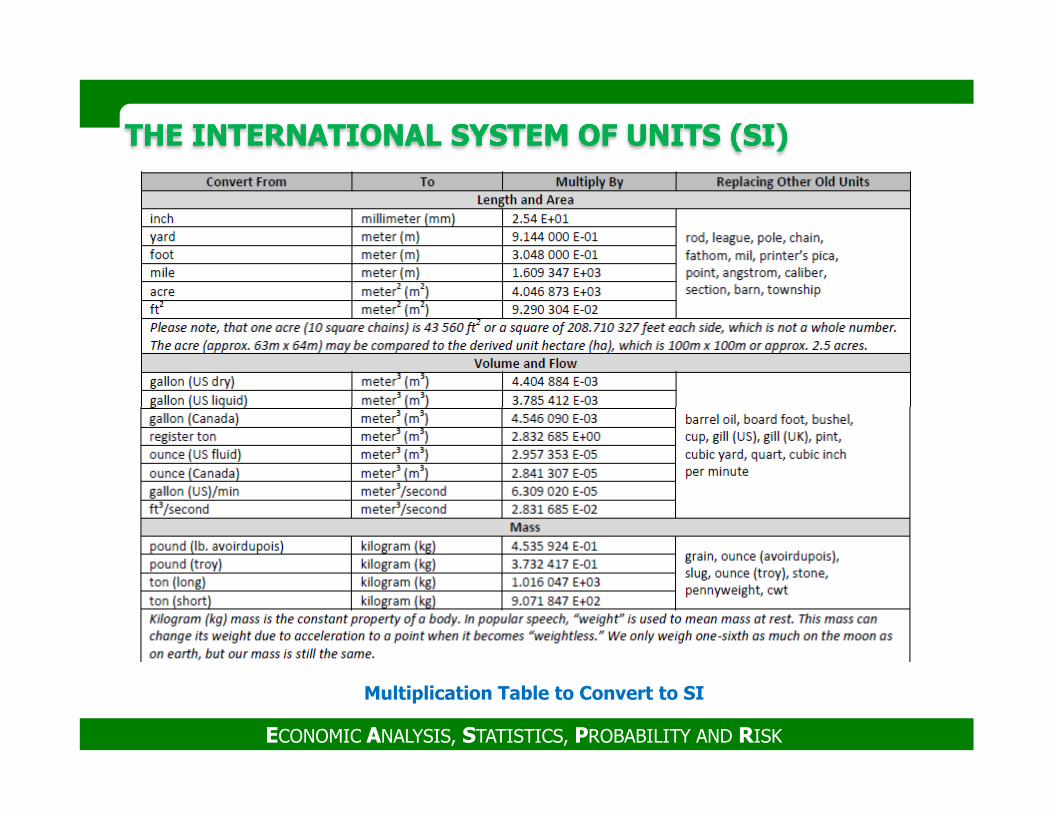
THE INTERNATIONAL SYSTEM OF UNITS (SI)THE INTERNATIONAL SYSTEM OF UNITS (SI)
ECONOMIC ANALYSIS, STATISTICS, PROBABILITY AND RISK
Multiplication Table to Convert to SI
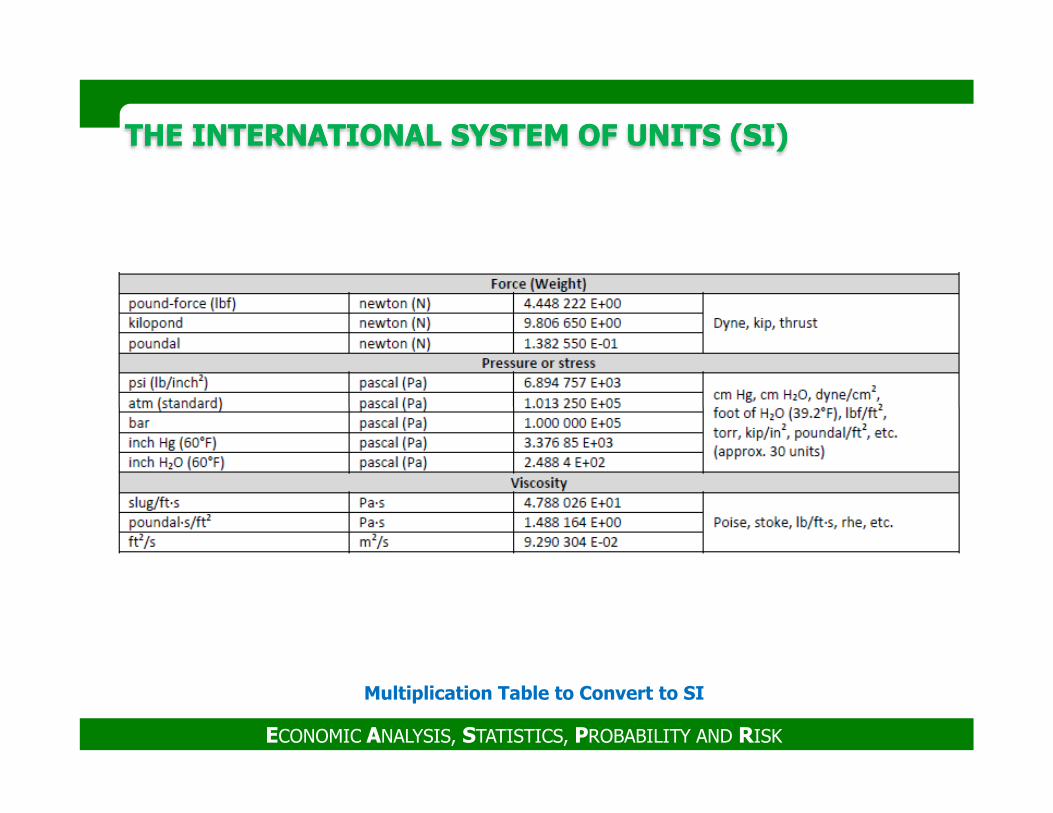
THE INTERNATIONAL SYSTEM OF UNITS (SI)THE INTERNATIONAL SYSTEM OF UNITS (SI)
ECONOMIC ANALYSIS, STATISTICS, PROBABILITY AND RISK
Multiplication Table to Convert to SI
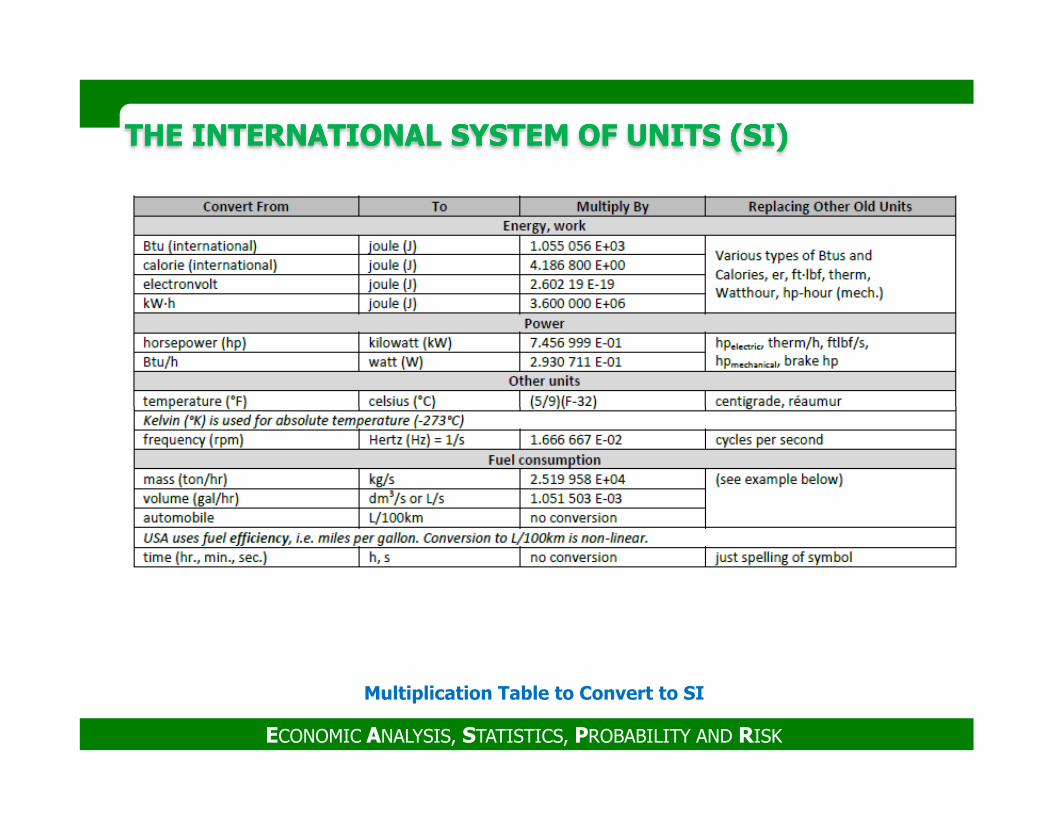
THE INTERNATIONAL SYSTEM OF UNITS (SI)THE INTERNATIONAL SYSTEM OF UNITS (SI)
ECONOMIC ANALYSIS, STATISTICS, PROBABILITY AND RISK
Multiplication Table to Convert to SI
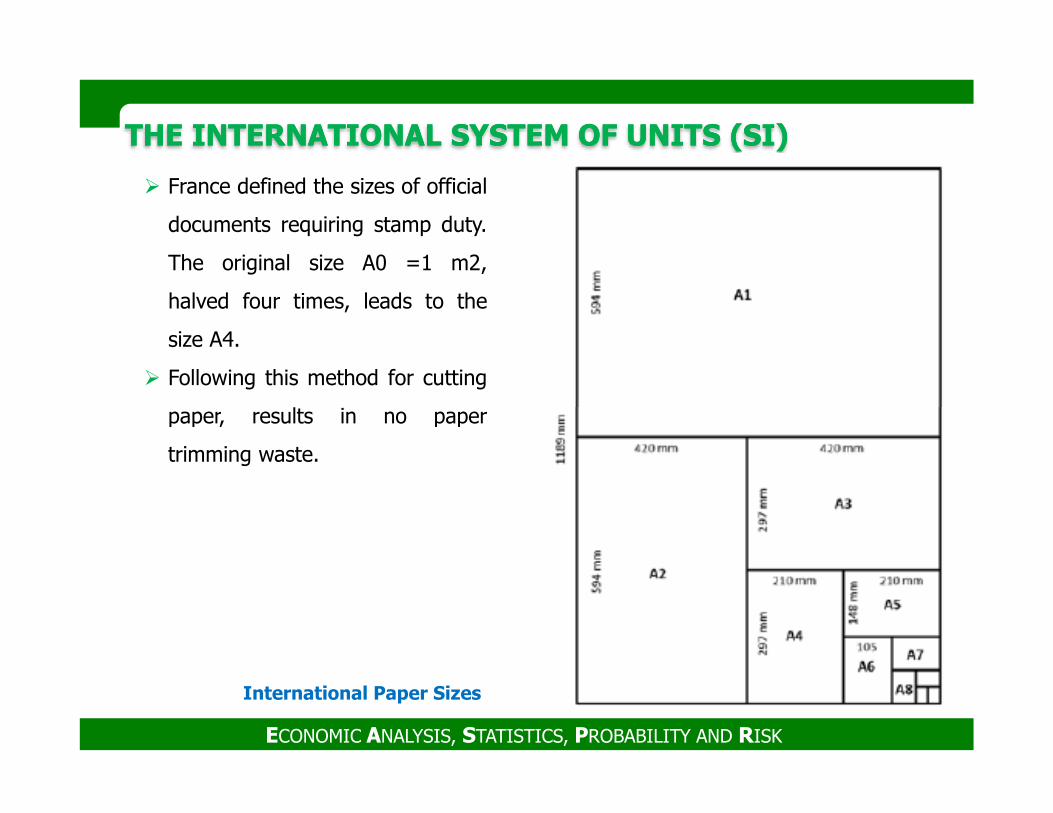
THE INTERNATIONAL SYSTEM OF UNITS (SI)THE INTERNATIONAL SYSTEM OF UNITS (SI)
� France defined the sizes of official
documents requiring stamp duty.
The original size A0 =1 m2,
halved four times, leads to the
size A4.
� Following this method for cutting
paper, results in no paper
ECONOMIC ANALYSIS, STATISTICS, PROBABILITY AND RISK
International Paper Sizes
paper, results in no paper
trimming waste.
THE INTERNATIONAL SYSTEM OF UNITS (SI)THE INTERNATIONAL SYSTEM OF UNITS (SI)
PLEASE CHECK THE 24 RULES FOR SI STYLE AND
USAGE
ECONOMIC ANALYSIS, STATISTICS, PROBABILITY AND RISK
USAGE
THANK YOU
ECONOMIC ANALYSIS, STATISTICS, PROBABILITY AND RISK