Embed Size (px)
Citation preview
http://piktochart.com/8-types-of-infographics-which-right-for-you/
www.ethinos.com
Sources:
Website:
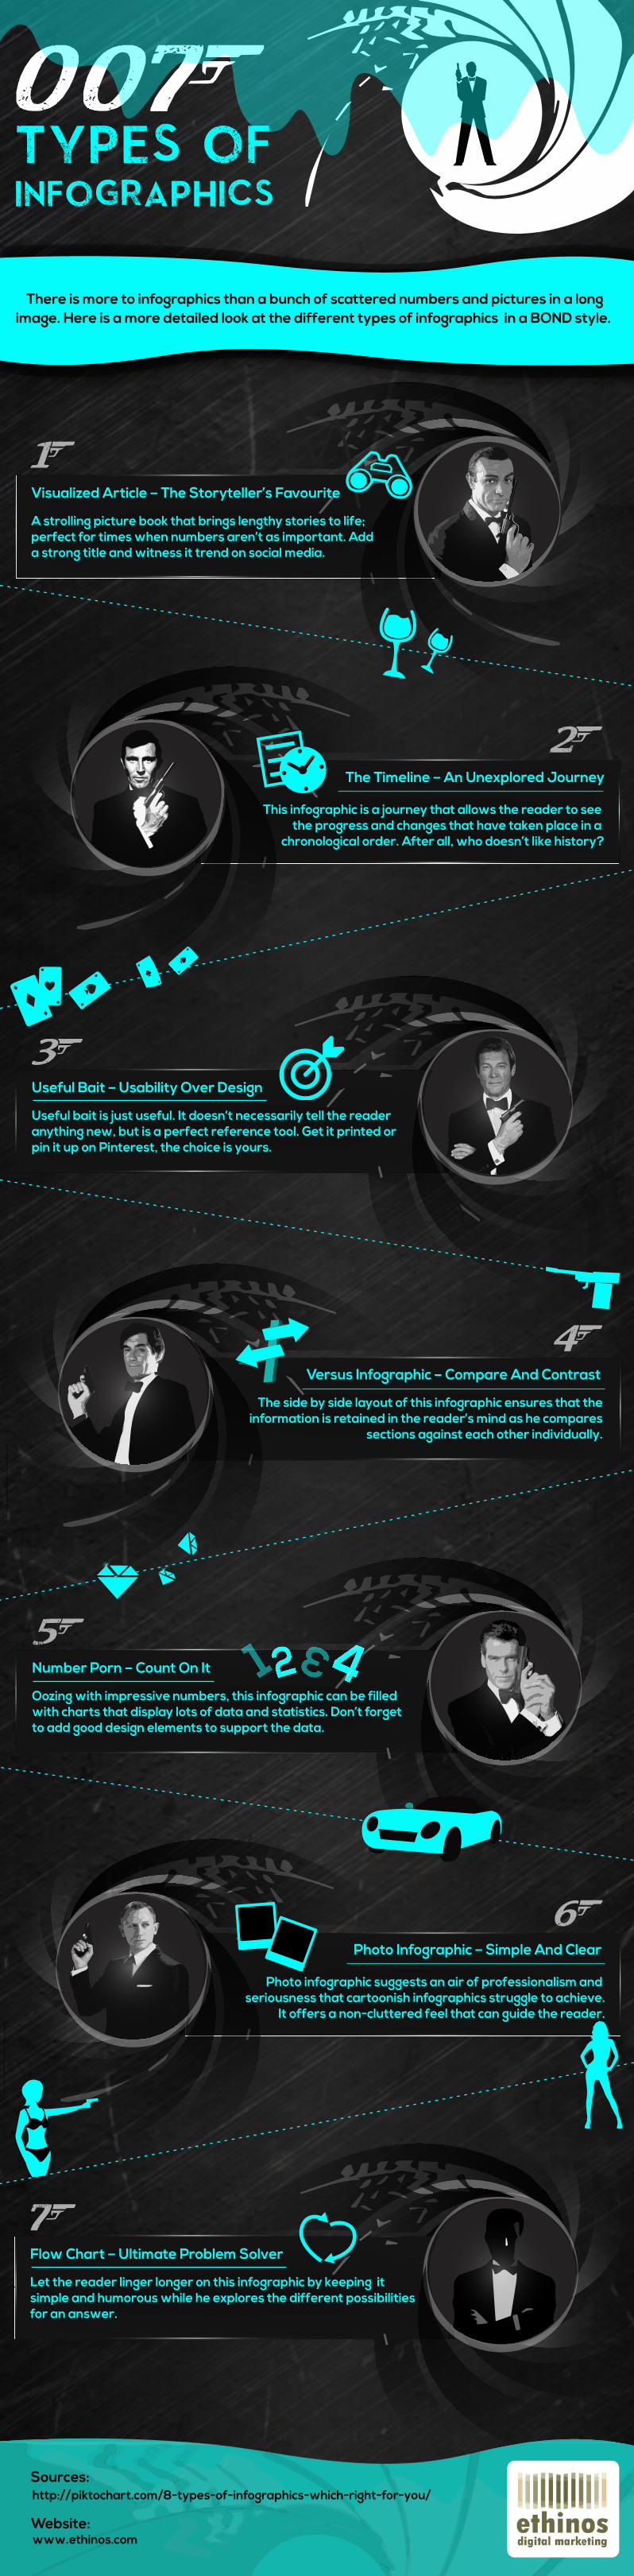
Visualized Article – The Storyteller’s Favourite
The Timeline – An Unexplored Journey
This infographic is a journey that allows the reader to see the progress and changes that have taken place in a
chronological order. After all, who doesn’t like history?
Useful Bait – Usability Over Design
Useful bait is just useful. It doesn’t necessarily tell the reader anything new, but is a perfect reference tool. Get it printed or pin it up on Pinterest, the choice is yours.
Number Porn – Count On It
Oozing with impressive numbers, this infographic can be filled with charts that display lots of data and statistics. Don’t forget to add good design elements to support the data.
Flow Chart – Ultimate Problem Solver
Let the reader linger longer on this infographic by keeping it simple and humorous while he explores the different possibilitiesfor an answer.
Versus Infographic – Compare And Contrast
Photo Infographic – Simple And Clear
Sources:
There is more to infographics than a bunch of scattered numbers and pictures in a longimage. Here is a more detailed look at the different types of infographics in a BOND style.
http://piktochart.com/8-types-of-infographics-which-right-for-you/
www.ethinos.com
Sources:
Website:
12 43
Photo infographic suggests an air of professionalism and seriousness that cartoonish infographics struggle to achieve.
It offers a non-cluttered feel that can guide the reader.
The side by side layout of this infographic ensures that the information is retained in the reader’s mind as he compares
sections against each other individually.
A strolling picture book that brings lengthy stories to life; perfect for times when numbers aren’t as important. Add a strong title and witness it trend on social media.