Embed Size (px)
Citation preview

2015 Holiday
Sales Season
1
For advertising information, please contact:
Republic Media Advertising
Email: [email protected]
Phone: 602.444.4920
Agenda
2014 Holiday Season Sales Recap
Predictions for 2015 Holiday Season
Predictions for 2015 Holiday Season in Phoenix
(Information coming soon!)
2
‘Tis the season...to shop
The holidays may still be a few months away, but
consumers are already gearing up for the year’s biggest
shopping season.
They’re searching for deals and checking them twice
across a variety of screens (mobile, increasingly).
Given that the holiday shopping season kicks off earlier
every year, here are some seasonal highlights from last
year.
3

SALES RECAP
Holiday Season 2014
4
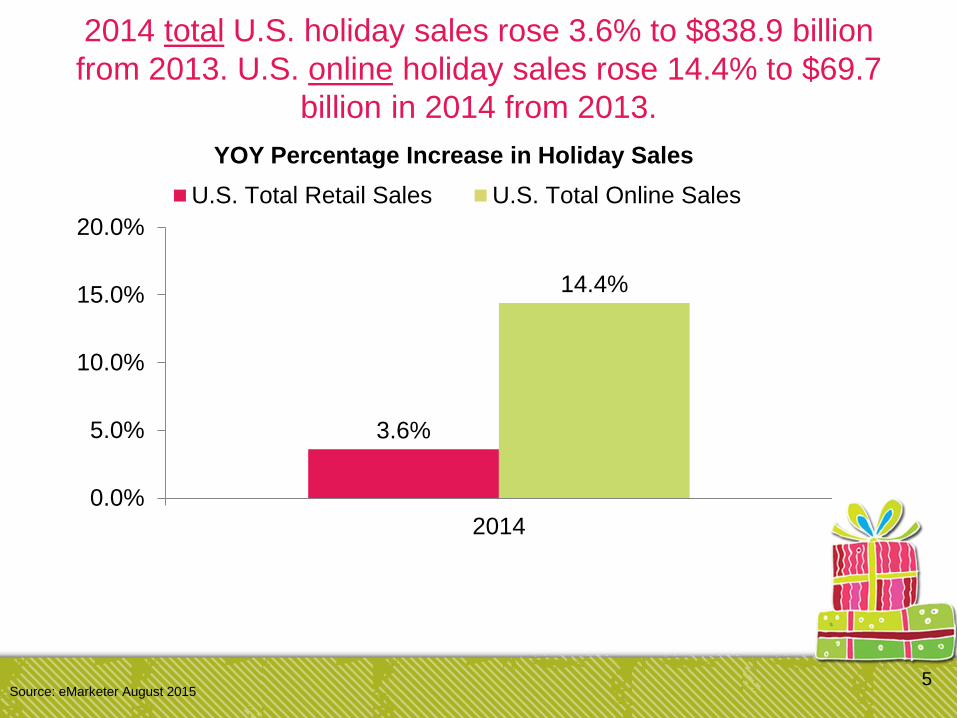
2014 total U.S. holiday sales rose 3.6% to $838.9 billion
from 2013. U.S. online holiday sales rose 14.4% to $69.7
billion in 2014 from 2013.
3.6%
14.4%
0.0%
5.0%
10.0%
15.0%
20.0%
2014
YOY Percentage Increase in Holiday Sales
U.S. Total Retail Sales U.S. Total Online Sales
Source: eMarketer August 20155
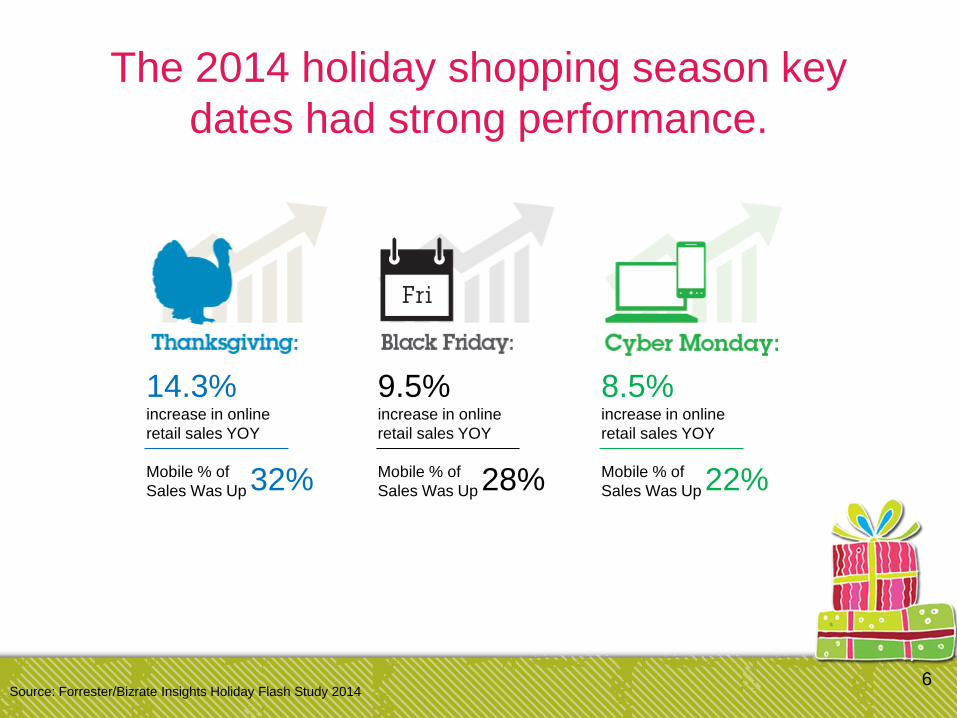
The 2014 holiday shopping season key
dates had strong performance.
Source: Forrester/Bizrate Insights Holiday Flash Study 20146
14.3% increase in online
retail sales YOY
Mobile % of
Sales Was Up 32%
9.5% increase in online
retail sales YOY
Mobile % of
Sales Was Up 28%
8.5% increase in online
retail sales YOY
Mobile % of
Sales Was Up 22%
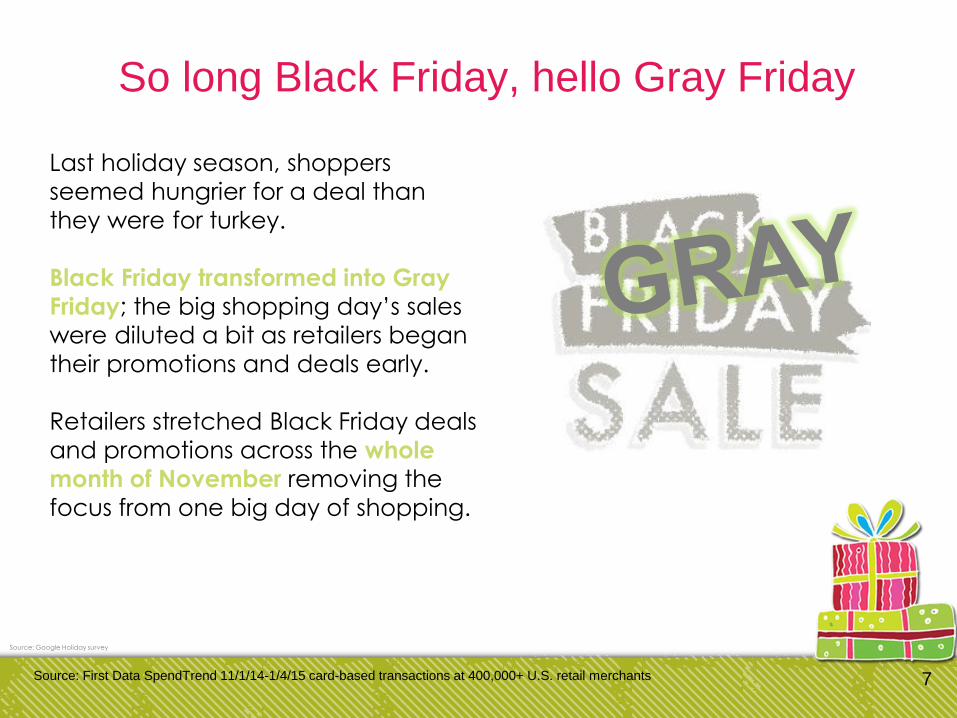
So long Black Friday, hello Gray Friday
Source: First Data SpendTrend 11/1/14-1/4/15 card-based transactions at 400,000+ U.S. retail merchants 7
Last holiday season, shoppers
seemed hungrier for a deal than
they were for turkey.
Black Friday transformed into Gray
Friday; the big shopping day’s sales
were diluted a bit as retailers began
their promotions and deals early.
Retailers stretched Black Friday deals
and promotions across the whole
month of November removing the
focus from one big day of shopping.
Source: Google Holiday survey
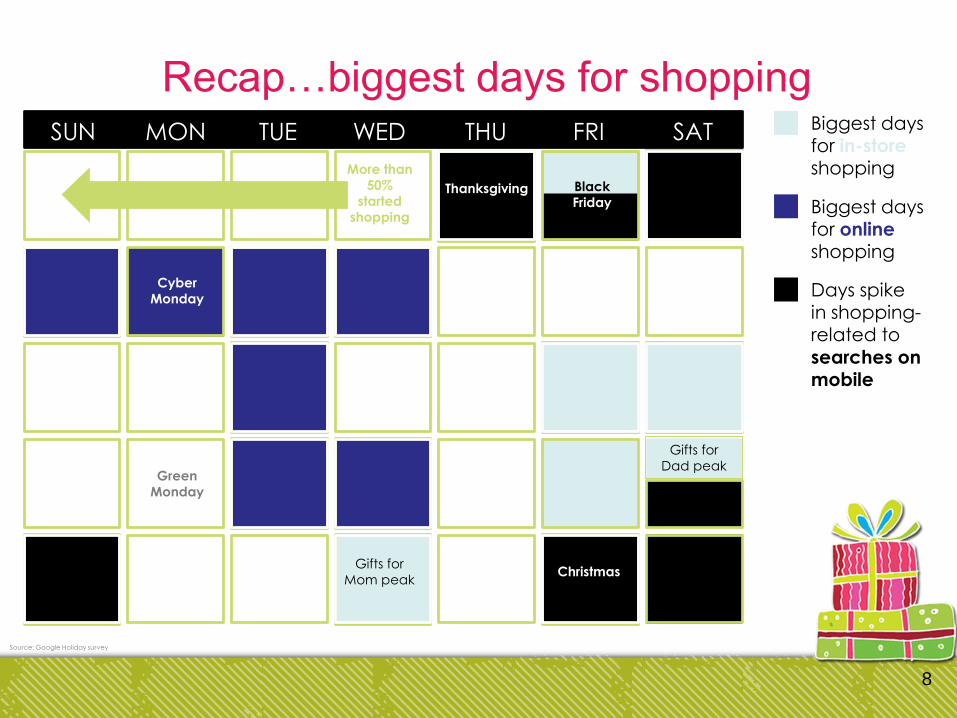
Recap…biggest days for shopping
8
Source: Google Holiday survey
SUN MON TUE WED THU FRI SAT
Thanksgiving
More than
50%
started
shopping
Biggest days for in-store shopping
Biggest days for onlineshopping
Days spike in shopping-related to
searches on mobile
Black
Friday
Cyber
Monday
Green
Monday
Gifts for
Dad peak
ChristmasGifts for
Mom peak
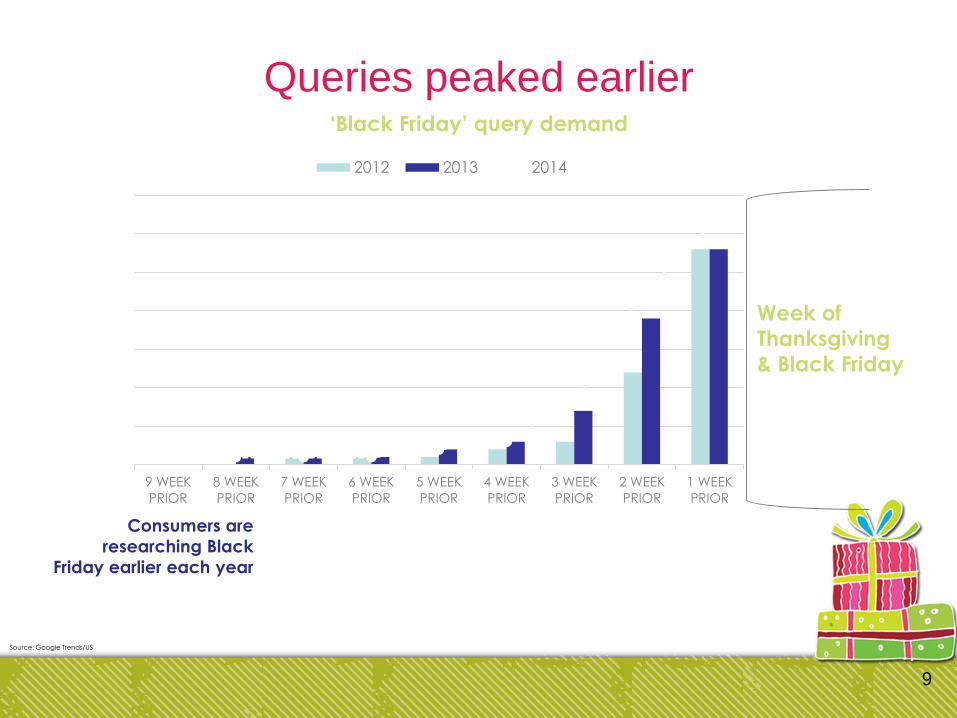
Queries peaked earlier
9
Week of
Thanksgiving
& Black Friday
9 WEEK
PRIOR
8 WEEK
PRIOR
7 WEEK
PRIOR
6 WEEK
PRIOR
5 WEEK
PRIOR
4 WEEK
PRIOR
3 WEEK
PRIOR
2 WEEK
PRIOR
1 WEEK
PRIOR
2012 2013 2014
‘Black Friday’ query demand
Consumers are
researching Black
Friday earlier each year
Source: Google Trends/US
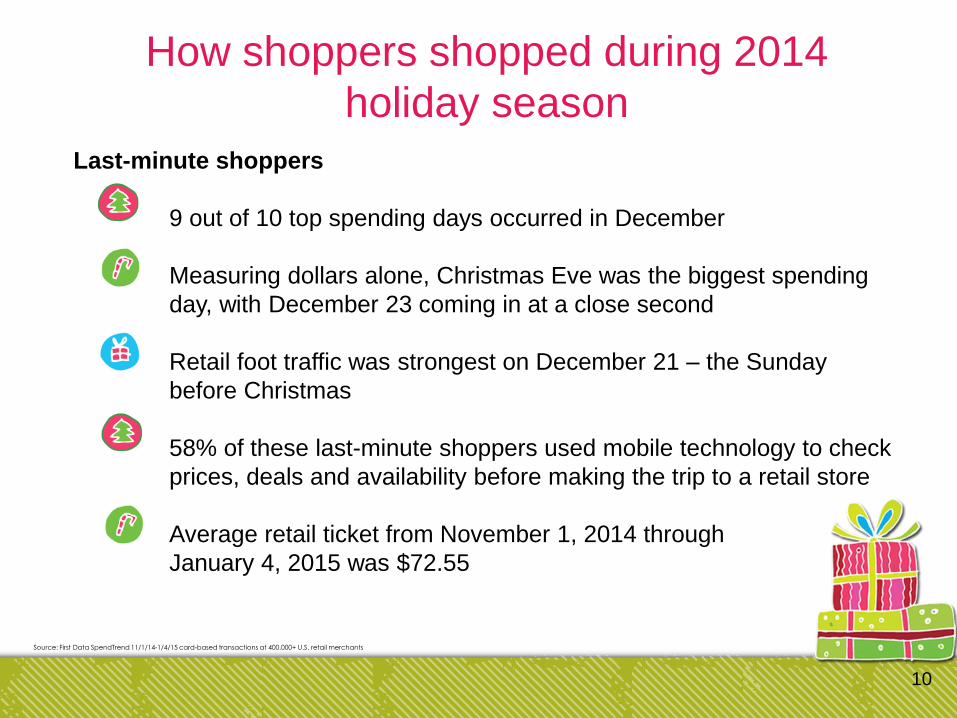
How shoppers shopped during 2014
holiday season
Source: First Data SpendTrend 11/1/14-1/4/15 card-based transactions at 400,000+ U.S. retail merchants
10
Last-minute shoppers
9 out of 10 top spending days occurred in December
Measuring dollars alone, Christmas Eve was the biggest spending
day, with December 23 coming in at a close second
Retail foot traffic was strongest on December 21 – the Sunday
before Christmas
58% of these last-minute shoppers used mobile technology to check
prices, deals and availability before making the trip to a retail store
Average retail ticket from November 1, 2014 through
January 4, 2015 was $72.55
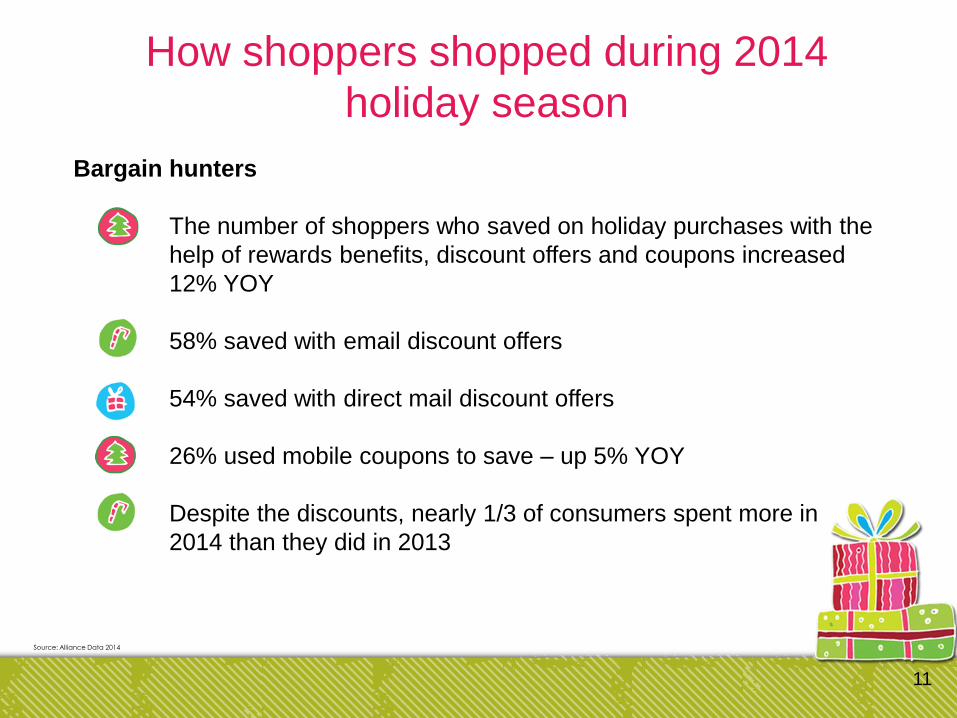
How shoppers shopped during 2014
holiday season
Source: Alliance Data 2014
11
Bargain hunters
The number of shoppers who saved on holiday purchases with the
help of rewards benefits, discount offers and coupons increased
12% YOY
58% saved with email discount offers
54% saved with direct mail discount offers
26% used mobile coupons to save – up 5% YOY
Despite the discounts, nearly 1/3 of consumers spent more in
2014 than they did in 2013
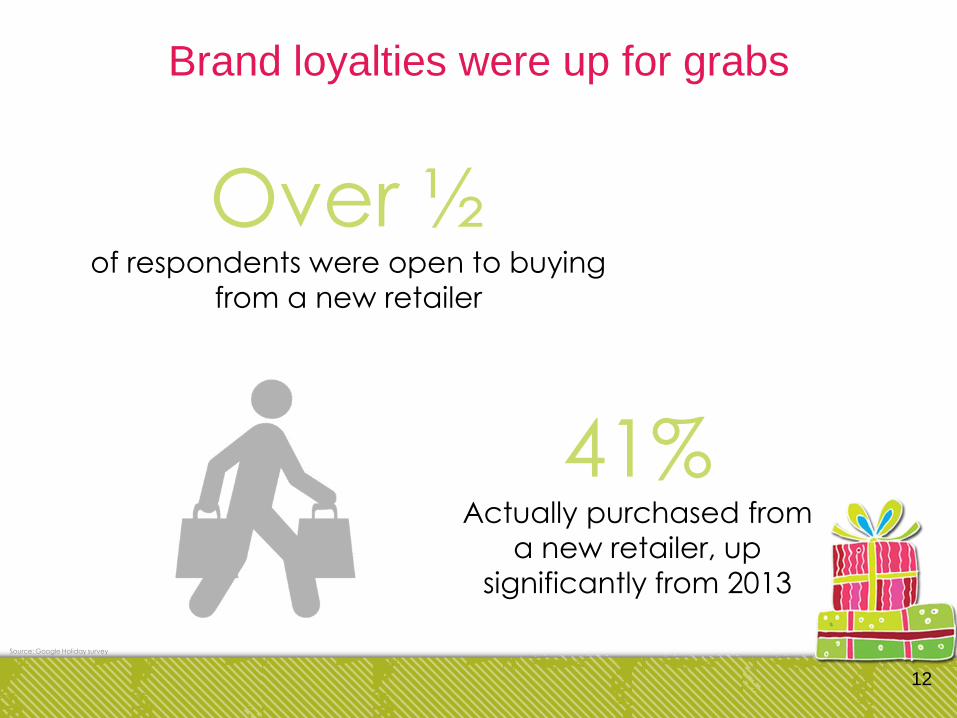
Brand loyalties were up for grabs
12
Source: Google Holiday survey
Over ½of respondents were open to buying
from a new retailer
41%Actually purchased from
a new retailer, up
significantly from 2013
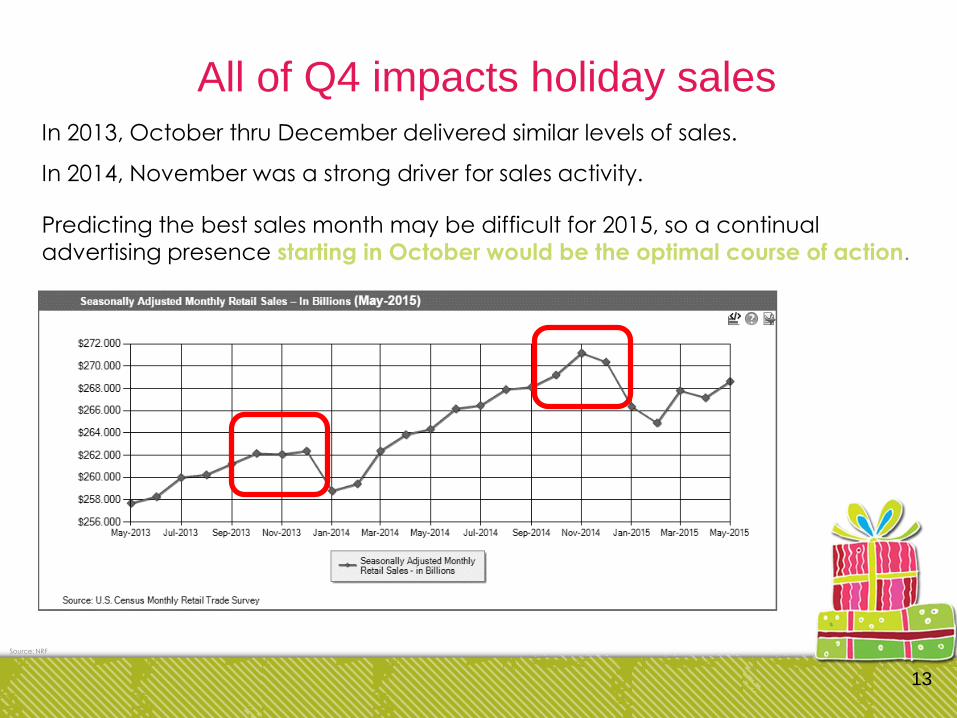
All of Q4 impacts holiday sales
13
In 2013, October thru December delivered similar levels of sales.
In 2014, November was a strong driver for sales activity.
Predicting the best sales month may be difficult for 2015, so a continual
advertising presence starting in October would be the optimal course of action.
Source: NRF
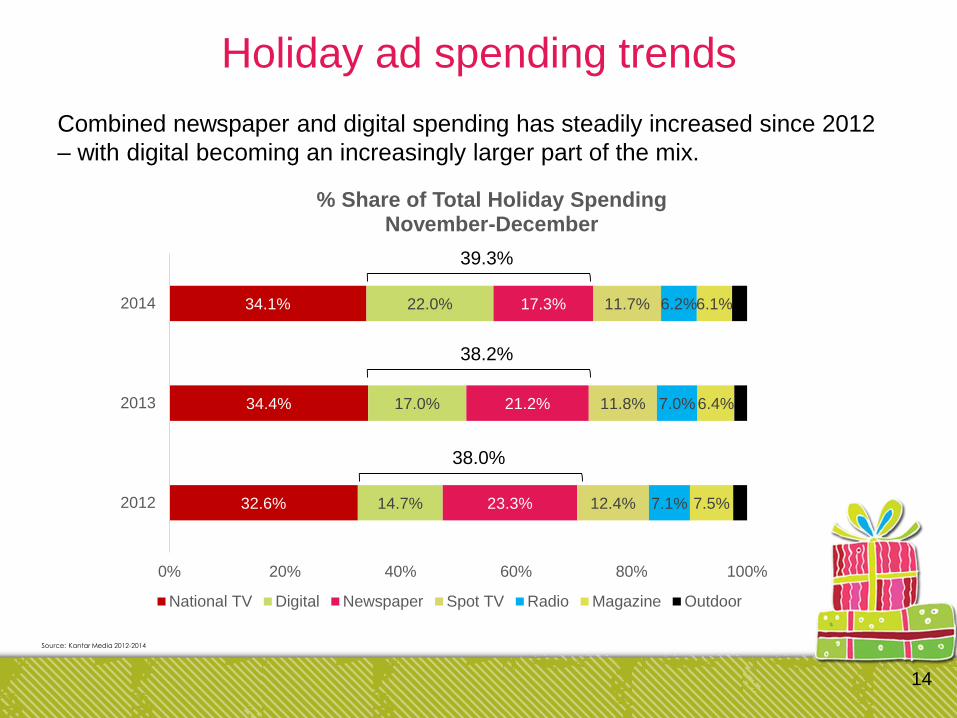
Holiday ad spending trends
Source: Kantar Media 2012-2014
14
32.6%
34.4%
34.1%
14.7%
17.0%
22.0%
23.3%
21.2%
17.3%
12.4%
11.8%
11.7%
7.1%
7.0%
6.2%
7.5%
6.4%
6.1%
0% 20% 40% 60% 80% 100%
2012
2013
2014
% Share of Total Holiday SpendingNovember-December
National TV Digital Newspaper Spot TV Radio Magazine Outdoor
39.3%
38.2%
38.0%
Combined newspaper and digital spending has steadily increased since 2012
– with digital becoming an increasingly larger part of the mix.
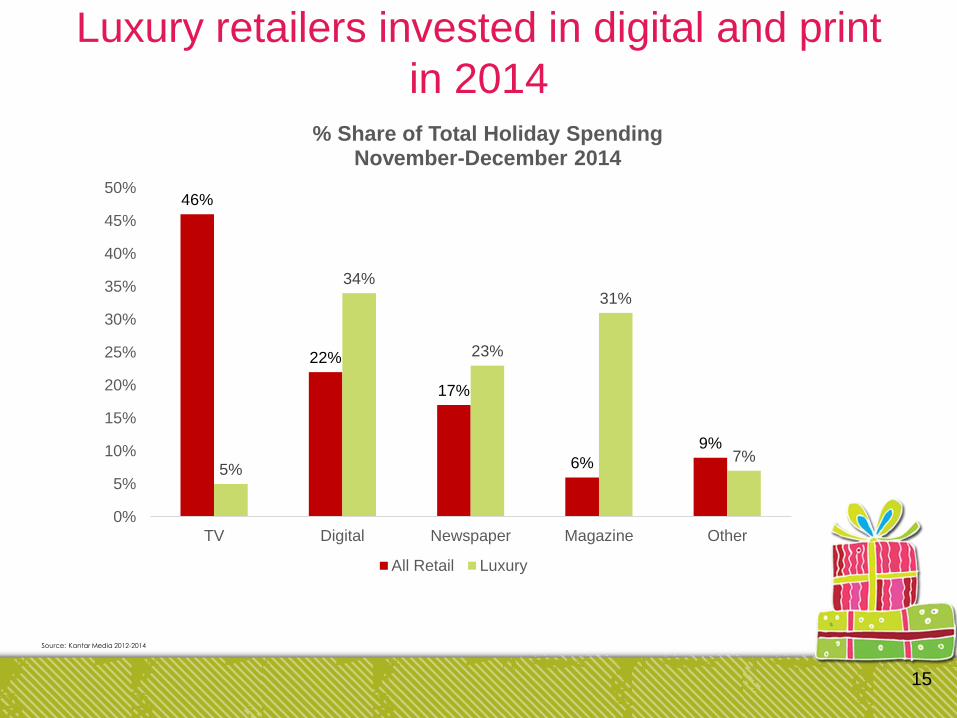
Luxury retailers invested in digital and print
in 2014
Source: Kantar Media 2012-2014
15
46%
22%
17%
6%
9%
5%
34%
23%
31%
7%
0%
5%
10%
15%
20%
25%
30%
35%
40%
45%
50%
TV Digital Newspaper Magazine Other
% Share of Total Holiday SpendingNovember-December 2014
All Retail Luxury
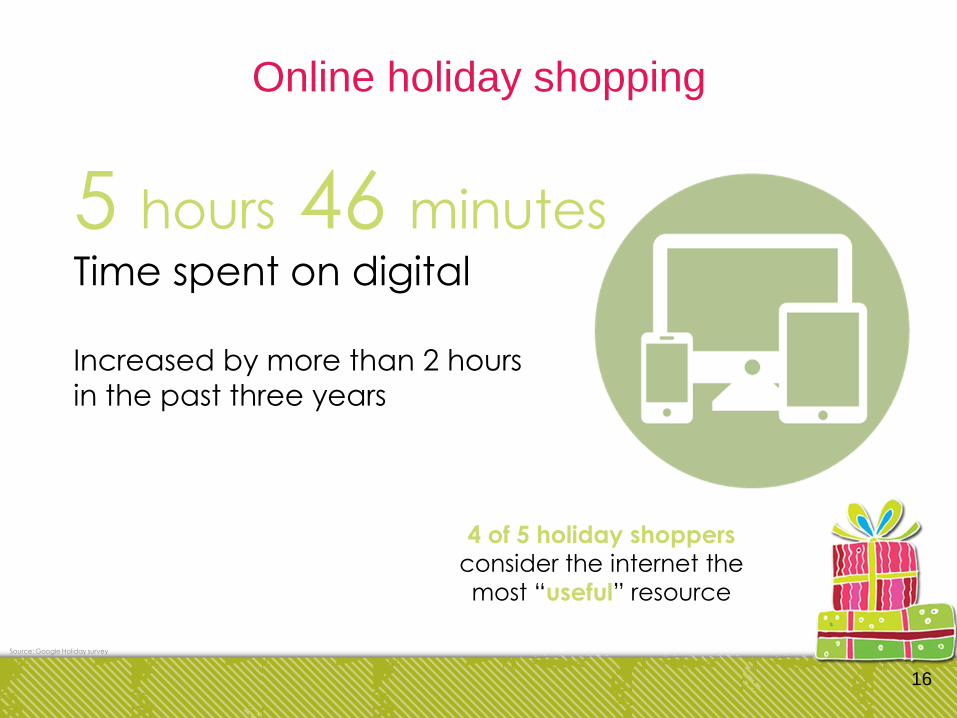
Online holiday shopping
16
5 hours 46 minutesTime spent on digital
Increased by more than 2 hours
in the past three years
Source: Google Holiday survey
4 of 5 holiday shoppers
consider the internet the
most “useful” resource
Happy (mobile) Holidays in 2014 – 52% of online
traffic in 2014 came from mobile devicesRetailers sent 34% more push notifications in 2014 compared to 2013
Consumers’ engagement rate with push notifications doubled YOY
More than 1/3 of all retail app opens were the result of push notifications
Shoppers were most receptive to retailers’ notifications on the Saturday before
Thanksgiving with a 19% average engagement rate – making mobile’s role in pre-
shopping activities abundantly clear
Weekends, when shoppers have more leisure time, consistently show greater
spikes in engagement – a huge missed opportunity for retailers as send volumes
usually dip outside the workweek
On Thanksgiving, notifications drove 42% of all app opens
On Black Friday, notification engagement rates jumped 30% compared to
Thanksgiving and remained steady at 14-15% through the weekend
On Cyber Monday, notification send volume increased 50% from the day
prior, but engagement rates dropped 12%
17
Source: Urban Airship 2015 – analyzed data from same 150 retail apps through Cyber Week for 2013 and 2014
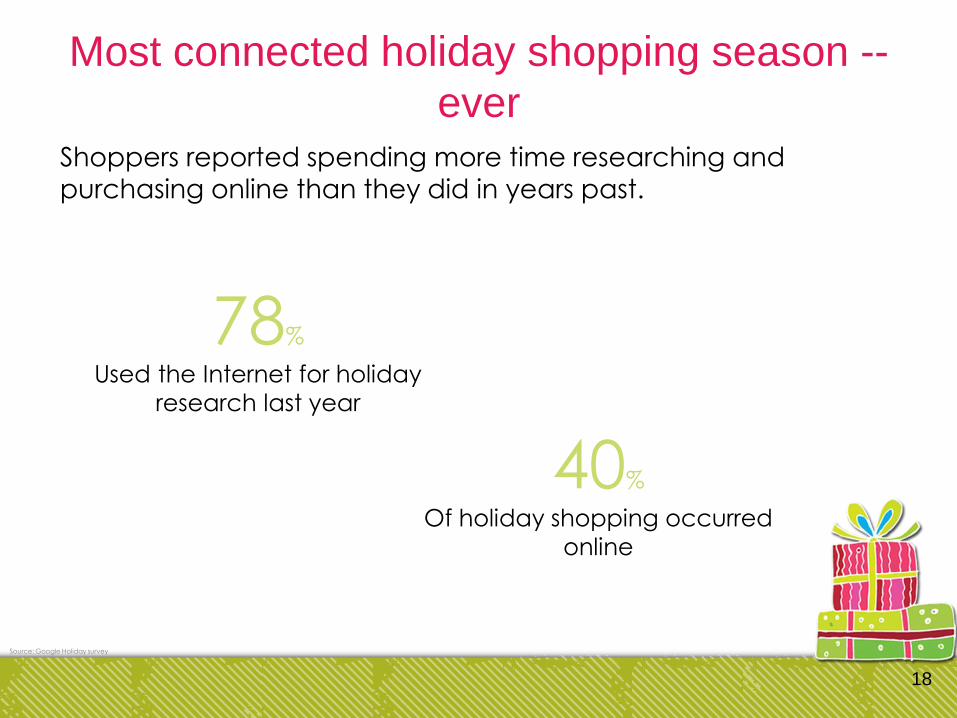
Most connected holiday shopping season --
ever
18
78%
Used the Internet for holiday
research last year
Source: Google Holiday survey
Shoppers reported spending more time researching and
purchasing online than they did in years past.
40%
Of holiday shopping occurred
online
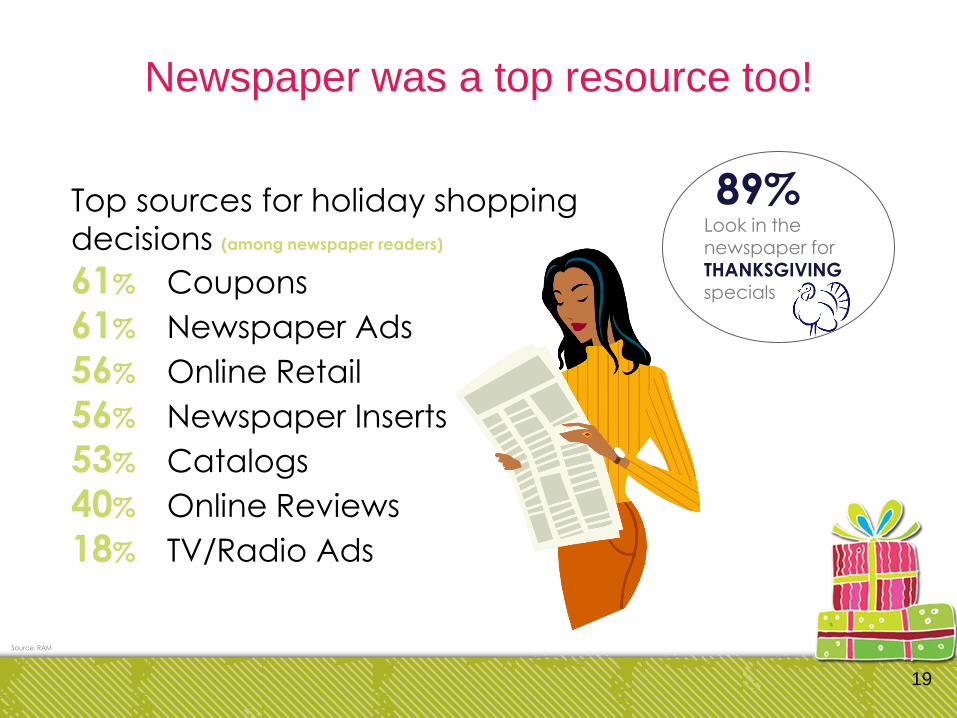
Newspaper was a top resource too!
19
Top sources for holiday shopping
decisions (among newspaper readers)
61% Coupons
61% Newspaper Ads
56% Online Retail
56% Newspaper Inserts
53% Catalogs
40% Online Reviews
18% TV/Radio Ads
Source: RAM
89%Look in the newspaper for THANKSGIVINGspecials
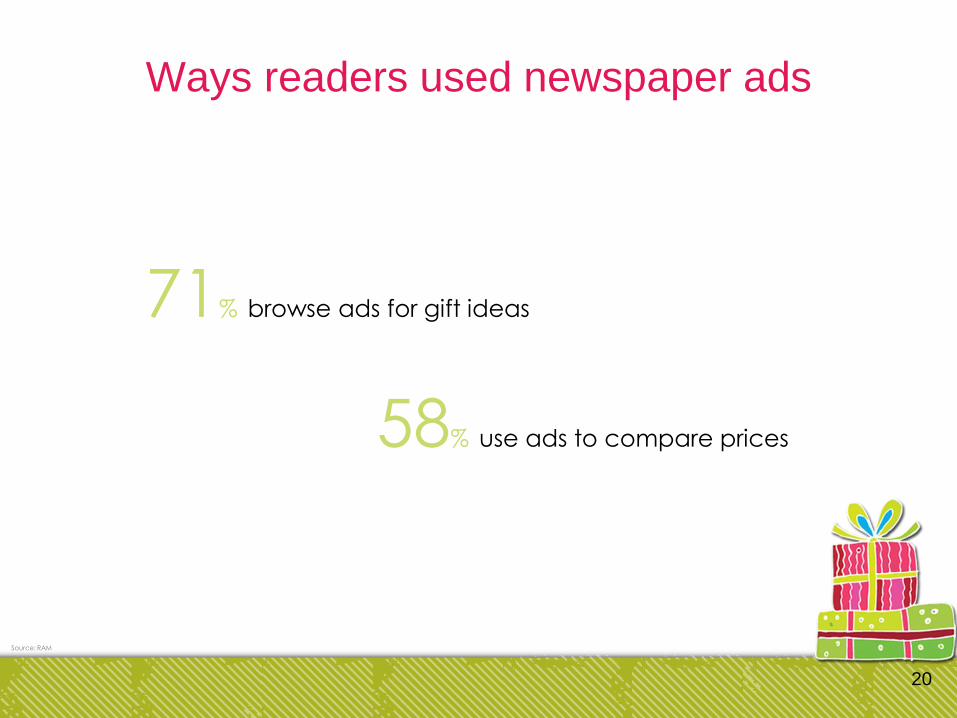
Ways readers used newspaper ads
20
Source: RAM
71% browse ads for gift ideas
58% use ads to compare prices
PROJECTIONS
Holiday Season 2015
21
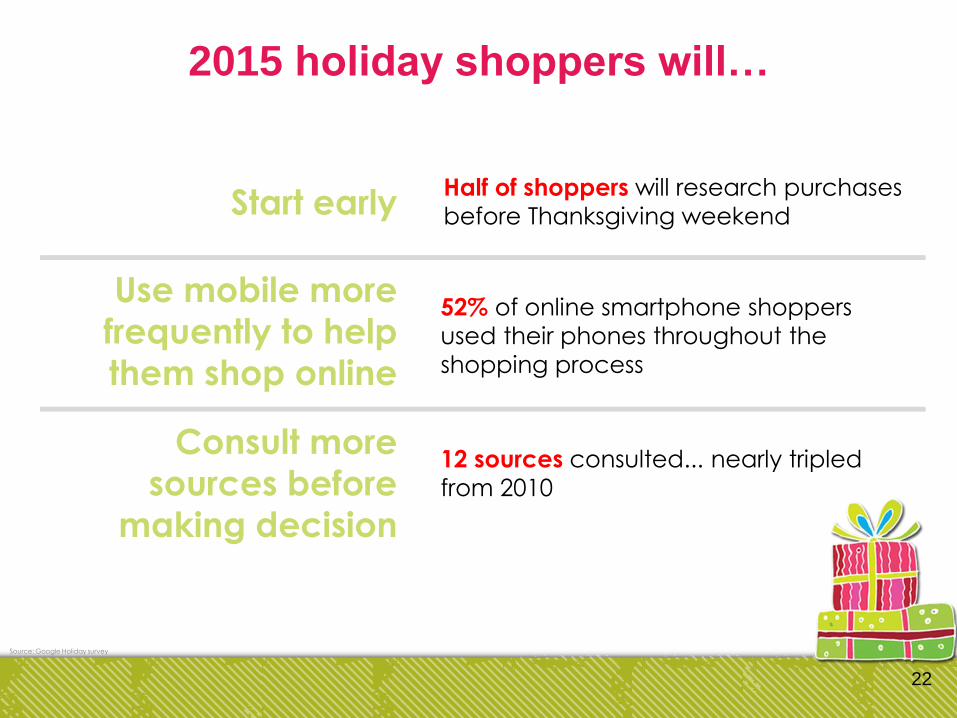
2015 holiday shoppers will…
22
Start early
Use mobile more
frequently to help
them shop online
Half of shoppers will research purchases
before Thanksgiving weekend
52% of online smartphone shoppers
used their phones throughout the
shopping process
Source: Google Holiday survey
Consult more
sources before
making decision
12 sources consulted... nearly tripled
from 2010
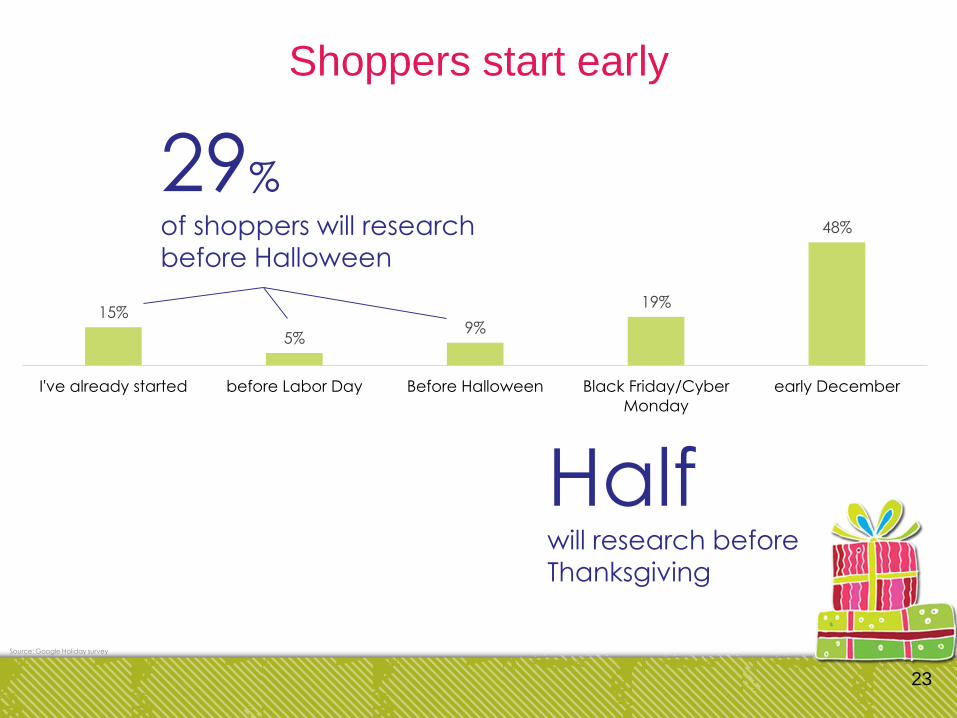
Shoppers start early
23
Source: Google Holiday survey
15%
5%9%
19%
48%
I've already started before Labor Day Before Halloween Black Friday/Cyber
Monday
early December
29%of shoppers will research
before Halloween
Halfwill research before
Thanksgiving
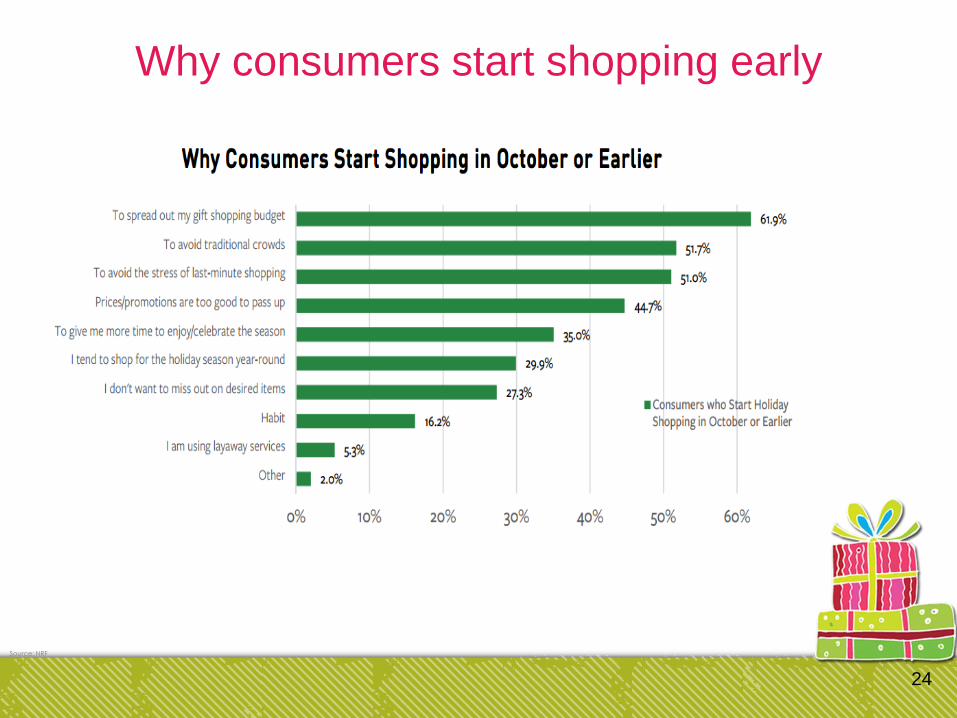
Why consumers start shopping early
24
Source: NRF
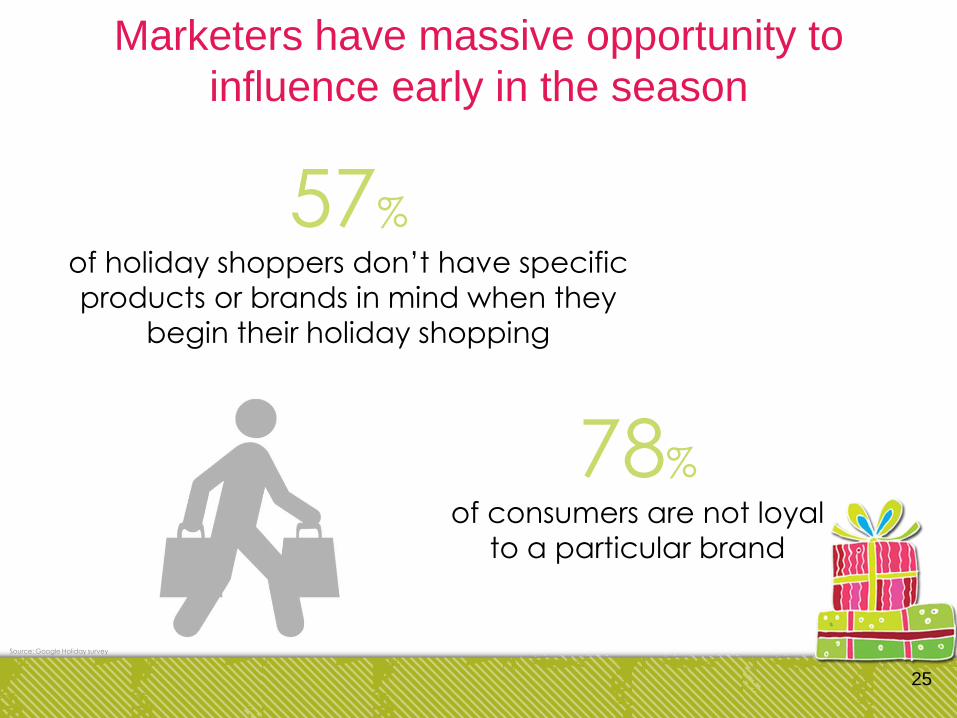
Marketers have massive opportunity to
influence early in the season
25
Source: Google Holiday survey
57%of holiday shoppers don’t have specific
products or brands in mind when they
begin their holiday shopping
78%of consumers are not loyal
to a particular brand
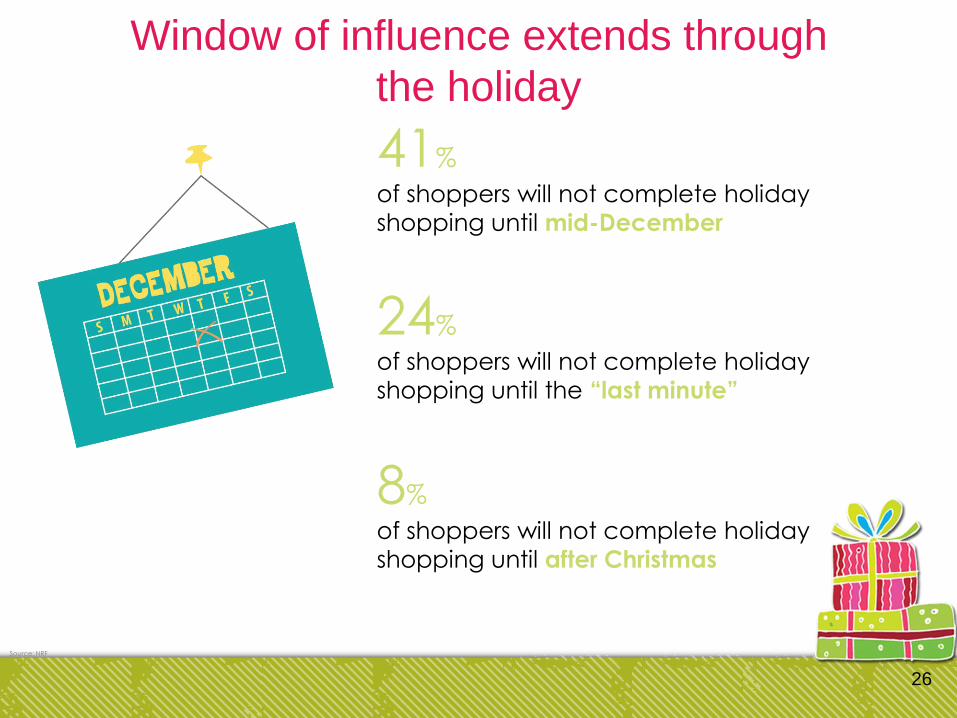
Window of influence extends through
the holiday
26
Source: NRF
41%
of shoppers will not complete holiday
shopping until mid-December
24%
of shoppers will not complete holiday
shopping until the “last minute”
8%
of shoppers will not complete holiday
shopping until after Christmas day
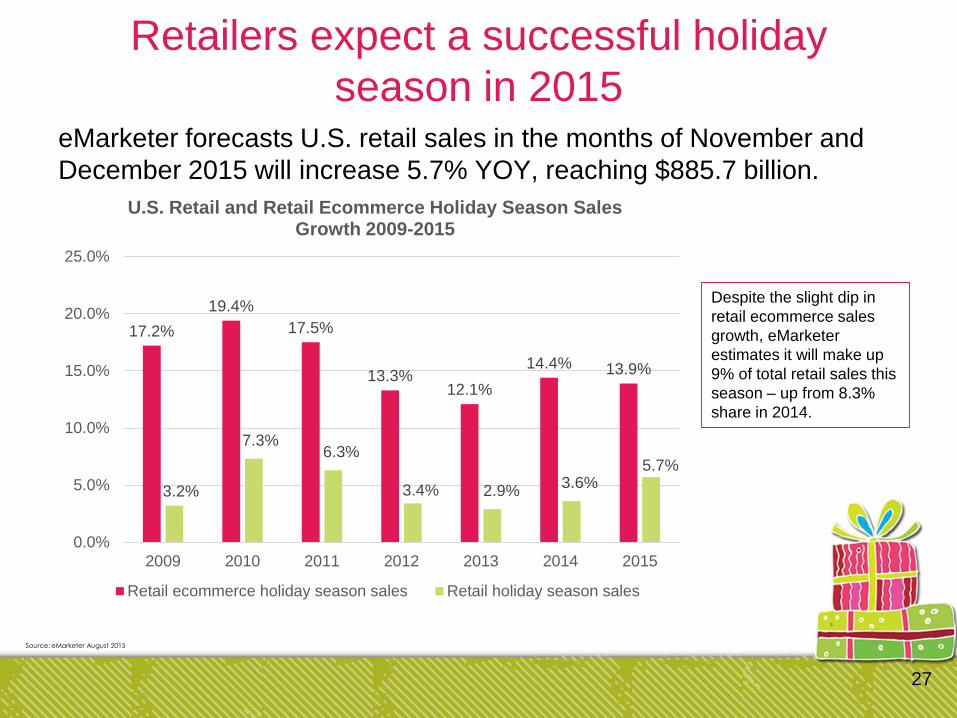
Retailers expect a successful holiday
season in 2015eMarketer forecasts U.S. retail sales in the months of November and
December 2015 will increase 5.7% YOY, reaching $885.7 billion.
27
Source: eMarketer August 2015
17.2%
19.4%
17.5%
13.3%12.1%
14.4% 13.9%
3.2%
7.3%6.3%
3.4% 2.9%3.6%
5.7%
0.0%
5.0%
10.0%
15.0%
20.0%
25.0%
2009 2010 2011 2012 2013 2014 2015
U.S. Retail and Retail Ecommerce Holiday Season Sales Growth 2009-2015
Retail ecommerce holiday season sales Retail holiday season sales
Despite the slight dip in
retail ecommerce sales
growth, eMarketer
estimates it will make up
9% of total retail sales this
season – up from 8.3%
share in 2014.
2015 will be first real test of a new wave of
social ecommerce
Over the past year, Facebook, Pinterest, Instagram, Twitter and YouTube all
introduced “buy” or “shop now” buttons that significantly ease the process of
purchasing from these sites – especially on mobile devices.
Facebook and Pinterest are the social networks responsible for most referrals
to retailer websites, making retailers most interested in their buy button
offerings.
Both store credit card information, allowing people to purchase using
just a few clicks within the platform.
Neither platform takes a cut from the purchase.
They added these buy buttons to make on-site conversions easier
and more trackable, which will make their advertising more
valuable to retailers.
28
Source: eMarketer August 2015
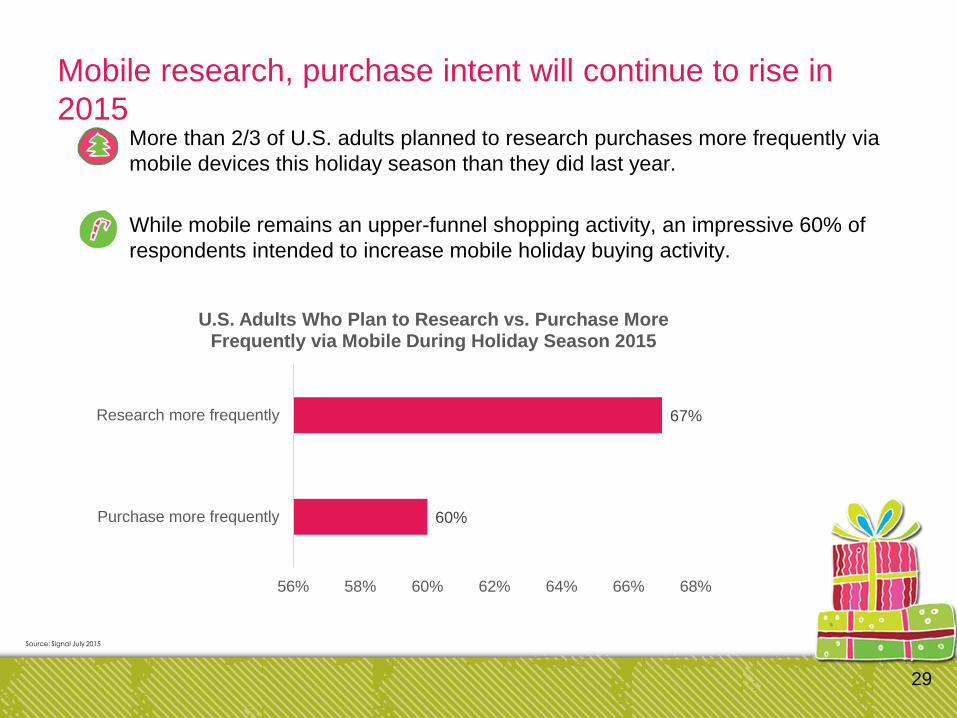
Mobile research, purchase intent will continue to rise in
2015More than 2/3 of U.S. adults planned to research purchases more frequently via
mobile devices this holiday season than they did last year.
While mobile remains an upper-funnel shopping activity, an impressive 60% of
respondents intended to increase mobile holiday buying activity.
29
Source: Signal July 2015
60%
67%
56% 58% 60% 62% 64% 66% 68%
Purchase more frequently
Research more frequently
U.S. Adults Who Plan to Research vs. Purchase More Frequently via Mobile During Holiday Season 2015
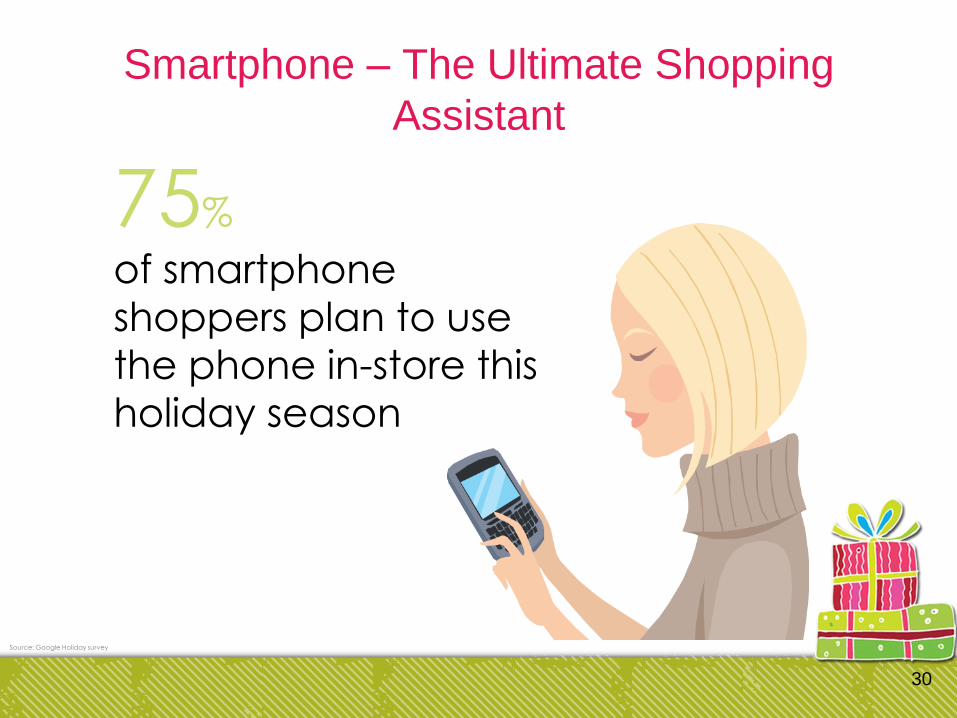
Smartphone – The Ultimate Shopping
Assistant
30
75%
of smartphone
shoppers plan to use
the phone in-store this
holiday season
Source: Google Holiday survey

PHOENIX MARKET
Holiday Season 2015
31
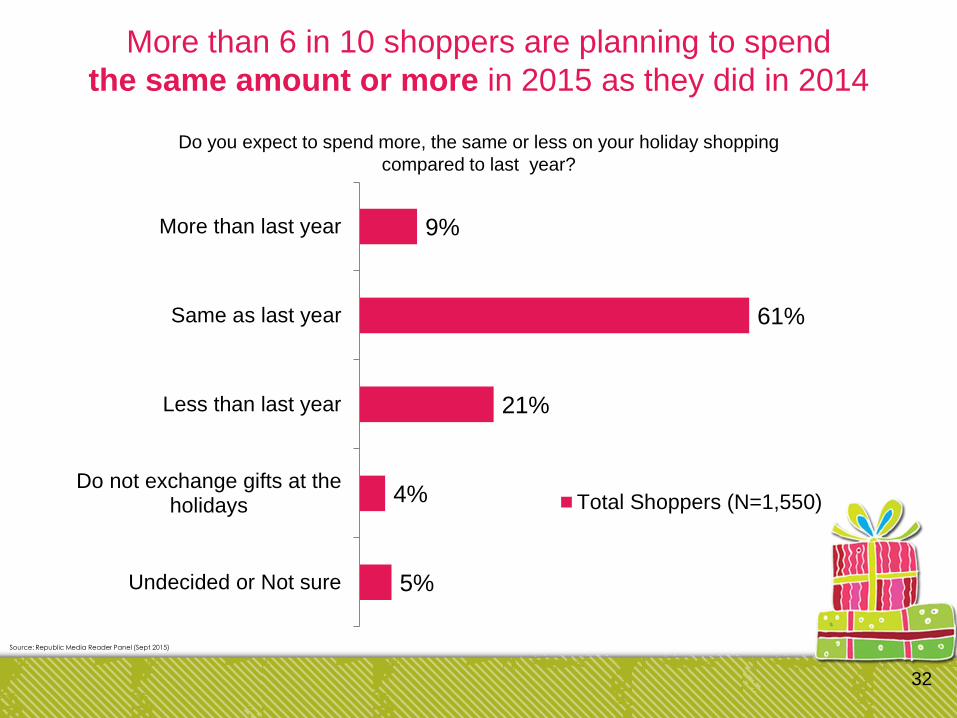
More than 6 in 10 shoppers are planning to spend
the same amount or more in 2015 as they did in 2014
32
Source: Republic Media Reader Panel (Sept 2015)
9%
61%
21%
4%
5%
More than last year
Same as last year
Less than last year
Do not exchange gifts at theholidays
Undecided or Not sure
Total Shoppers (N=1,550)
Do you expect to spend more, the same or less on your holiday shopping
compared to last year?
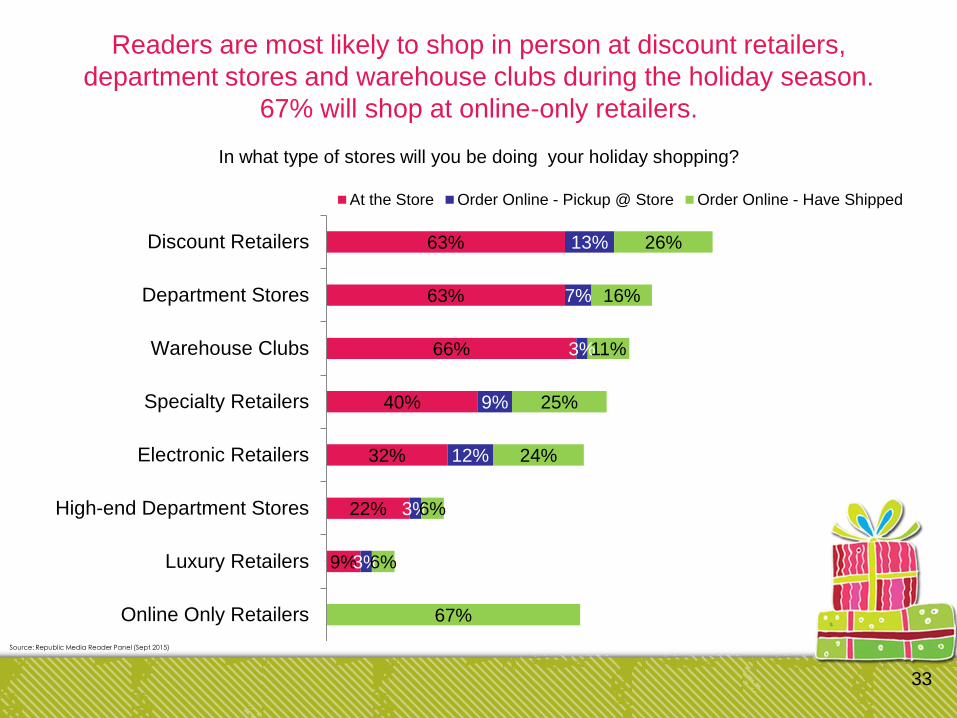
Readers are most likely to shop in person at discount retailers,
department stores and warehouse clubs during the holiday season.
67% will shop at online-only retailers.
33
Source: Republic Media Reader Panel (Sept 2015)
63%
63%
66%
40%
32%
22%
9%
13%
7%
3%
9%
12%
3%
3%
26%
16%
11%
25%
24%
6%
6%
67%
Discount Retailers
Department Stores
Warehouse Clubs
Specialty Retailers
Electronic Retailers
High-end Department Stores
Luxury Retailers
Online Only Retailers
At the Store Order Online - Pickup @ Store Order Online - Have Shipped
In what type of stores will you be doing your holiday shopping?
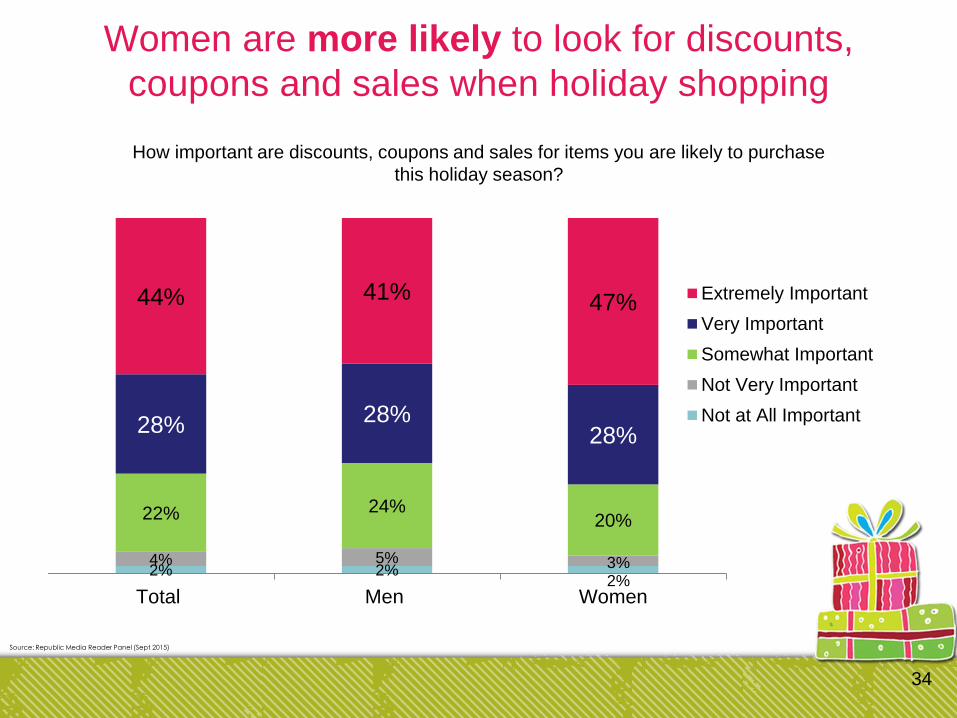
Women are more likely to look for discounts,
coupons and sales when holiday shopping
34
Source: Republic Media Reader Panel (Sept 2015)
2% 2%2%
4% 5% 3%
22% 24%20%
28% 28%28%
44% 41% 47%
Total Men Women
Extremely Important
Very Important
Somewhat Important
Not Very Important
Not at All Important
How important are discounts, coupons and sales for items you are likely to purchase
this holiday season?
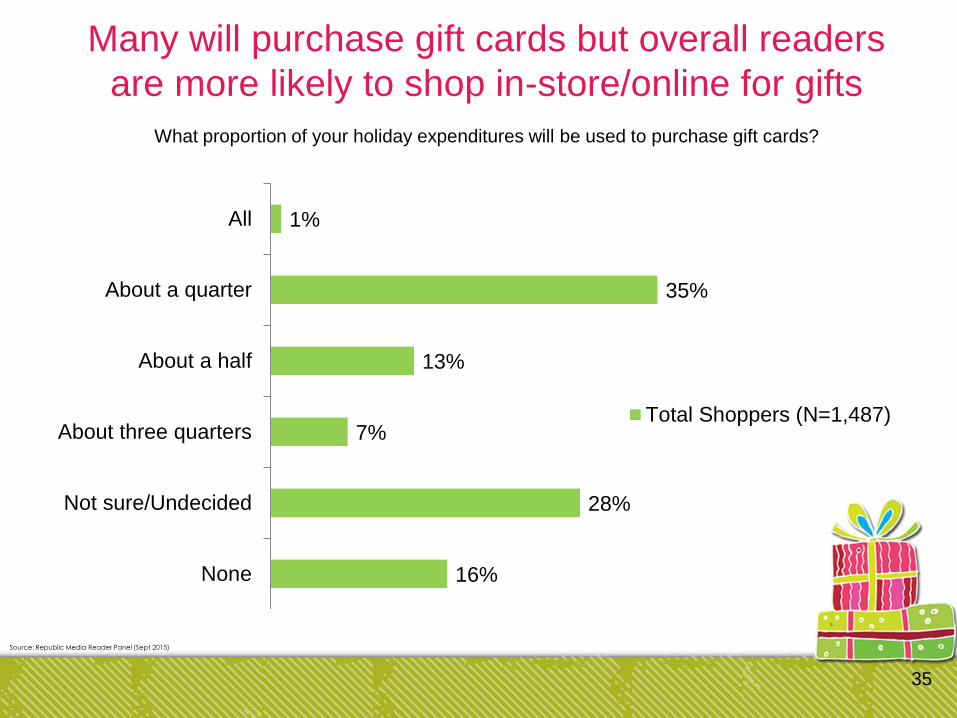
Many will purchase gift cards but overall readers
are more likely to shop in-store/online for gifts
35
Source: Republic Media Reader Panel (Sept 2015)
1%
35%
13%
7%
28%
16%
All
About a quarter
About a half
About three quarters
Not sure/Undecided
None
Total Shoppers (N=1,487)
What proportion of your holiday expenditures will be used to purchase gift cards?
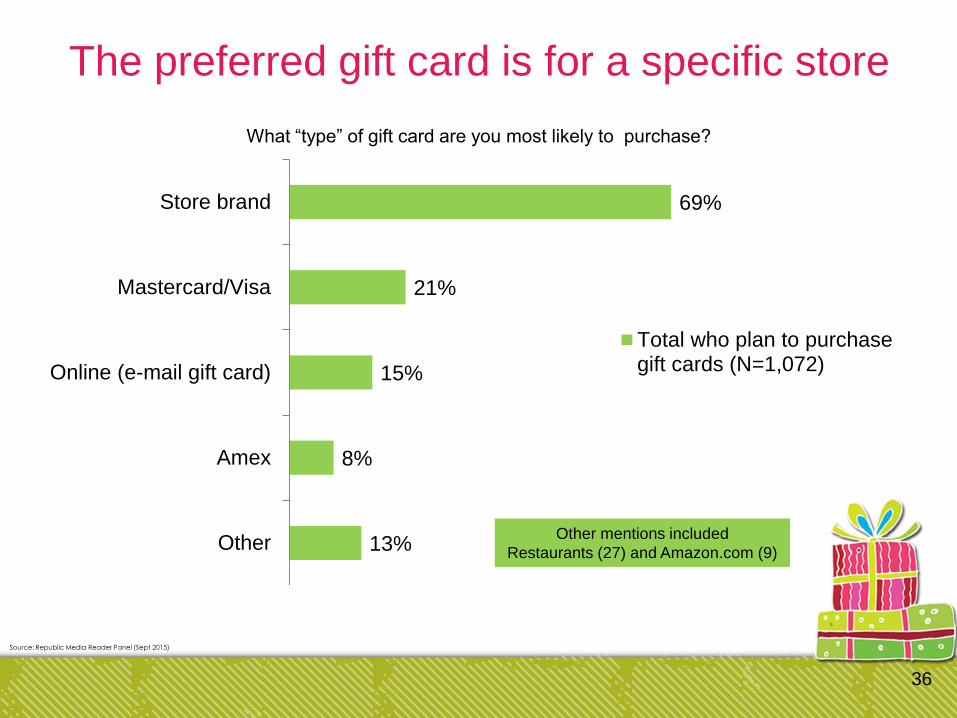
The preferred gift card is for a specific store
36
Source: Republic Media Reader Panel (Sept 2015)
69%
21%
15%
8%
13%
Store brand
Mastercard/Visa
Online (e-mail gift card)
Amex
Other
Total who plan to purchasegift cards (N=1,072)
What “type” of gift card are you most likely to purchase?
Other mentions included
Restaurants (27) and Amazon.com (9)
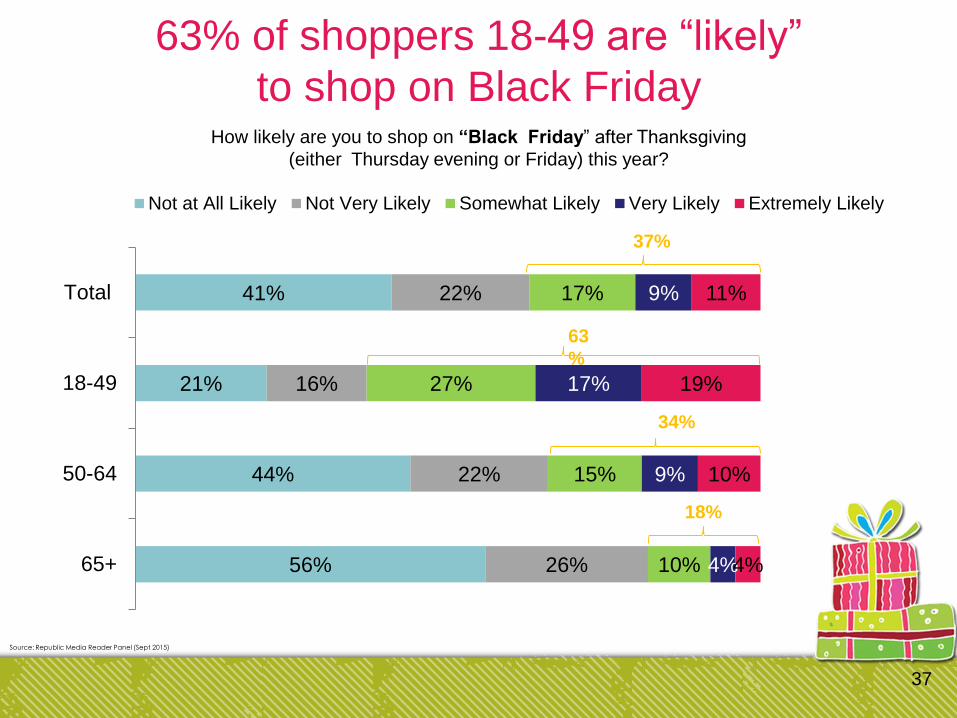
63% of shoppers 18-49 are “likely”
to shop on Black Friday
37
Source: Republic Media Reader Panel (Sept 2015)
41%
21%
44%
56%
22%
16%
22%
26%
17%
27%
15%
10%
9%
17%
9%
4%
11%
19%
10%
4%
Total
18-49
50-64
65+
Not at All Likely Not Very Likely Somewhat Likely Very Likely Extremely Likely
How likely are you to shop on “Black Friday” after Thanksgiving
(either Thursday evening or Friday) this year?
37%
63
%
34%
18%
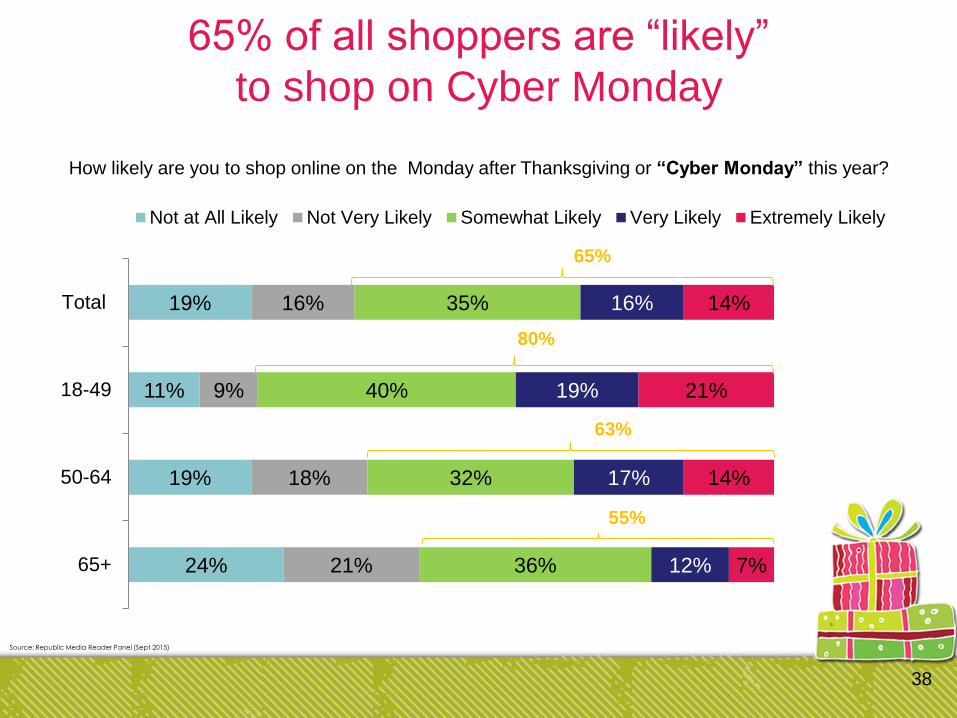
38
Source: Republic Media Reader Panel (Sept 2015)
19%
11%
19%
24%
16%
9%
18%
21%
35%
40%
32%
36%
16%
19%
17%
12%
14%
21%
14%
7%
Total
18-49
50-64
65+
Not at All Likely Not Very Likely Somewhat Likely Very Likely Extremely Likely
How likely are you to shop online on the Monday after Thanksgiving or “Cyber Monday” this year?
65%
80%
63%
55%
65% of all shoppers are “likely”
to shop on Cyber Monday
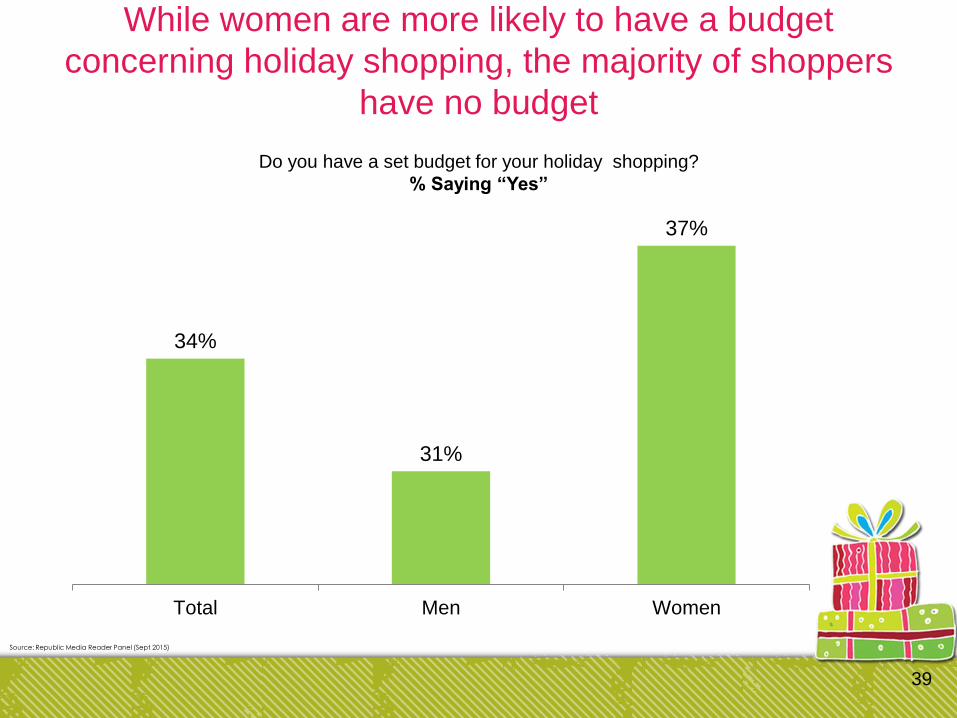
39
Source: Republic Media Reader Panel (Sept 2015)
34%
31%
37%
Total Men Women
Do you have a set budget for your holiday shopping?
% Saying “Yes”
While women are more likely to have a budget
concerning holiday shopping, the majority of shoppers
have no budget
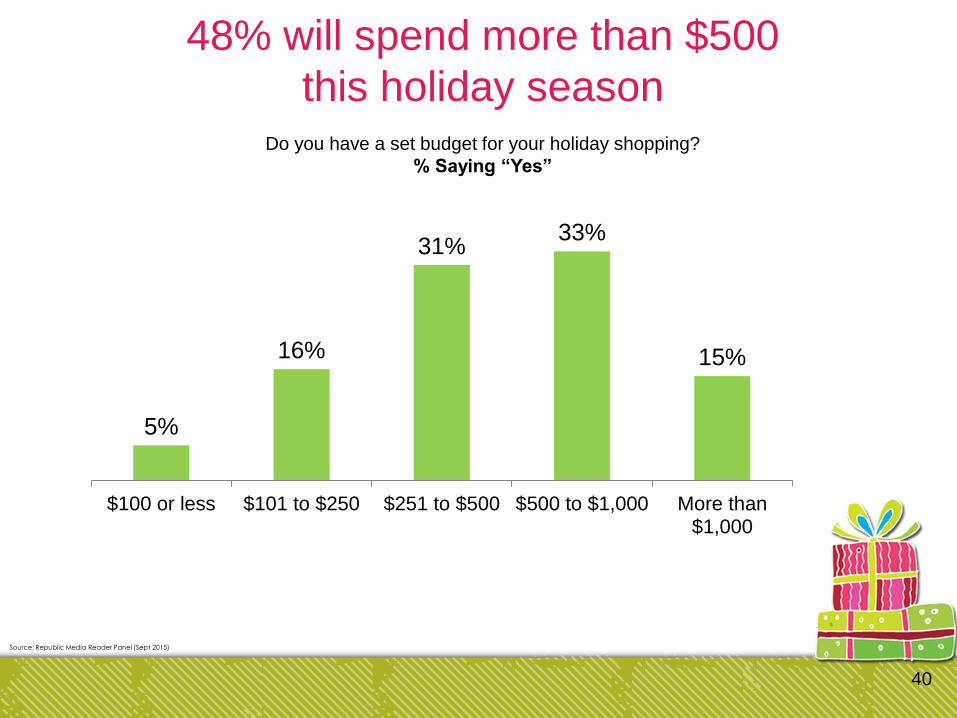
40
Source: Republic Media Reader Panel (Sept 2015)
5%
16%
31%33%
15%
$100 or less $101 to $250 $251 to $500 $500 to $1,000 More than$1,000
Do you have a set budget for your holiday shopping?
% Saying “Yes”
48% will spend more than $500
this holiday season
41
Source: Republic Media Reader Panel (Sept 2015)
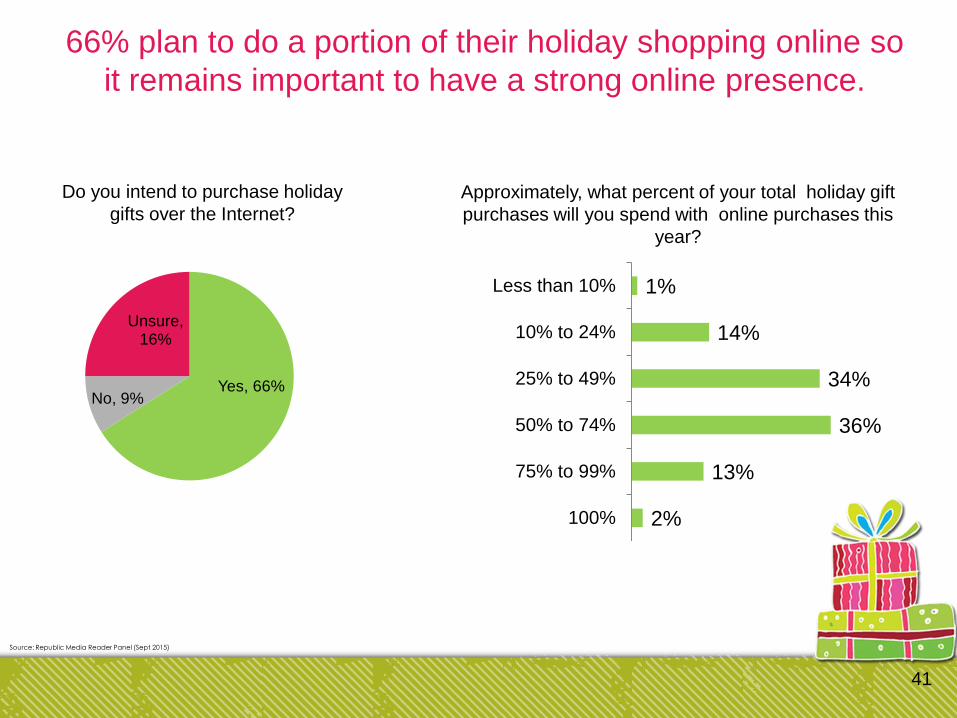
Yes, 66%No, 9%
Unsure, 16%
Do you intend to purchase holiday
gifts over the Internet?
66% plan to do a portion of their holiday shopping online so
it remains important to have a strong online presence.
Approximately, what percent of your total holiday gift
purchases will you spend with online purchases this
year?
1%
14%
34%
36%
13%
2%
Less than 10%
10% to 24%
25% to 49%
50% to 74%
75% to 99%
100%
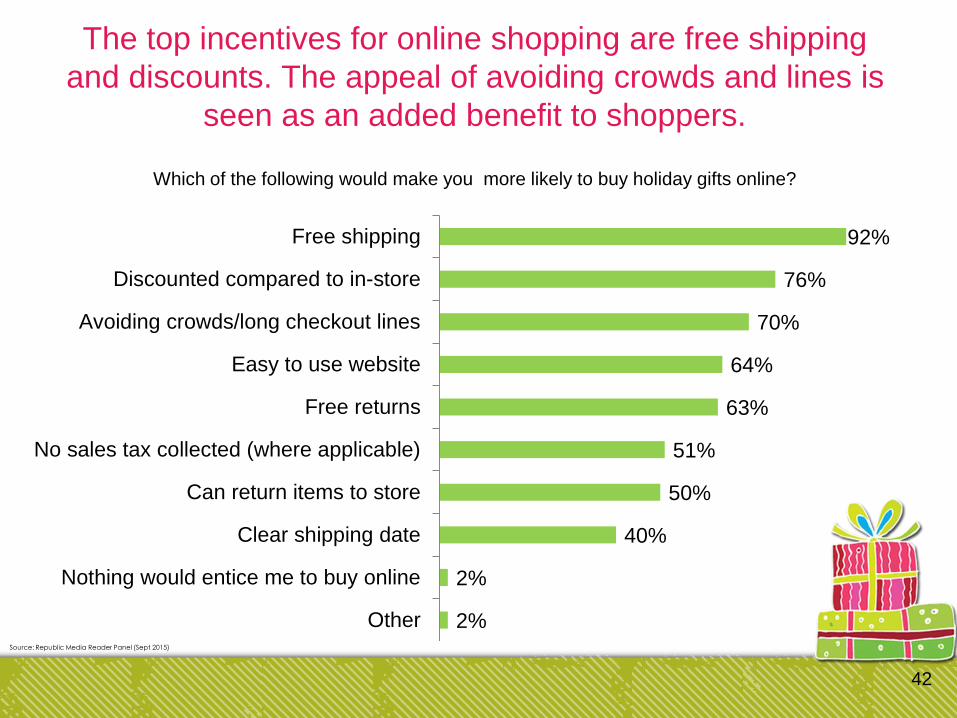
The top incentives for online shopping are free shipping
and discounts. The appeal of avoiding crowds and lines is
seen as an added benefit to shoppers.
42
Source: Republic Media Reader Panel (Sept 2015)
92%
76%
70%
64%
63%
51%
50%
40%
2%
2%
Free shipping
Discounted compared to in-store
Avoiding crowds/long checkout lines
Easy to use website
Free returns
No sales tax collected (where applicable)
Can return items to store
Clear shipping date
Nothing would entice me to buy online
Other
Which of the following would make you more likely to buy holiday gifts online?
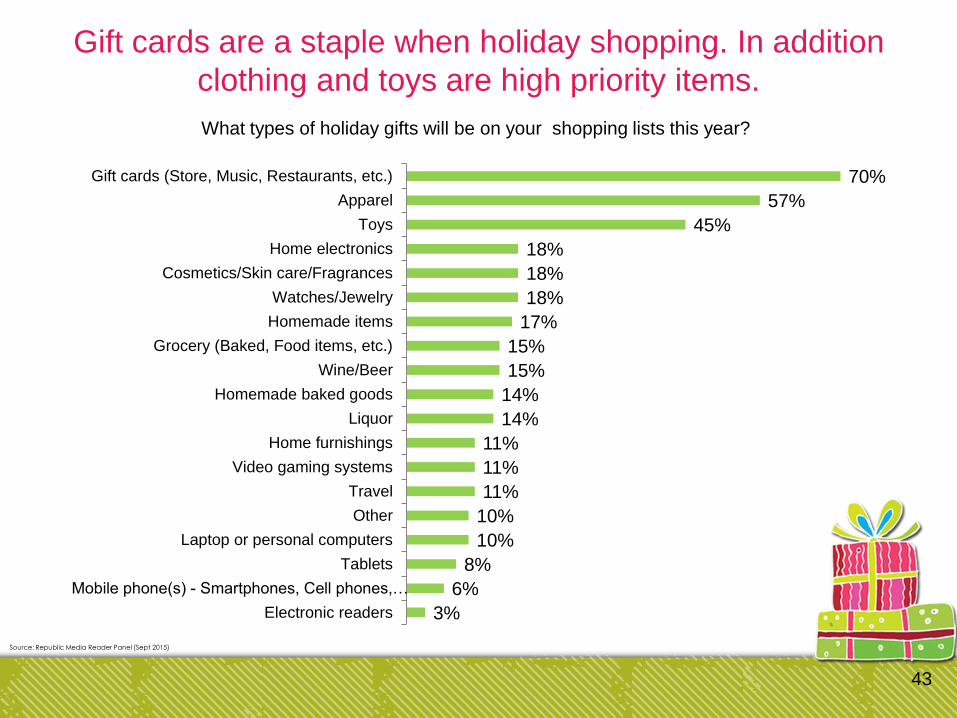
Gift cards are a staple when holiday shopping. In addition
clothing and toys are high priority items.
43
Source: Republic Media Reader Panel (Sept 2015)
70%
57%
45%
18%
18%
18%
17%
15%
15%
14%
14%
11%
11%
11%
10%
10%
8%
6%
3%
Gift cards (Store, Music, Restaurants, etc.)
Apparel
Toys
Home electronics
Cosmetics/Skin care/Fragrances
Watches/Jewelry
Homemade items
Grocery (Baked, Food items, etc.)
Wine/Beer
Homemade baked goods
Liquor
Home furnishings
Video gaming systems
Travel
Other
Laptop or personal computers
Tablets
Mobile phone(s) - Smartphones, Cell phones,…
Electronic readers
What types of holiday gifts will be on your shopping lists this year?
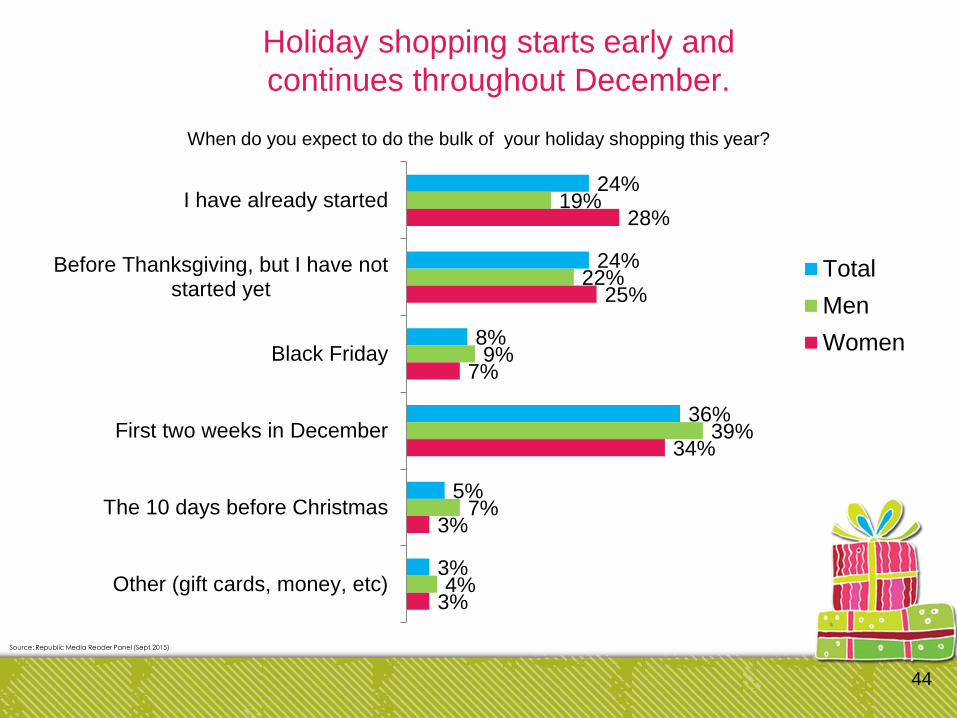
Holiday shopping starts early and
continues throughout December.
44
Source: Republic Media Reader Panel (Sept 2015)
24%
24%
8%
36%
5%
3%
19%
22%
9%
39%
7%
4%
28%
25%
7%
34%
3%
3%
I have already started
Before Thanksgiving, but I have notstarted yet
Black Friday
First two weeks in December
The 10 days before Christmas
Other (gift cards, money, etc)
Total
Men
Women
When do you expect to do the bulk of your holiday shopping this year?
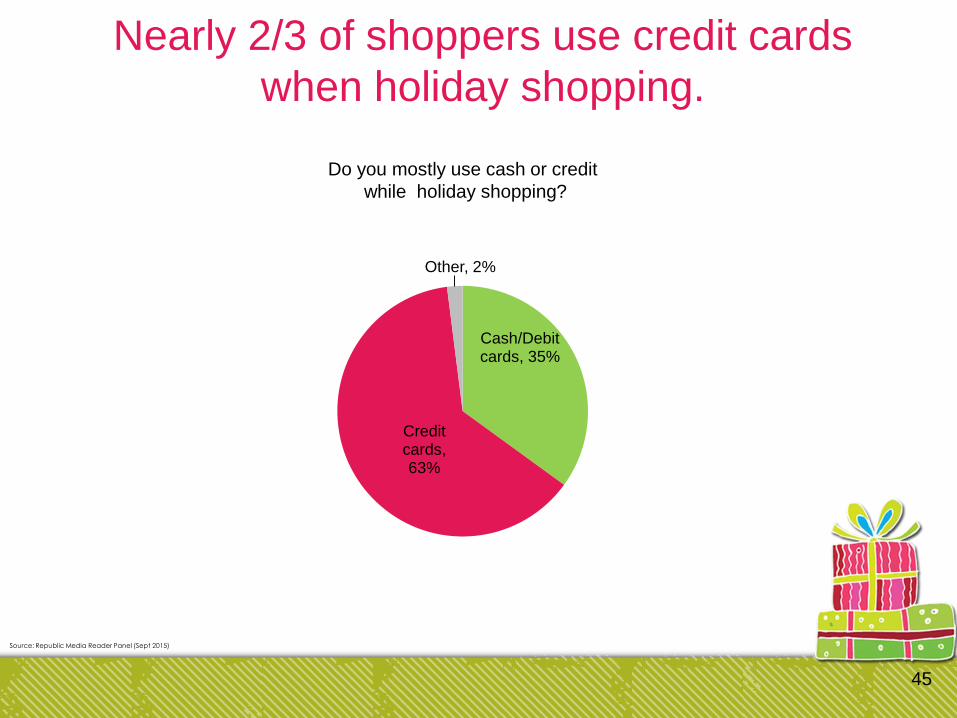
Nearly 2/3 of shoppers use credit cards
when holiday shopping.
45
Source: Republic Media Reader Panel (Sept 2015)
Do you mostly use cash or credit
while holiday shopping?
Cash/Debit cards, 35%
Credit cards, 63%
Other, 2%
46
Source: Republic Media Reader Panel (Sept 2015)
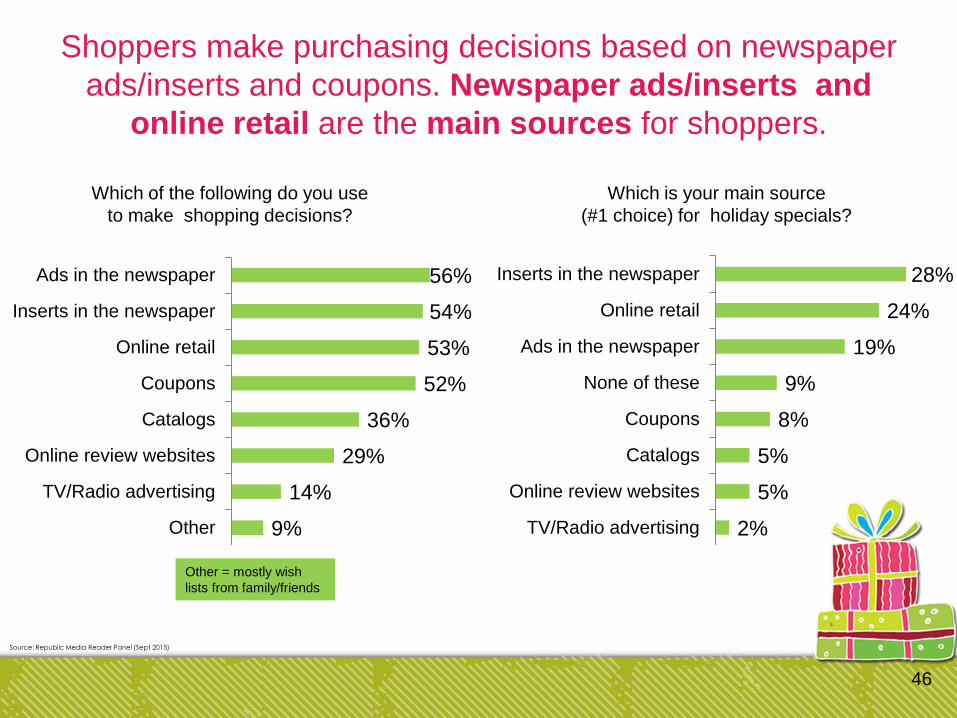
Which of the following do you use
to make shopping decisions?
Shoppers make purchasing decisions based on newspaper
ads/inserts and coupons. Newspaper ads/inserts and
online retail are the main sources for shoppers.
Which is your main source
(#1 choice) for holiday specials?
28%
24%
19%
9%
8%
5%
5%
2%
Inserts in the newspaper
Online retail
Ads in the newspaper
None of these
Coupons
Catalogs
Online review websites
TV/Radio advertising
56%
54%
53%
52%
36%
29%
14%
9%
Ads in the newspaper
Inserts in the newspaper
Online retail
Coupons
Catalogs
Online review websites
TV/Radio advertising
Other
Other = mostly wish
lists from family/friends
47
Source: Republic Media Reader Panel (Sept 2015)
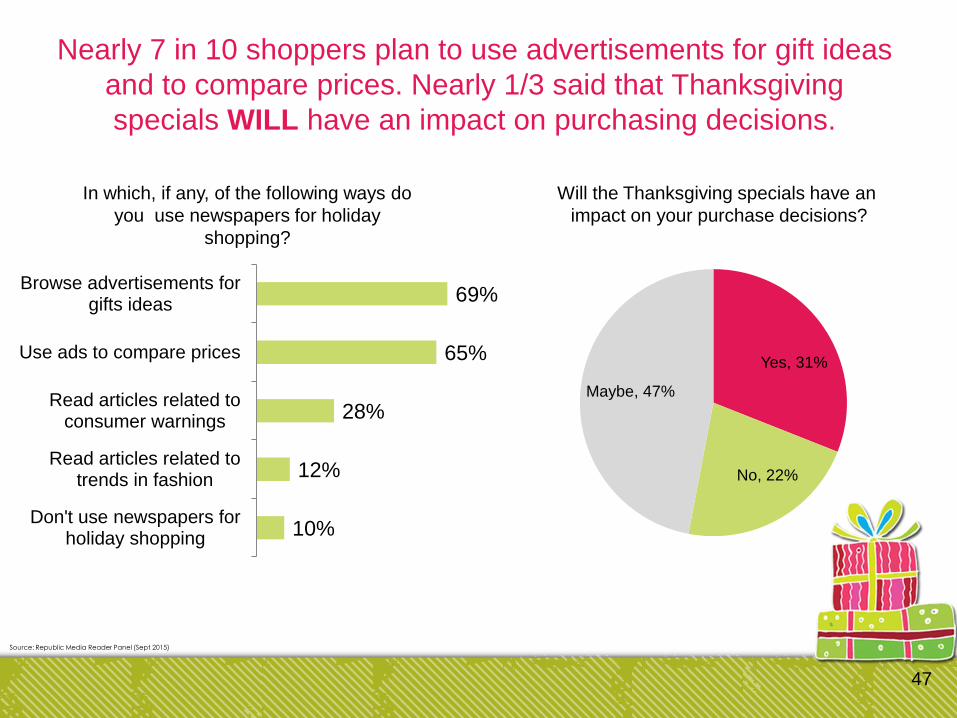
In which, if any, of the following ways do
you use newspapers for holiday
shopping?
Nearly 7 in 10 shoppers plan to use advertisements for gift ideas
and to compare prices. Nearly 1/3 said that Thanksgiving
specials WILL have an impact on purchasing decisions.
Will the Thanksgiving specials have an
impact on your purchase decisions?
69%
65%
28%
12%
10%
Browse advertisements forgifts ideas
Use ads to compare prices
Read articles related toconsumer warnings
Read articles related totrends in fashion
Don't use newspapers forholiday shopping
Yes, 31%
No, 22%
Maybe, 47%
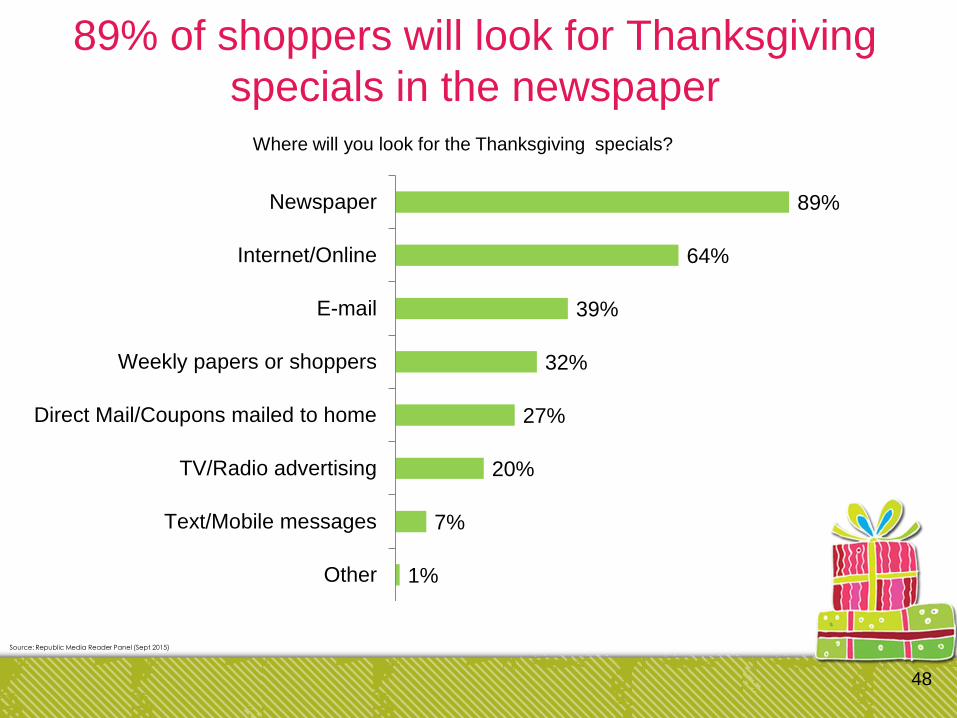
89% of shoppers will look for Thanksgiving
specials in the newspaper
48
Source: Republic Media Reader Panel (Sept 2015)
89%
64%
39%
32%
27%
20%
7%
1%
Newspaper
Internet/Online
Weekly papers or shoppers
Direct Mail/Coupons mailed to home
TV/Radio advertising
Text/Mobile messages
Other
Where will you look for the Thanksgiving specials?