Embed Size (px)
Citation preview
TOP50 1 2 3 4 5 7 8 9 10 11 12 13 14 15 16
1718
1920
2122
2324
2527
39 2840 2941 3042 31
43
32
44
33
45
34
46
35
47
36
48
37
49
38
506
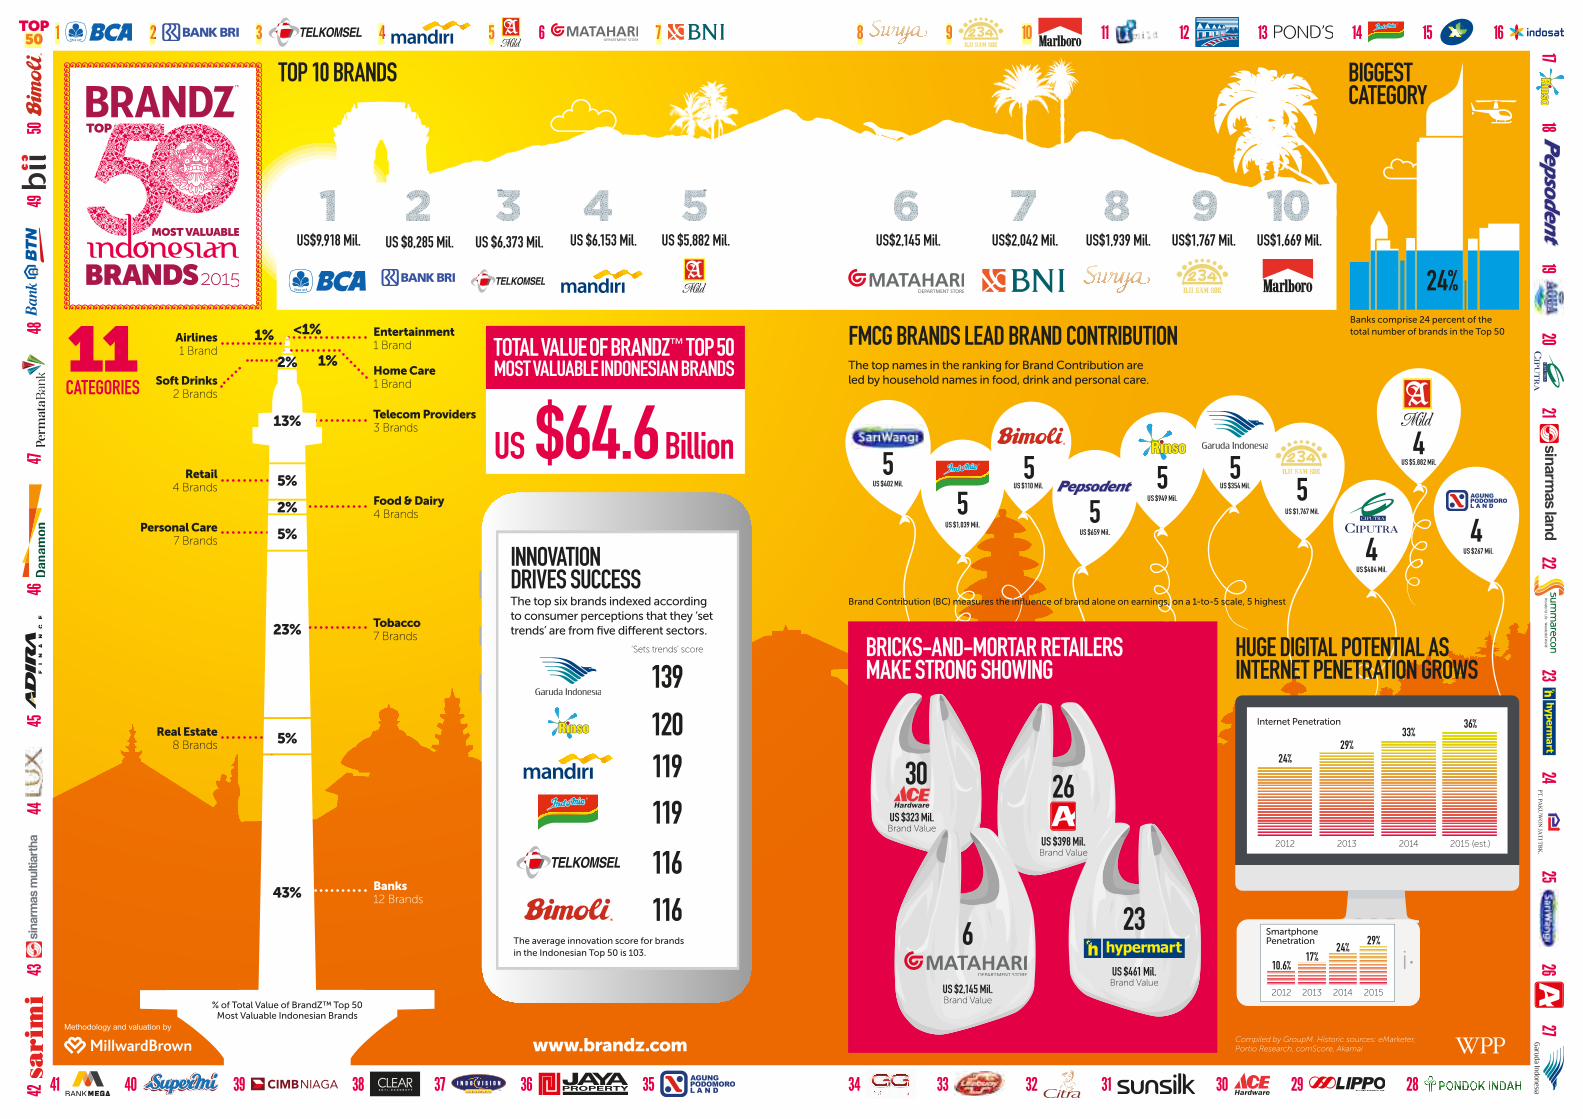
TOP 10 BRANDS
Banks comprise 24 percent of the total number of brands in the Top 50
US $6,373 Mil. US $6,153 Mil. US $5,882 Mil. US$2,145 Mil. US$2,042 Mil. US$1,939 Mil. US$1,767 Mil. US$1,669 Mil. US$9,918 Mil. US $8,285 Mil.
24%
11 CATEGORIES
BIGGEST CATEGORY
12 BrandsBanks
8 BrandsReal Estate
7 BrandsPersonal Care
4 Brands
1 Brand
2 Brands
Retail
Airlines
Soft Drinks
7 BrandsTobacco
4 BrandsFood & Dairy
3 Brands
1 Brand
1 Brand
Telecom Providers
Entertainment
Home Care1%
1% <1%
2%
13%
5%
2%
5%
23%
5%
43%
% of Total Value of BrandZ™ Top 50 Most Valuable Indonesian Brands
FMCG BRANDS LEAD BRAND CONTRIBUTION The top names in the ranking for Brand Contribution are led by household names in food, drink and personal care.
www.brandz.com
5
45
455
45
55
Brand Contribution (BC) measures the influence of brand alone on earnings, on a 1-to-5 scale, 5 highest
Compiled by GroupM. Historic sources: eMarketer, Portio Research, comScore, Akamai
US $402 Mil.
US $1,039 Mil.
US $110 Mil.
US $659 Mil.
US $949 Mil.
US $354 Mil.
US $1,767 Mil.
US $5,882 Mil.
US $267 Mil.
US $484 Mil.
The average innovation score for brands in the Indonesian Top 50 is 103.
‘Sets trends’ score
139
120119119
116116
INNOVATION DRIVES SUCCESS The top six brands indexed according to consumer perceptions that they ‘set trends’ are from five different sectors.
BRICKS-AND-MORTAR RETAILERS MAKE STRONG SHOWING
HUGE DIGITAL POTENTIAL AS INTERNET PENETRATION GROWS
Brand ValueUS $2,145 Mil.
6
26
Brand ValueUS $461 Mil.
23
Brand ValueUS $398 Mil.
26Brand ValueUS $323 Mil.
30
Internet Penetration
2012 2013 2014 2015 (est.)
24%29%
33%36%
2012 2013 2014 2015
Smartphone Penetration
10.6%17%
24%29%