Embed Size (px)
Citation preview
USAGE AND ATTITUDE OF BEER CONSUMERS
PROJECT REPORT
SUBMITTED IN PARTIAL FULFILMENT OF
POST GRADUATE DIPLOMA IN MANAGEMENT –Y-I
COURSE CODE: MyC108
to
the Academic Office
On
27th MAR -2017
By
AJAY PRATHAP CHOPPARA
MYDM-2018-05
MYRA SCHOOL OF BUSINESS
Mysore,
Karnataka 571130.
March 2017
i
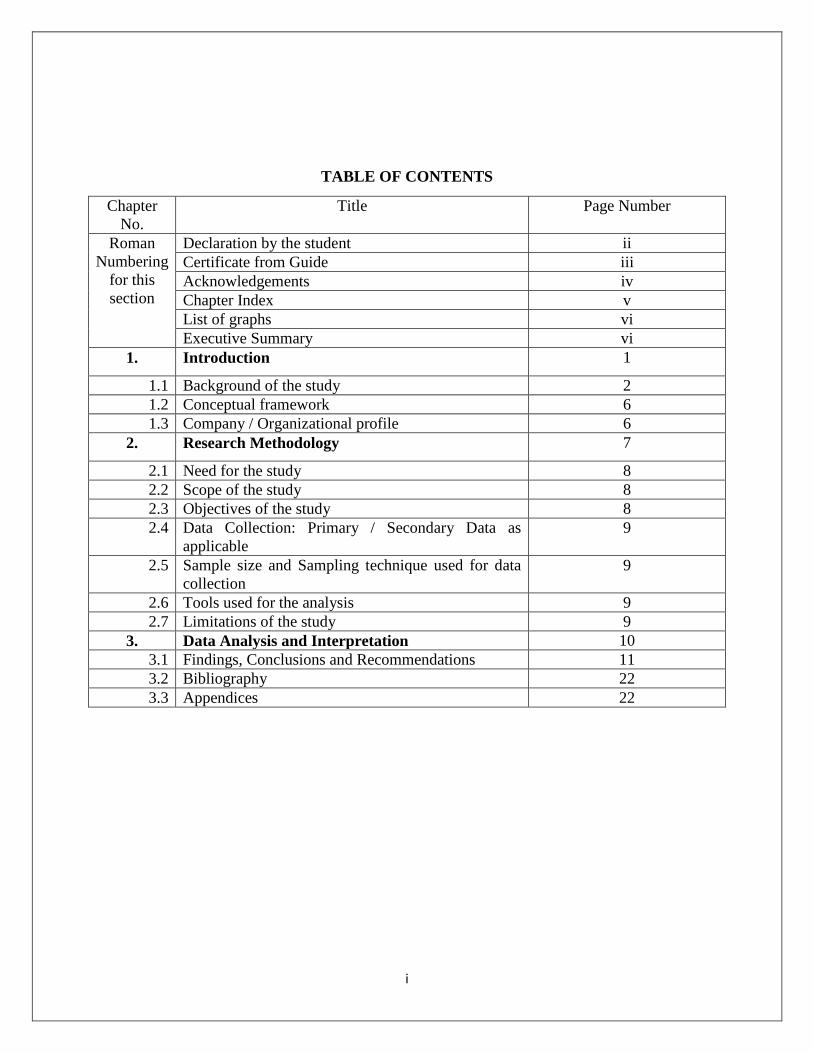
TABLE OF CONTENTS
Chapter
No.
Title Page Number
Roman
Numbering
for this
section
Declaration by the student ii
Certificate from Guide iii
Acknowledgements iv
Chapter Index v
List of graphs vi
Executive Summary vi
1. Introduction 1
1.1 Background of the study 2
1.2 Conceptual framework 6
1.3 Company / Organizational profile 6
2. Research Methodology 7
2.1 Need for the study 8
2.2 Scope of the study 8
2.3 Objectives of the study 8
2.4 Data Collection: Primary / Secondary Data as
applicable
9
2.5 Sample size and Sampling technique used for data
collection
9
2.6 Tools used for the analysis 9
2.7 Limitations of the study 9
3. Data Analysis and Interpretation 10
3.1 Findings, Conclusions and Recommendations 11
3.2 Bibliography 22
3.3 Appendices 22
ii
DECLARATION BY THE STUDENT
I Ajay Prathap Choppara, student of PGDM year 1, hereby solemnly declare that this project
report is the output of research work carried out by me during the period of two months through
Krishna Jambur towards the partial fulfillment of Post Graduate Diploma in Management–Year I
I declare that this project has not been submitted to any other academic institution for any award
of degree or diploma.
Signature of the student
Name: Ajay Prathap Choppara
ID Number: MYDM-2018-05
Date: 27th March 2017
iii
CERTIFICATE
I certify that, Project entitled USAGE AND ATTITUDE OF BEER CONSUMERS was carried
out by Ajay Prathap Choppara of PGDM year 1 student with an ID number MYDM-2018-05
under my guidance between January to March 2017, in partial fulfillment of post graduate
diploma in management year 1.
Signature of the advisor
Date:
Signature of the Mentor
Date:
iv
ACKNOWLDGEMENT
I take this opportunity to express my profound gratitude and deep regards to Krishna Jambur for
his exemplary guidance, monitoring and constant encouragement throughout the course of
independent study. The guidance and knowledge given by him, time to time, helped me to think
independently and gain better insights about Market Research
I also take this opportunity to express a deep sense of gratitude to the academic office, for
guiding me through the whole process.
v
CHAPTER INDEX
Chapter No Title Page Number
1 Introduction 1
2 Research Methodology 7
3 Data Analysis and Interpretation 10
vi
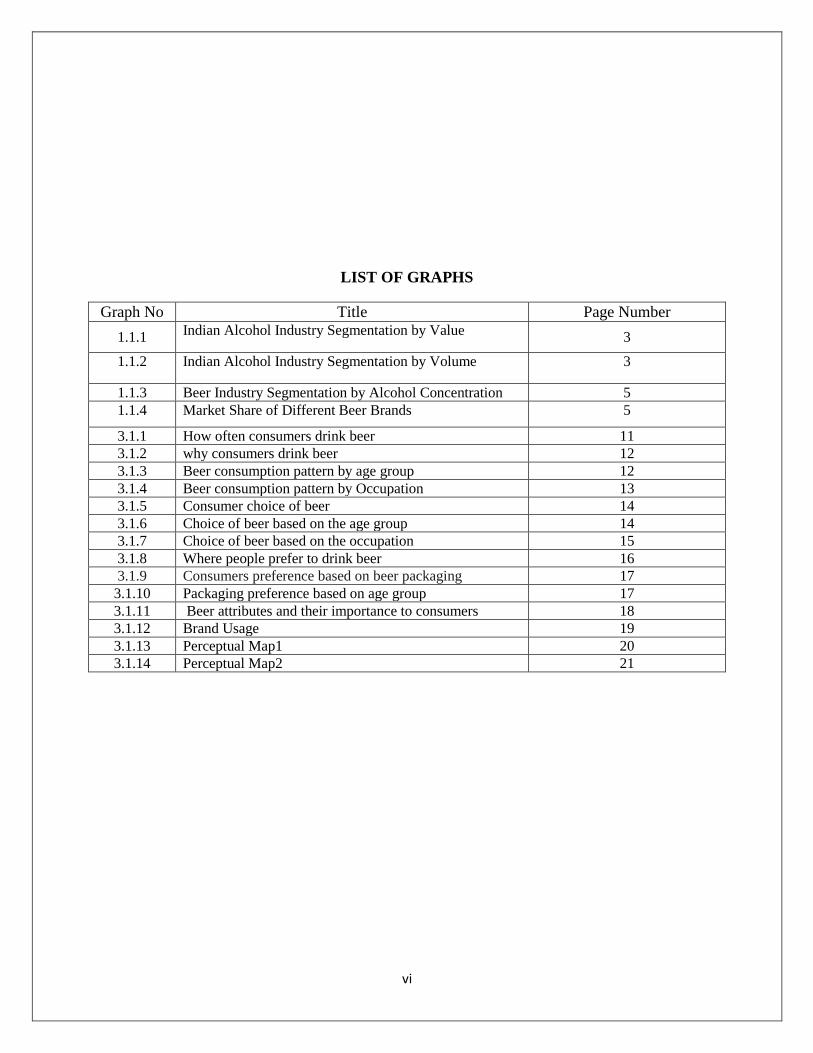
LIST OF GRAPHS
Graph No Title Page Number
1.1.1 Indian Alcohol Industry Segmentation by Value
3
1.1.2 Indian Alcohol Industry Segmentation by Volume 3
1.1.3 Beer Industry Segmentation by Alcohol Concentration 5
1.1.4 Market Share of Different Beer Brands 5
3.1.1 How often consumers drink beer 11
3.1.2 why consumers drink beer 12
3.1.3 Beer consumption pattern by age group 12
3.1.4 Beer consumption pattern by Occupation 13
3.1.5 Consumer choice of beer 14
3.1.6 Choice of beer based on the age group 14
3.1.7 Choice of beer based on the occupation 15
3.1.8 Where people prefer to drink beer 16
3.1.9 Consumers preference based on beer packaging 17
3.1.10 Packaging preference based on age group 17
3.1.11 Beer attributes and their importance to consumers 18
3.1.12 Brand Usage 19
3.1.13 Perceptual Map1 20
3.1.14 Perceptual Map2 21
vii
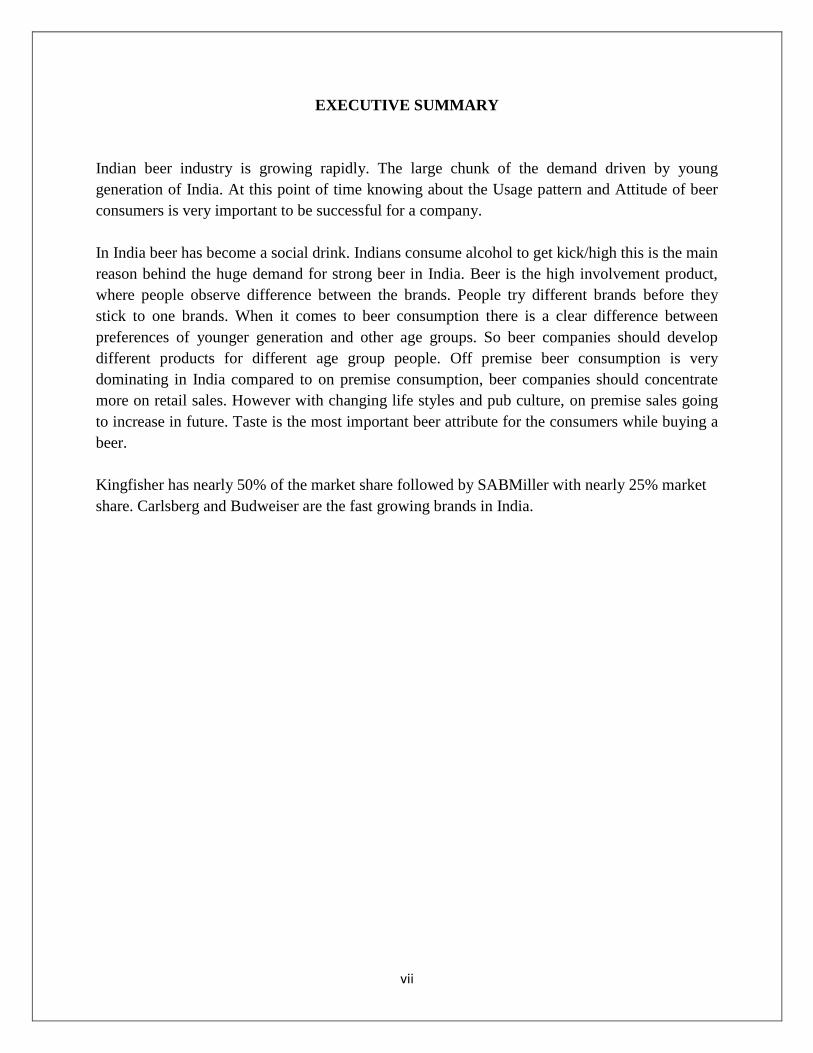
EXECUTIVE SUMMARY
Indian beer industry is growing rapidly. The large chunk of the demand driven by young
generation of India. At this point of time knowing about the Usage pattern and Attitude of beer
consumers is very important to be successful for a company.
In India beer has become a social drink. Indians consume alcohol to get kick/high this is the main
reason behind the huge demand for strong beer in India. Beer is the high involvement product,
where people observe difference between the brands. People try different brands before they
stick to one brands. When it comes to beer consumption there is a clear difference between
preferences of younger generation and other age groups. So beer companies should develop
different products for different age group people. Off premise beer consumption is very
dominating in India compared to on premise consumption, beer companies should concentrate
more on retail sales. However with changing life styles and pub culture, on premise sales going
to increase in future. Taste is the most important beer attribute for the consumers while buying a
beer.
Kingfisher has nearly 50% of the market share followed by SABMiller with nearly 25% market
share. Carlsberg and Budweiser are the fast growing brands in India.
1
CHAPTER-1
INTRODUCTION
2
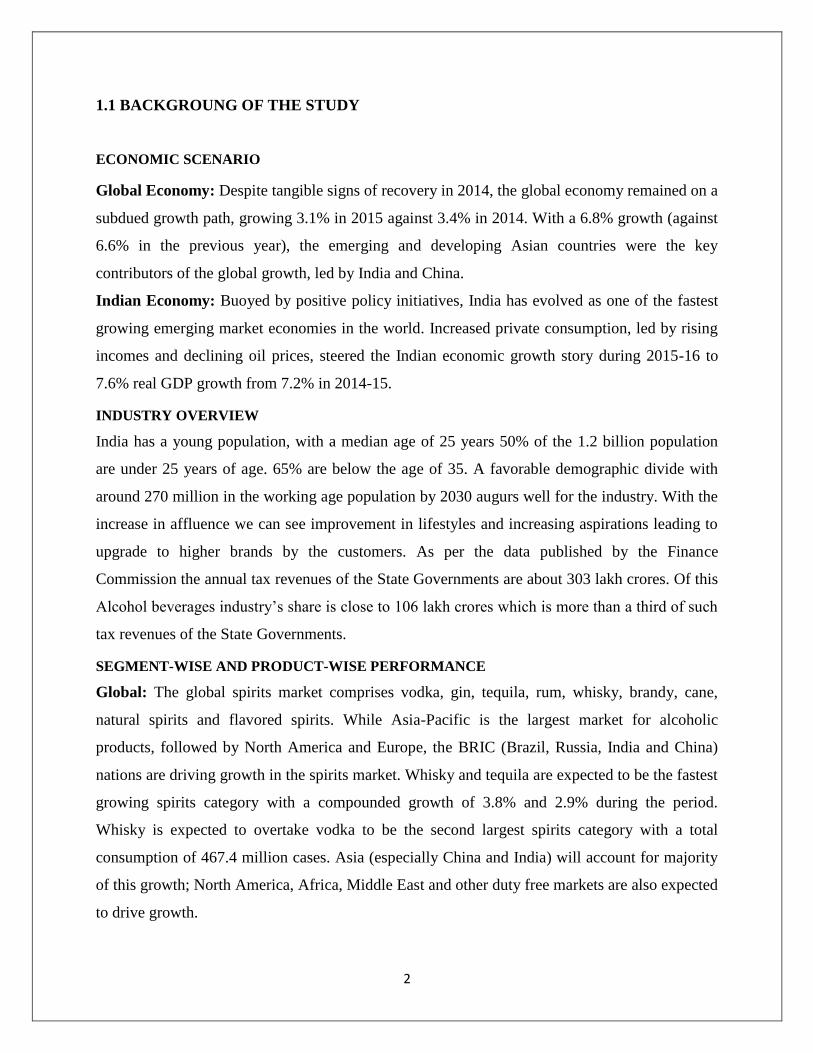
1.1 BACKGROUNG OF THE STUDY
ECONOMIC SCENARIO
Global Economy: Despite tangible signs of recovery in 2014, the global economy remained on a
subdued growth path, growing 3.1% in 2015 against 3.4% in 2014. With a 6.8% growth (against
6.6% in the previous year), the emerging and developing Asian countries were the key
contributors of the global growth, led by India and China.
Indian Economy: Buoyed by positive policy initiatives, India has evolved as one of the fastest
growing emerging market economies in the world. Increased private consumption, led by rising
incomes and declining oil prices, steered the Indian economic growth story during 2015-16 to
7.6% real GDP growth from 7.2% in 2014-15.
INDUSTRY OVERVIEW
India has a young population, with a median age of 25 years 50% of the 1.2 billion population
are under 25 years of age. 65% are below the age of 35. A favorable demographic divide with
around 270 million in the working age population by 2030 augurs well for the industry. With the
increase in affluence we can see improvement in lifestyles and increasing aspirations leading to
upgrade to higher brands by the customers. As per the data published by the Finance
Commission the annual tax revenues of the State Governments are about 303 lakh crores. Of this
Alcohol beverages industry’s share is close to 106 lakh crores which is more than a third of such
tax revenues of the State Governments.
SEGMENT-WISE AND PRODUCT-WISE PERFORMANCE
Global: The global spirits market comprises vodka, gin, tequila, rum, whisky, brandy, cane,
natural spirits and flavored spirits. While Asia-Pacific is the largest market for alcoholic
products, followed by North America and Europe, the BRIC (Brazil, Russia, India and China)
nations are driving growth in the spirits market. Whisky and tequila are expected to be the fastest
growing spirits category with a compounded growth of 3.8% and 2.9% during the period.
Whisky is expected to overtake vodka to be the second largest spirits category with a total
consumption of 467.4 million cases. Asia (especially China and India) will account for majority
of this growth; North America, Africa, Middle East and other duty free markets are also expected
to drive growth.
3
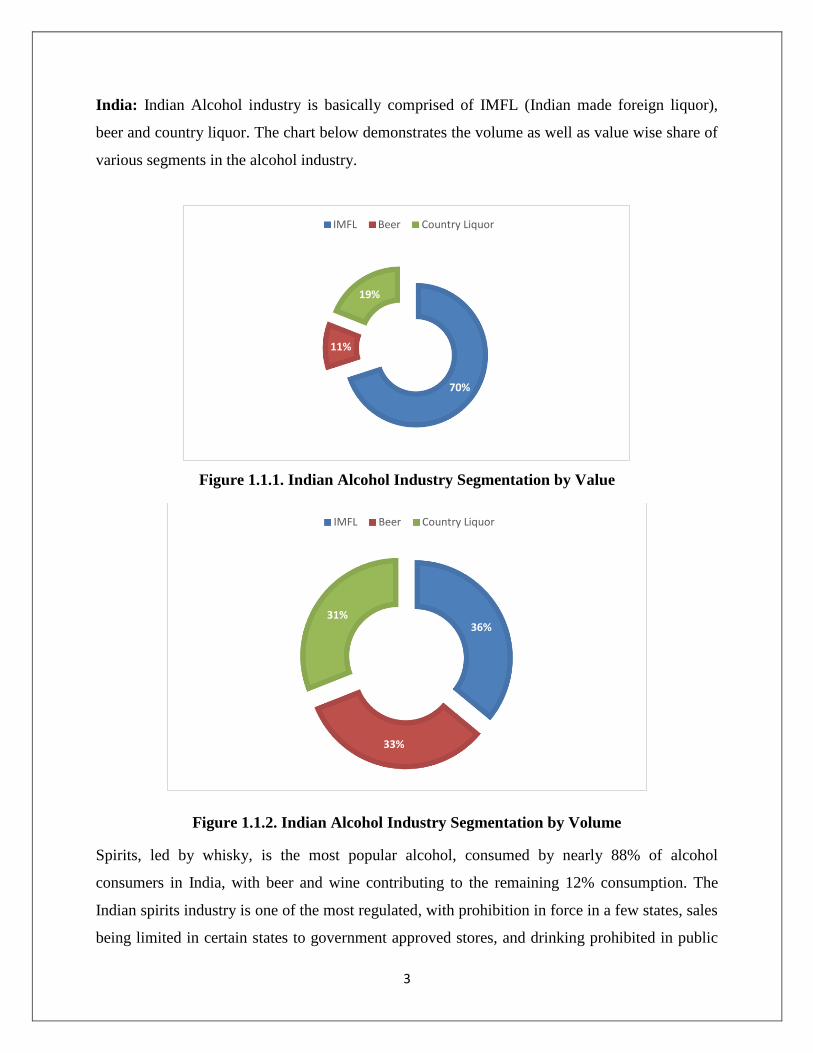
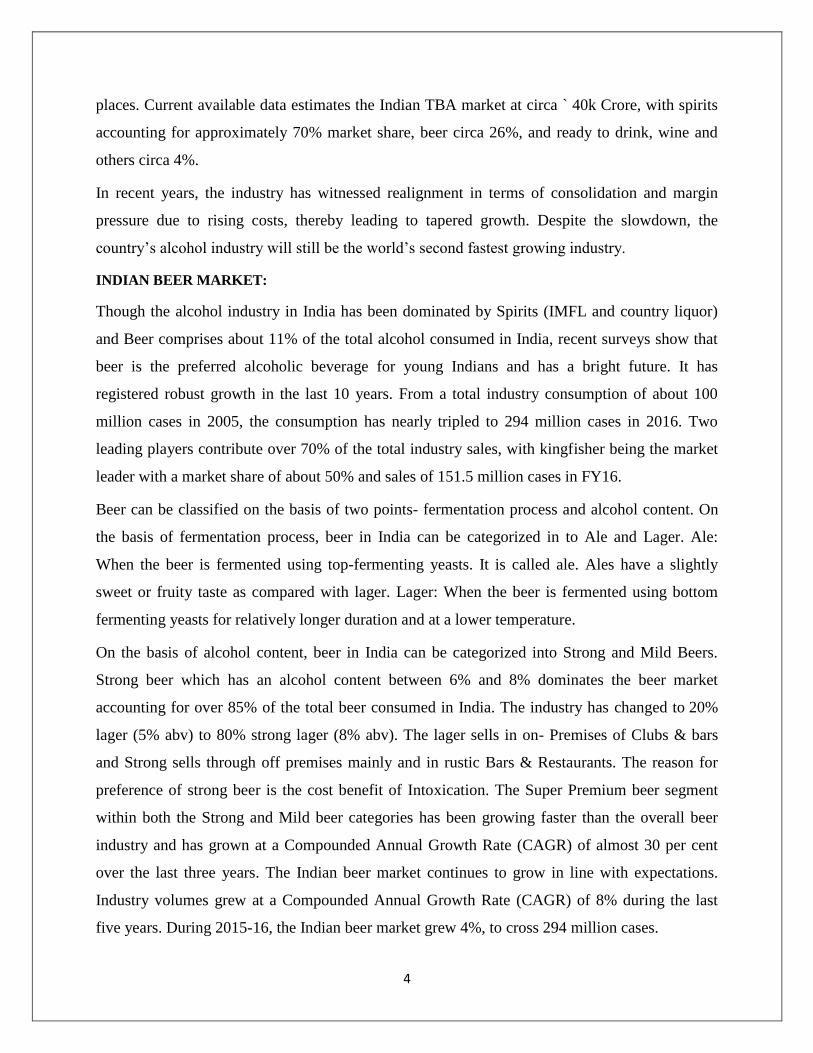
India: Indian Alcohol industry is basically comprised of IMFL (Indian made foreign liquor),
beer and country liquor. The chart below demonstrates the volume as well as value wise share of
various segments in the alcohol industry.
Figure 1.1.1. Indian Alcohol Industry Segmentation by Value
Figure 1.1.2. Indian Alcohol Industry Segmentation by Volume
Spirits, led by whisky, is the most popular alcohol, consumed by nearly 88% of alcohol
consumers in India, with beer and wine contributing to the remaining 12% consumption. The
Indian spirits industry is one of the most regulated, with prohibition in force in a few states, sales
being limited in certain states to government approved stores, and drinking prohibited in public
70%
11%
19%
IMFL Beer Country Liquor
36%
33%
31%
IMFL Beer Country Liquor
4
places. Current available data estimates the Indian TBA market at circa ` 40k Crore, with spirits
accounting for approximately 70% market share, beer circa 26%, and ready to drink, wine and
others circa 4%.
In recent years, the industry has witnessed realignment in terms of consolidation and margin
pressure due to rising costs, thereby leading to tapered growth. Despite the slowdown, the
country’s alcohol industry will still be the world’s second fastest growing industry.
INDIAN BEER MARKET:
Though the alcohol industry in India has been dominated by Spirits (IMFL and country liquor)
and Beer comprises about 11% of the total alcohol consumed in India, recent surveys show that
beer is the preferred alcoholic beverage for young Indians and has a bright future. It has
registered robust growth in the last 10 years. From a total industry consumption of about 100
million cases in 2005, the consumption has nearly tripled to 294 million cases in 2016. Two
leading players contribute over 70% of the total industry sales, with kingfisher being the market
leader with a market share of about 50% and sales of 151.5 million cases in FY16.
Beer can be classified on the basis of two points- fermentation process and alcohol content. On
the basis of fermentation process, beer in India can be categorized in to Ale and Lager. Ale:
When the beer is fermented using top-fermenting yeasts. It is called ale. Ales have a slightly
sweet or fruity taste as compared with lager. Lager: When the beer is fermented using bottom
fermenting yeasts for relatively longer duration and at a lower temperature.
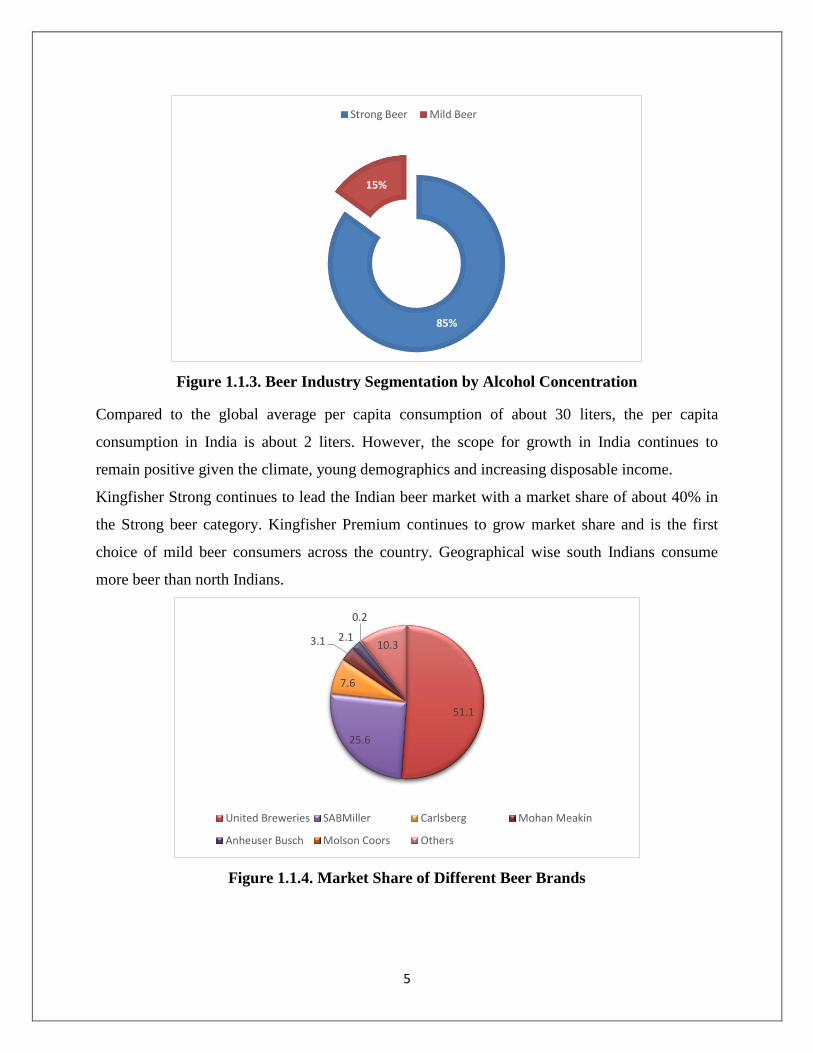
On the basis of alcohol content, beer in India can be categorized into Strong and Mild Beers.
Strong beer which has an alcohol content between 6% and 8% dominates the beer market
accounting for over 85% of the total beer consumed in India. The industry has changed to 20%
lager (5% abv) to 80% strong lager (8% abv). The lager sells in on- Premises of Clubs & bars
and Strong sells through off premises mainly and in rustic Bars & Restaurants. The reason for
preference of strong beer is the cost benefit of Intoxication. The Super Premium beer segment
within both the Strong and Mild beer categories has been growing faster than the overall beer
industry and has grown at a Compounded Annual Growth Rate (CAGR) of almost 30 per cent
over the last three years. The Indian beer market continues to grow in line with expectations.
Industry volumes grew at a Compounded Annual Growth Rate (CAGR) of 8% during the last
five years. During 2015-16, the Indian beer market grew 4%, to cross 294 million cases.
5
Figure 1.1.3. Beer Industry Segmentation by Alcohol Concentration
Compared to the global average per capita consumption of about 30 liters, the per capita
consumption in India is about 2 liters. However, the scope for growth in India continues to
remain positive given the climate, young demographics and increasing disposable income.
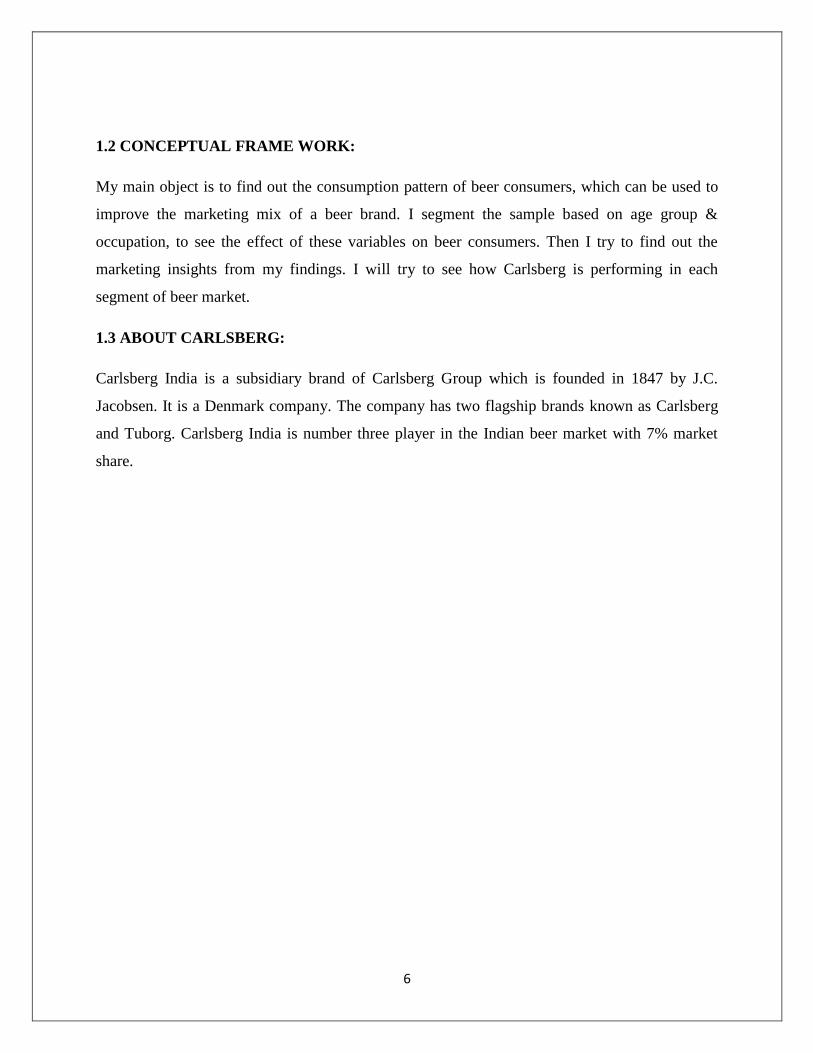
Kingfisher Strong continues to lead the Indian beer market with a market share of about 40% in
the Strong beer category. Kingfisher Premium continues to grow market share and is the first
choice of mild beer consumers across the country. Geographical wise south Indians consume
more beer than north Indians.
Figure 1.1.4. Market Share of Different Beer Brands
85%
15%
Strong Beer Mild Beer
51.1
25.6
7.6
3.1 2.1
0.2
10.3
United Breweries SABMiller Carlsberg Mohan Meakin
Anheuser Busch Molson Coors Others
6
1.2 CONCEPTUAL FRAME WORK:
My main object is to find out the consumption pattern of beer consumers, which can be used to
improve the marketing mix of a beer brand. I segment the sample based on age group &
occupation, to see the effect of these variables on beer consumers. Then I try to find out the
marketing insights from my findings. I will try to see how Carlsberg is performing in each
segment of beer market.
1.3 ABOUT CARLSBERG:
Carlsberg India is a subsidiary brand of Carlsberg Group which is founded in 1847 by J.C.
Jacobsen. It is a Denmark company. The company has two flagship brands known as Carlsberg
and Tuborg. Carlsberg India is number three player in the Indian beer market with 7% market
share.
7
CHAPTER 2
RESEARCH METHODOLOGY
8
2.1 NEED FOR THE STUDY
India is a dynamic market which has immense potential with a young, growing population,
increasing disposable incomes and changing social landscape. Indian beer market in growing
rapidly. By studying the consumption pattern and attitudes of consumer, players in the market
can leverage this knowledge to cater the highly changing demand of customer.
2.2 SCOPE OF THE STUDY
o Increase revenue – The importance of consumer buying behavior lies in the fact, that we
can improve our sales figures when we study the customers. We can alter the way we sell
our products depending on the ways that customers buy them.
o Product portfolio – Continuous observation of consumer behavior can enable you in
finding gaps in your product portfolio, which can in turn help you launch new products to
the ultimate satisfaction of your customers. Samsung is an excellent of a company which
keeps expanding its product portfolio.
o Market trends – As the market trend shifts, a consumer analysis will be the first
indicator of the same. The recent shift towards stronger beer is observed by the likes of
Kingfisher, Carlsberg.
o Segmentation and targeting – Your current customers are a clear indication of who
your future customers are going to be. If my current customers are 50% impulsive, then
the future customers too will be impulsive. Segmentation and targeting becomes easier
when you are observing consumer behavior.
Above are some of the reasons that studying consumer buying behavior is important for any
company. Not only does it contribute to profits, but we can be rest assured that a company which
is in touch with its customers, has a sustainable advantage on its side. Being in touch with
customers is an attitude which should be inculcated even when the company is a startup.
2.3 OBJECTIVES OF THE STUDY
To understand the buying behavior of consumers and their brand preferences.
o Consumption pattern of beer
o What is the most important factor for consumers while buying beer?
o Consumer Brand preference and perception towards different brands
9
2.4 DATA COLLECTION
Primary sources: Primary data collection process carried out by asking the
targeted consumers to fill the survey, which had predefined structured
questionnaire.
Secondary sources: The collection of secondary data on liquor was a very
tedious. However, secondary data collected through following sources, Business
Magazines & News Papers, Research papers, etc.
For this project the data collection instrument is the survey method with the help of a structured
questionnaire. Price, Brand, Quality, Taste, Availability are some of the factors to form the
questionnaire. Beer consumption normally differ by the demographic profile of the consumer so
in the survey there will be questions on demographic profile.
2.5. SAMPLE:
Sample size is: 78
Target Group: People who consume beer and who are above 18 years old.
2.6. TOOLS USED FOR ANALYSIS
Microsoft Excel 2013 is the only tool I used to analyze the data
2.7 LIMITATIONS OF THE STUDY
o The respondents were not very comfortable while revealing their correct usage pattern,
because alcohol is still a Taboo thing in India
o Language Barrier
o Small Sample size
o Respondents were not serious about the survey, so there might be some bias.
10
CHAPTER-3
DATA ANALYSIS AND INTERPRETATION
11
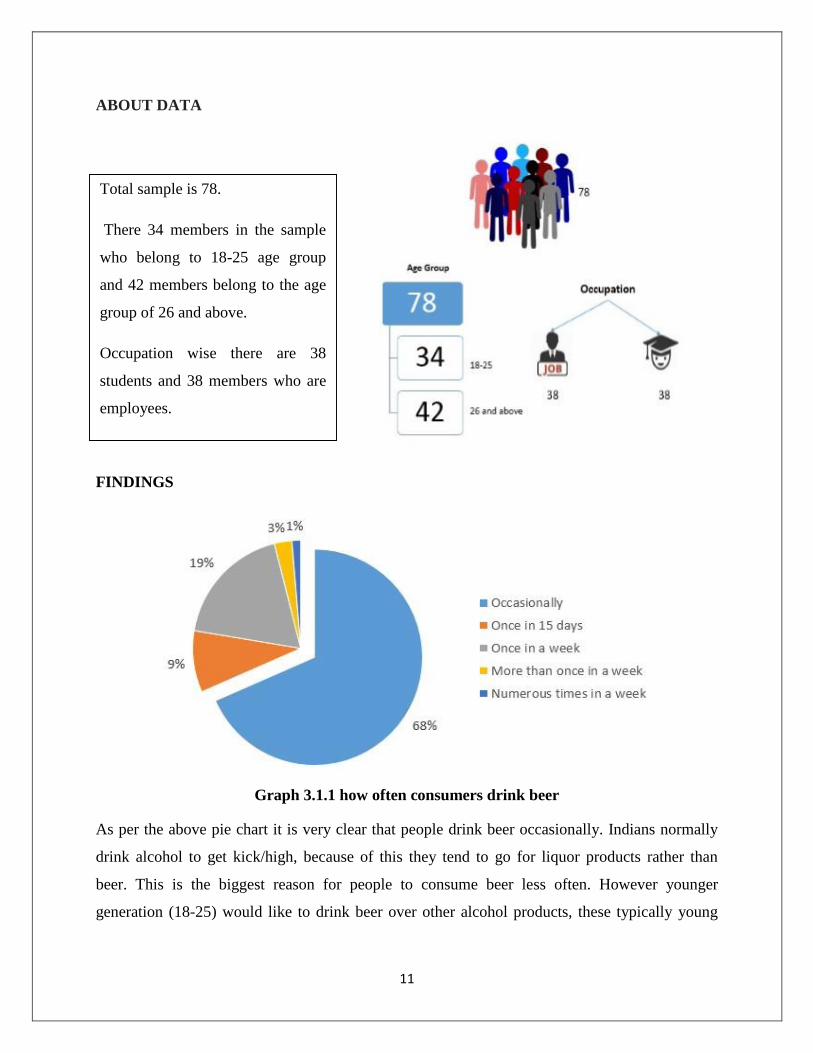
ABOUT DATA
FINDINGS
Graph 3.1.1 how often consumers drink beer
As per the above pie chart it is very clear that people drink beer occasionally. Indians normally
drink alcohol to get kick/high, because of this they tend to go for liquor products rather than
beer. This is the biggest reason for people to consume beer less often. However younger
generation (18-25) would like to drink beer over other alcohol products, these typically young
Total sample is 78.
There 34 members in the sample
who belong to 18-25 age group
and 42 members belong to the age
group of 26 and above.
Occupation wise there are 38
students and 38 members who are
employees.
12
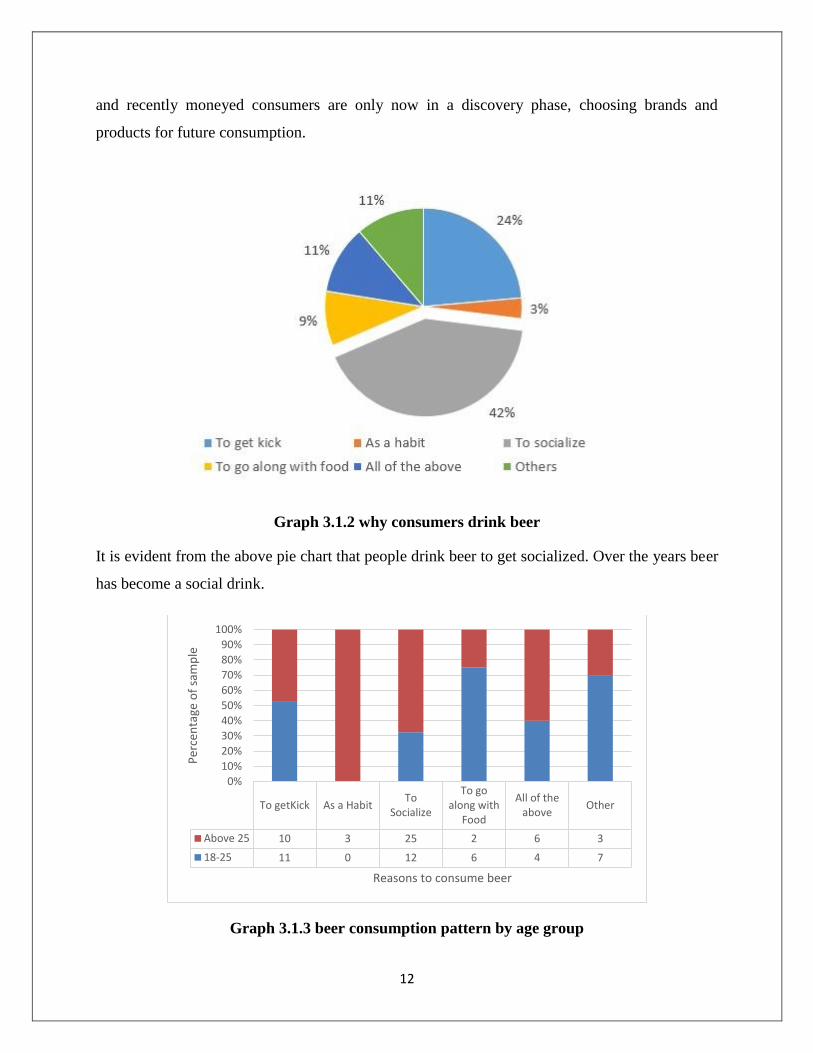
and recently moneyed consumers are only now in a discovery phase, choosing brands and
products for future consumption.
Graph 3.1.2 why consumers drink beer
It is evident from the above pie chart that people drink beer to get socialized. Over the years beer
has become a social drink.
Graph 3.1.3 beer consumption pattern by age group
To getKick As a HabitTo
Socialize
To goalong with
Food
All of theabove
Other
Above 25 10 3 25 2 6 3
18-25 11 0 12 6 4 7
0%
10%
20%
30%
40%
50%
60%
70%
80%
90%
100%
Per
cen
tage
of
sam
ple
Reasons to consume beer
13
From the above graph, it is evident that after socialization people drink beer to get kick. This is
the main reason behind the huge demand for strong beer in India.
Carlsberg: Carlsberg has two different products to serve to these age groups. First one,
Carlsberg is an all-malt beer, the first in the country, it targets customers at the high end of the
market – Businessmen, Senior Executives and other. The second is Tuborg which is an entry
point, easy drinking innovation with pull-off cap. It targets young adults and is about fun. On the
whole Carlsberg wants position itself as a premium beer brand.
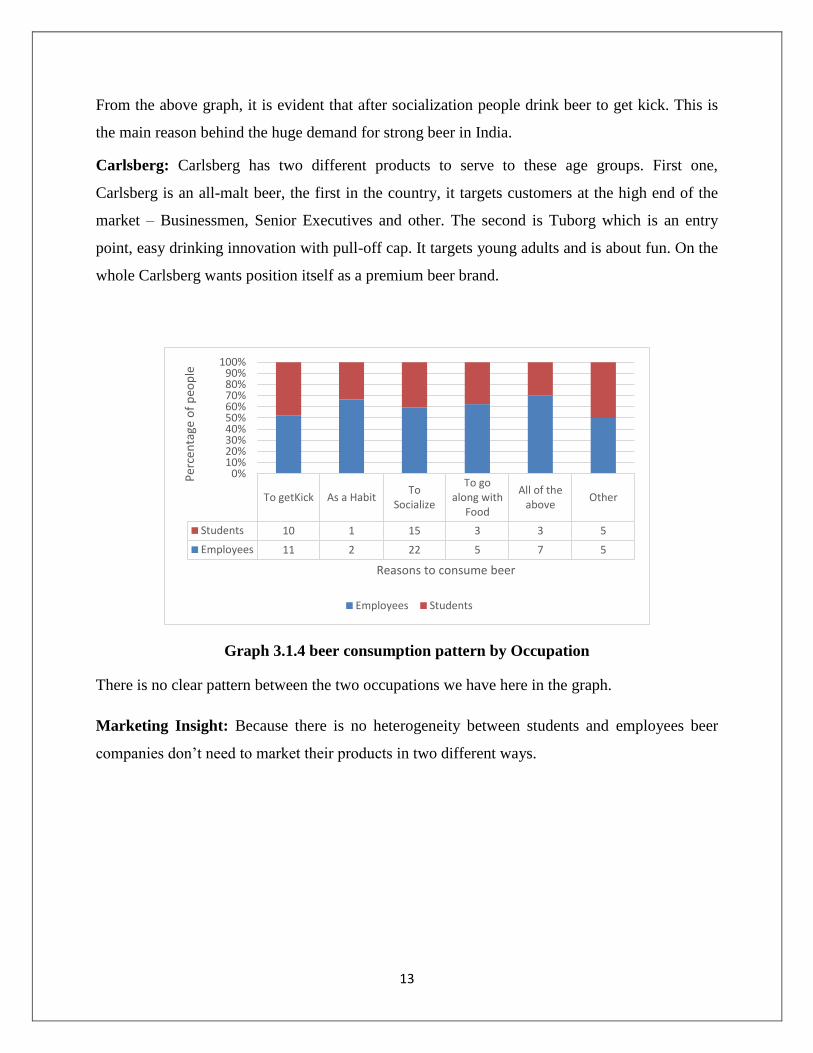
Graph 3.1.4 beer consumption pattern by Occupation
There is no clear pattern between the two occupations we have here in the graph.
Marketing Insight: Because there is no heterogeneity between students and employees beer
companies don’t need to market their products in two different ways.
To getKick As a HabitTo
Socialize
To goalong with
Food
All of theabove
Other
Students 10 1 15 3 3 5
Employees 11 2 22 5 7 5
0%10%20%30%40%50%60%70%80%90%
100%
Per
cen
tage
of
peo
ple
Reasons to consume beer
Employees Students
14
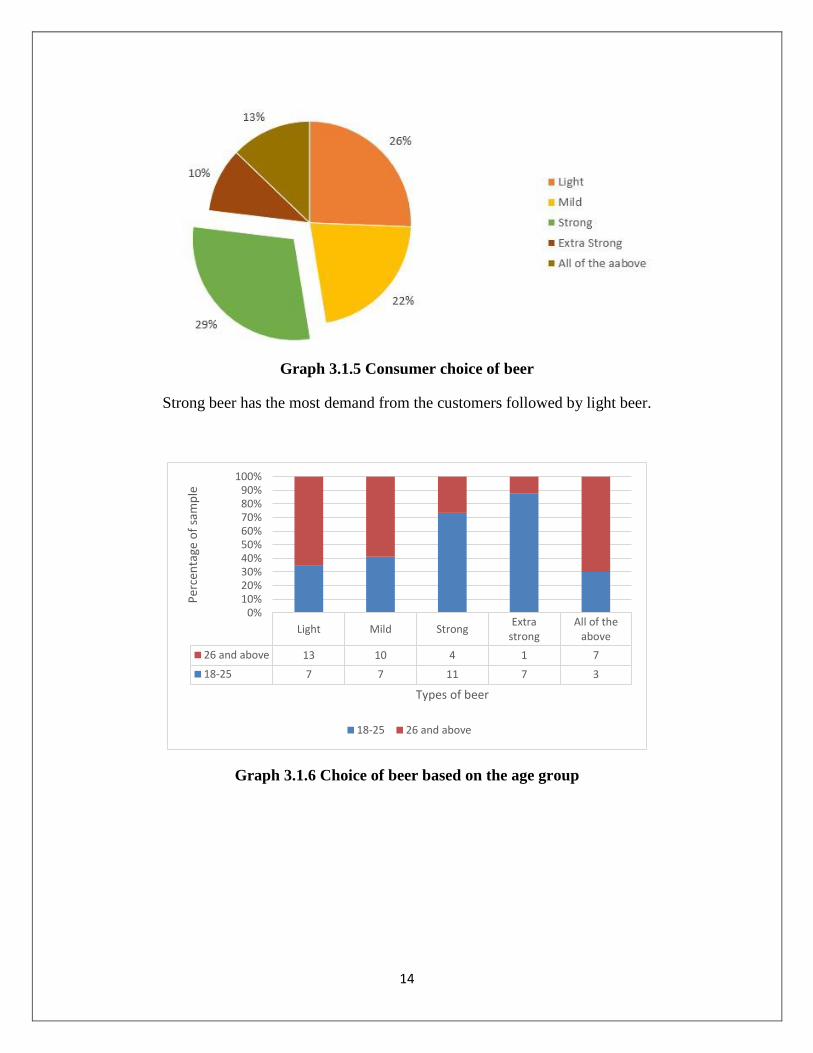
Graph 3.1.5 Consumer choice of beer
Strong beer has the most demand from the customers followed by light beer.
Graph 3.1.6 Choice of beer based on the age group
Light Mild StrongExtra
strongAll of the
above
26 and above 13 10 4 1 7
18-25 7 7 11 7 3
0%10%20%30%40%50%60%70%80%90%
100%
Per
cen
tage
of
sam
ple
Types of beer
18-25 26 and above
15
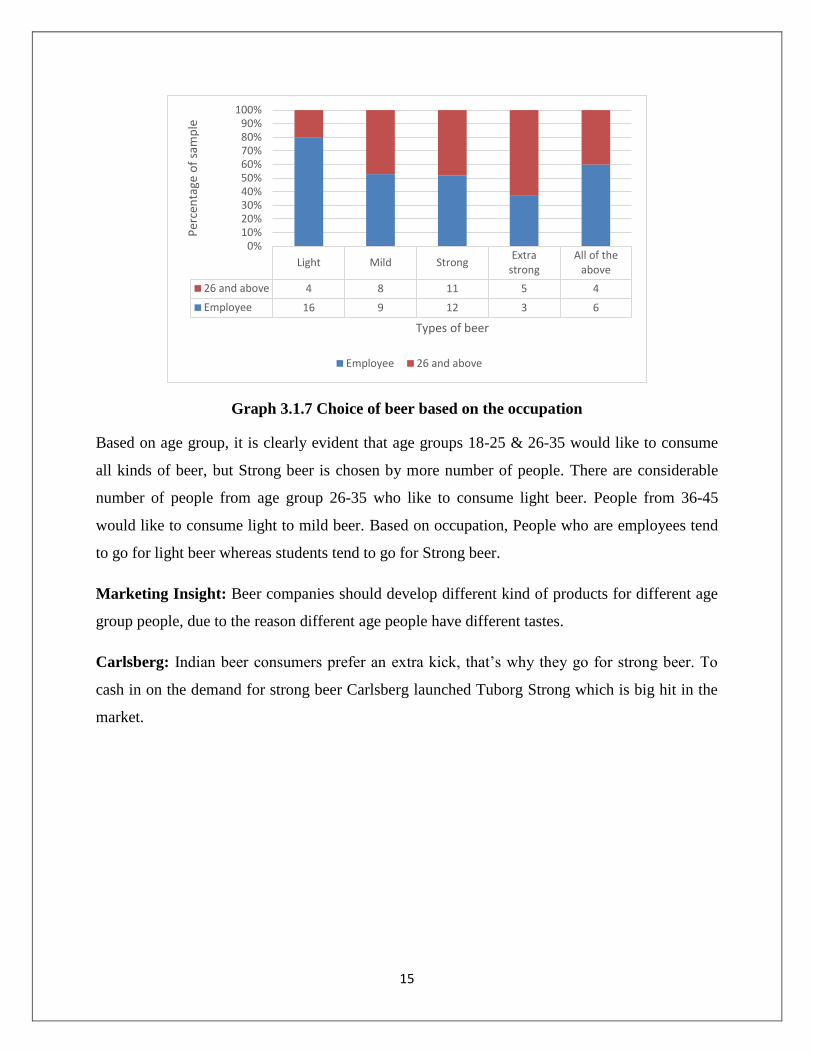
Graph 3.1.7 Choice of beer based on the occupation
Based on age group, it is clearly evident that age groups 18-25 & 26-35 would like to consume
all kinds of beer, but Strong beer is chosen by more number of people. There are considerable
number of people from age group 26-35 who like to consume light beer. People from 36-45
would like to consume light to mild beer. Based on occupation, People who are employees tend
to go for light beer whereas students tend to go for Strong beer.
Marketing Insight: Beer companies should develop different kind of products for different age
group people, due to the reason different age people have different tastes.
Carlsberg: Indian beer consumers prefer an extra kick, that’s why they go for strong beer. To
cash in on the demand for strong beer Carlsberg launched Tuborg Strong which is big hit in the
market.
Light Mild StrongExtra
strongAll of the
above
26 and above 4 8 11 5 4
Employee 16 9 12 3 6
0%10%20%30%40%50%60%70%80%90%
100%
Per
cen
tage
of
sam
ple
Types of beer
Employee 26 and above
16
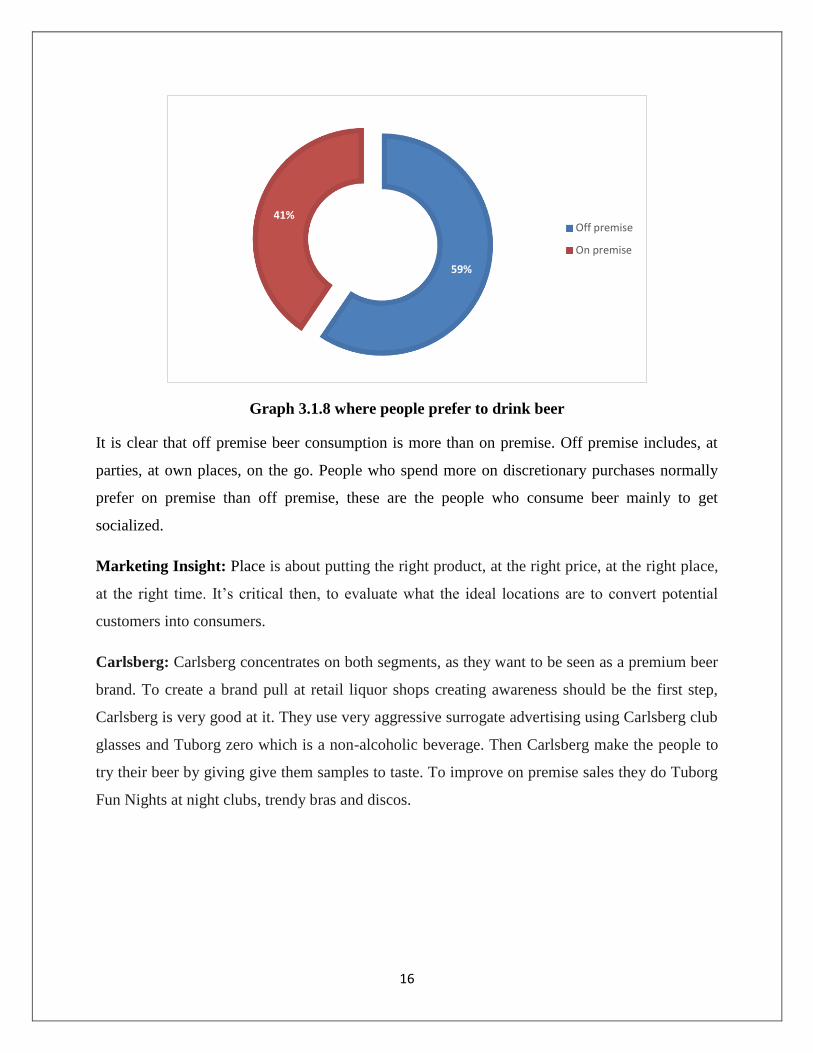
Graph 3.1.8 where people prefer to drink beer
It is clear that off premise beer consumption is more than on premise. Off premise includes, at
parties, at own places, on the go. People who spend more on discretionary purchases normally
prefer on premise than off premise, these are the people who consume beer mainly to get
socialized.
Marketing Insight: Place is about putting the right product, at the right price, at the right place,
at the right time. It’s critical then, to evaluate what the ideal locations are to convert potential
customers into consumers.
Carlsberg: Carlsberg concentrates on both segments, as they want to be seen as a premium beer
brand. To create a brand pull at retail liquor shops creating awareness should be the first step,
Carlsberg is very good at it. They use very aggressive surrogate advertising using Carlsberg club
glasses and Tuborg zero which is a non-alcoholic beverage. Then Carlsberg make the people to
try their beer by giving give them samples to taste. To improve on premise sales they do Tuborg
Fun Nights at night clubs, trendy bras and discos.
59%
41%Off premise
On premise
17
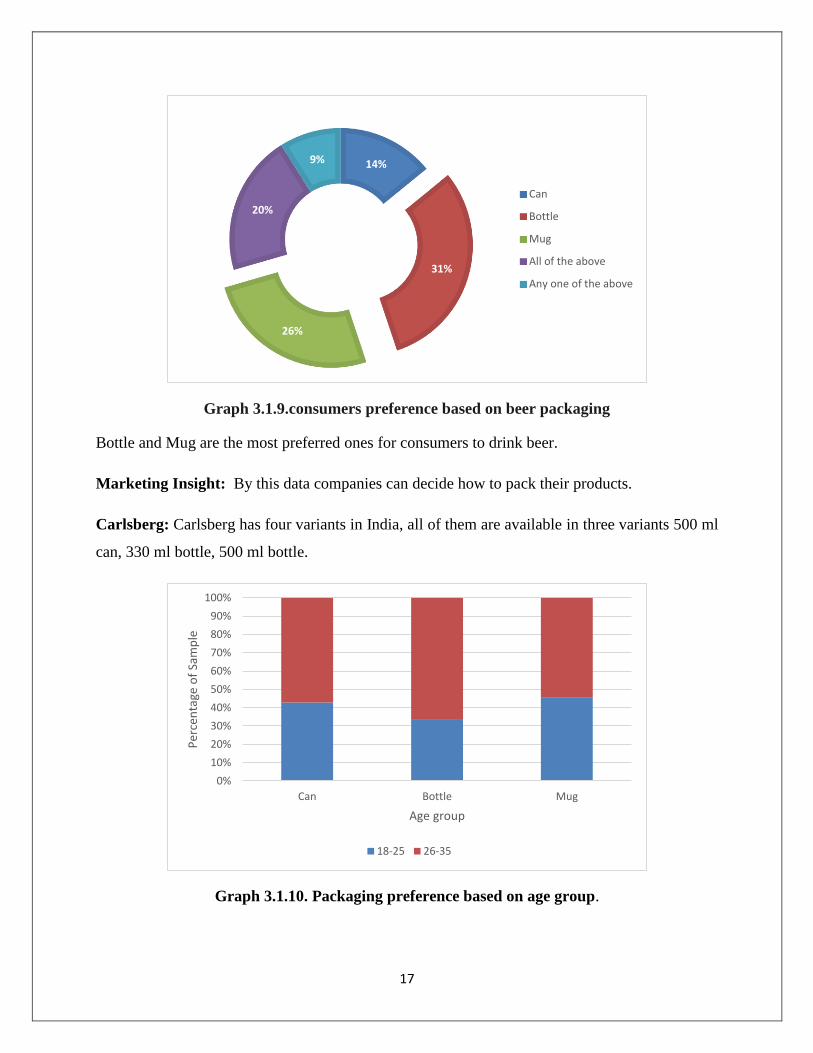
Graph 3.1.9.consumers preference based on beer packaging
Bottle and Mug are the most preferred ones for consumers to drink beer.
Marketing Insight: By this data companies can decide how to pack their products.
Carlsberg: Carlsberg has four variants in India, all of them are available in three variants 500 ml
can, 330 ml bottle, 500 ml bottle.
Graph 3.1.10. Packaging preference based on age group.
14%
31%
26%
20%
9%
Can
Bottle
Mug
All of the above
Any one of the above
0%
10%
20%
30%
40%
50%
60%
70%
80%
90%
100%
Can Bottle Mug
Per
cen
tage
of
Sam
ple
Age group
18-25 26-35
18
More no of people would like to drink beer in bottle. There are significant no of people who like
to drink beer in mug. Age group wise, younger generation would like to drink beer in mug,
whereas the other age groups prefer bottle.
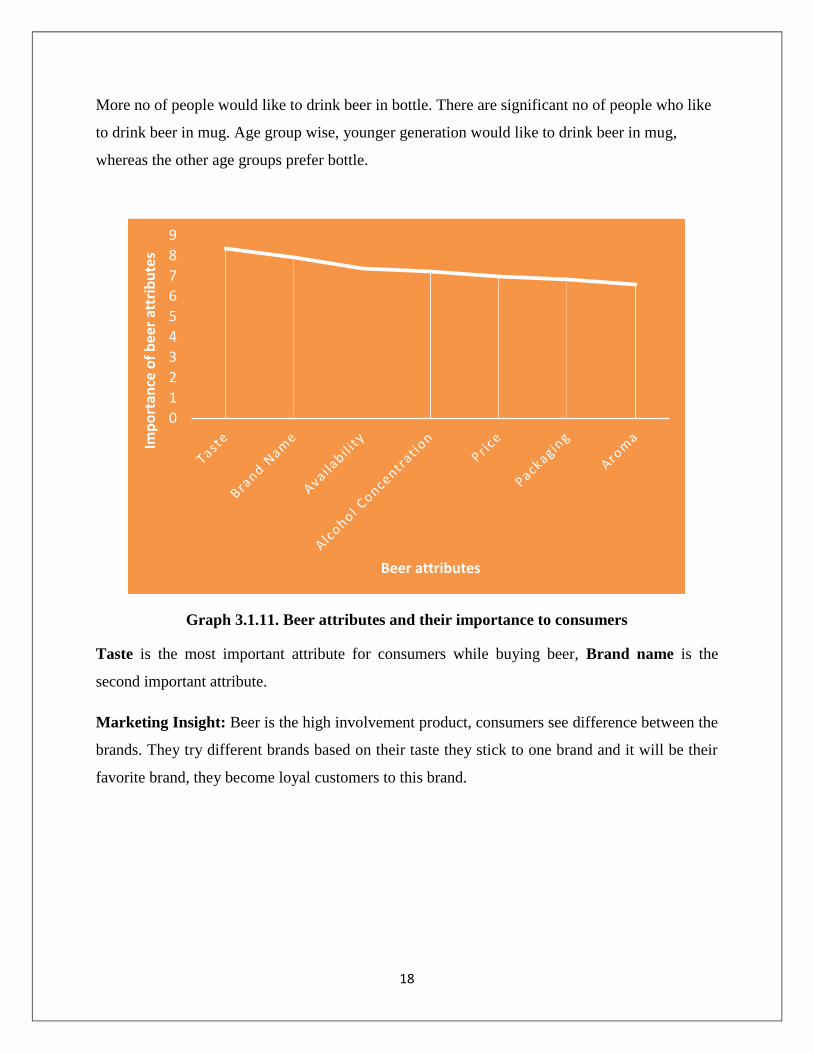
Graph 3.1.11. Beer attributes and their importance to consumers
Taste is the most important attribute for consumers while buying beer, Brand name is the
second important attribute.
Marketing Insight: Beer is the high involvement product, consumers see difference between the
brands. They try different brands based on their taste they stick to one brand and it will be their
favorite brand, they become loyal customers to this brand.
0
1
2
3
4
5
6
7
8
9
Imp
ort
ance
of
bee
r at
trib
ute
s
Beer attributes
19
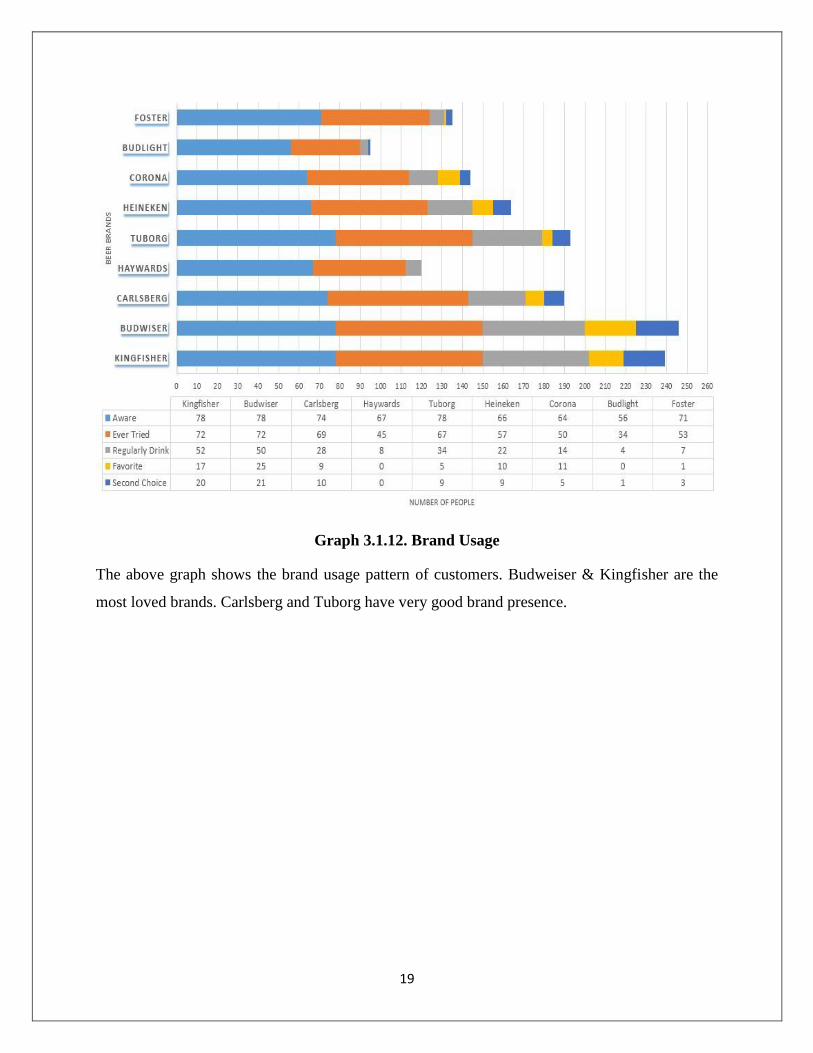
Graph 3.1.12. Brand Usage
The above graph shows the brand usage pattern of customers. Budweiser & Kingfisher are the
most loved brands. Carlsberg and Tuborg have very good brand presence.
20
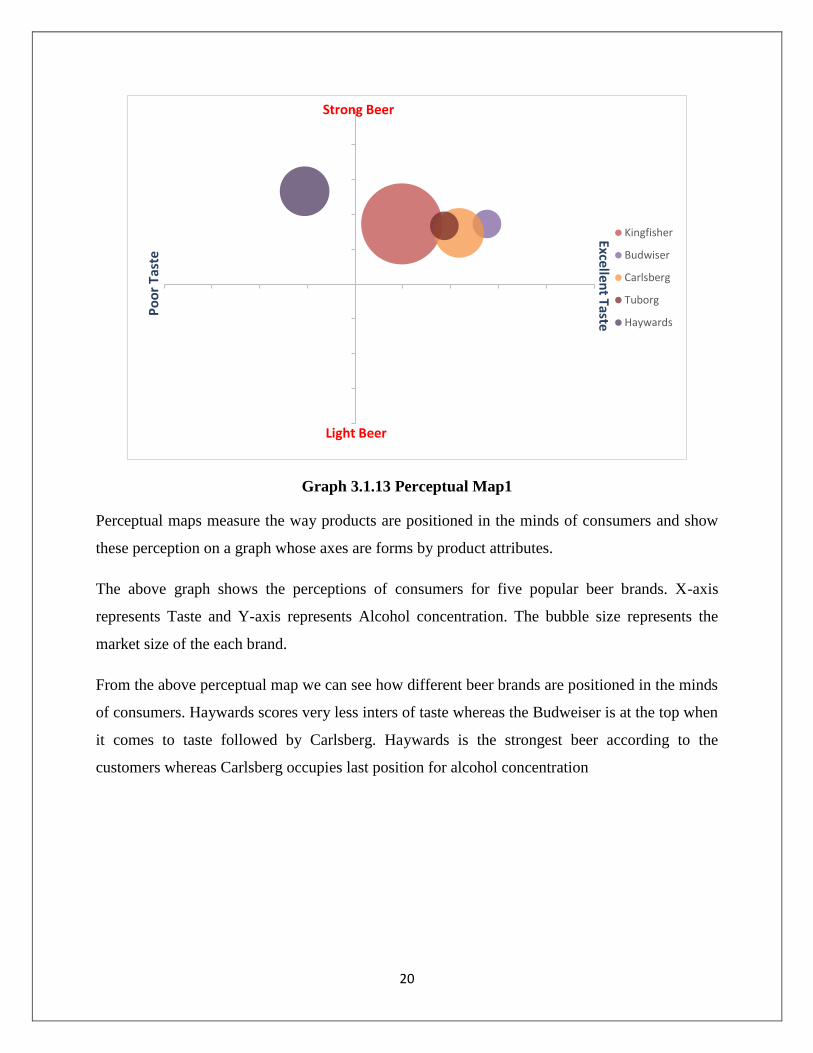
Graph 3.1.13 Perceptual Map1
Perceptual maps measure the way products are positioned in the minds of consumers and show
these perception on a graph whose axes are forms by product attributes.
The above graph shows the perceptions of consumers for five popular beer brands. X-axis
represents Taste and Y-axis represents Alcohol concentration. The bubble size represents the
market size of the each brand.
From the above perceptual map we can see how different beer brands are positioned in the minds
of consumers. Haywards scores very less inters of taste whereas the Budweiser is at the top when
it comes to taste followed by Carlsberg. Haywards is the strongest beer according to the
customers whereas Carlsberg occupies last position for alcohol concentration
Po
or
Tas
te
Light Beer
Kingfisher
Budwiser
Carlsberg
Tuborg
Haywards
Strong Beer
Excellent Taste
21
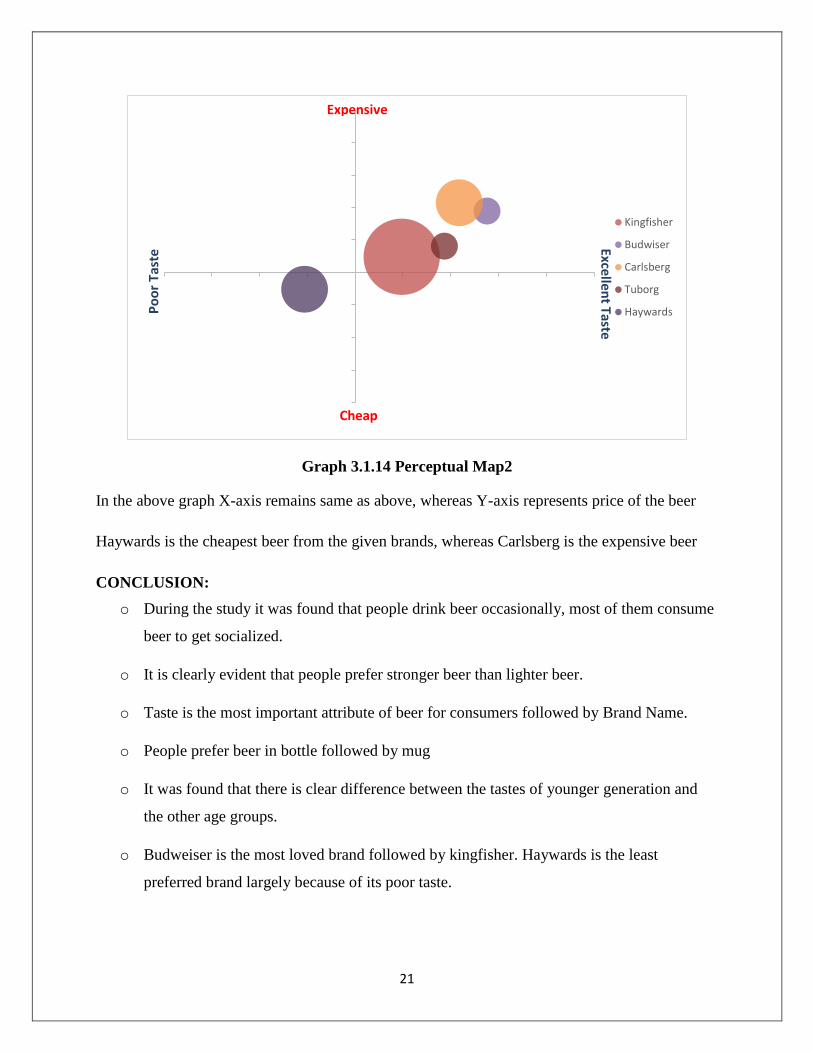
Graph 3.1.14 Perceptual Map2
In the above graph X-axis remains same as above, whereas Y-axis represents price of the beer
Haywards is the cheapest beer from the given brands, whereas Carlsberg is the expensive beer
CONCLUSION:
o During the study it was found that people drink beer occasionally, most of them consume
beer to get socialized.
o It is clearly evident that people prefer stronger beer than lighter beer.
o Taste is the most important attribute of beer for consumers followed by Brand Name.
o People prefer beer in bottle followed by mug
o It was found that there is clear difference between the tastes of younger generation and
the other age groups.
o Budweiser is the most loved brand followed by kingfisher. Haywards is the least
preferred brand largely because of its poor taste.
Po
or
Tas
te
Cheap
Kingfisher
Budwiser
Carlsberg
Tuborg
Haywards
Expensive
Excellent Taste
22
3.2. BIBLIOGRAPHY:
o http://www.unitedspirits.in/Investor_Reports/424333556USL%20Annual%20Report%20
-%202016.pdf
o http://unitedbreweries.com/pdf/InvestorReport/UBL_Annual_Report_2015-16.pdf
o http://businessworld.in/article/Battle-Of-The-Brew/19-01-2016-90403/
o https://en.wikipedia.org/wiki/Beer_in_India
o http://www.carlsbergindia.com/company/MD_message/Pages/MD'sMessage.aspx
o http://www.purelybranded.com/insights/the-four-ps-of-marketing/
o UBL 2015-2016 annual report
o United Spirits 2015-2016 annual report
3.3. APPENDICES
Questionnaire
Good Morning/ Afternoon/ Evening, I am a student of MYRA School of Business. I am
conducting a survey amongst people in Mysore on Beer buying behavior. This survey is for
academic purpose. It will take 10 minutes of your time. I would like to assure you that all the
information given would be treated in confidence.
1. Do you or anyone in your family work for any of the following types of businesses or
not?
☐ Advertising agency
☐ Market research or Marketing firm
☐ Company representing /manufacturing /distributing alcohol products
☐ None of the above
2. Which beer do you like?
☐ Light
☐ Mild
☐ Strong
☐ Extra Strong
☐ All of the above
23
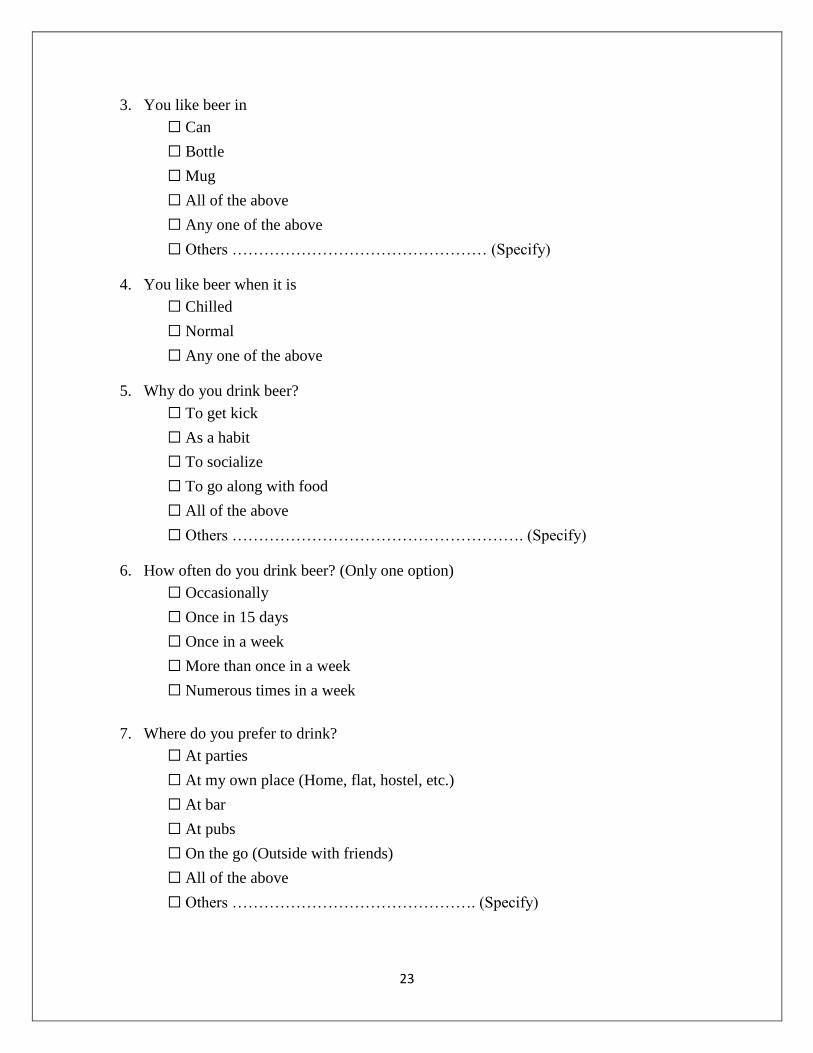
3. You like beer in
☐ Can
☐ Bottle
☐ Mug
☐ All of the above
☐ Any one of the above
☐ Others ………………………………………… (Specify)
4. You like beer when it is
☐ Chilled
☐ Normal
☐ Any one of the above
5. Why do you drink beer?
☐ To get kick
☐ As a habit
☐ To socialize
☐ To go along with food
☐ All of the above
☐ Others ………………………………………………. (Specify)
6. How often do you drink beer? (Only one option)
☐ Occasionally
☐ Once in 15 days
☐ Once in a week
☐ More than once in a week
☐ Numerous times in a week
7. Where do you prefer to drink?
☐ At parties
☐ At my own place (Home, flat, hostel, etc.)
☐ At bar
☐ At pubs
☐ On the go (Outside with friends)
☐ All of the above
☐ Others ………………………………………. (Specify)
24
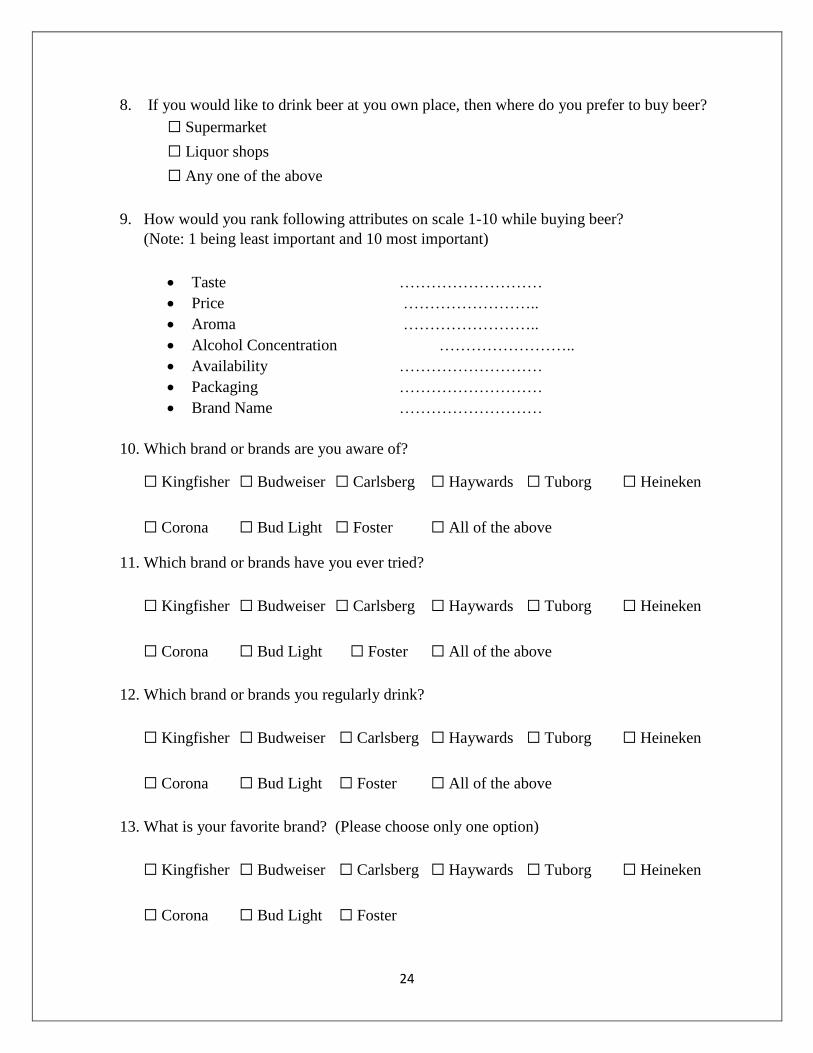
8. If you would like to drink beer at you own place, then where do you prefer to buy beer?
☐ Supermarket
☐ Liquor shops
☐ Any one of the above
9. How would you rank following attributes on scale 1-10 while buying beer?
(Note: 1 being least important and 10 most important)
Taste ………………………
Price ……………………..
Aroma ……………………..
Alcohol Concentration ……………………..
Availability ………………………
Packaging ………………………
Brand Name ………………………
10. Which brand or brands are you aware of?
☐ Kingfisher ☐ Budweiser ☐ Carlsberg ☐ Haywards ☐ Tuborg ☐ Heineken
☐ Corona ☐ Bud Light ☐ Foster ☐ All of the above
11. Which brand or brands have you ever tried?
☐ Kingfisher ☐ Budweiser ☐ Carlsberg ☐ Haywards ☐ Tuborg ☐ Heineken
☐ Corona ☐ Bud Light ☐ Foster ☐ All of the above
12. Which brand or brands you regularly drink?
☐ Kingfisher ☐ Budweiser ☐ Carlsberg ☐ Haywards ☐ Tuborg ☐ Heineken
☐ Corona ☐ Bud Light ☐ Foster ☐ All of the above
13. What is your favorite brand? (Please choose only one option)
☐ Kingfisher ☐ Budweiser ☐ Carlsberg ☐ Haywards ☐ Tuborg ☐ Heineken
☐ Corona ☐ Bud Light ☐ Foster
25
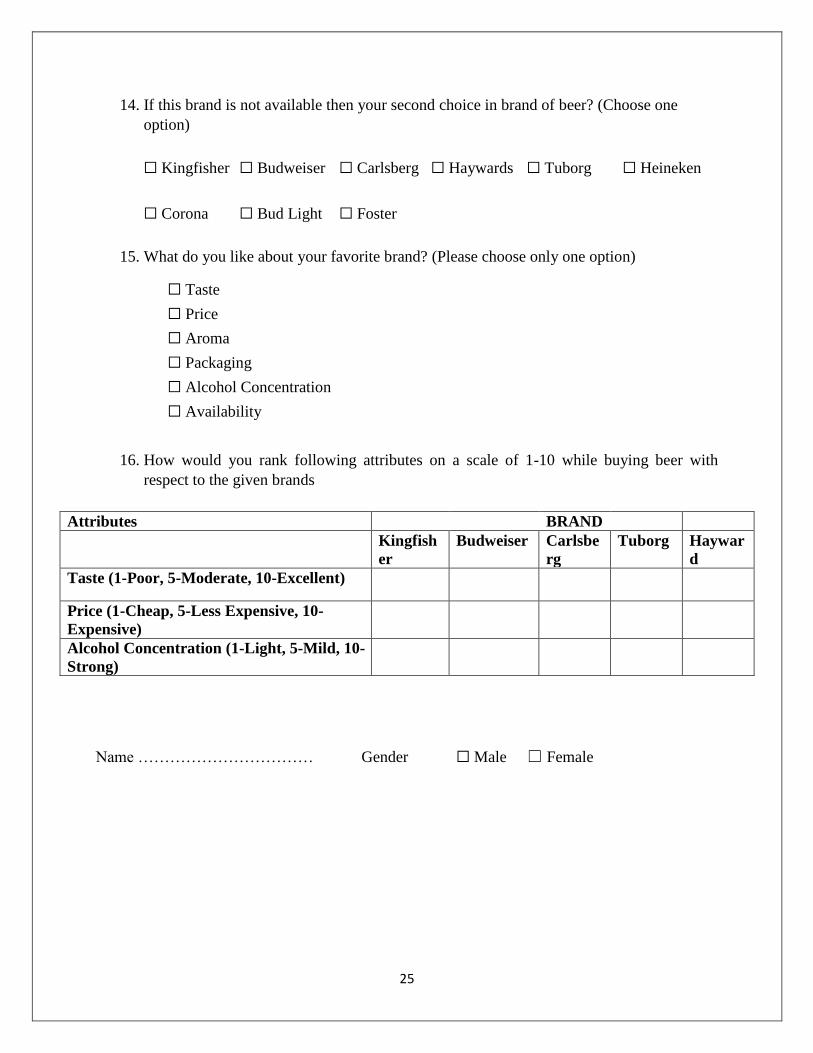
14. If this brand is not available then your second choice in brand of beer? (Choose one
option)
☐ Kingfisher ☐ Budweiser ☐ Carlsberg ☐ Haywards ☐ Tuborg ☐ Heineken
☐ Corona ☐ Bud Light ☐ Foster
15. What do you like about your favorite brand? (Please choose only one option)
☐ Taste
☐ Price
☐ Aroma
☐ Packaging
☐ Alcohol Concentration
☐ Availability
16. How would you rank following attributes on a scale of 1-10 while buying beer with
respect to the given brands
Attributes BRAND
Kingfish
er
Budweiser Carlsbe
rg
Tuborg Haywar
d
Taste (1-Poor, 5-Moderate, 10-Excellent)
Price (1-Cheap, 5-Less Expensive, 10-
Expensive)
Alcohol Concentration (1-Light, 5-Mild, 10-
Strong)
Name …………………………… Gender ☐ Male ☐ Female
26
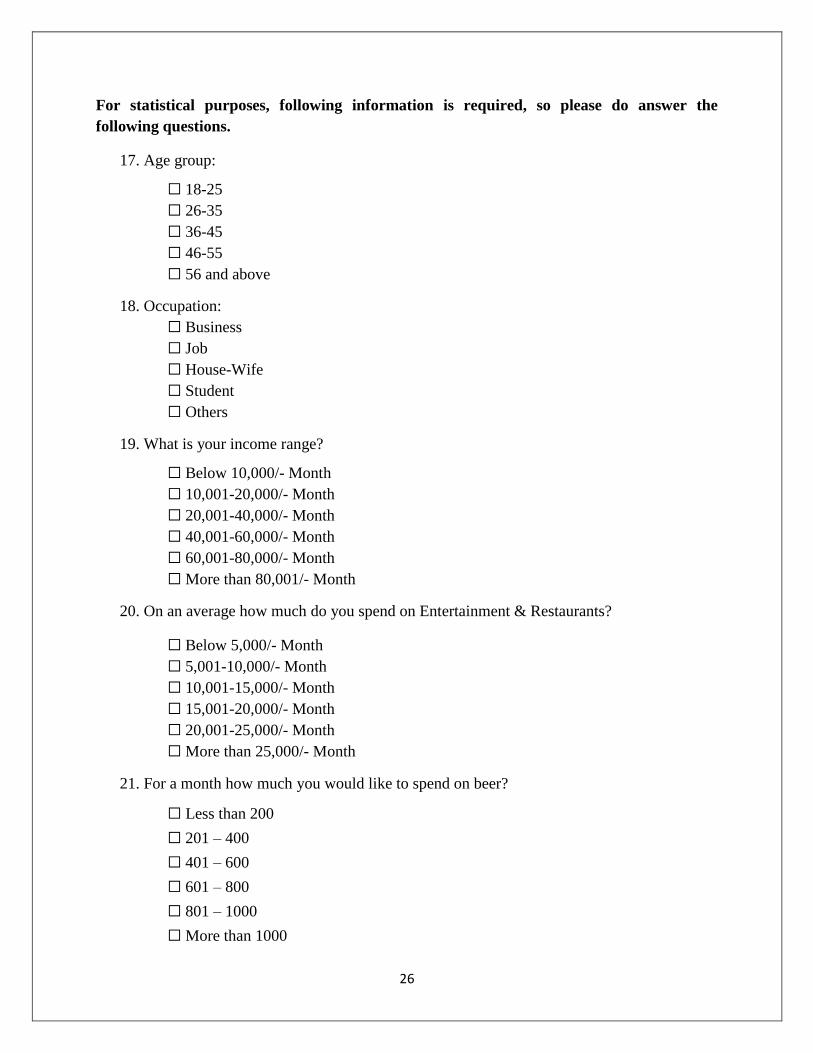
For statistical purposes, following information is required, so please do answer the
following questions.
17. Age group:
☐ 18-25
☐ 26-35
☐ 36-45
☐ 46-55
☐ 56 and above
18. Occupation:
☐ Business
☐ Job
☐ House-Wife
☐ Student
☐ Others
19. What is your income range?
☐ Below 10,000/- Month
☐ 10,001-20,000/- Month
☐ 20,001-40,000/- Month
☐ 40,001-60,000/- Month
☐ 60,001-80,000/- Month
☐ More than 80,001/- Month
20. On an average how much do you spend on Entertainment & Restaurants?
☐ Below 5,000/- Month
☐ 5,001-10,000/- Month
☐ 10,001-15,000/- Month
☐ 15,001-20,000/- Month
☐ 20,001-25,000/- Month
☐ More than 25,000/- Month
21. For a month how much you would like to spend on beer?
☐ Less than 200
☐ 201 – 400
☐ 401 – 600
☐ 601 – 800
☐ 801 – 1000
☐ More than 1000

27