TV advertising’s killer charts What every marketer should know
10 nickable charts With notes
Taster Deck
Published: June 2015
Presenter
Presentation Notes
Hello. Welcome to ‘TV advertising’s killer charts’. This deck brings together the killer evidence which explains how and why TV is the most effective form of advertising – and is in fact becoming more effective. If you have any questions about this deck – or would like more information on any topic – please contact us via [email protected].
Thinkbox is supported by 99% of UK broadcasting
Main shareholders
Associates & supporters
Presenter
Presentation Notes
Before the killer charts, a quick word about Thinkbox. Thinkbox is the marketing body for commercial TV in the UK, in all its forms – broadcast, on-demand and interactive. We work with the marketing community with a single ambition: to help advertisers get the best out of today’s TV. Thinkbox’s shareholders are Channel 4, ITV, Sky Media, Turner Media Innovations and UKTV, who together represent 99% of commercial TV advertising revenue through their owned and partner TV channels. Associate Members are RTL Group, Virgin Media, London Live, Norway’s SBS Discovery and Australia’s ThinkTV. Discovery Channel UK, UTV and STV also give direct financial support. TV today has more to offer advertisers than ever before, not least because this growing medium remains at the heart of popular culture and advertising effectiveness. From understanding how audiences engage with TV advertising, uncovering what the latest technological developments mean, explaining innovative and affordable solutions, and encouraging creativity to providing the rigorous proof of effectiveness that advertisers need, Thinkbox is here to help customers meet their marketing objectives.
2014 saw the launch of ‘Payback 4: Pathways to Profit’, an independent econometric study by Ebiquity – commissioned by Thinkbox. One of the key findings from the research was that TV remains the most effective form of advertising, generating the most profit pound for pound. The study was an analysis of over 4,500 ad campaigns across 10 advertising sectors between 2008 and 2014. It compared, on a like-for-like basis, the sales and profit impact of five forms of advertising: TV (linear spot and sponsorship), radio, press, online display (excluding video on demand) and outdoor. The study is an update on Ebiquity’s previous effectiveness study for Thinkbox, Payback 3, which was published in 2011.
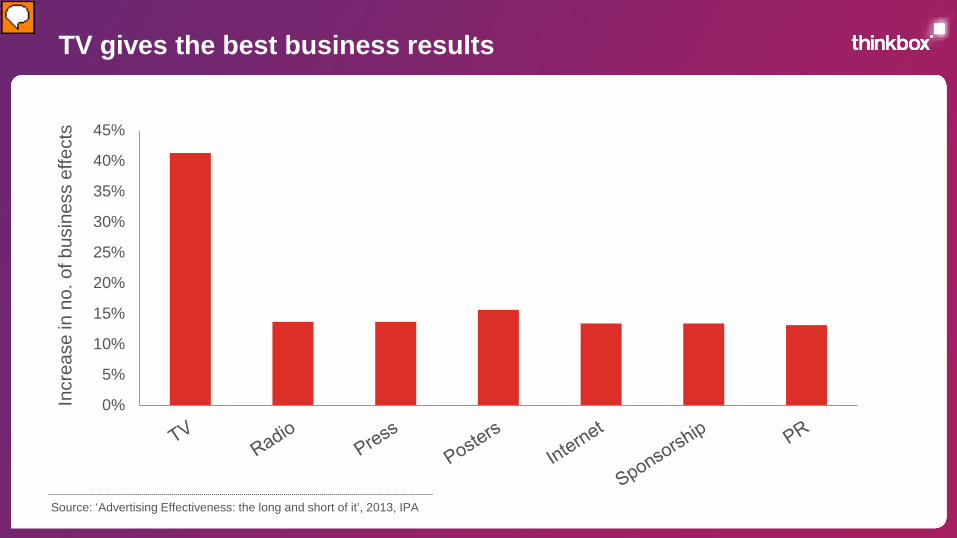
TV gives the best business results
0%
5%
10%
15%
20%
25%
30%
35%
40%
45%
Incr
ease
in n
o. o
f bus
ines
s ef
fect
s
Source: ‘Advertising Effectiveness: the long and short of it’, 2013, IPA
Presenter
Presentation Notes
‘Advertising Effectiveness: the long and short of it’ by the IPA demonstrated that TV stands head and shoulders above other media in driving business results. It adds the greatest number of business effects to a campaign – things such as sales, profit, market share – and, the more business effects, the more commercially successful the campaign will be.
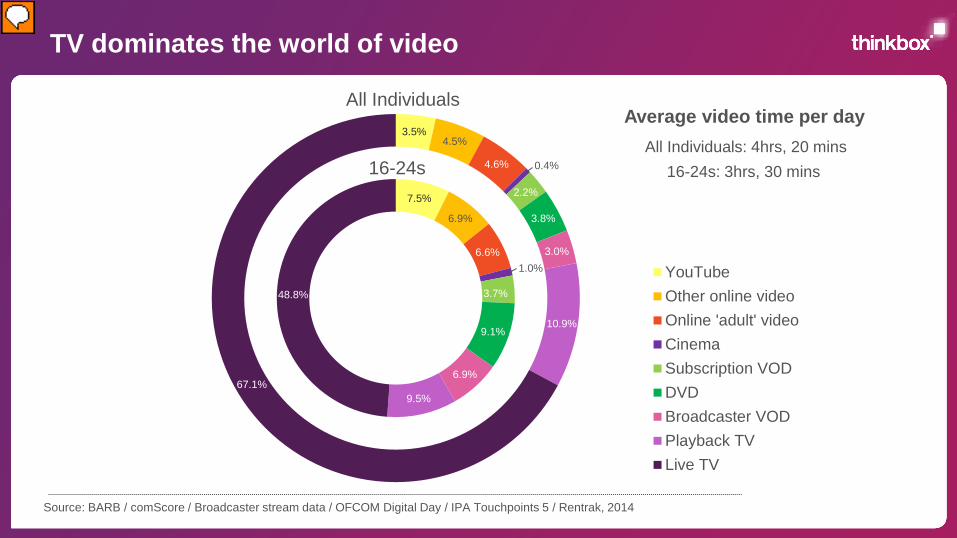
TV dominates the world of video
Source: BARB / comScore / Broadcaster stream data / OFCOM Digital Day / IPA Touchpoints 5 / Rentrak, 2014
7.5%
6.9%
6.6%
3.7%
9.1%
6.9%
9.5%
48.8%
3.5% 4.5%
4.6%
2.2%
3.8%
3.0%
10.9%
67.1%
YouTubeOther online videoOnline 'adult' videoCinemaSubscription VODDVDBroadcaster VODPlayback TVLive TV
All Individuals: 4hrs, 20 mins 16-24s: 3hrs, 30 mins
All Individuals
16-24s
Average video time per day
0.4%
1.0%
Presenter
Presentation Notes
All TV is video, but not all video is TV. TV is special for its content, its context and its huge appeal. There are lots of different types of video, from linear TV to online video, to subscription VOD services like Netflix, to cinema. TV viewing (live, playback and the Broadcasters’ VOD services) dominates the video viewing of all ages. Younger people have always watched less TV than the average and this generation of 16-24s has a more varied video diet. TV accounts for 65% of their total video viewing compared to the UK average of 81%. Another part of the reason for this difference in video consumption is the fact that 16-24s are the biggest fans of watching video on new screens, such as tablets and smartphones. 30% of 16-24s’ video viewing is on these devices – double that of the average individual at 15%.
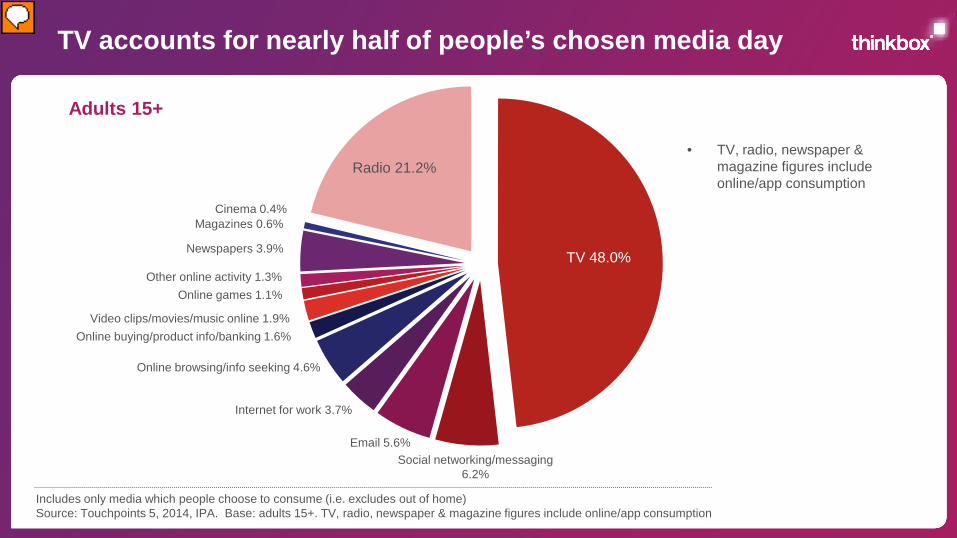
TV accounts for nearly half of people’s chosen media day
TV 48.0%
Radio 21.2%
Video clips/movies/music online 1.9%
Adults 15+
Includes only media which people choose to consume (i.e. excludes out of home) Source: Touchpoints 5, 2014, IPA. Base: adults 15+. TV, radio, newspaper & magazine figures include online/app consumption
Newspapers 3.9%
Magazines 0.6% Cinema 0.4%
• TV, radio, newspaper & magazine figures include online/app consumption
Other online activity 1.3% Online games 1.1%
Online buying/product info/banking 1.6%
Online browsing/info seeking 4.6%
Internet for work 3.7%
Email 5.6% Social networking/messaging
6.2%
Presenter
Presentation Notes
According to the IPA’s most recent Touchpoints study, TV accounts for 48% of the time people choose to spend with media.
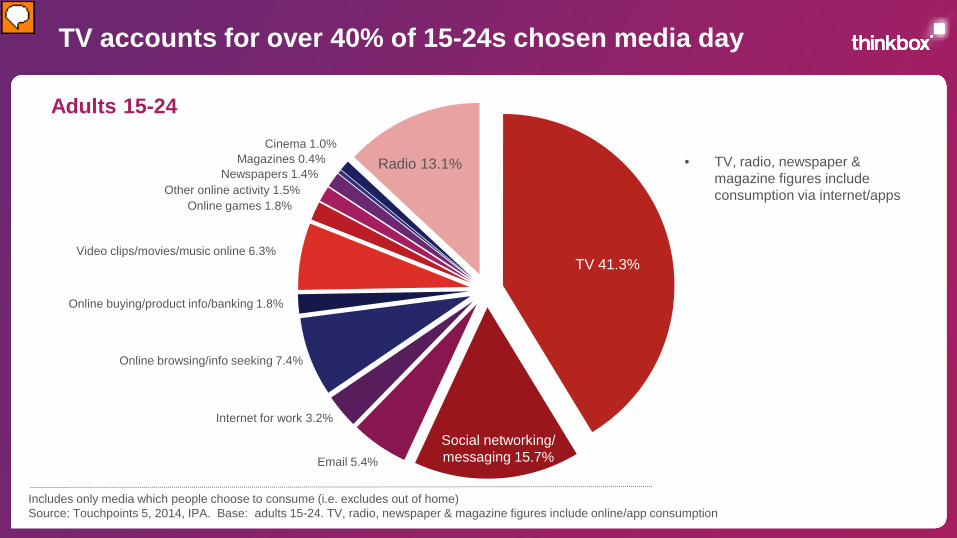
TV accounts for over 40% of 15-24s chosen media day
TV 41.3%
Radio 13.1%
Adults 15-24
Newspapers 1.4% Magazines 0.4%
Cinema 1.0% • TV, radio, newspaper &
magazine figures include consumption via internet/apps Other online activity 1.5%
Online games 1.8%
Online buying/product info/banking 1.8%
Online browsing/info seeking 7.4%
Internet for work 3.2%
Email 5.4%
Social networking/ messaging 15.7%
Video clips/movies/music online 6.3%
Includes only media which people choose to consume (i.e. excludes out of home) Source: Touchpoints 5, 2014, IPA. Base: adults 15-24. TV, radio, newspaper & magazine figures include online/app consumption
Presenter
Presentation Notes
As with the UK as a whole, the same is true of younger people: according to the IPA’s Touchpoints, TV takes the lion’s share of 15-24s’ chosen media day.
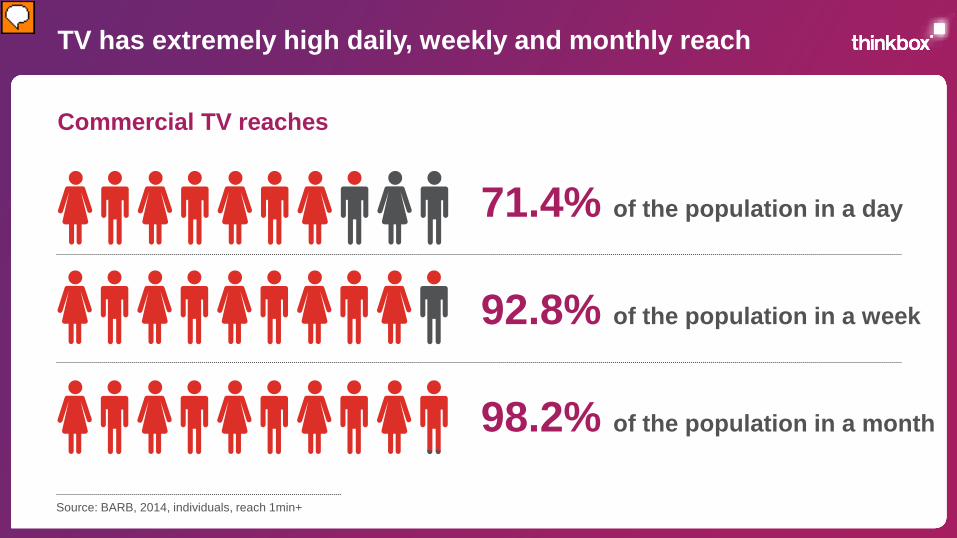
TV has extremely high daily, weekly and monthly reach
Source: BARB, 2014, individuals, reach 1min+
Commercial TV reaches
71.4% of the population in a day
92.8% of the population in a week
98.2% of the population in a month
Presenter
Presentation Notes
TV has the greatest reach of all media. No other form of advertising can build scale as quickly and powerfully as TV.
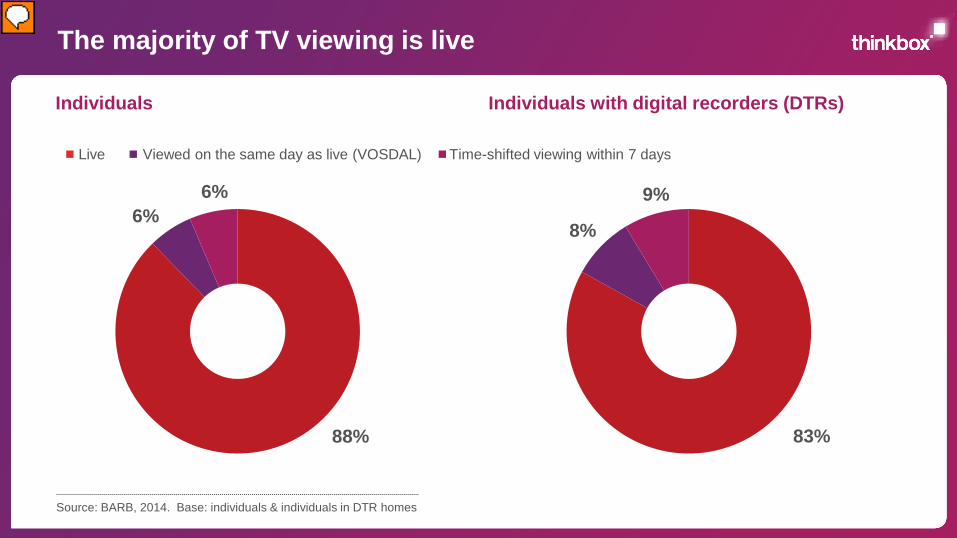
The majority of TV viewing is live
Source: BARB, 2014. Base: individuals & individuals in DTR homes
Individuals Individuals with DTRs
88%
6% 6%
Individuals Individuals with digital recorders (DTRs)
83%
8%
9%
Live Viewed on the same day as live (VOSDAL) Time-shifted viewing within 7 days
Presenter
Presentation Notes
In 2014, 88% of all TV set viewing was watched live compared to 89% in 2013 (there is no data yet to show what proportion of TV watched on other screens is live-streamed). Specifically in the 58% of households that own a digital television recorder (DTR), 83% of TV on a TV set in 2014 was watched live compared to 84% in 2013. The level of non-live viewing (i.e. playback and VOD within 7 days on a TV set) seems to be settling around the 15-20% mark.
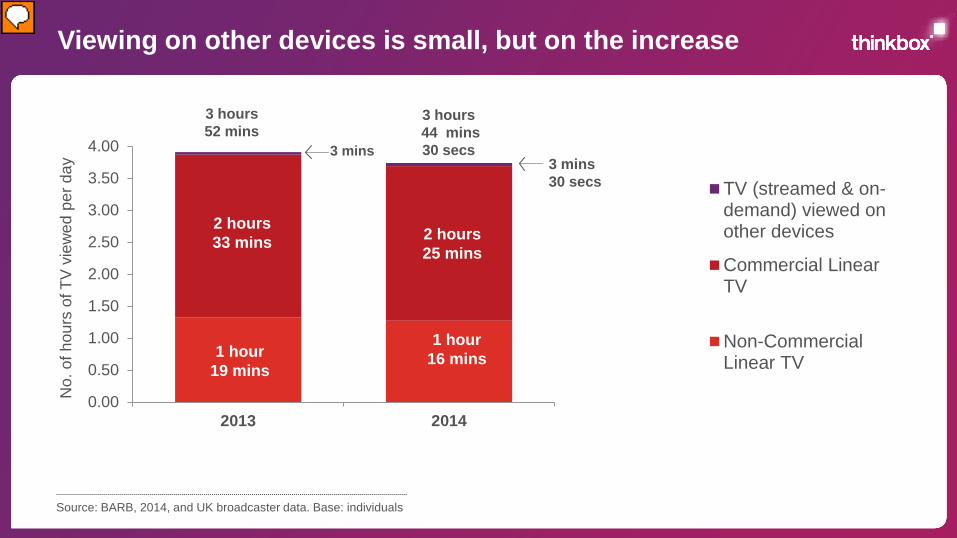
Viewing on other devices is small, but on the increase
Source: BARB, 2014, and UK broadcaster data. Base: individuals
0.00
0.50
1.00
1.50
2.00
2.50
3.00
3.50
4.00
2013 2014
No.
of h
ours
of T
V v
iew
ed p
er d
ay
TV (streamed & on-demand) viewed onother devices
Commercial LinearTV
Non-CommercialLinear TV1 hour
18 mins
3 hours 44 mins 30 secs
2 hours 25 mins
1 hour 16 mins
2 hours 33 mins
1 hour 19 mins
3 hours 52 mins
3 mins 3 mins 30 secs
Presenter
Presentation Notes
Watching TV on other devices is still only a small part of total viewing, but it is on the increase. On average people watch an extra 3 minutes and 30 seconds of TV a day on other devices such as smartphones, tablets and laptops - bringing total viewing to 3hours and 45mins a day.
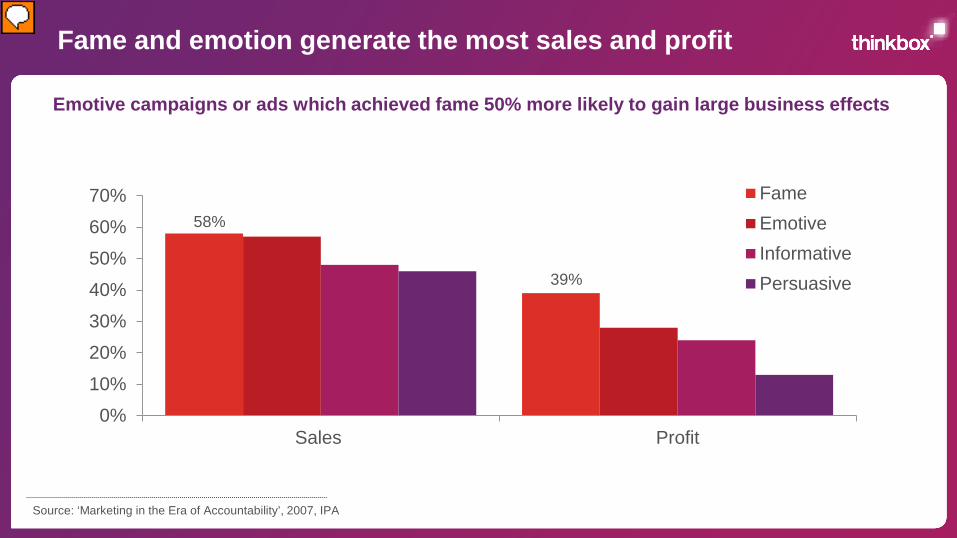
Fame and emotion generate the most sales and profit
58%
39%
0%
10%
20%
30%
40%
50%
60%
70%
Sales Profit
FameEmotiveInformativePersuasive
Source: ‘Marketing in the Era of Accountability’, 2007, IPA
Emotive campaigns or ads which achieved fame 50% more likely to gain large business effects
Presenter
Presentation Notes
Research from the IPA has shown that emotive and famous campaigns generate the largest business effects. Against the important, hard business success metrics of sales and profit, campaigns with emotion and fame outperformed more rational/information led approaches across the board. This was the case even in supposedly highly rational categories.
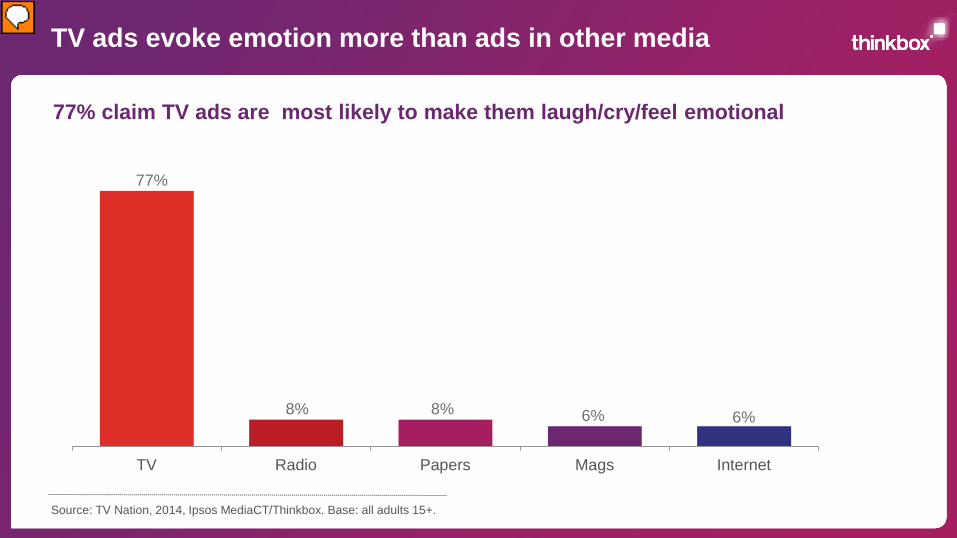
TV ads evoke emotion more than ads in other media
77%
8% 8% 6% 6%
TV Radio Papers Mags Internet
Source: TV Nation, 2014, Ipsos MediaCT/Thinkbox. Base: all adults 15+.
77% claim TV ads are most likely to make them laugh/cry/feel emotional
Presenter
Presentation Notes
Thinkbox’s ‘TV Nation’ work showed that TV ads were by far the most likely to make people feel emotional, and creating an emotional response is incredibly important in advertising.
TV advertising’s killer charts What every marketer should know
Hungry for more? Click here for the
www.thinkbox.tv
44 nickable charts With notes
Full Deck
Presenter
Presentation Notes
If you liked those ten killer slides, you might want to get hold of the Full Deck. It’s packed full of useful and inspiring stuff from advertising response and talkability to the power of emotion and fame. Just click on the link in the slide or visit www.thinkbox.tv/nickable-stuff to get your copy of the slides. Find out more from Thinkbox Whether you are in need of information or inspiration, we’ll keep you up to date: Visit thinkbox.tv Register for our newsletter Download the Thinkbox app Or simply, talk to us
www.thinkbox.tv Helping you get the best out of television
Presenter
Presentation Notes
Find out more from Thinkbox Whether you are in need of information or inspiration, we’ll keep you up to date: Visit www.thinkbox.tv Register for our newsletter Download the Thinkbox app Or simply talk to us!


![Installation and Operating Instructions€¦ · AC-ZentralsteuergerätE-Nr.:21/0304(01) Multifunktions-display Drehwahlschalter Taster Plus [+] Taster Minus [-] LED Taster Vorwärts](https://img.pdfslide.net/doc/110x75/5f0758477e708231d41c85b6/installation-and-operating-ac-zentralsteuergerte-nr21030401-multifunktions-display.jpg)