Embed Size (px)
Citation preview
Company OverviewApril 2015
FORWARD-LOOKING STATEMENTS
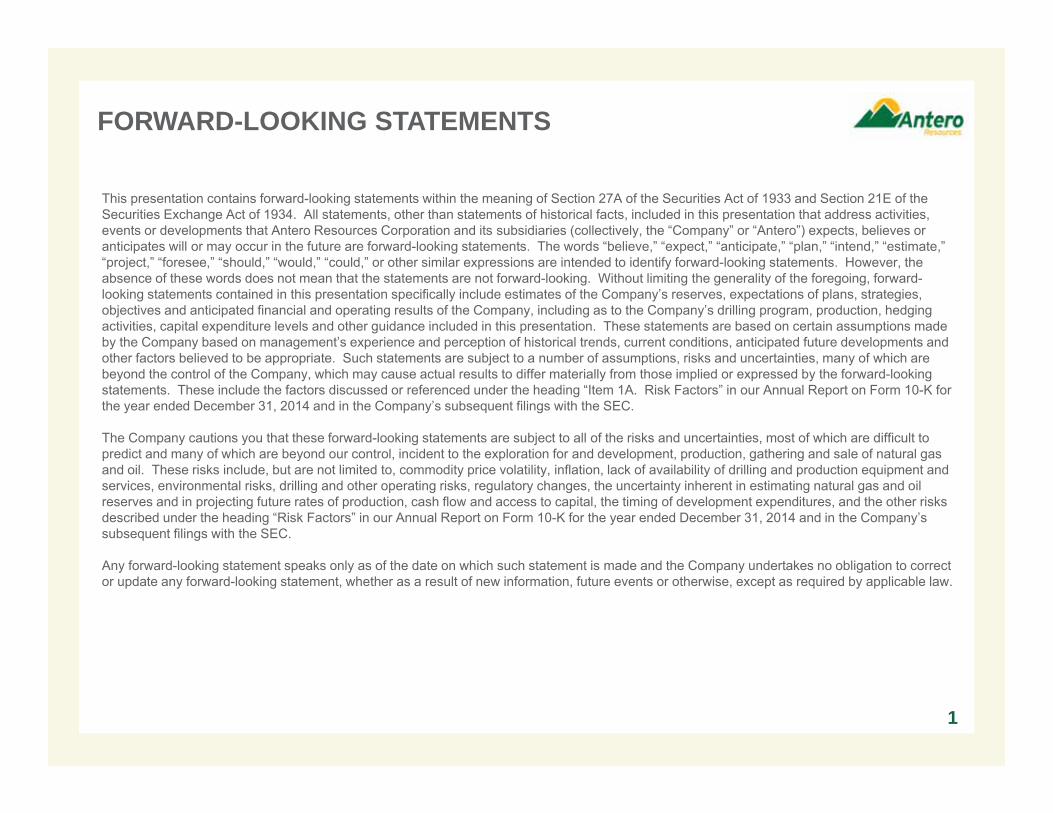
This presentation contains forward-looking statements within the meaning of Section 27A of the Securities Act of 1933 and Section 21E of the Securities Exchange Act of 1934. All statements, other than statements of historical facts, included in this presentation that address activities, events or developments that Antero Resources Corporation and its subsidiaries (collectively, the “Company” or “Antero”) expects, believes or anticipates will or may occur in the future are forward-looking statements. The words “believe,” “expect,” “anticipate,” “plan,” “intend,” “estimate,” “project,” “foresee,” “should,” “would,” “could,” or other similar expressions are intended to identify forward-looking statements. However, the absence of these words does not mean that the statements are not forward-looking. Without limiting the generality of the foregoing, forward-looking statements contained in this presentation specifically include estimates of the Company’s reserves, expectations of plans, strategies, objectives and anticipated financial and operating results of the Company, including as to the Company’s drilling program, production, hedging activities, capital expenditure levels and other guidance included in this presentation. These statements are based on certain assumptions made by the Company based on management’s experience and perception of historical trends, current conditions, anticipated future developments and other factors believed to be appropriate. Such statements are subject to a number of assumptions, risks and uncertainties, many of which are beyond the control of the Company, which may cause actual results to differ materially from those implied or expressed by the forward-looking statements. These include the factors discussed or referenced under the heading “Item 1A. Risk Factors” in our Annual Report on Form 10-K for the year ended December 31, 2014 and in the Company’s subsequent filings with the SEC.
The Company cautions you that these forward-looking statements are subject to all of the risks and uncertainties, most of which are difficult to predict and many of which are beyond our control, incident to the exploration for and development, production, gathering and sale of natural gas and oil. These risks include, but are not limited to, commodity price volatility, inflation, lack of availability of drilling and production equipment and services, environmental risks, drilling and other operating risks, regulatory changes, the uncertainty inherent in estimating natural gas and oil reserves and in projecting future rates of production, cash flow and access to capital, the timing of development expenditures, and the other risks described under the heading “Risk Factors” in our Annual Report on Form 10-K for the year ended December 31, 2014 and in the Company’s subsequent filings with the SEC.
Any forward-looking statement speaks only as of the date on which such statement is made and the Company undertakes no obligation to correct or update any forward-looking statement, whether as a result of new information, future events or otherwise, except as required by applicable law.
1
0
2,000
4,000
6,000
8,000
10,000
12,000
14,000
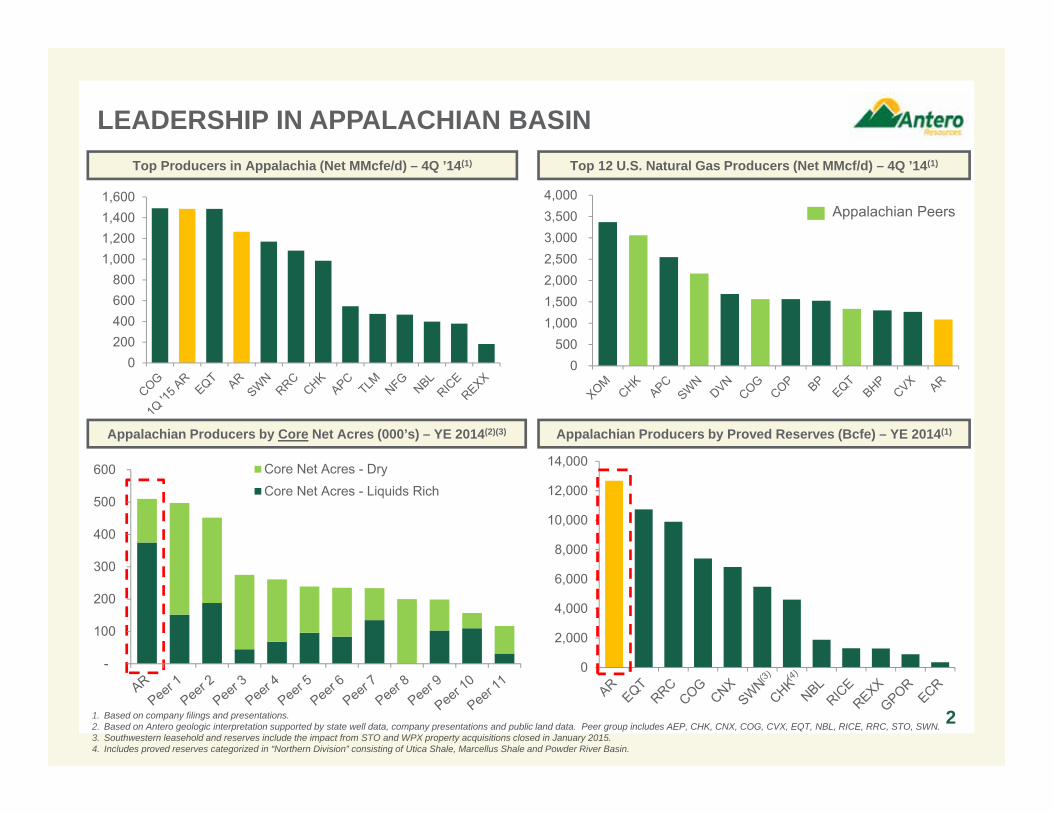
LEADERSHIP IN APPALACHIAN BASIN
2
Top Producers in Appalachia (Net MMcfe/d) – 4Q ’14(1) Top 12 U.S. Natural Gas Producers (Net MMcf/d) – 4Q ’14(1)
Appalachian Producers by Proved Reserves (Bcfe) – YE 2014(1)Appalachian Producers by Core Net Acres (000’s) – YE 2014(2)(3)
0200400600800
1,0001,2001,4001,600
1. Based on company filings and presentations.2. Based on Antero geologic interpretation supported by state well data, company presentations and public land data. Peer group includes AEP, CHK, CNX, COG, CVX, EQT, NBL, RICE, RRC, STO, SWN.3. Southwestern leasehold and reserves include the impact from STO and WPX property acquisitions closed in January 2015. 4. Includes proved reserves categorized in “Northern Division” consisting of Utica Shale, Marcellus Shale and Powder River Basin.
0500
1,0001,5002,0002,5003,0003,5004,000
Appalachian Peers
-
100
200
300
400
500
600 Core Net Acres - DryCore Net Acres - Liquids Rich
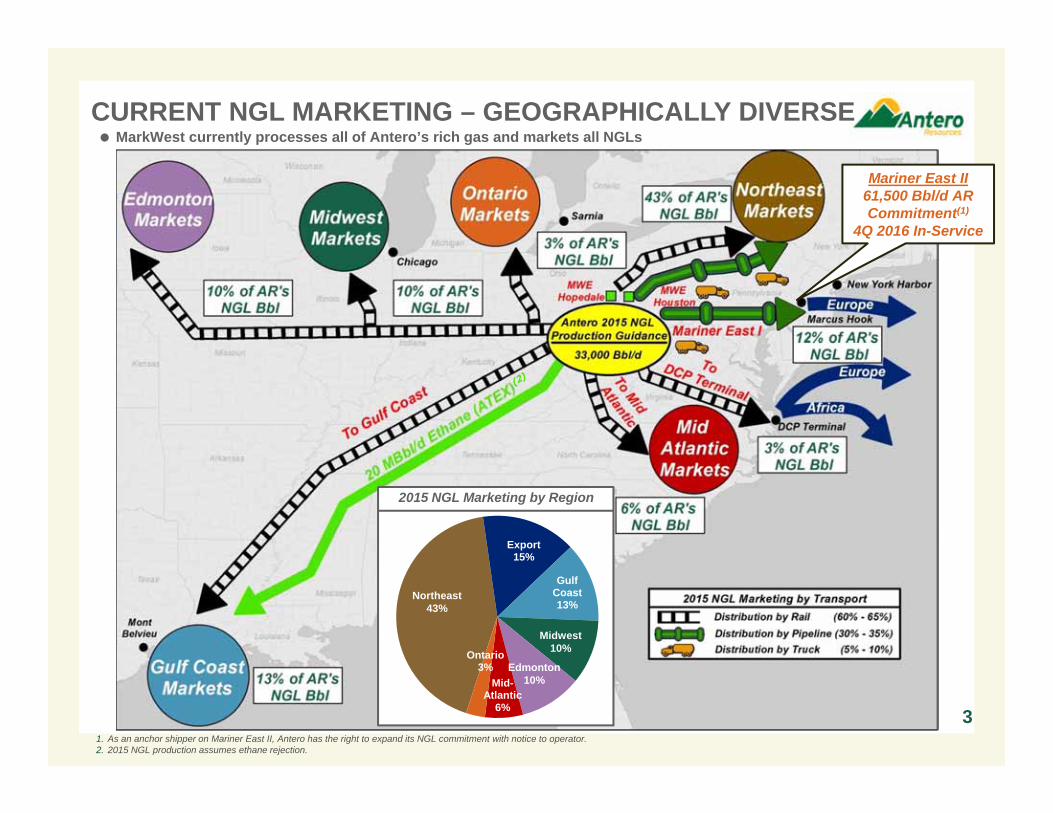
CURRENT NGL MARKETING – GEOGRAPHICALLY DIVERSE
1. As an anchor shipper on Mariner East II, Antero has the right to expand its NGL commitment with notice to operator. 2. 2015 NGL production assumes ethane rejection.
3
Mariner East II61,500 Bbl/d AR Commitment(1)
4Q 2016 In-Service
MarkWest currently processes all of Antero’s rich gas and markets all NGLs
Export15%
Gulf Coast13%
Mid-Atlantic
6%
Ontario3%
Northeast43%
Midwest10%
Edmonton10%
2015 NGL Marketing by Region
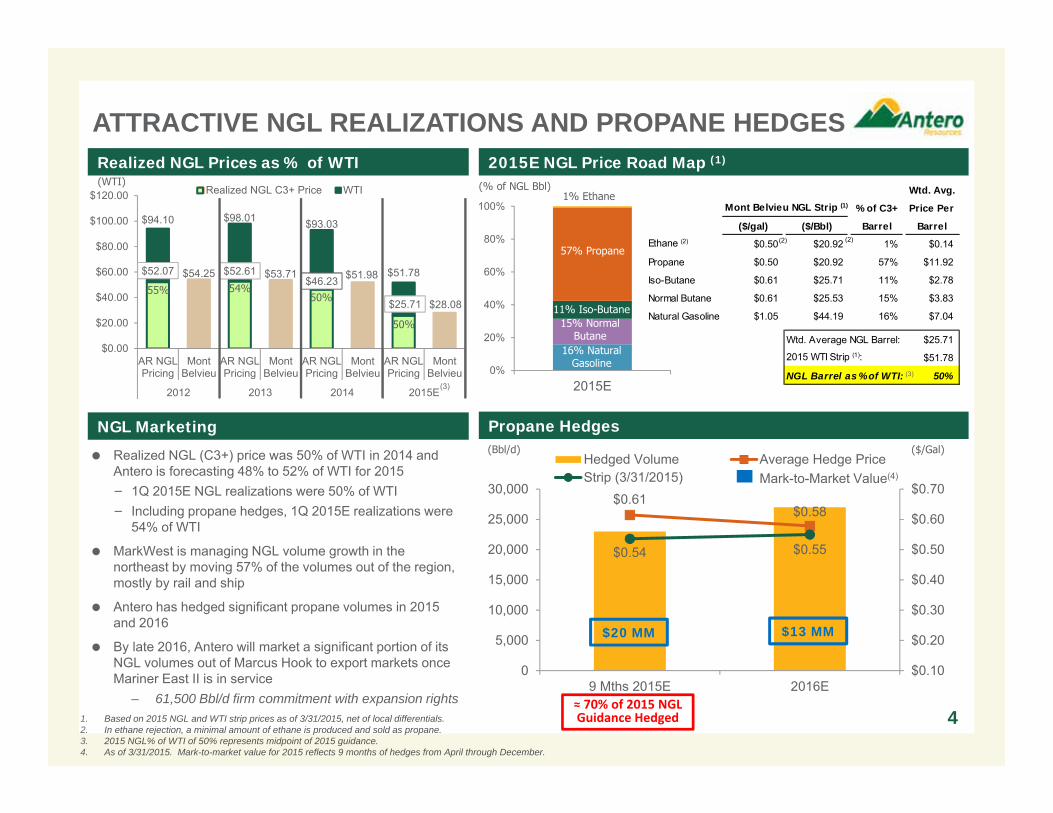
Wtd. Avg.Mont Belvieu NGL Strip (1) % of C3+ Price Per
($/gal) ($/Bbl) Barrel BarrelEthane (2) $0.50 $20.92 1% $0.14
Propane $0.50 $20.92 57% $11.92
Iso-Butane $0.61 $25.71 11% $2.78
Normal Butane $0.61 $25.53 15% $3.83
Natural Gasoline $1.05 $44.19 16% $7.04
Wtd. Average NGL Barrel: $25.71
2015 WTI Strip (1): $51.78
NGL Barrel as % of WTI: 50%
$0.61 $0.58
$0.54 $0.55
$0.10
$0.20
$0.30
$0.40
$0.50
$0.60
$0.70
0
5,000
10,000
15,000
20,000
25,000
30,000
9 Mths 2015E 2016E
Hedged Volume Average Hedge PriceStrip (3/31/2015)
$52.07 $54.25 $52.61 $53.71$46.23 $51.98
$25.71 $28.08
$94.10 $98.01 $93.03
$51.78
$0.00
$20.00
$40.00
$60.00
$80.00
$100.00
$120.00
AR NGLPricing
MontBelvieu
AR NGLPricing
MontBelvieu
AR NGLPricing
MontBelvieu
AR NGLPricing
MontBelvieu
2012 2013 2014 2015E
Realized NGL C3+ Price WTI
ATTRACTIVE NGL REALIZATIONS AND PROPANE HEDGES
41. Based on 2015 NGL and WTI strip prices as of 3/31/2015, net of local differentials. 2. In ethane rejection, a minimal amount of ethane is produced and sold as propane.3. 2015 NGL% of WTI of 50% represents midpoint of 2015 guidance. 4. As of 3/31/2015. Mark-to-market value for 2015 reflects 9 months of hedges from April through December.
Realized NGL Prices as % of WTI 2015E NGL Price Road Map (1)
0%
20%
40%
60%
80%
100%
2015E
(% of NGL Bbl)
57% Propane
11% Iso-Butane15% Normal
Butane16% Natural
Gasoline
1% Ethane
55% 54%50%
50%
(WTI)
≈ 70% of 2015 NGL Guidance Hedged
NGL Marketing Propane Hedges
Mark-to-Market Value(4)
(Bbl/d)
(2)
($/Gal) Realized NGL (C3+) price was 50% of WTI in 2014 and Antero is forecasting 48% to 52% of WTI for 2015− 1Q 2015E NGL realizations were 50% of WTI− Including propane hedges, 1Q 2015E realizations were
54% of WTI
MarkWest is managing NGL volume growth in the northeast by moving 57% of the volumes out of the region, mostly by rail and ship
Antero has hedged significant propane volumes in 2015 and 2016
By late 2016, Antero will market a significant portion of its NGL volumes out of Marcus Hook to export markets once Mariner East II is in service
– 61,500 Bbl/d firm commitment with expansion rights
$13 MM$20 MM
(3)(3)
(2)
0200400600800
10001200140016001800
MB
bl/d
Butane Exports Propane Exports Total Export Capacity
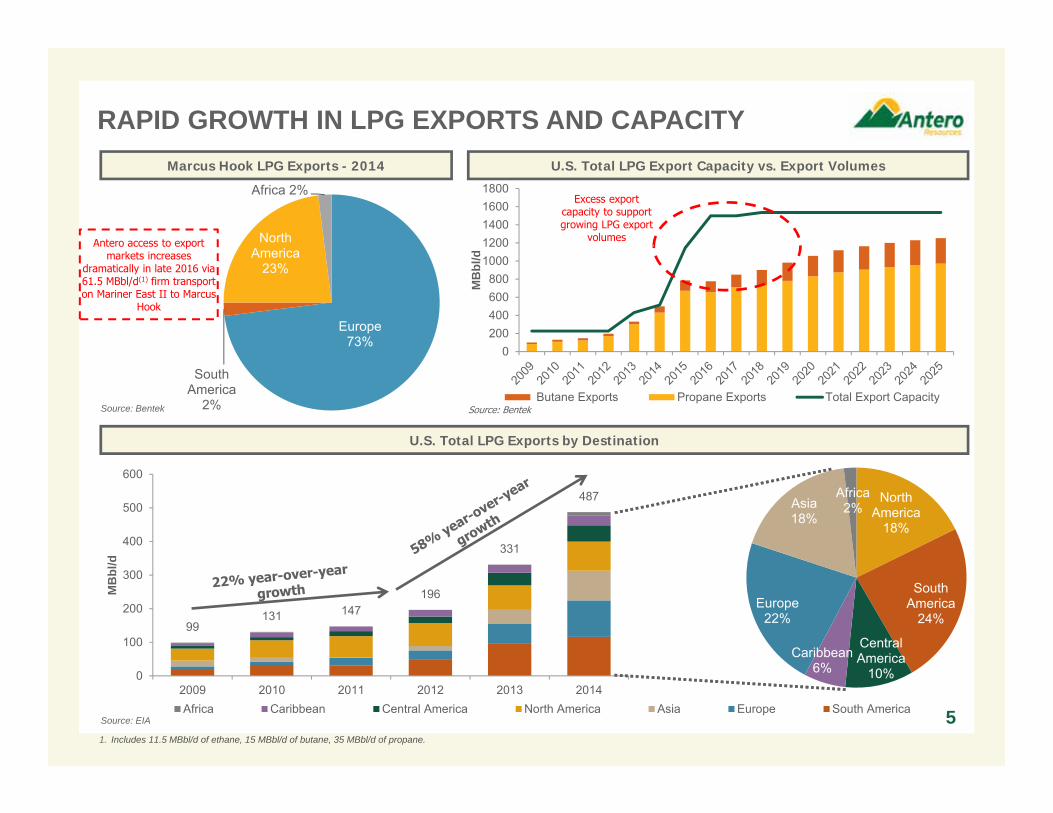
99131 147
196
331
487
0
100
200
300
400
500
600
2009 2010 2011 2012 2013 2014
MB
bl/d
Africa Caribbean Central America North America Asia Europe South AmericaSource: EIA
RAPID GROWTH IN LPG EXPORTS AND CAPACITY
5
U.S. Total LPG Export Capacity vs. Export Volumes
U.S. Total LPG Exports by Destination
North America
18%
South America
24%
Central America
10%Caribbean
6%
Europe22%
Asia18%
Africa2%
1. Includes 11.5 MBbl/d of ethane, 15 MBbl/d of butane, 35 MBbl/d of propane.
Excess export capacity to support growing LPG export
volumes
Marcus Hook LPG Exports - 2014
Europe 73%
South America
2%
North America
23%
Africa 2%
Source: Bentek
Antero access to export markets increases
dramatically in late 2016 via 61.5 MBbl/d(1) firm transport on Mariner East II to Marcus
Hook
Source: Bentek
6
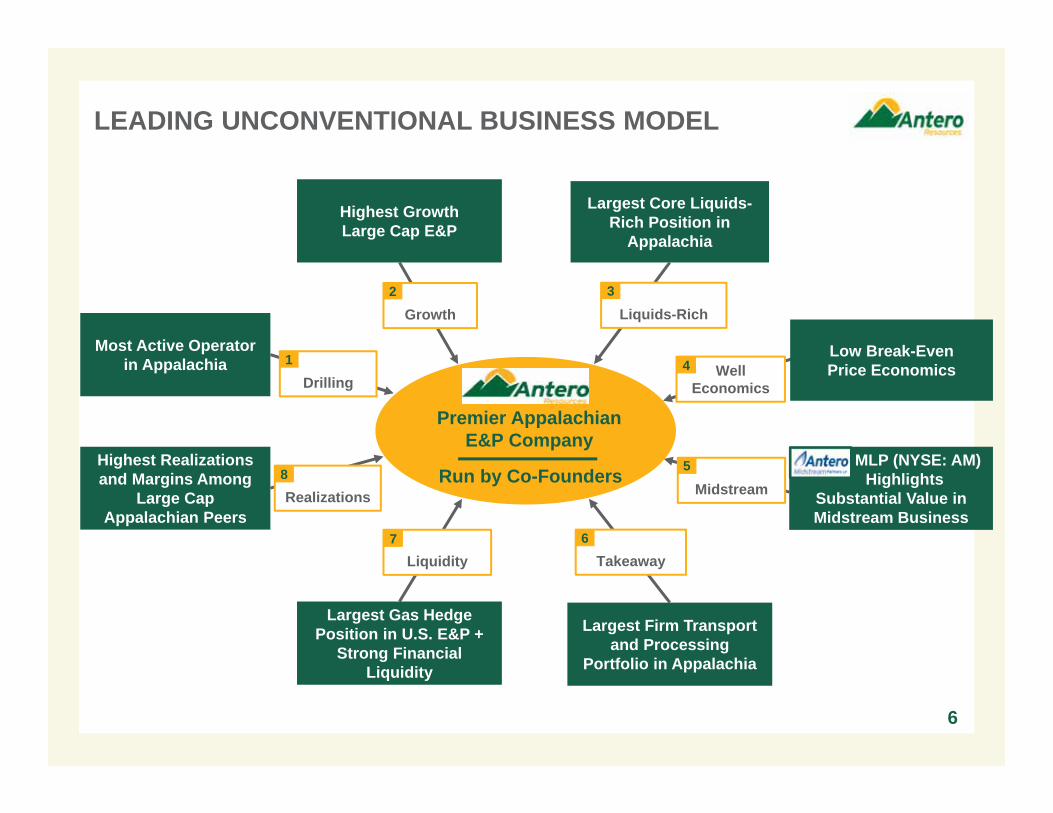
Most Active Operatorin Appalachia
Largest Firm Transport and Processing
Portfolio in Appalachia
Largest Gas Hedge Position in U.S. E&P +
Strong Financial Liquidity
Highest Growth Large Cap E&P
Largest Core Liquids-Rich Position in
Appalachia
Highest Realizations and Margins Among
Large Cap Appalachian Peers
Growth Liquids-Rich
Liquidity
Midstream
Drilling
LEADING UNCONVENTIONAL BUSINESS MODEL
MLP (NYSE: AM)Highlights
Substantial Value in Midstream Business
Realizations
Takeaway
WellEconomics
1
2 3
4
5
67
8
Premier AppalachianE&P Company
Run by Co-Founders
Low Break-EvenPrice Economics
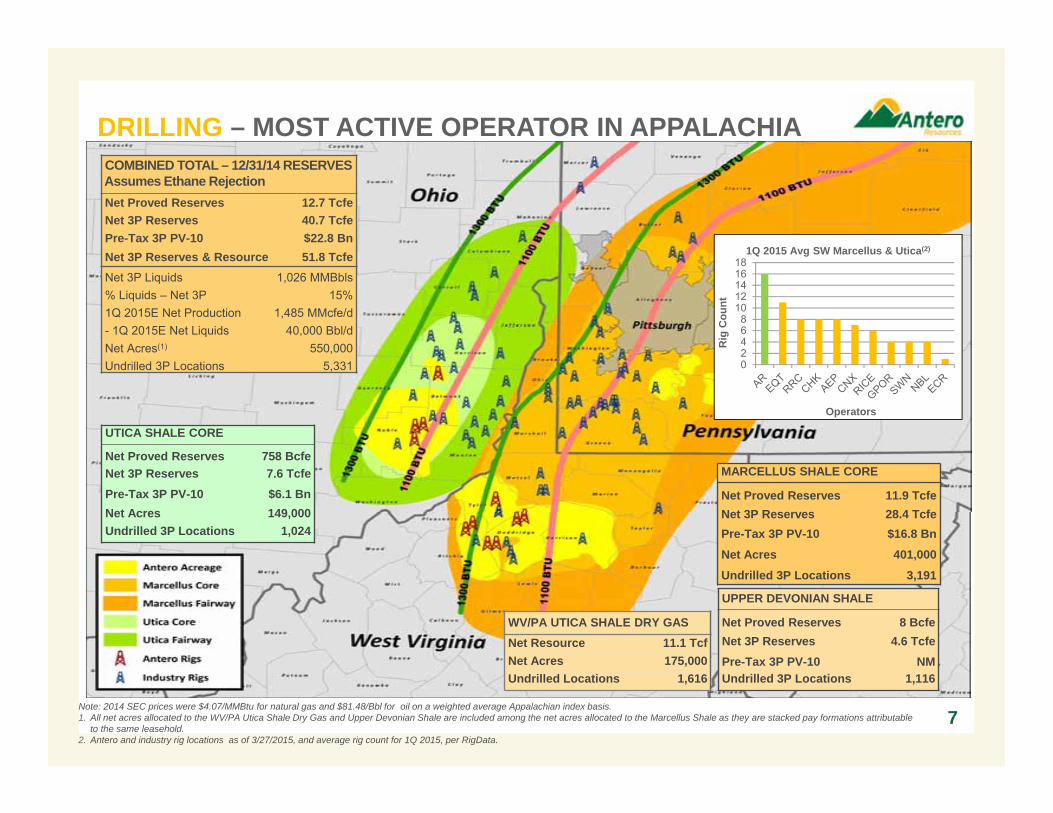
Note: 2014 SEC prices were $4.07/MMBtu for natural gas and $81.48/Bbl for oil on a weighted average Appalachian index basis.1. All net acres allocated to the WV/PA Utica Shale Dry Gas and Upper Devonian Shale are included among the net acres allocated to the Marcellus Shale as they are stacked pay formations attributable
to the same leasehold. 2. Antero and industry rig locations as of 3/27/2015, and average rig count for 1Q 2015, per RigData.
DRILLING – MOST ACTIVE OPERATOR IN APPALACHIA
7
COMBINED TOTAL – 12/31/14 RESERVESAssumes Ethane RejectionNet Proved Reserves 12.7 TcfeNet 3P Reserves 40.7 TcfePre-Tax 3P PV-10 $22.8 BnNet 3P Reserves & Resource 51.8 TcfeNet 3P Liquids 1,026 MMBbls% Liquids – Net 3P 15%1Q 2015E Net Production 1,485 MMcfe/d- 1Q 2015E Net Liquids 40,000 Bbl/dNet Acres(1) 550,000Undrilled 3P Locations 5,331
UTICA SHALE CORE
Net Proved Reserves 758 BcfeNet 3P Reserves 7.6 TcfePre-Tax 3P PV-10 $6.1 BnNet Acres 149,000Undrilled 3P Locations 1,024
MARCELLUS SHALE CORE
Net Proved Reserves 11.9 TcfeNet 3P Reserves 28.4 TcfePre-Tax 3P PV-10 $16.8 BnNet Acres 401,000Undrilled 3P Locations 3,191
UPPER DEVONIAN SHALE
Net Proved Reserves 8 BcfeNet 3P Reserves 4.6 TcfePre-Tax 3P PV-10 NMUndrilled 3P Locations 1,116
WV/PA UTICA SHALE DRY GASNet Resource 11.1 TcfNet Acres 175,000Undrilled Locations 1,616
02468
1012141618
Rig
Cou
nt
Operators
1Q 2015 Avg SW Marcellus & Utica(2)
40.0%
25.6%23.6%
20.0% 19.1%17.7%
15.0%
9.3%6.9%
3.0% 2.3%
(1.8%) (1.8%) (2.3%) (2.3%)
(8.6%) (8.7%)
(13.6%)
-25%
-15%
-5%
5%
15%
25%
35%
45%
40%+
8Appalachian Peers
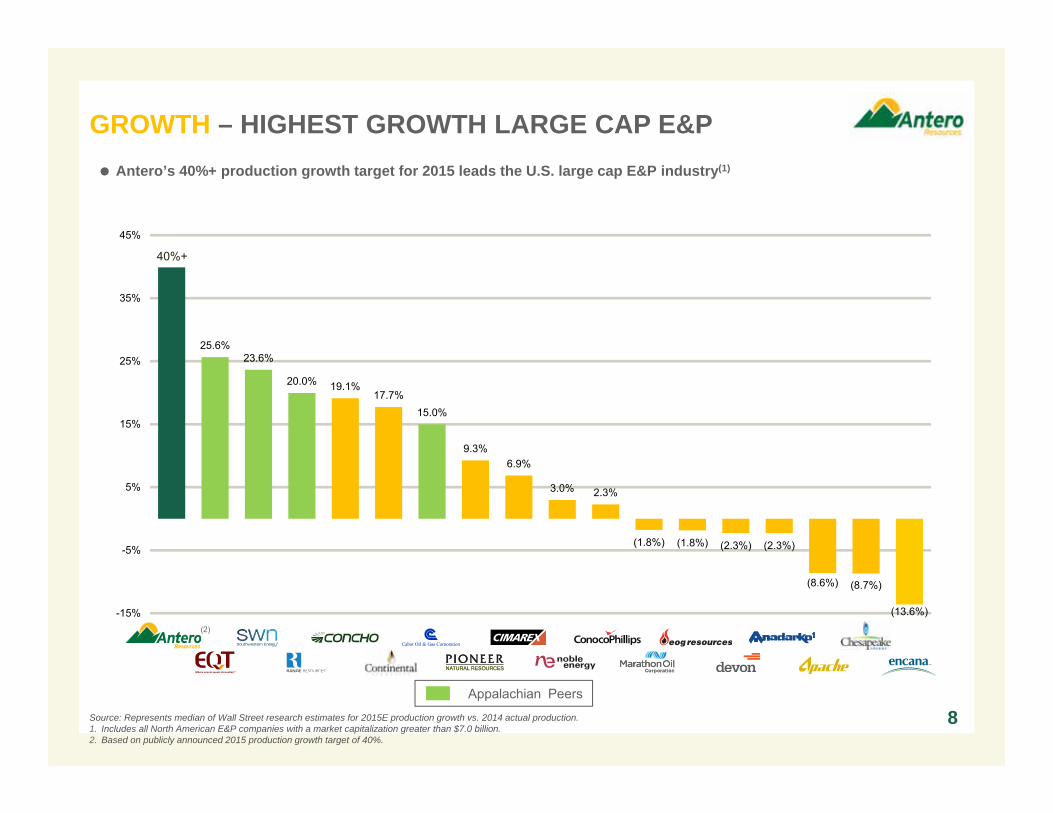
Source: Represents median of Wall Street research estimates for 2015E production growth vs. 2014 actual production. 1. Includes all North American E&P companies with a market capitalization greater than $7.0 billion. 2. Based on publicly announced 2015 production growth target of 40%.
Antero’s 40%+ production growth target for 2015 leads the U.S. large cap E&P industry(1)
GROWTH – HIGHEST GROWTH LARGE CAP E&P
(2)

0
10,000
20,000
30,000
40,000
2010 2011 2012 2013 2014 2015E
NGLs (C3+) Oil
5 246
6,436
23,051
37,000+
61%+ GrowthGuidance
258% Growth
0
600
1,200
1,800
2010 2011 2012 2013 2014 2015E
Marcellus Utica Guidance
1,400
30124
239
522
1,007
9
AVERAGE NET DAILY PRODUCTION (MMcfe/d)
0
50
100
150
200
2010 2011 2012 2013 2014 2015E
Marcellus Utica Deferred Completions
1938
60
114
177 180
130
GROWTH – STRONG TRACK RECORD
OPERATED GROSS WELLS COMPLETED
40%+ GrowthGuidance
92% Growth
0
3,000
6,000
9,000
12,000
15,000
2010 2011 2012 2013 2014
Marcellus Utica
677
2,8444,283
7,632
(1) (1) (1)
12,683
NET PROVED RESERVES (Bcfe)
1. Assumes ethane rejection.
AVERAGE NET DAILY LIQUIDS PRODUCTION (Bbl/d)
+
10
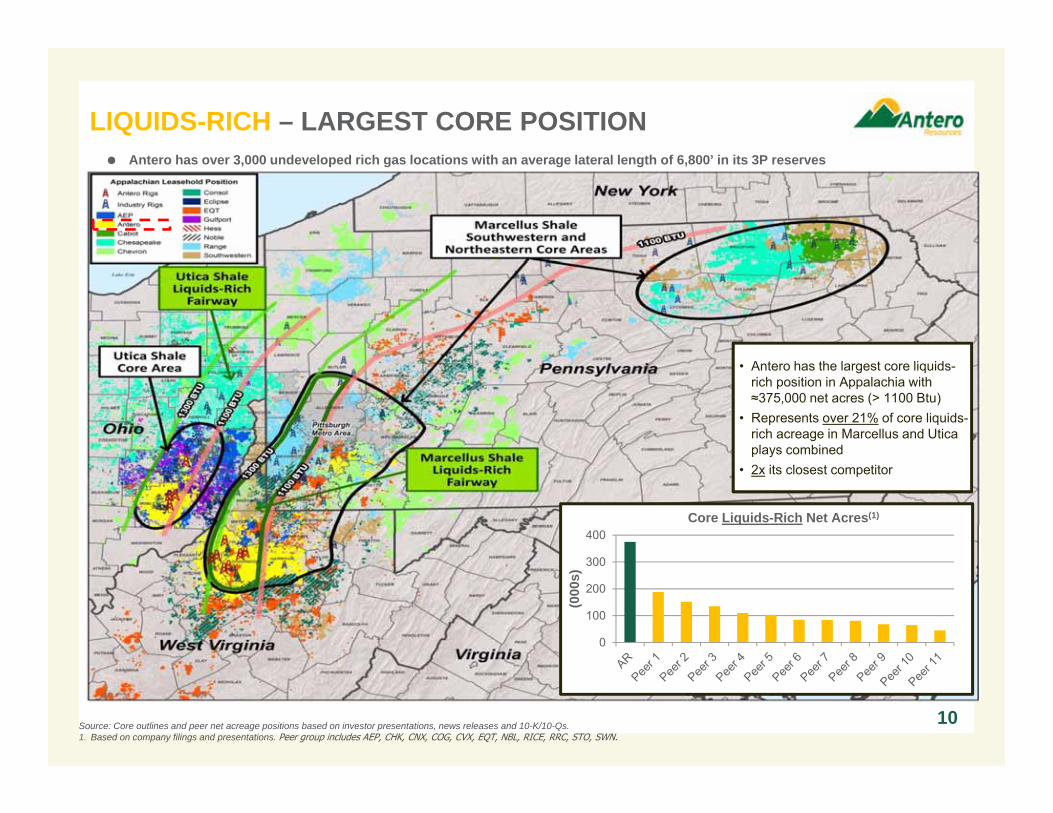
LIQUIDS-RICH – LARGEST CORE POSITION
Source: Core outlines and peer net acreage positions based on investor presentations, news releases and 10-K/10-Qs.1. Based on company filings and presentations. Peer group includes AEP, CHK, CNX, COG, CVX, EQT, NBL, RICE, RRC, STO, SWN.
• Antero has the largest core liquids-rich position in Appalachia with ≈375,000 net acres (> 1100 Btu)
• Represents over 21% of core liquids-rich acreage in Marcellus and Utica plays combined
• 2x its closest competitor
Antero has over 3,000 undeveloped rich gas locations with an average lateral length of 6,800’ in its 3P reserves
0
100
200
300
400
(000
s)
Core Liquids-Rich Net Acres(1)
$39 $42 $44$51 $53 $54
$60 $64 $65 $68 $69 $72$83
$86
$0
$20
$40
$60
$80
$100
WTI
Pric
e ($
/Bbl
)
Antero 2015Drilling Plan
$1.94 $2.20 $2.20 $2.37
$2.96 $3.13 $3.31 $3.48 $3.50 $3.63 $3.77 $3.85 $3.88 $3.98 $4.33 $4.38
$5.56 $5.62 $5.69 $5.71 $5.74
$0.00
$1.00
$2.00
$3.00
$4.00
$5.00
$6.00
$7.00
NYM
EX P
rice
($/M
MB
tu)
Antero 2015Drilling Plan
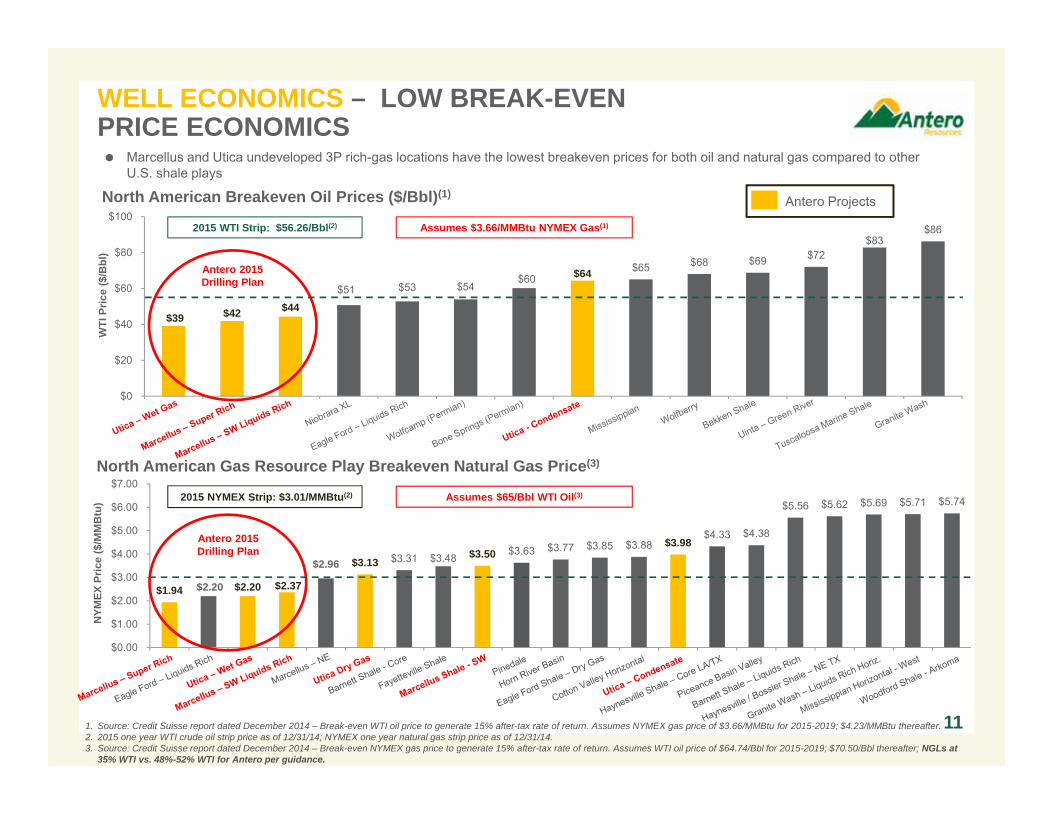
Assumes $65/Bbl WTI Oil(3)
WELL ECONOMICS – LOW BREAK-EVENPRICE ECONOMICS
North American Gas Resource Play Breakeven Natural Gas Price(3)
11
North American Breakeven Oil Prices ($/Bbl)(1)
2015 NYMEX Strip: $3.01/MMBtu(2)
2015 WTI Strip: $56.26/Bbl(2)
Marcellus and Utica undeveloped 3P rich-gas locations have the lowest breakeven prices for both oil and natural gas compared to other U.S. shale plays
1. Source: Credit Suisse report dated December 2014 – Break-even WTI oil price to generate 15% after-tax rate of return. Assumes NYMEX gas price of $3.66/MMBtu for 2015-2019; $4.23/MMBtu thereafter.2. 2015 one year WTI crude oil strip price as of 12/31/14; NYMEX one year natural gas strip price as of 12/31/14.3. Source: Credit Suisse report dated December 2014 – Break-even NYMEX gas price to generate 15% after-tax rate of return. Assumes WTI oil price of $64.74/Bbl for 2015-2019; $70.50/Bbl thereafter; NGLs at
35% WTI vs. 48%-52% WTI for Antero per guidance.
Antero Projects
Assumes $3.66/MMBtu NYMEX Gas(1)
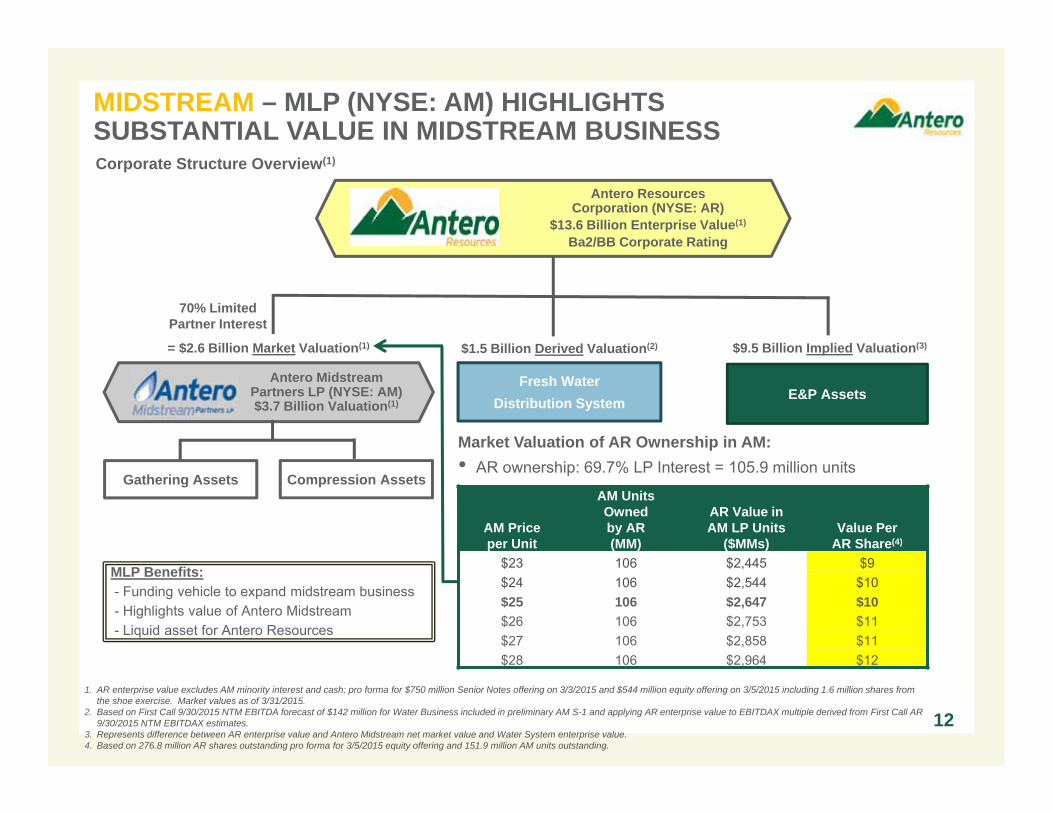
MIDSTREAM – MLP (NYSE: AM) HIGHLIGHTSSUBSTANTIAL VALUE IN MIDSTREAM BUSINESS
1. AR enterprise value excludes AM minority interest and cash; pro forma for $750 million Senior Notes offering on 3/3/2015 and $544 million equity offering on 3/5/2015 including 1.6 million shares from the shoe exercise. Market values as of 3/31/2015.
2. Based on First Call 9/30/2015 NTM EBITDA forecast of $142 million for Water Business included in preliminary AM S-1 and applying AR enterprise value to EBITDAX multiple derived from First Call AR 9/30/2015 NTM EBITDAX estimates.
3. Represents difference between AR enterprise value and Antero Midstream net market value and Water System enterprise value.4. Based on 276.8 million AR shares outstanding pro forma for 3/5/2015 equity offering and 151.9 million AM units outstanding.
12
Antero ResourcesCorporation (NYSE: AR)
$13.6 Billion Enterprise Value(1)
Ba2/BB Corporate Rating
Antero MidstreamPartners LP (NYSE: AM)$3.7 Billion Valuation(1)
70% Limited Partner Interest
E&P Assets
Gathering Assets
Corporate Structure Overview(1)
Market Valuation of AR Ownership in AM:• AR ownership: 69.7% LP Interest = 105.9 million units
AM Priceper Unit
AM UnitsOwnedby AR(MM)
AR Value in AM LP Units
($MMs)Value Per
AR Share(4)
$23 106 $2,445 $9$24 106 $2,544 $10$25 106 $2,647 $10$26 106 $2,753 $11$27 106 $2,858 $11$28 106 $2,964 $12
Fresh Water Distribution System
Compression Assets
= $2.6 Billion Market Valuation(1) $9.5 Billion Implied Valuation(3)$1.5 Billion Derived Valuation(2)
MLP Benefits:- Funding vehicle to expand midstream business- Highlights value of Antero Midstream- Liquid asset for Antero Resources
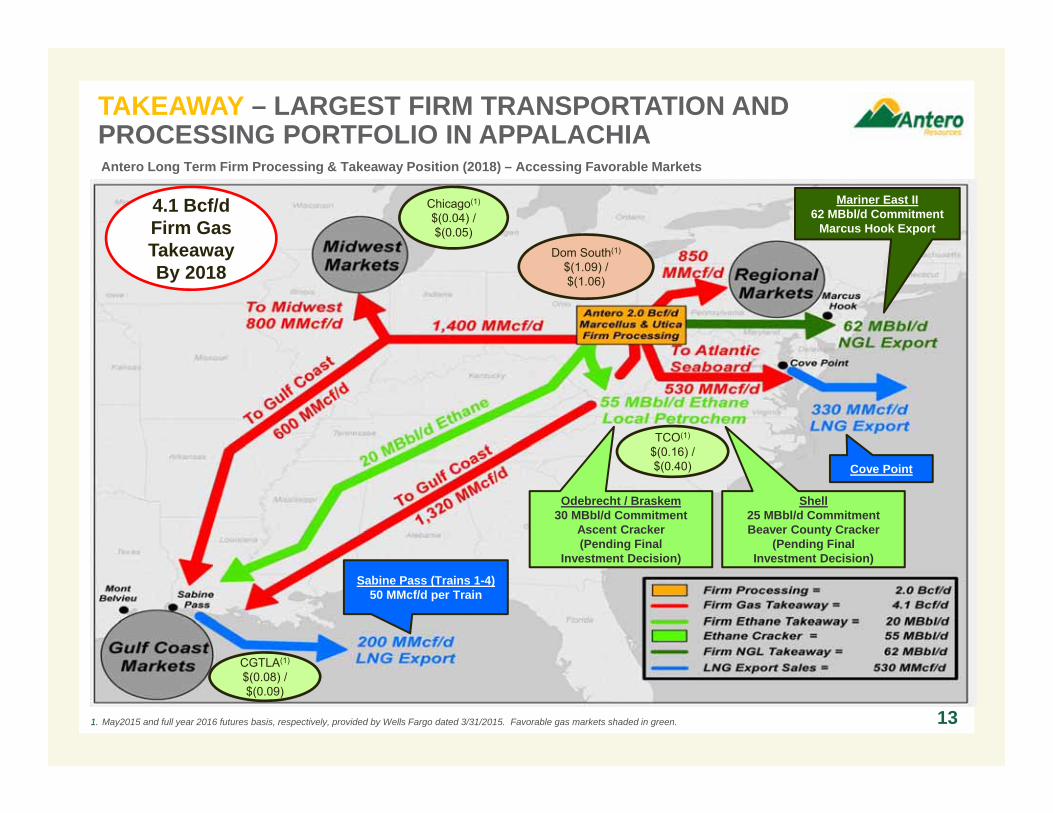
TAKEAWAY – LARGEST FIRM TRANSPORTATION AND PROCESSING PORTFOLIO IN APPALACHIA
Odebrecht / Braskem30 MBbl/d Commitment
Ascent Cracker(Pending Final
Investment Decision)
Antero Long Term Firm Processing & Takeaway Position (2018) – Accessing Favorable Markets
Mariner East II62 MBbl/d Commitment
Marcus Hook Export
Shell25 MBbl/d CommitmentBeaver County Cracker
(Pending FinalInvestment Decision)
Sabine Pass (Trains 1-4)50 MMcf/d per Train
1. May2015 and full year 2016 futures basis, respectively, provided by Wells Fargo dated 3/31/2015. Favorable gas markets shaded in green.
Chicago(1)
$(0.04) / $(0.05)
CGTLA(1)
$(0.08) / $(0.09)
Dom South(1)
$(1.09) / $(1.06)
TCO(1)
$(0.16) / $(0.40)
13
4.1 Bcf/dFirm Gas TakeawayBy 2018
Cove Point
$4
-$8
$5
$25 $34 $29 $28 $26
$12 $16 $17$28 $29
$19$25 $43
$80 $83$59 $49 $48
$14
$47 $54
-$1
$1
$58$78
$185
($2.00)
($1.00)
$0.00
$1.00
$2.00
$3.00
$4.00
($40)
$0
$40
$80
$120
$160
$200
Quarterly Realized Gains/(Losses)1Q '08 - 1Q '15
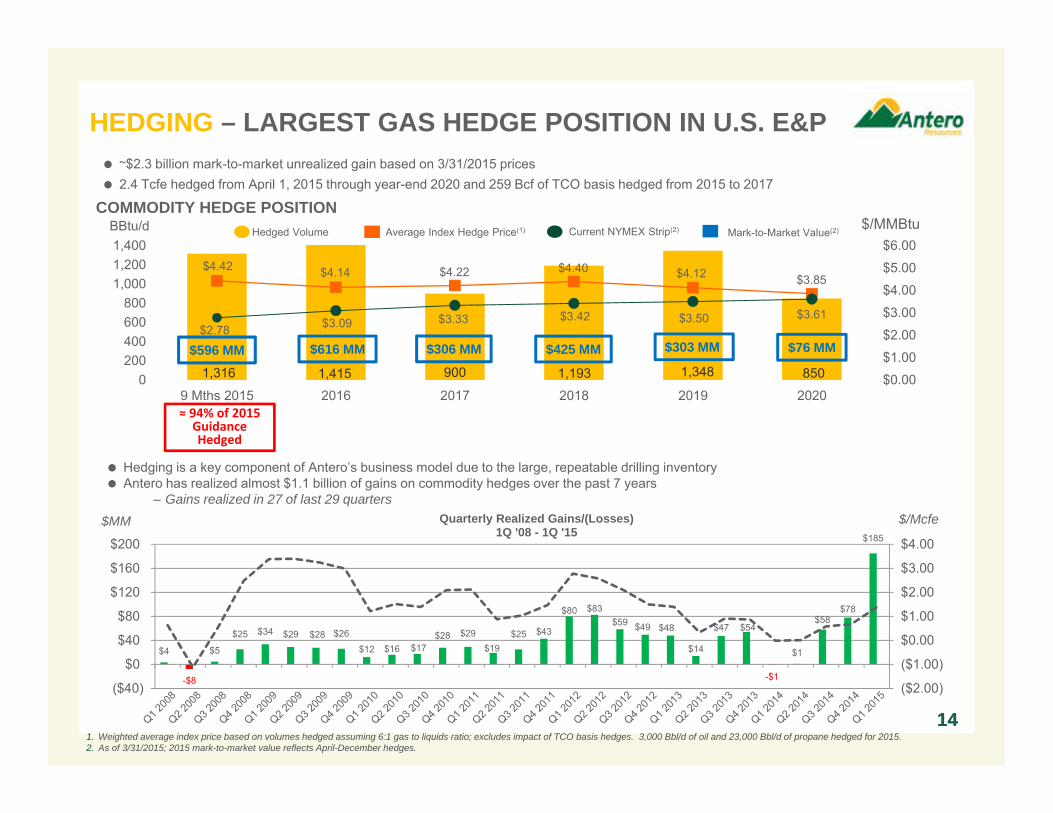
1,316 1,415 900 1,193 1,348 850
$4.42 $4.14 $4.22 $4.40 $4.12 $3.85
$2.78 $3.09 $3.33 $3.42 $3.50 $3.61
$0.00
$1.00
$2.00
$3.00
$4.00
$5.00
$6.00
0200400600800
1,0001,2001,400
9 Mths 2015 2016 2017 2018 2019 2020
BBtu/d $/MMBtu
14
Average Index Hedge Price(1)Hedged Volume Current NYMEX Strip(2)
COMMODITY HEDGE POSITION
~$2.3 billion mark-to-market unrealized gain based on 3/31/2015 prices 2.4 Tcfe hedged from April 1, 2015 through year-end 2020 and 259 Bcf of TCO basis hedged from 2015 to 2017
$596 MM $616 MM $306 MM $425 MM $303 MM $76 MM
Mark-to-Market Value(2)
HEDGING – LARGEST GAS HEDGE POSITION IN U.S. E&P
≈ 94% of 2015 Guidance Hedged
141. Weighted average index price based on volumes hedged assuming 6:1 gas to liquids ratio; excludes impact of TCO basis hedges. 3,000 Bbl/d of oil and 23,000 Bbl/d of propane hedged for 2015. 2. As of 3/31/2015; 2015 mark-to-market value reflects April-December hedges.
Hedging is a key component of Antero’s business model due to the large, repeatable drilling inventory Antero has realized almost $1.1 billion of gains on commodity hedges over the past 7 years
– Gains realized in 27 of last 29 quarters$MM $/Mcfe
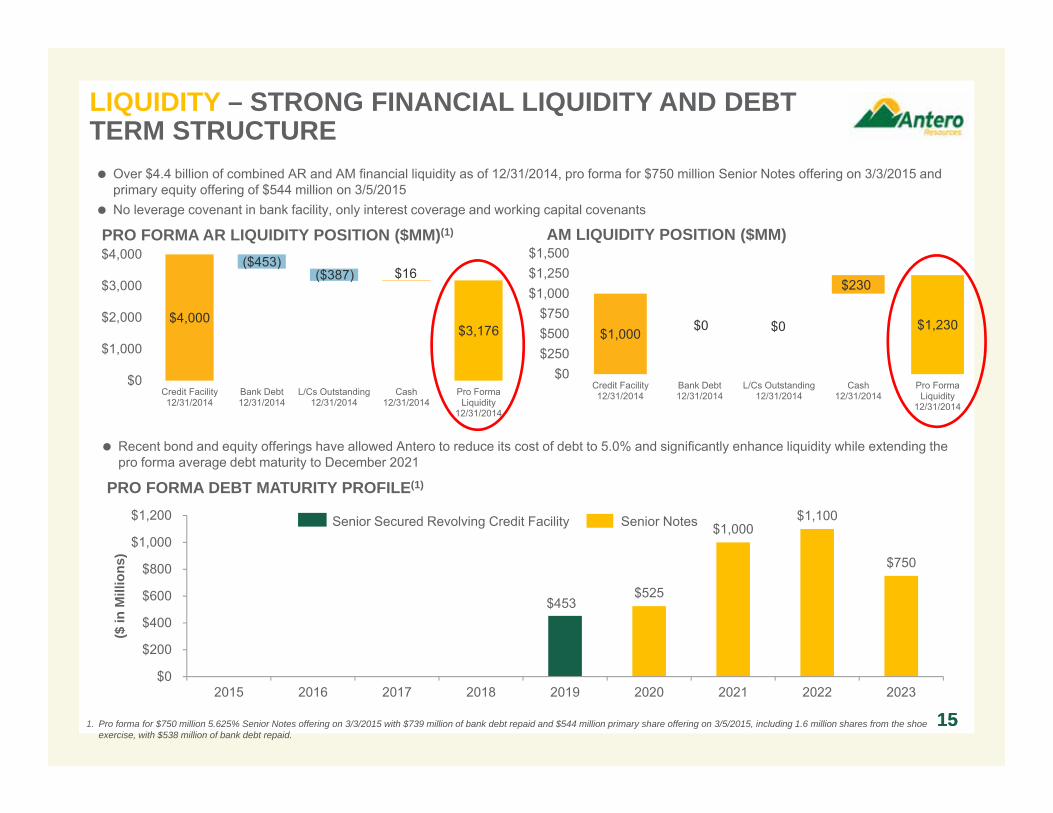
$525
$1,000 $1,100
$750
$0
$200
$400
$600
$800
$1,000
$1,200
2015 2016 2017 2018 2019 2020 2021 2022 2023
($ in
Mill
ions
)
$453
15
LIQUIDITY – STRONG FINANCIAL LIQUIDITY AND DEBT TERM STRUCTURE
151. Pro forma for $750 million 5.625% Senior Notes offering on 3/3/2015 with $739 million of bank debt repaid and $544 million primary share offering on 3/5/2015, including 1.6 million shares from the shoe exercise, with $538 million of bank debt repaid.
$4,000$3,176
($453)($387) $16
$0
$1,000
$2,000
$3,000
$4,000
Credit Facility12/31/2014
Bank Debt12/31/2014
L/Cs Outstanding12/31/2014
Cash12/31/2014
Pro FormaLiquidity
12/31/2014
PRO FORMA AR LIQUIDITY POSITION ($MM)(1) AM LIQUIDITY POSITION ($MM)
$1,000$1,230$0 $0
$230
$0$250$500$750
$1,000$1,250$1,500
Credit Facility12/31/2014
Bank Debt12/31/2014
L/Cs Outstanding12/31/2014
Cash12/31/2014
Pro FormaLiquidity
12/31/2014
Over $4.4 billion of combined AR and AM financial liquidity as of 12/31/2014, pro forma for $750 million Senior Notes offering on 3/3/2015 and primary equity offering of $544 million on 3/5/2015
No leverage covenant in bank facility, only interest coverage and working capital covenants
Senior Secured Revolving Credit Facility Senior Notes
PRO FORMA DEBT MATURITY PROFILE(1)
Recent bond and equity offerings have allowed Antero to reduce its cost of debt to 5.0% and significantly enhance liquidity while extending the pro forma average debt maturity to December 2021
Average NYMEX
Price($/Mcf)
AverageDifferential(1)
($/Mcf)
AverageBTU Upgrade
($/Mcf)
Discount to NYMEX($/Mcf)
GasHedgeEffect
($/Mcf)
AverageRealized
Gas Price($/Mcf)
AverageRealized Gas
Premium to NYMEX ($/Mcf)
Liquids Upgrade($/Mcfe)
Realized Equivalent
Price($/Mcfe)
Gas Equivalent
Premium to NYMEX($/Mcfe)
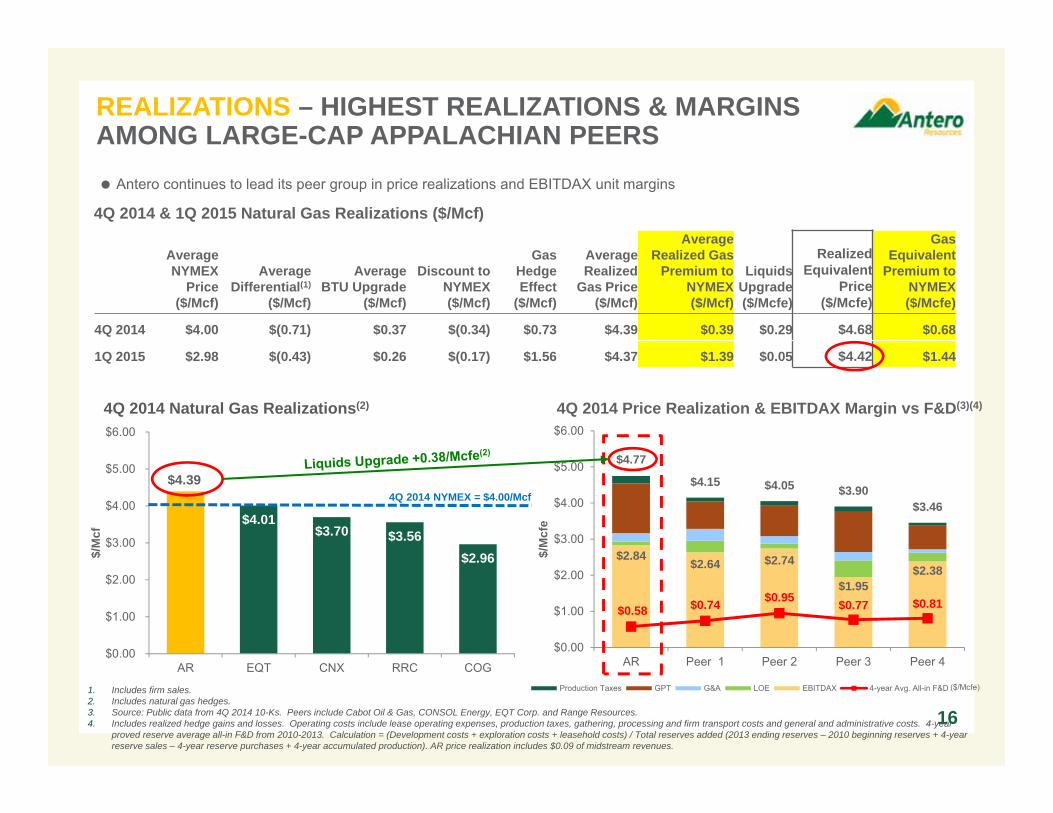
4Q 2014 $4.00 $(0.71) $0.37 $(0.34) $0.73 $4.39 $0.39 $0.29 $4.68 $0.68
1Q 2015 $2.98 $(0.43) $0.26 $(0.17) $1.56 $4.37 $1.39 $0.05 $4.42 $1.44
1. Includes firm sales. 2. Includes natural gas hedges.3. Source: Public data from 4Q 2014 10-Ks. Peers include Cabot Oil & Gas, CONSOL Energy, EQT Corp. and Range Resources. 4. Includes realized hedge gains and losses. Operating costs include lease operating expenses, production taxes, gathering, processing and firm transport costs and general and administrative costs. 4-year
proved reserve average all-in F&D from 2010-2013. Calculation = (Development costs + exploration costs + leasehold costs) / Total reserves added (2013 ending reserves – 2010 beginning reserves + 4-year reserve sales – 4-year reserve purchases + 4-year accumulated production). AR price realization includes $0.09 of midstream revenues.
$2.84$2.64 $2.74
$1.95$2.38
$0.58 $0.74 $0.95 $0.77 $0.81
$4.77
$4.15 $4.05 $3.90$3.46
$0.00
$1.00
$2.00
$3.00
$4.00
$5.00
$6.00
AR Peer 1 Peer 2 Peer 3 Peer 4
$/M
cfe
Production Taxes GPT G&A LOE EBITDAX 4-year Avg. All-in F&D
$4.39
$4.01 $3.70 $3.56
$2.96
$0.00
$1.00
$2.00
$3.00
$4.00
$5.00
$6.00
AR EQT CNX RRC COG
$/M
cf
16
REALIZATIONS – HIGHEST REALIZATIONS & MARGINSAMONG LARGE-CAP APPALACHIAN PEERS
4Q 2014 Natural Gas Realizations(2) 4Q 2014 Price Realization & EBITDAX Margin vs F&D(3)(4)
4Q 2014 NYMEX = $4.00/Mcf
($/Mcfe)
4Q 2014 & 1Q 2015 Natural Gas Realizations ($/Mcf)
Antero continues to lead its peer group in price realizations and EBITDAX unit margins
DOM S 22%
DOM S - 9% DOM S - 6%
TETCO M2 - 7%
TETCO M2 - 6%
TCO 24%
TCO 16%
TCO - 9%
NYMEX8%
NYMEX11%
NYMEX10%
Gulf Coast18%
Gulf Coast38%
Gulf Coast56%
Chicago21%
Chicago20%
Chicago19%
0%
10%
20%
30%
40%
50%
60%
70%
80%
90%
100%
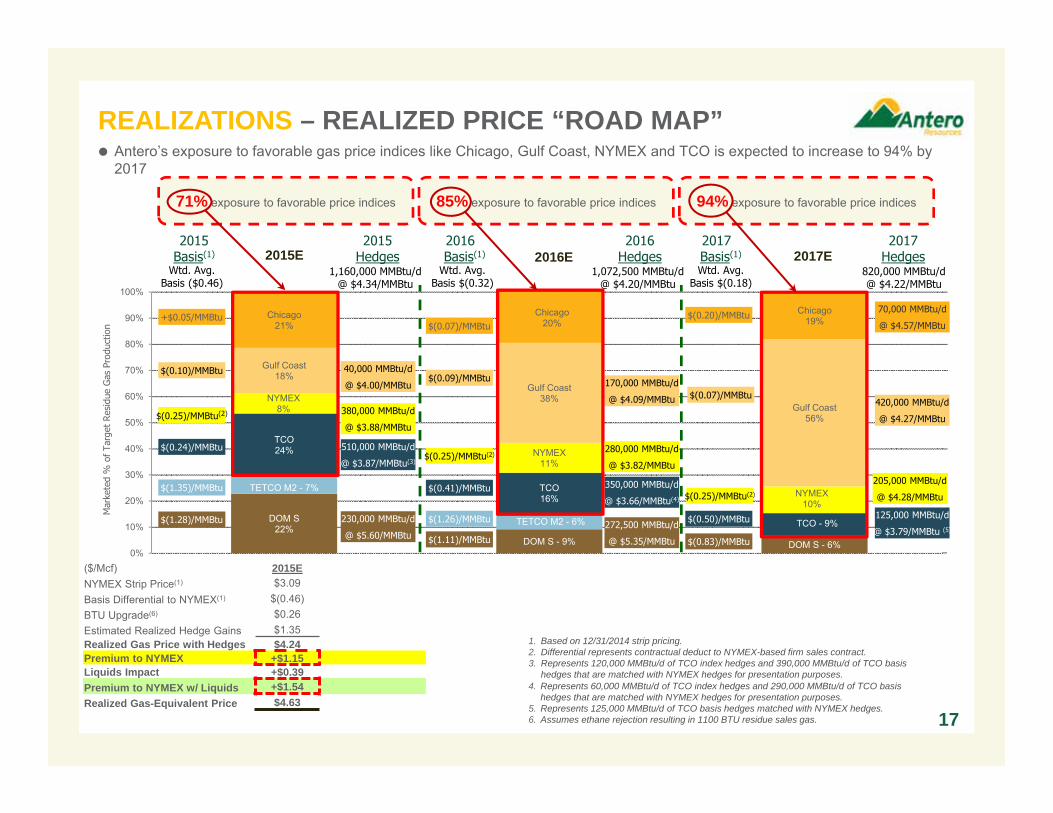
($/Mcf) 2015ENYMEX Strip Price(1) $3.09Basis Differential to NYMEX(1) $(0.46)BTU Upgrade(6) $0.26 Estimated Realized Hedge Gains $1.35 Realized Gas Price with Hedges $4.24 Premium to NYMEX +$1.15Liquids Impact +$0.39Premium to NYMEX w/ Liquids +$1.54Realized Gas-Equivalent Price $4.63
4. Represents 60,000 MMBtu/d of TCO index hedges and 290,000 MMBtu/d of TCO basis hedges that are matched with NYMEX hedges for presentation purposes.
5. Represents 125,000 MMBtu/d of TCO basis hedges matched with NYMEX hedges.6. Assumes ethane rejection resulting in 1100 BTU residue sales gas.
REALIZATIONS – REALIZED PRICE “ROAD MAP”
1. Based on 12/31/2014 strip pricing. 2. Differential represents contractual deduct to NYMEX-based firm sales contract.3. Represents 120,000 MMBtu/d of TCO index hedges and 390,000 MMBtu/d of TCO basis
hedges that are matched with NYMEX hedges for presentation purposes.
2015Basis(1)
2016 Basis(1)
2017 Basis(1)
2015Hedges
2016Hedges
2017Hedges
Mar
kete
d %
of T
arge
t Re
sidu
e G
as P
rodu
ctio
n
+$0.05/MMBtu
$(0.25)/MMBtu(2)
$(1.28)/MMBtu
$(0.24)/MMBtu
$(0.07)/MMBtu
$(0.25)/MMBtu(2)
$(1.11)/MMBtu
$(0.41)/MMBtu
$(0.20)/MMBtu
$(0.25)/MMBtu(2)
$(0.83)/MMBtu
$(0.50)/MMBtu
$(0.09)/MMBtu
$(0.07)/MMBtu
205,000 MMBtu/d
@ $4.28/MMBtu
125,000 MMBtu/d
@ $3.79/MMBtu (5)
40,000 MMBtu/d
@ $4.00/MMBtu
230,000 MMBtu/d
@ $5.60/MMBtu
510,000 MMBtu/d
@ $3.87/MMBtu(3)
170,000 MMBtu/d
@ $4.09/MMBtu
272,500 MMBtu/d
@ $5.35/MMBtu
350,000 MMBtu/d
@ $3.66/MMBtu(4)
85% exposure to favorable price indices71% exposure to favorable price indices 94% exposure to favorable price indices
Antero’s exposure to favorable gas price indices like Chicago, Gulf Coast, NYMEX and TCO is expected to increase to 94% by 2017
$(1.35)/MMBtu
$(1.26)/MMBtu
Wtd. Avg.Basis ($0.46)
Wtd. Avg.Basis $(0.32)
1,160,000 MMBtu/d@ $4.34/MMBtu
Wtd. Avg.Basis $(0.18)
1,072,500 MMBtu/d@ $4.20/MMBtu
420,000 MMBtu/d
@ $4.27/MMBtu
2015E 2016E 2017E
17
380,000 MMBtu/d
@ $3.88/MMBtu
280,000 MMBtu/d
@ $3.82/MMBtu
70,000 MMBtu/d
@ $4.57/MMBtu
820,000 MMBtu/d@ $4.22/MMBtu
$(0.10)/MMBtu
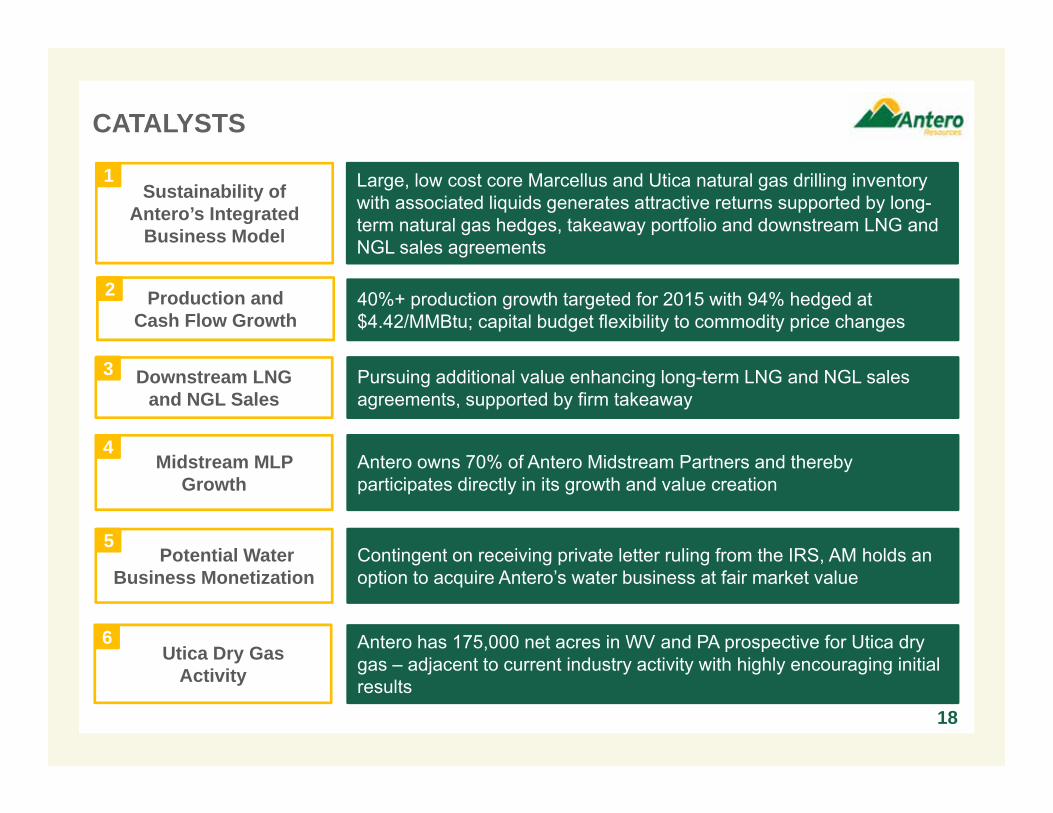
Downstream LNGand NGL Sales
Production andCash Flow Growth
18
Antero has 175,000 net acres in WV and PA prospective for Utica dry gas – adjacent to current industry activity with highly encouraging initial results
CATALYSTS
40%+ production growth targeted for 2015 with 94% hedged at $4.42/MMBtu; capital budget flexibility to commodity price changes
Large, low cost core Marcellus and Utica natural gas drilling inventory with associated liquids generates attractive returns supported by long-term natural gas hedges, takeaway portfolio and downstream LNG and NGL sales agreements
Pursuing additional value enhancing long-term LNG and NGL sales agreements, supported by firm takeaway
Antero owns 70% of Antero Midstream Partners and thereby participates directly in its growth and value creation
Midstream MLP Growth
Sustainability of Antero’s Integrated
Business Model
Potential Water Business Monetization
1
2
3
4
5
6
Contingent on receiving private letter ruling from the IRS, AM holds an option to acquire Antero’s water business at fair market value
Utica Dry GasActivity
SECTOR POSITIONING
19
0%
10%
20%
30%
40%
248
139 94
254289
14%
39%
55%
40% 39%
0
100
200
300
0%
20%
40%
60%
Condensate Highly-RichGas/
Condensate
Highly-RichGas
Rich Gas Dry Gas
Tota
l 3P
Loca
tions
RO
R
Locations ROR
MARCELLUS SSL WELL ECONOMICS(1)
664
1,010
62888945%
30%
15% 15%
0
300
600
900
1,200
0%
15%
30%
45%
60%
Highly-RichGas/
Condensate
Highly-RichGas
Rich Gas Dry Gas
Tota
l 3P
Loca
tions
RO
R
Locations ROR
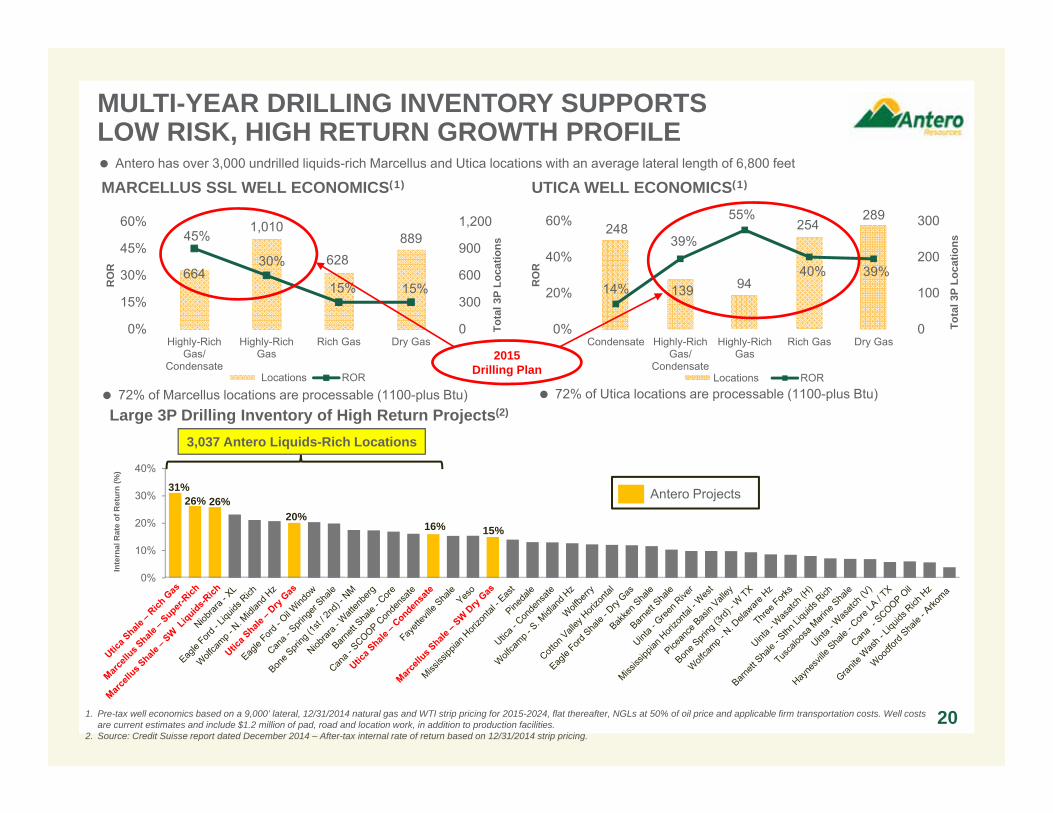
MULTI-YEAR DRILLING INVENTORY SUPPORTS LOW RISK, HIGH RETURN GROWTH PROFILE
Large 3P Drilling Inventory of High Return Projects(2)
1. Pre-tax well economics based on a 9,000’ lateral, 12/31/2014 natural gas and WTI strip pricing for 2015-2024, flat thereafter, NGLs at 50% of oil price and applicable firm transportation costs. Well costs are current estimates and include $1.2 million of pad, road and location work, in addition to production facilities.
2. Source: Credit Suisse report dated December 2014 – After-tax internal rate of return based on 12/31/2014 strip pricing.
26% 26%31%
15%
Inte
rnal
Rat
e of
Ret
urn
(%)
20%
20
UTICA WELL ECONOMICS(1)
72% of Marcellus locations are processable (1100-plus Btu) 72% of Utica locations are processable (1100-plus Btu)
3,037 Antero Liquids-Rich Locations
16%
2015Drilling Plan
Antero Projects
Antero has over 3,000 undrilled liquids-rich Marcellus and Utica locations with an average lateral length of 6,800 feet

LNG Exports48%
Mexico/Canada Exports
18%
Power Generation
17%
Transportation1%
Industrial16%
20 BCF/D OF INCREMENTAL GAS DEMAND BY 2020 Significant demand growth expected for U.S.
natural gas
More than 65% of the 20 Bcf/d in incremental gas demand forecast by 2020 is expected to be generated from exports:− LNG: 9.5 Bcf/d (~48%)− Mexico/Canada: 3.5 Bcf/d (~18%)
Of the 9.5 Bcf/d of expected incremental demand from LNG export projects, 5.8 Bcf/d (or 61%) of the projects have secured the necessary DOE and FERC permits
21
Incremental Demand Growth Through 2020 by Category
Projected Incremental Natural Gas Demand Through 2020
Source: Simmons & Company International, “2015 US Natural Gas Outlook and Updated Long Term Demand Forecast,” September 2014.
Sherwood 7 2
5
9
13
17
20
0
4
8
12
16
20
2015 2016 2017 2018 2019 2020Mexico/Canada Exports Power GenerationTransportation PetrochemLNG Exports
9.5 Bcf/d of the 20 Bcf/d of incremental demand is expected to come from
LNG exports
(Bcf/d)
LNG
Exports
Power Gen
Petrochem
LNG Exports by Project(in Bcf/d)
2015 2016 2017 2018 2019 2020 TotalSabine Pass 1 - 0.6 - - - - Sabine Pass 2 - 0.6 - - - - Sabine Pass 3 - - 0.6 - - - Sabine Pass 4 - - 0.6 - - - Sabine Pass 5 - - - - 0.6 - 3.0 Cove Point 1 - - 0.4 - - - Cove Point 2 - - - 0.4 - - 0.8 Cameron 1 - - - 0.6 - - Cameron 2 - - - 0.6 - - Cameron 3 - - - - 0.6 - 1.8 Freeport 1 - - - 0.5 - - Freeport 2 - - - - 0.5 - Freeport 3 - - - - 0.5 - Freeport 4 - - - - - 0.4 2.1 Corpus Christi 1 - - - - 0.6 - Corpus Christi 2 - - - - - 0.6 1.2 Lake Charles 1 - - - - - 0.6 0.6
LNG Incremental Exports - 1.2 1.6 2.2 2.9 1.7LNG Cumulative Exports - 1.2 2.8 5.0 7.9 9.5
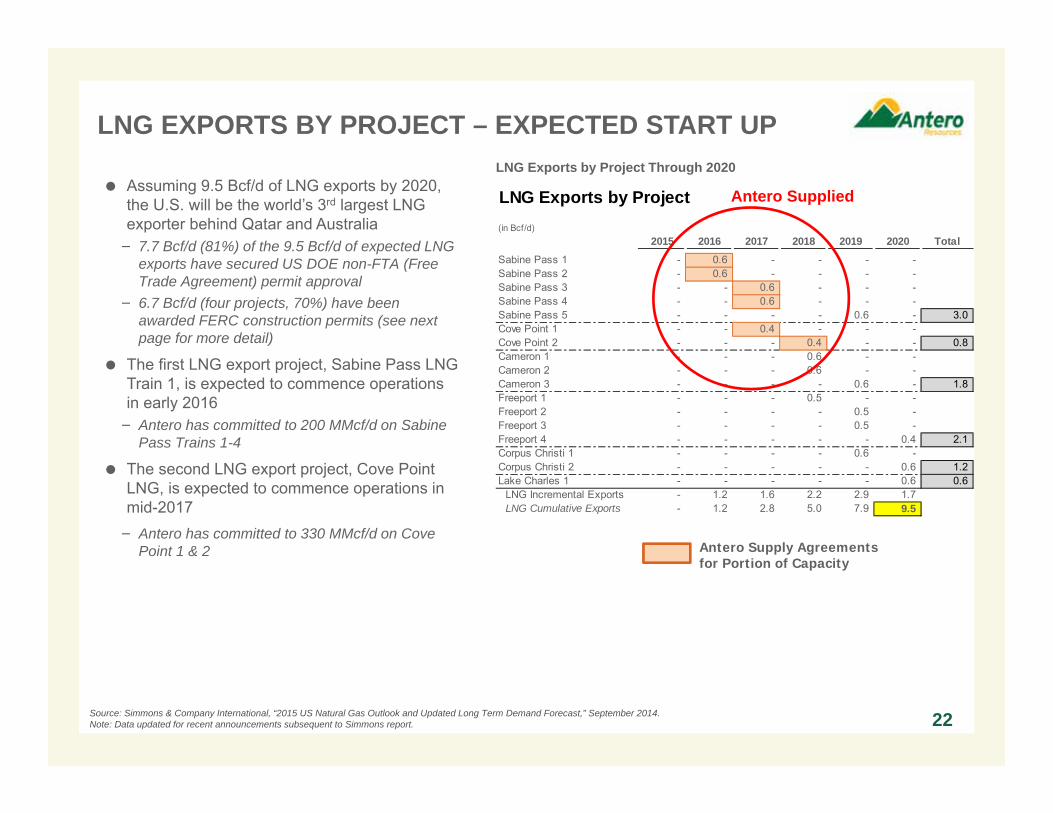
LNG EXPORTS BY PROJECT – EXPECTED START UP
Assuming 9.5 Bcf/d of LNG exports by 2020, the U.S. will be the world’s 3rd largest LNG exporter behind Qatar and Australia− 7.7 Bcf/d (81%) of the 9.5 Bcf/d of expected LNG
exports have secured US DOE non-FTA (Free Trade Agreement) permit approval
− 6.7 Bcf/d (four projects, 70%) have been awarded FERC construction permits (see next page for more detail)
The first LNG export project, Sabine Pass LNG Train 1, is expected to commence operations in early 2016− Antero has committed to 200 MMcf/d on Sabine
Pass Trains 1-4
The second LNG export project, Cove Point LNG, is expected to commence operations in mid-2017− Antero has committed to 330 MMcf/d on Cove
Point 1 & 2
22
LNG Exports by Project Through 2020
Antero Supply Agreements for Portion of Capacity
Source: Simmons & Company International, “2015 US Natural Gas Outlook and Updated Long Term Demand Forecast,” September 2014. Note: Data updated for recent announcements subsequent to Simmons report.
Antero Supplied
ASSET OVERVIEW
23
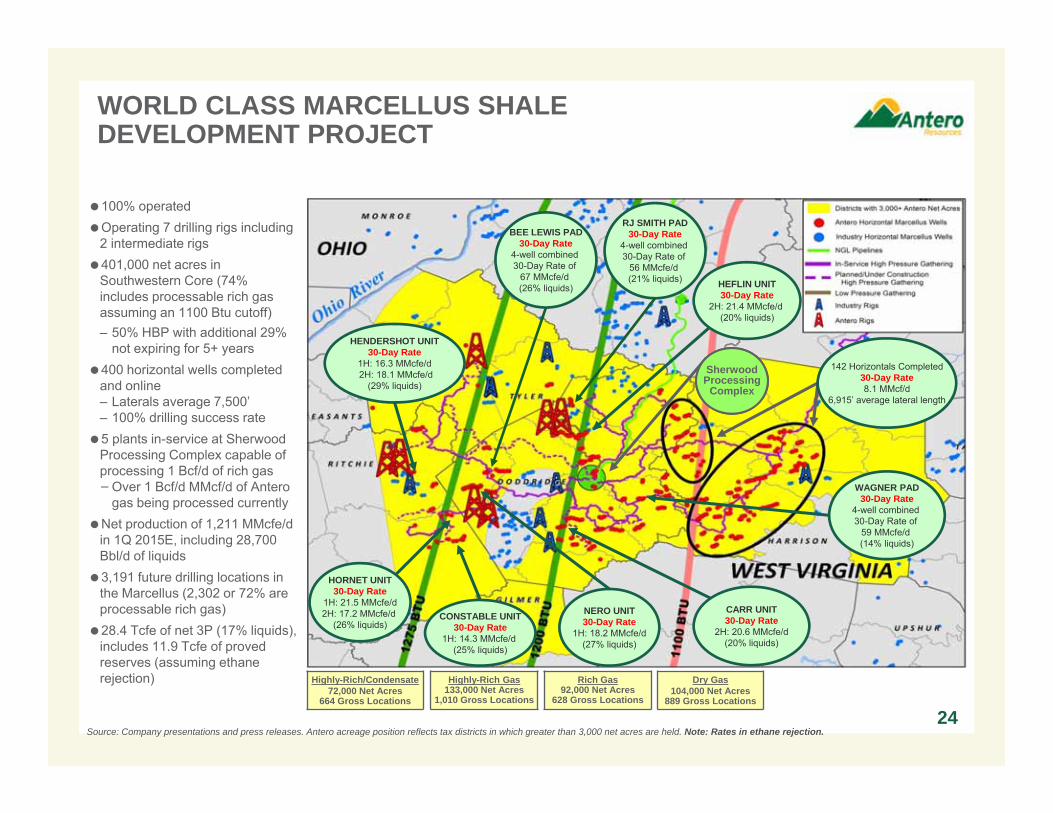
WORLD CLASS MARCELLUS SHALE DEVELOPMENT PROJECT
100% operatedOperating 7 drilling rigs including
2 intermediate rigs401,000 net acres in
Southwestern Core (74% includes processable rich gas assuming an 1100 Btu cutoff)– 50% HBP with additional 29%
not expiring for 5+ years400 horizontal wells completed
and online– Laterals average 7,500’– 100% drilling success rate5 plants in-service at Sherwood
Processing Complex capable of processing 1 Bcf/d of rich gas−Over 1 Bcf/d MMcf/d of Antero
gas being processed currentlyNet production of 1,211 MMcfe/d
in 1Q 2015E, including 28,700 Bbl/d of liquids 3,191 future drilling locations in
the Marcellus (2,302 or 72% are processable rich gas)28.4 Tcfe of net 3P (17% liquids),
includes 11.9 Tcfe of proved reserves (assuming ethane rejection) Highly-Rich Gas
133,000 Net Acres1,010 Gross Locations
Rich Gas92,000 Net Acres
628 Gross Locations
Dry Gas104,000 Net Acres
889 Gross Locations
Highly-Rich/Condensate72,000 Net Acres
664 Gross Locations
HEFLIN UNIT30-Day Rate
2H: 21.4 MMcfe/d (20% liquids)
CONSTABLE UNIT30-Day Rate
1H: 14.3 MMcfe/d (25% liquids)
142 Horizontals Completed30-Day Rate8.1 MMcf/d
6,915’ average lateral length
SherwoodProcessing
Complex
Source: Company presentations and press releases. Antero acreage position reflects tax districts in which greater than 3,000 net acres are held. Note: Rates in ethane rejection.
NERO UNIT30-Day Rate
1H: 18.2 MMcfe/d(27% liquids)
BEE LEWIS PAD30-Day Rate
4-well combined 30-Day Rate of
67 MMcfe/d (26% liquids)
RJ SMITH PAD30-Day Rate
4-well combined 30-Day Rate of
56 MMcfe/d (21% liquids)
24
HENDERSHOT UNIT30-Day Rate
1H: 16.3 MMcfe/d2H: 18.1 MMcfe/d
(29% liquids)
HORNET UNIT30-Day Rate
1H: 21.5 MMcfe/d2H: 17.2 MMcfe/d
(26% liquids)CARR UNIT30-Day Rate
2H: 20.6 MMcfe/d(20% liquids)
WAGNER PAD30-Day Rate
4-well combined 30-Day Rate of
59 MMcfe/d (14% liquids)

Antero’s Marcellus well performance has continued to improve over time with a tight statistical range of results across its entire acreage position
PROLIFIC PREDICTABLE RESULTS ACROSS ENTIREMARCELLUS POSITION
25
Marcellus PDP Locations (As of 12/31/14)
(1)
1. Source: IHS; 3rd party producing wells include Consol, EQT, Exxon/XTO, Noble, AEP, PDC, Magnum Hunter, Statoil, Chesapeake / SWN.
>1275 BTU2.2 Bcfe/1,000’ Lateral
7 SSL Wells
1200-1275 BTU2.0 Bcfe/1,000’ Lateral
72 SSL Wells
1100-1200 BTU1.8 Bcfe/1,000’ Lateral
85 SSL Wells
Average Antero Marcellus Well
2014 Actual 2015 Budget
30-Day Rate (MMcfe/d): 13.1 16.1
Gross EUR (Bcfe): 15.3 19.2
Gross Well Cost ($MM): $11.8 $11.2
Lateral Length (Feet): 8,052 9,000
Net F&D ($/Mcfe): $0.89 $0.69
Btu: 1195 1250
0
5
10
15
20
25
30
35
1.3 1.4 1.5 1.6 1.7 1.8 1.9 2.0 2.1 2.2 2.3 2.4 2.5 2.6 2.7 More
Wel
l Cou
nt
Bcfe/1,000' of Lateral
0
5
10
15
20
25
MM
cfe/
d
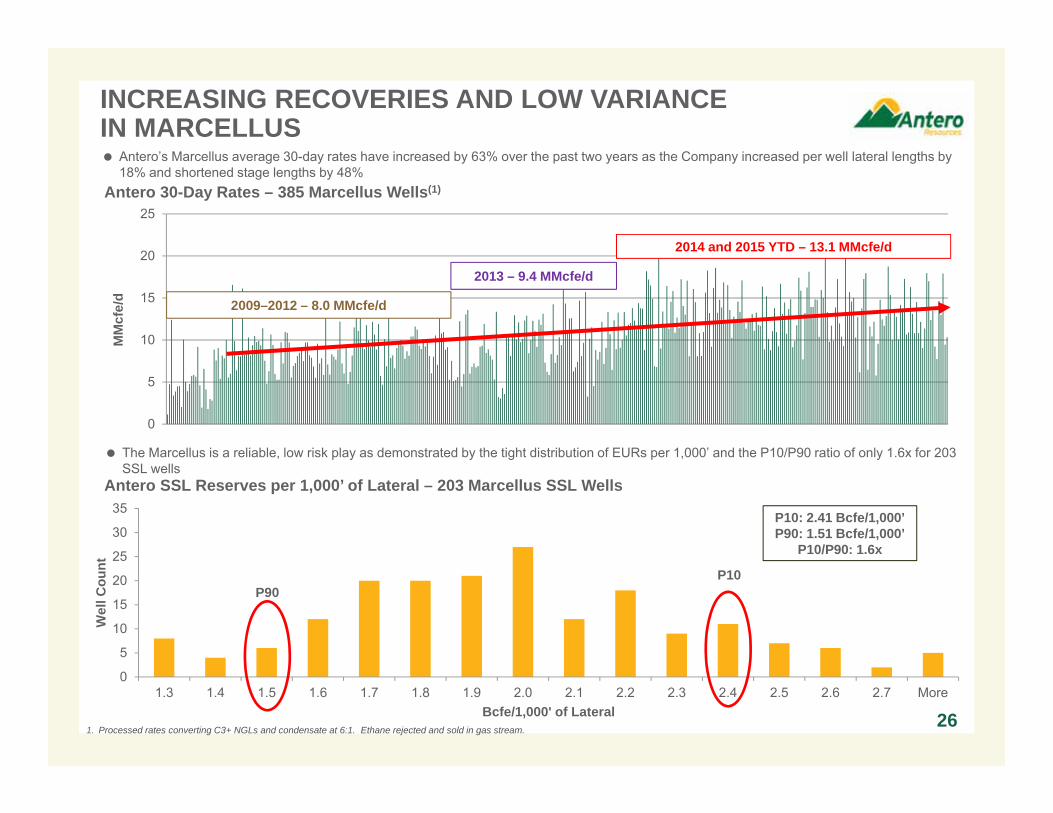
Antero’s Marcellus average 30-day rates have increased by 63% over the past two years as the Company increased per well lateral lengths by 18% and shortened stage lengths by 48%
INCREASING RECOVERIES AND LOW VARIANCEIN MARCELLUS
1. Processed rates converting C3+ NGLs and condensate at 6:1. Ethane rejected and sold in gas stream.
Antero 30-Day Rates – 385 Marcellus Wells(1)
26
Antero SSL Reserves per 1,000’ of Lateral – 203 Marcellus SSL Wells
2014 and 2015 YTD – 13.1 MMcfe/d
2013 – 9.4 MMcfe/d
2009–2012 – 8.0 MMcfe/d
The Marcellus is a reliable, low risk play as demonstrated by the tight distribution of EURs per 1,000’ and the P10/P90 ratio of only 1.6x for 203 SSL wells
P10: 2.41 Bcfe/1,000’P90: 1.51 Bcfe/1,000’
P10/P90: 1.6x
P90P10
411 420
361
283
200 200
14 16
21
27
40 45
- 5 10 15 20 25 30 35 40 45 50
- 50
100 150 200 250 300 350 400 450
2010 2011 2012 2013 2014 2015E
Ave
rage
Fra
c St
ages
per
Wel
l
Ave
rage
Sta
ge L
engt
h (F
eet)
Increasing Frac Stages per Well
Average Stage Length (Feet) Average Frac Stages per Well
(1)
1.5 1.61.5
1.6
2.0
$0.97 $0.89
$0.98 $1.13
$0.89
$0.00
$0.20
$0.40
$0.60
$0.80
$1.00
$1.20
0.00
0.50
1.00
1.50
2.00
2.50
2010 2011 2012 2013 2014
Dev
elop
men
t Cos
t ($/
Mcf
e)
EUR
/1,0
00' L
ater
al
EUR vs. Development Cost per Unit
EUR/1,000' Lateral (Bcfe) Development Cost ($/Mcfe) 27
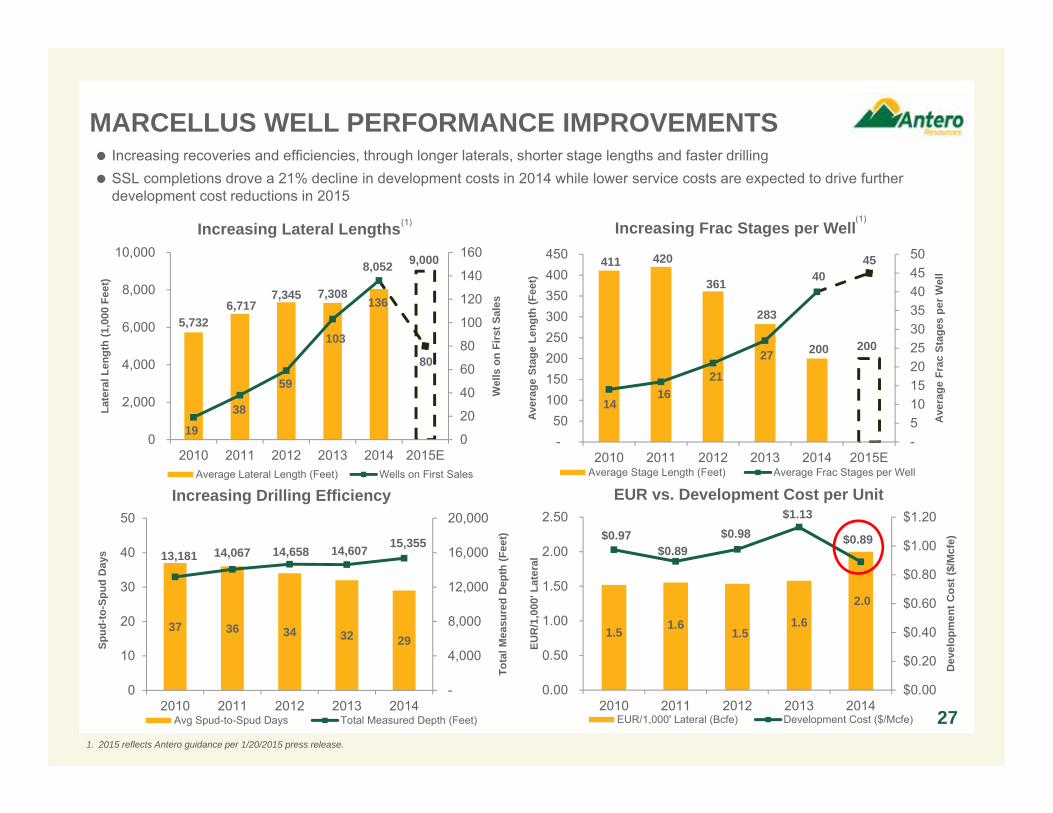
MARCELLUS WELL PERFORMANCE IMPROVEMENTS Increasing recoveries and efficiencies, through longer laterals, shorter stage lengths and faster drilling SSL completions drove a 21% decline in development costs in 2014 while lower service costs are expected to drive further
development cost reductions in 2015
1. 2015 reflects Antero guidance per 1/20/2015 press release.
37 36 34 32 29
13,181 14,067 14,658 14,607 15,355
-
4,000
8,000
12,000
16,000
20,000
0
10
20
30
40
50
2010 2011 2012 2013 2014
Tota
l Mea
sure
d D
epth
(Fee
t)
Spud
-to-S
pud
Day
s
Increasing Drilling Efficiency
Avg Spud-to-Spud Days Total Measured Depth (Feet)
5,732 6,717
7,345 7,308
8,052 9,000
19
38
59
103
136
80
0
20
40
60
80
100
120
140
160
0
2,000
4,000
6,000
8,000
10,000
2010 2011 2012 2013 2014 2015E
Wel
ls o
n Fi
rst S
ales
Late
ral L
engt
h (1
,000
Fee
t)
Increasing Lateral Lengths
Average Lateral Length (Feet) Wells on First Sales
(1)
0.0%
20.0%
40.0%
60.0%
80.0%
100.0%
$3.00 $3.50 $4.00 $4.50 $5.00 $5.50 $6.00
Pre-
Tax
RO
R (%
)
Highly-Rich Gas/Condensate Highly-Rich Gas Rich Gas Dry Gas
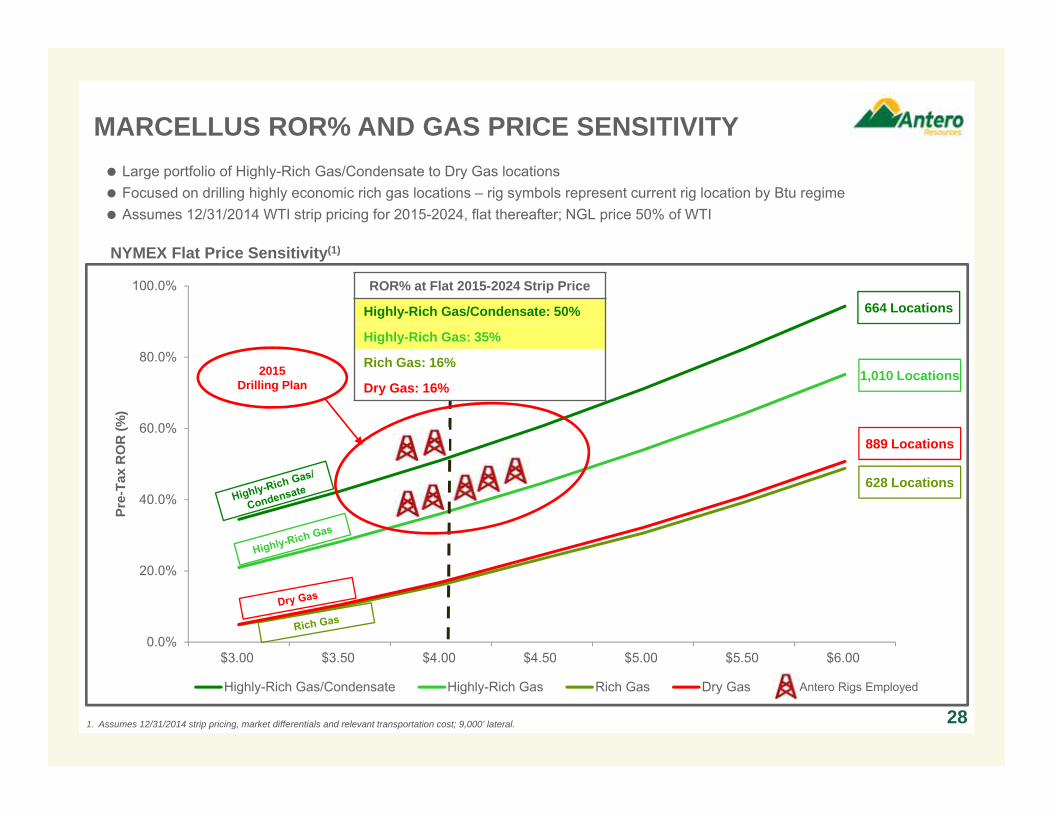
MARCELLUS ROR% AND GAS PRICE SENSITIVITY
281. Assumes 12/31/2014 strip pricing, market differentials and relevant transportation cost; 9,000’ lateral.
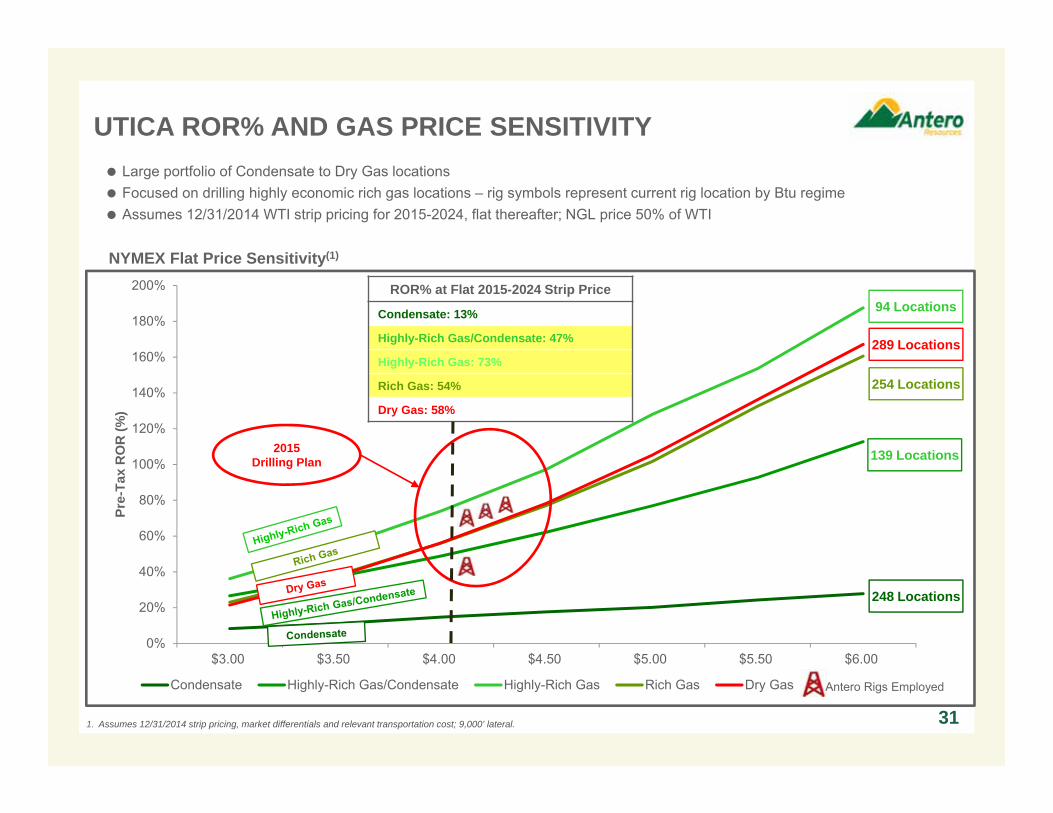
Large portfolio of Highly-Rich Gas/Condensate to Dry Gas locations Focused on drilling highly economic rich gas locations – rig symbols represent current rig location by Btu regime Assumes 12/31/2014 WTI strip pricing for 2015-2024, flat thereafter; NGL price 50% of WTI
NYMEX Flat Price Sensitivity(1)
ROR% at Flat 2015-2024 Strip Price
Highly-Rich Gas/Condensate: 50%
Highly-Rich Gas: 35%
Rich Gas: 16%
Dry Gas: 16%
664 Locations
1,010 Locations
628 Locations
889 Locations
Antero Rigs Employed
2015Drilling Plan

Note: Antero acreage position reflects townships in which greater than 3,000 net acres are held. Antero 30-day rates in ethane rejection.1. 30-day rate reflects restricted choke regime.
100% operated Operating 4 drilling rigs 149,000 net acres in the core rich gas/
condensate window (72% includes processable rich gas assuming an 1100 Btu cutoff)– 23% HBP with additional 75% not expiring
for 5+ years 58 operated horizontal wells completed and
online in Antero core areas− 100% drilling success rate
3 plants at Seneca Processing Complex capable of processing 600 MMcf/d of rich gas− Over 500 MMcf/d being processed currently,
including third party production Net production of 274 MMcfe/d in 1Q 2015E
including 11,300 Bbl/d of liquids Fourth third party compressor station in-service
December 2014 with a capacity of 120 MMcf/d 1,024 future gross drilling locations (735 or 72%
are processable gas) 7.6 Tcfe of net 3P (15% liquids), includes
758 Bcfe of proved reserves (assuming ethane rejection)
LEADING UTICA SHALE CORE POSITION DELIVERS PROLIFIC LIQUIDS-RICH WELLS
29
CadizProcessing
Plant
NORMAN UNIT30-Day Rate
2 wells average16.8 MMcfe/d (15% liquids)
RUBEL UNIT30-Day Rate
3 wells average17.2 MMcfe/d(20% liquids)
Utica Core Area
GARY UNIT30-Day Rate
3 wells average24.2 MMcfe/d(21% liquids)
Highly-Rich/Cond26,000 Net Acres
139 Gross Locations
Highly-Rich Gas16,000 Net Acres
94 Gross Locations
Rich Gas33,000 Net Acres
254 Gross Locations
Dry Gas42,000 Net Acres
289 Gross Locations
NEUHART UNIT 3H30-Day Rate16.2 MMcfe/d(57% liquids)
Condensate32,000 Net Acres
248 Gross Locations
DOLLISON UNIT 1H30-Day Rate19.8 MMcfe/d(40% liquids)
MYRON UNIT 1H30-Day Rate26.8 MMcfe/d(52% liquids)
SenecaProcessingComplex
LAW UNIT30-Day Rate
2 wells average16.1 MMcfe/d(50% liquids)
SCHAFER UNIT30-Day Rate(1)
2 wells average14.2 MMcfe/d(49% liquids)
URBAN PAD30-Day Rate
4 wells average 18.8 MMcfe/d (15% liquids)
GRAVES UNIT500’ Density Pilot
30-Day Rate4 wells average15.5 MMcfe/d(24% liquids)
FRANKLIN UNIT30-Day Rate
3 wells average17.6 MMcfe/d(16% liquids)
FRAKES UNIT30-Day Rate
2 wells average18.6 MMcfe/d(42% liquids)
1.4 1.6
$1.64
$1.24
$0.00
$0.30
$0.60
$0.90
$1.20
$1.50
$1.80
0.000.200.400.600.801.001.201.401.60
2013 2014
Dev
elop
men
t Cos
t ($/
Mcf
e)
EUR
/1,0
00' L
ater
al
EUR vs. Development Cost per Unit
EUR/1,000' Lateral (Bcfe) Development Cost ($/Mcfe) 30
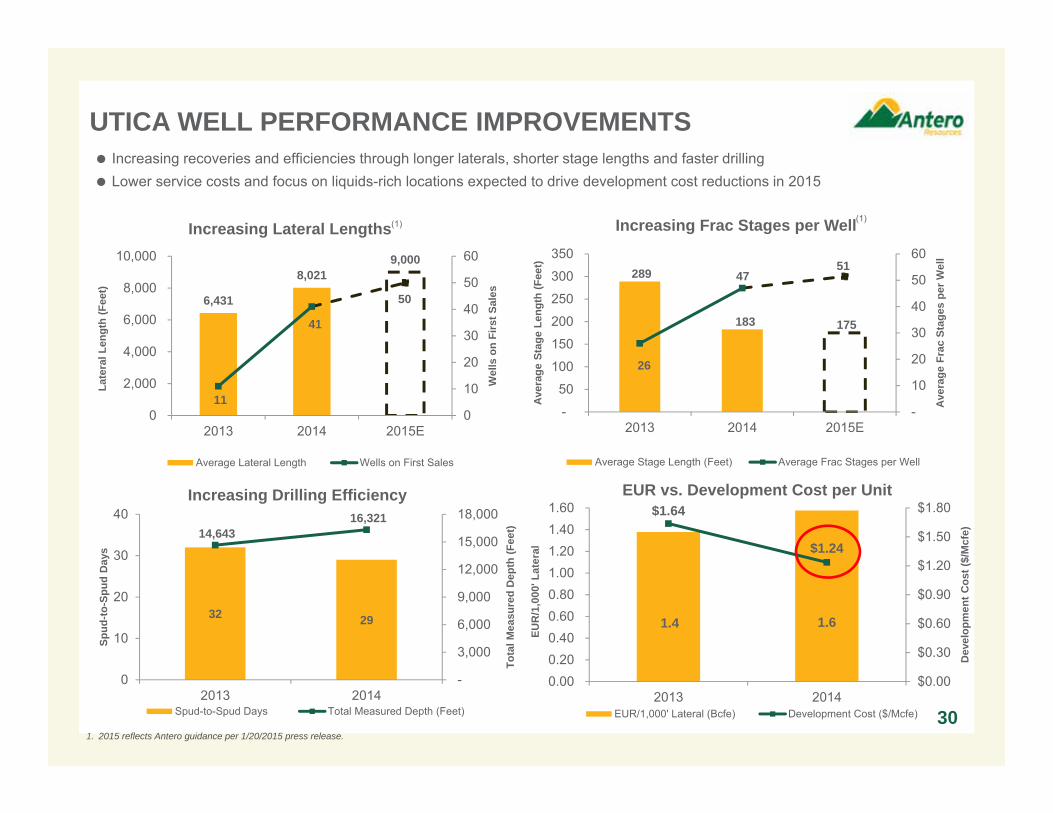
UTICA WELL PERFORMANCE IMPROVEMENTS Increasing recoveries and efficiencies through longer laterals, shorter stage lengths and faster drilling Lower service costs and focus on liquids-rich locations expected to drive development cost reductions in 2015
1. 2015 reflects Antero guidance per 1/20/2015 press release.
32 29
14,643 16,321
-
3,000
6,000
9,000
12,000
15,000
18,000
0
10
20
30
40
2013 2014
Tota
l Mea
sure
d D
epth
(Fee
t)
Spud
-to-S
pud
Day
s
Increasing Drilling Efficiency
Spud-to-Spud Days Total Measured Depth (Feet)
6,431
8,021 9,000
11
41
50
0
10
20
30
40
50
60
0
2,000
4,000
6,000
8,000
10,000
2013 2014 2015E
Wel
ls o
n Fi
rst S
ales
Late
ral L
engt
h (F
eet)
Increasing Lateral Lengths
Average Lateral Length Wells on First Sales
(1)
289
183 175
26
47 51
-
10
20
30
40
50
60
-
50
100
150
200
250
300
350
2013 2014 2015E
Ave
rage
Fra
c St
ages
per
Wel
l
Ave
rage
Sta
ge L
engt
h (F
eet)
Increasing Frac Stages per Well
Average Stage Length (Feet) Average Frac Stages per Well
(1)
0%
20%
40%
60%
80%
100%
120%
140%
160%
180%
200%
$3.00 $3.50 $4.00 $4.50 $5.00 $5.50 $6.00
Pre-
Tax
RO
R (%
)
Condensate Highly-Rich Gas/Condensate Highly-Rich Gas Rich Gas Dry Gas Antero Rigs Employed
UTICA ROR% AND GAS PRICE SENSITIVITY
31
NYMEX Flat Price Sensitivity(1)
94 LocationsROR% at Flat 2015-2024 Strip Price
Condensate: 13%
Highly-Rich Gas/Condensate: 47%
Highly-Rich Gas: 73%
Rich Gas: 54%
Dry Gas: 58%
Large portfolio of Condensate to Dry Gas locations Focused on drilling highly economic rich gas locations – rig symbols represent current rig location by Btu regime Assumes 12/31/2014 WTI strip pricing for 2015-2024, flat thereafter; NGL price 50% of WTI
1. Assumes 12/31/2014 strip pricing, market differentials and relevant transportation cost; 9,000’ lateral.
254 Locations
139 Locations
289 Locations
248 Locations
2015Drilling Plan
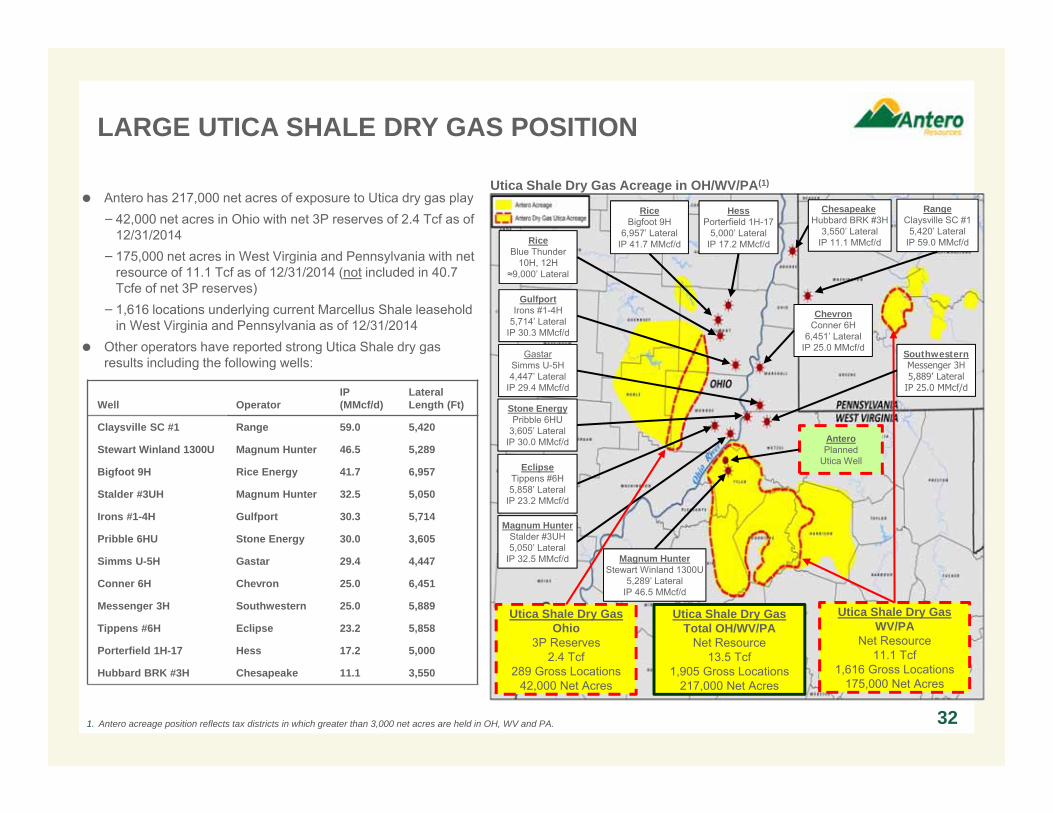
LARGE UTICA SHALE DRY GAS POSITION
32
Antero has 217,000 net acres of exposure to Utica dry gas play− 42,000 net acres in Ohio with net 3P reserves of 2.4 Tcf as of
12/31/2014− 175,000 net acres in West Virginia and Pennsylvania with net
resource of 11.1 Tcf as of 12/31/2014 (not included in 40.7 Tcfe of net 3P reserves)
− 1,616 locations underlying current Marcellus Shale leasehold in West Virginia and Pennsylvania as of 12/31/2014
Other operators have reported strong Utica Shale dry gas results including the following wells:
ChesapeakeHubbard BRK #3H
3,550’ LateralIP 11.1 MMcf/d
HessPorterfield 1H-17
5,000’ LateralIP 17.2 MMcf/d
GulfportIrons #1-4H
5,714’ LateralIP 30.3 MMcf/d
EclipseTippens #6H5,858’ Lateral
IP 23.2 MMcf/d
Magnum HunterStalder #3UH5,050’ Lateral
IP 32.5 MMcf/d
AnteroPlanned
Utica Well
Well OperatorIP(MMcf/d)
Lateral Length (Ft)
Claysville SC #1 Range 59.0 5,420
Stewart Winland 1300U Magnum Hunter 46.5 5,289
Bigfoot 9H Rice Energy 41.7 6,957
Stalder #3UH Magnum Hunter 32.5 5,050
Irons #1-4H Gulfport 30.3 5,714
Pribble 6HU Stone Energy 30.0 3,605
Simms U-5H Gastar 29.4 4,447
Conner 6H Chevron 25.0 6,451
Messenger 3H Southwestern 25.0 5,889
Tippens #6H Eclipse 23.2 5,858
Porterfield 1H-17 Hess 17.2 5,000
Hubbard BRK #3H Chesapeake 11.1 3,550
1. Antero acreage position reflects tax districts in which greater than 3,000 net acres are held in OH, WV and PA.
Magnum HunterStewart Winland 1300U
5,289’ LateralIP 46.5 MMcf/d
RangeClaysville SC #1
5,420’ LateralIP 59.0 MMcf/d
ChevronConner 6H
6,451’ LateralIP 25.0 MMcf/d
GastarSimms U-5H4,447’ Lateral
IP 29.4 MMcf/d
Utica Shale Dry Gas Acreage in OH/WV/PA(1)
RiceBigfoot 9H
6,957’ LateralIP 41.7 MMcf/d
Utica Shale Dry GasWV/PA
Net Resource11.1 Tcf
1,616 Gross Locations175,000 Net Acres
Utica Shale Dry GasOhio
3P Reserves2.4 Tcf
289 Gross Locations42,000 Net Acres
Utica Shale Dry GasTotal OH/WV/PA
Net Resource13.5 Tcf
1,905 Gross Locations217,000 Net Acres
Stone EnergyPribble 6HU
3,605’ LateralIP 30.0 MMcf/d
SouthwesternMessenger 3H5,889’ Lateral
IP 25.0 MMcf/d
RiceBlue Thunder
10H, 12H≈9,000’ Lateral
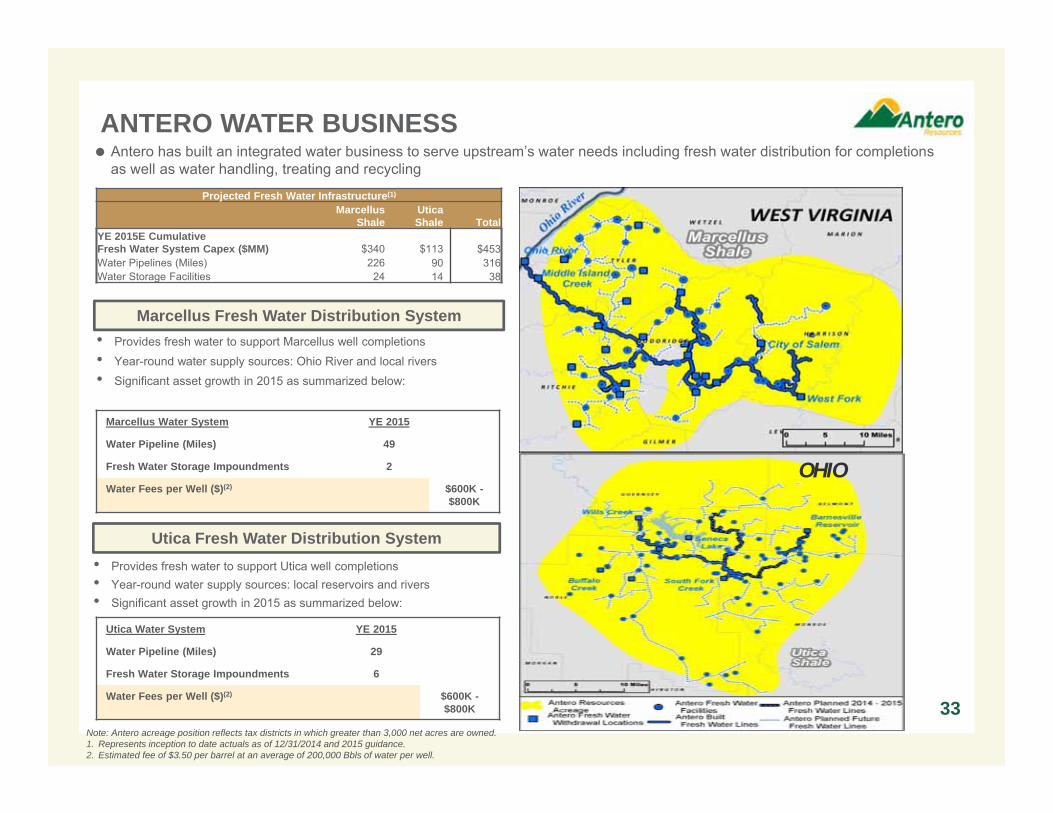
ANTERO WATER BUSINESS
33
Marcellus Fresh Water Distribution System• Provides fresh water to support Marcellus well completions • Year-round water supply sources: Ohio River and local rivers• Significant asset growth in 2015 as summarized below:
Note: Antero acreage position reflects tax districts in which greater than 3,000 net acres are owned.1. Represents inception to date actuals as of 12/31/2014 and 2015 guidance.2. Estimated fee of $3.50 per barrel at an average of 200,000 Bbls of water per well.
Utica Fresh Water Distribution System• Provides fresh water to support Utica well completions • Year-round water supply sources: local reservoirs and rivers• Significant asset growth in 2015 as summarized below:
Marcellus Water System YE 2015
Water Pipeline (Miles) 49
Fresh Water Storage Impoundments 2
Water Fees per Well ($)(2) $600K -$800K
Utica Water System YE 2015
Water Pipeline (Miles) 29
Fresh Water Storage Impoundments 6
Water Fees per Well ($)(2) $600K -$800K
OHIO
Projected Fresh Water Infrastructure(1)
Marcellus Shale
Utica Shale Total
YE 2015E Cumulative Fresh Water System Capex ($MM) $340 $113 $453Water Pipelines (Miles) 226 90 316Water Storage Facilities 24 14 38
Antero has built an integrated water business to serve upstream’s water needs including fresh water distribution for completionsas well as water handling, treating and recycling
-
500,000
1,000,000
1,500,000
2,000,000
2,500,000
3,000,000
3,500,000
4,000,000
4,500,000
Jul-1
4S
ep-1
4N
ov-1
4Ja
n-15
Mar
-15
May
-15
Jul-1
5S
ep-1
5N
ov-1
5Ja
n-16
Mar
-16
May
-16
Jul-1
6S
ep-1
6N
ov-1
6Ja
n-17
Mar
-17
May
-17
Jul-1
7S
ep-1
7N
ov-1
7Ja
n-18
Mar
-18
May
-18
Jul-1
8S
ep-1
8N
ov-1
8Ja
n-19
Mar
-19
May
-19
Jul-1
9S
ep-1
9N
ov-1
9Ja
n-20
Mar
-20
May
-20
Jul-2
0S
ep-2
0N
ov-2
0
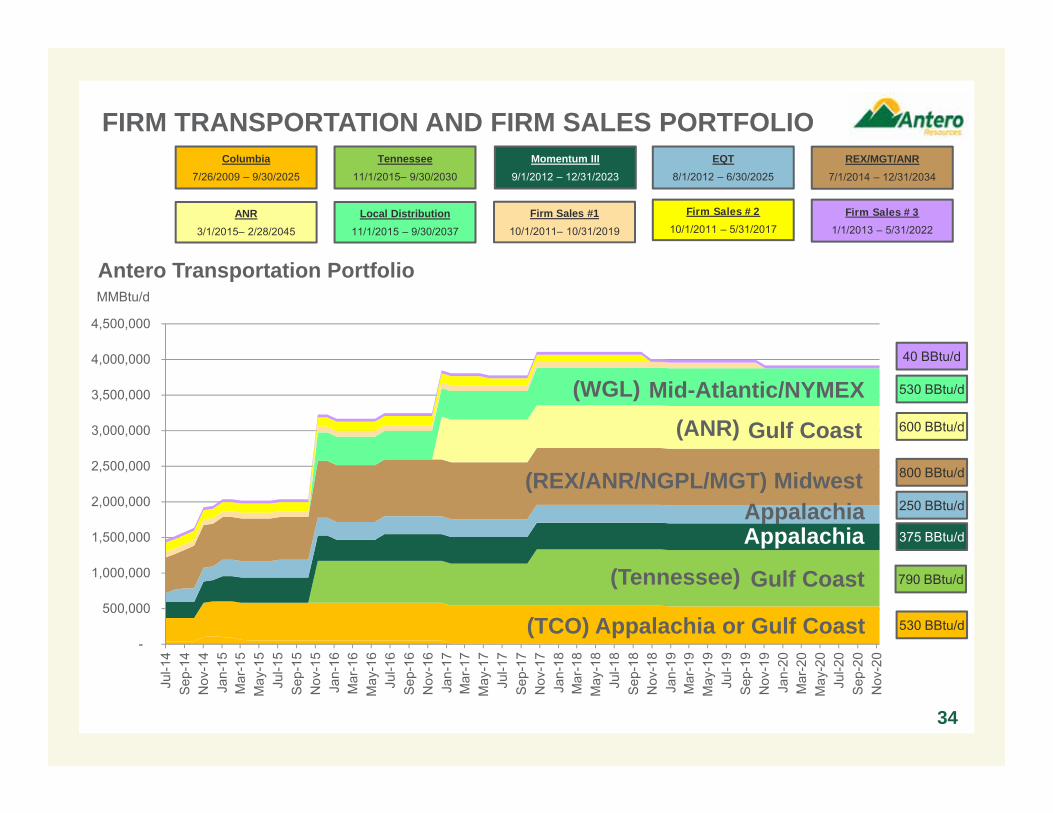
FIRM TRANSPORTATION AND FIRM SALES PORTFOLIO
34
MMBtu/d
Columbia7/26/2009 – 9/30/2025
Firm Sales #110/1/2011– 10/31/2019
Firm Sales #2
10/1/2011 – 5/31/2017Firm Sales #3
1/1/2013 – 5/31/2022
Momentum III9/1/2012 – 12/31/2023
EQT8/1/2012 – 6/30/2025
REX/MGT/ANR7/1/2014 – 12/31/2034
Tennessee11/1/2015– 9/30/2030
Mid-Atlantic/NYMEX
Gulf Coast
(TCO) Appalachia or Gulf Coast
AppalachiaAppalachia
ANR3/1/2015– 2/28/2045
(REX/ANR/NGPL/MGT) Midwest
Local Distribution11/1/2015 – 9/30/2037
Gulf Coast
Antero Transportation Portfolio
530 BBtu/d
790 BBtu/d
375 BBtu/d
250 BBtu/d
800 BBtu/d
600 BBtu/d
530 BBtu/d
40 BBtu/d
(WGL)(ANR)
(Tennessee)
$0.14 $0.17 $0.23$0.33$0.11 $0.11
$0.12
$0.13
$0.00
$0.10
$0.20
$0.30
$0.40
$0.50
$0.60
$0.70
2013A 2014A 2015E 2016E
($/M
MB
tu)
Wtd. Avg. FT Demand ($/MMBtu) Wtd. Avg. FT Commodity/Fuel ($/MMBtu)
All-in Firm Transportation Costs(1)
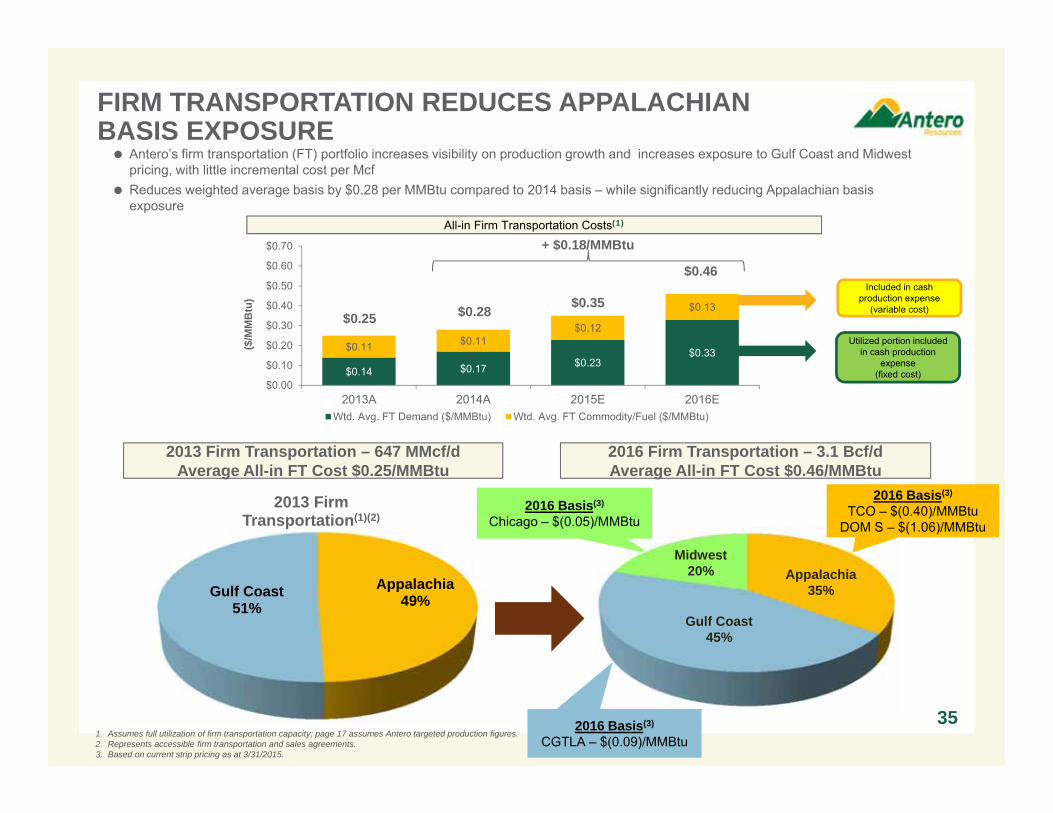
FIRM TRANSPORTATION REDUCES APPALACHIAN BASIS EXPOSURE
Appalachia 49%Gulf Coast
51%
2013 FirmTransportation(1)(2)
2013 Firm Transportation – 647 MMcf/dAverage All-in FT Cost $0.25/MMBtu
2016 Firm Transportation – 3.1 Bcf/dAverage All-in FT Cost $0.46/MMBtu
+ $0.18/MMBtu
Antero’s firm transportation (FT) portfolio increases visibility on production growth and increases exposure to Gulf Coast and Midwest pricing, with little incremental cost per Mcf
Reduces weighted average basis by $0.28 per MMBtu compared to 2014 basis – while significantly reducing Appalachian basis exposure
Utilized portion included in cash production
expense(fixed cost)
1. Assumes full utilization of firm transportation capacity; page 17 assumes Antero targeted production figures.2. Represents accessible firm transportation and sales agreements.3. Based on current strip pricing as at 3/31/2015.
Included in cash production expense
(variable cost)$0.25 $0.28 $0.35
$0.46
2016 Basis(3)
TCO – $(0.40)/MMBtu DOM S – $(1.06)/MMBtu
2016 Basis(3)
Chicago – $(0.05)/MMBtu
2016 Basis(3)
CGTLA – $(0.09)/MMBtu
35
Appalachia35%
Midwest20%
Gulf Coast45%
0
500
1,000
1,500
2,000
2,500
Marketable FT (BBtu/d) (3)Firm Transportation / Firm Sales (BBtu/d)Risked Gross Gas Production Target (Bbtu/d)
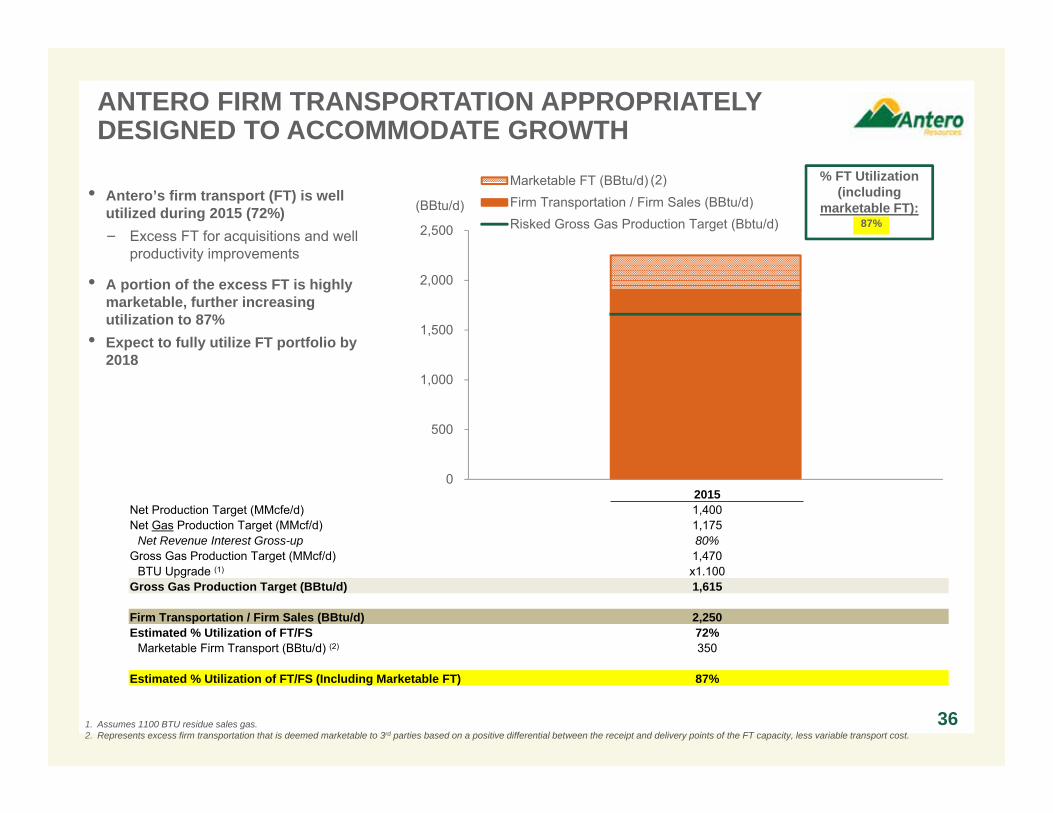
ANTERO FIRM TRANSPORTATION APPROPRIATELY DESIGNED TO ACCOMMODATE GROWTH
361. Assumes 1100 BTU residue sales gas.2. Represents excess firm transportation that is deemed marketable to 3rd parties based on a positive differential between the receipt and delivery points of the FT capacity, less variable transport cost.
(BBtu/d)
2015Net Production Target (MMcfe/d) 1,400 Net Gas Production Target (MMcf/d) 1,175
Net Revenue Interest Gross-up 80%Gross Gas Production Target (MMcf/d) 1,470
BTU Upgrade (1) x1.100 Gross Gas Production Target (BBtu/d) 1,615
Firm Transportation / Firm Sales (BBtu/d) 2,250 Estimated % Utilization of FT/FS 72%
Marketable Firm Transport (BBtu/d) (2) 350
Estimated % Utilization of FT/FS (Including Marketable FT) 87%
% FT Utilization (including
marketable FT):• Antero’s firm transport (FT) is well
utilized during 2015 (72%) − Excess FT for acquisitions and well
productivity improvements
• A portion of the excess FT is highly marketable, further increasing utilization to 87%
• Expect to fully utilize FT portfolio by 2018
87%
(2)
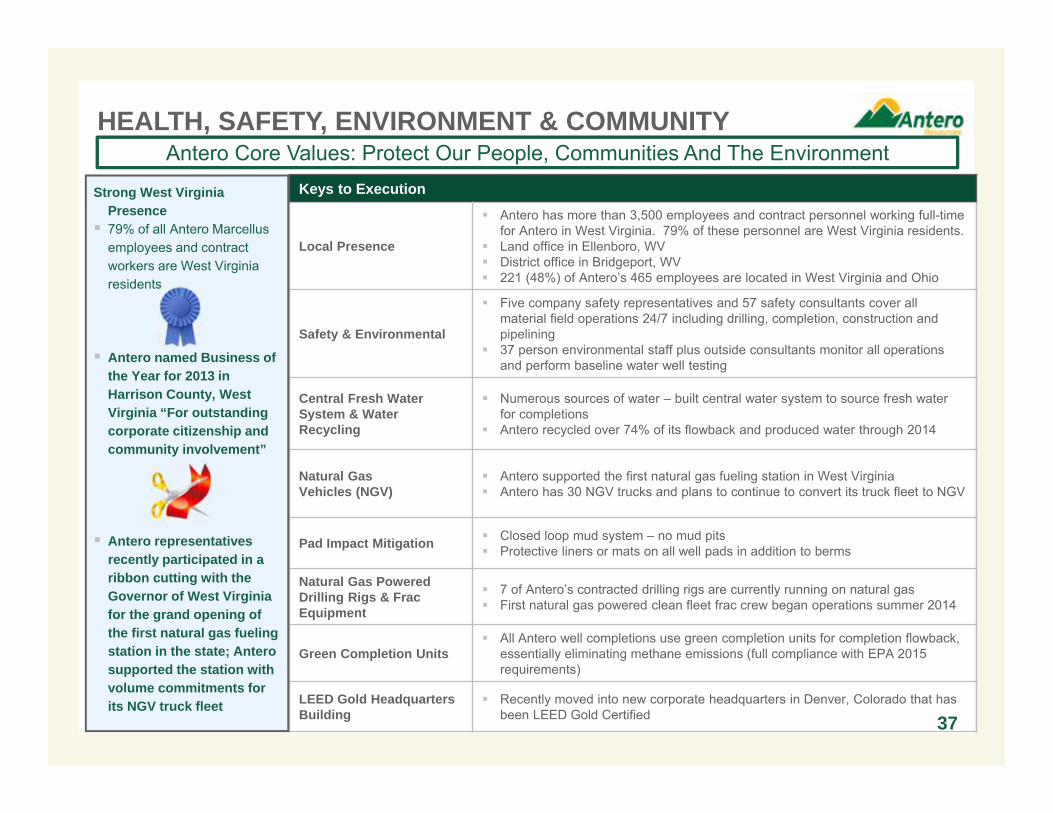
Keys to Execution
Local Presence
Antero has more than 3,500 employees and contract personnel working full-time for Antero in West Virginia. 79% of these personnel are West Virginia residents.
Land office in Ellenboro, WV District office in Bridgeport, WV 221 (48%) of Antero’s 465 employees are located in West Virginia and Ohio
Safety & Environmental
Five company safety representatives and 57 safety consultants cover all material field operations 24/7 including drilling, completion, construction and pipelining
37 person environmental staff plus outside consultants monitor all operations and perform baseline water well testing
Central Fresh Water System & Water Recycling
Numerous sources of water – built central water system to source fresh water for completions
Antero recycled over 74% of its flowback and produced water through 2014
Natural Gas Vehicles (NGV)
Antero supported the first natural gas fueling station in West Virginia Antero has 30 NGV trucks and plans to continue to convert its truck fleet to NGV
Pad Impact Mitigation Closed loop mud system – no mud pits Protective liners or mats on all well pads in addition to berms
Natural Gas Powered Drilling Rigs & Frac Equipment
7 of Antero’s contracted drilling rigs are currently running on natural gas First natural gas powered clean fleet frac crew began operations summer 2014
Green Completion Units All Antero well completions use green completion units for completion flowback,
essentially eliminating methane emissions (full compliance with EPA 2015requirements)
LEED Gold Headquarters Building
Recently moved into new corporate headquarters in Denver, Colorado that has been LEED Gold Certified
HEALTH, SAFETY, ENVIRONMENT & COMMUNITYAntero Core Values: Protect Our People, Communities And The Environment
Strong West Virginia Presence 79% of all Antero Marcellus
employees and contract workers are West Virginia residents
Antero named Business of the Year for 2013 in Harrison County, West Virginia “For outstanding corporate citizenship and community involvement”
Antero representatives recently participated in a ribbon cutting with the Governor of West Virginia for the grand opening of the first natural gas fueling station in the state; Antero supported the station with volume commitments for its NGV truck fleet
37
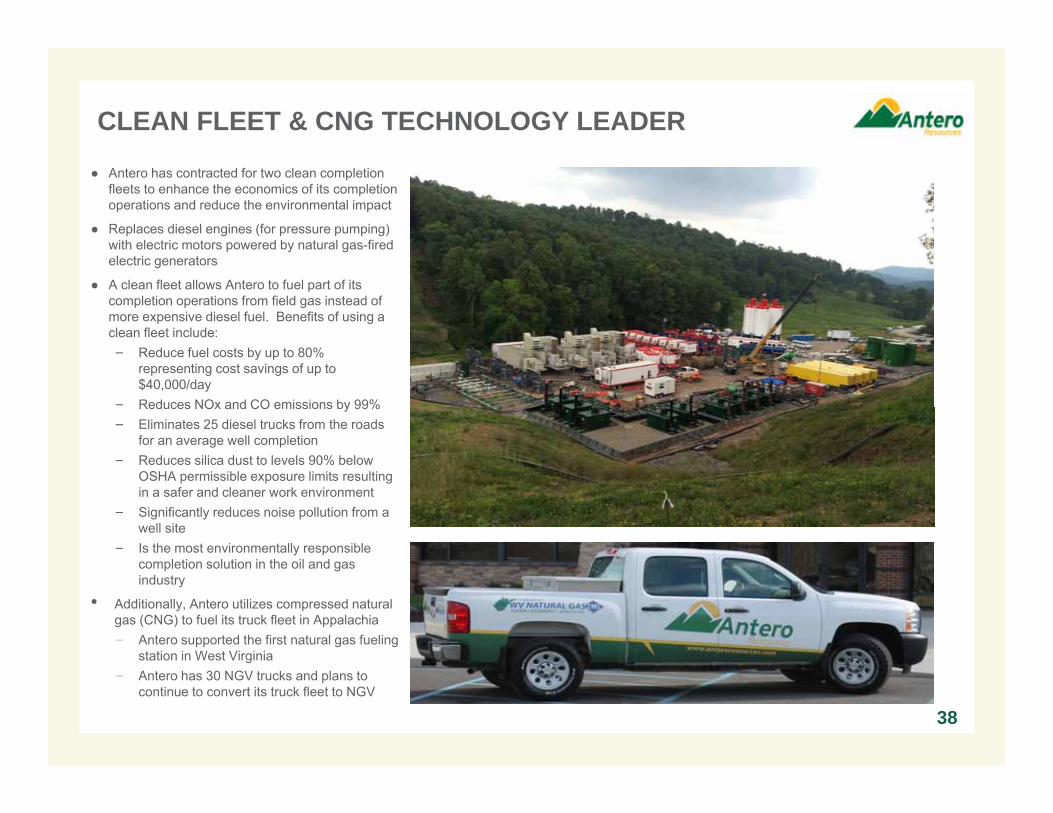
CLEAN FLEET & CNG TECHNOLOGY LEADER
● Antero has contracted for two clean completion fleets to enhance the economics of its completion operations and reduce the environmental impact
● Replaces diesel engines (for pressure pumping) with electric motors powered by natural gas-fired electric generators
● A clean fleet allows Antero to fuel part of its completion operations from field gas instead of more expensive diesel fuel. Benefits of using a clean fleet include:− Reduce fuel costs by up to 80%
representing cost savings of up to $40,000/day
− Reduces NOx and CO emissions by 99%− Eliminates 25 diesel trucks from the roads
for an average well completion− Reduces silica dust to levels 90% below
OSHA permissible exposure limits resulting in a safer and cleaner work environment
− Significantly reduces noise pollution from a well site
− Is the most environmentally responsible completion solution in the oil and gas industry
• Additionally, Antero utilizes compressed natural gas (CNG) to fuel its truck fleet in Appalachia− Antero supported the first natural gas fueling
station in West Virginia− Antero has 30 NGV trucks and plans to
continue to convert its truck fleet to NGV
38
39
Antero Midstream (NYSE: AM)Asset Overview

1. Represents inception to date actuals as of 12/31/2014 and midpoint of 2015 guidance.2. Includes $12.5 million of maintenance capex at midpoint of 2015 guidance. 40
• Gathering and compression assets in core of rapidly growing Marcellus and Utica Shale plays
– Acreage dedication of ~417,000 net leasehold acres for gathering and compression services
– 100% fixed fee long term contracts
• AR owns 70% of AM units (NYSE: AM)
UticaShale
MarcellusShale
Projected Midstream Infrastructure(1)
Marcellus Shale
Utica Shale Total
YE 2014 Cumulative Gathering/ Compression Capex ($MM) $836 $345 $1,181
Gathering Pipelines(Miles) 153 80 233
Compression Capacity(MMcf/d) 375 - 375
Condensate Gathering Pipelines (Miles) - 16 16
2015 Gathering/Compression Capex Budget ($MM)(2) $256 $182 $438
Gathering Pipelines (Miles) 46 18 64
Compression Capacity(MMcf/d) 425 120 545
Condensate Gathering Pipelines (Miles) - 4 4
Midstream Assets
ANTERO MIDSTREAM PARTNERS OVERVIEW
$1$5
$7 $8$12
$19
$28
$155
$0
$5
$10
$15
$20
$25
$30
$35
$40
2Q '13 3Q '13 4Q '13 1Q '14 2Q '14 3Q '14 4Q '14 2015E
26 31 40 36 41
116
222
0
50
100
150
200
250
2Q '13 3Q '13 4Q '13 1Q '14 2Q '14 3Q '14 4Q '14
Marcellus
10 38 80
126 266
531
907
0
200
400
600
800
1,000
2Q '13 3Q '13 4Q '13 1Q '14 2Q '14 3Q '14 4Q '14
Utica Marcellus
108
216 281 331
386
533
738
0
200
400
600
800
1,000
2Q '13 3Q '13 4Q '13 1Q '14 2Q '14 3Q '14 4Q '14
Utica Marcellus
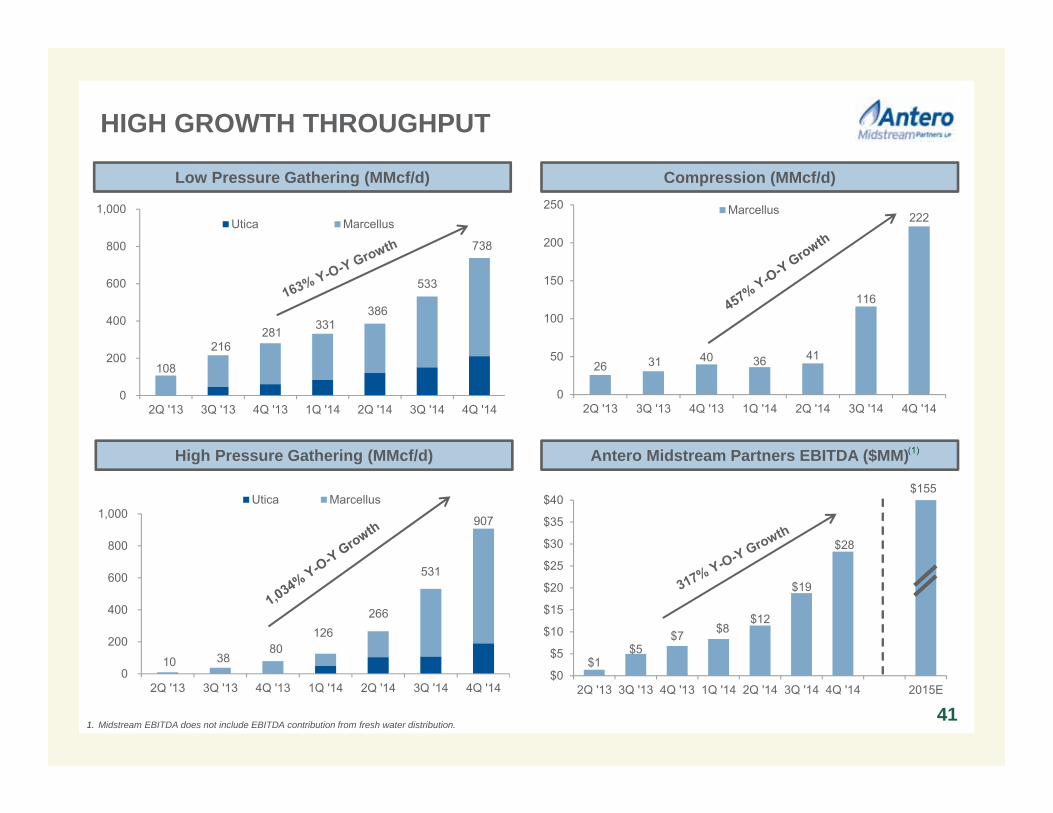
HIGH GROWTH THROUGHPUT
Low Pressure Gathering (MMcf/d) Compression (MMcf/d)
High Pressure Gathering (MMcf/d) Antero Midstream Partners EBITDA ($MM)
1. Midstream EBITDA does not include EBITDA contribution from fresh water distribution.
(1)
41
0.0x0.6x
1.9x
3.1x3.8x 4.0x 4.1x 4.4x
4.8x
0.0x
1.0x
2.0x
3.0x
4.0x
5.0x
6.0x
Peer 1 Peer 2 Peer 3 Peer 4 Peer 5 Peer 6 Peer 7 Peer 8Tota
l Deb
t / L
TM E
BIT
DA
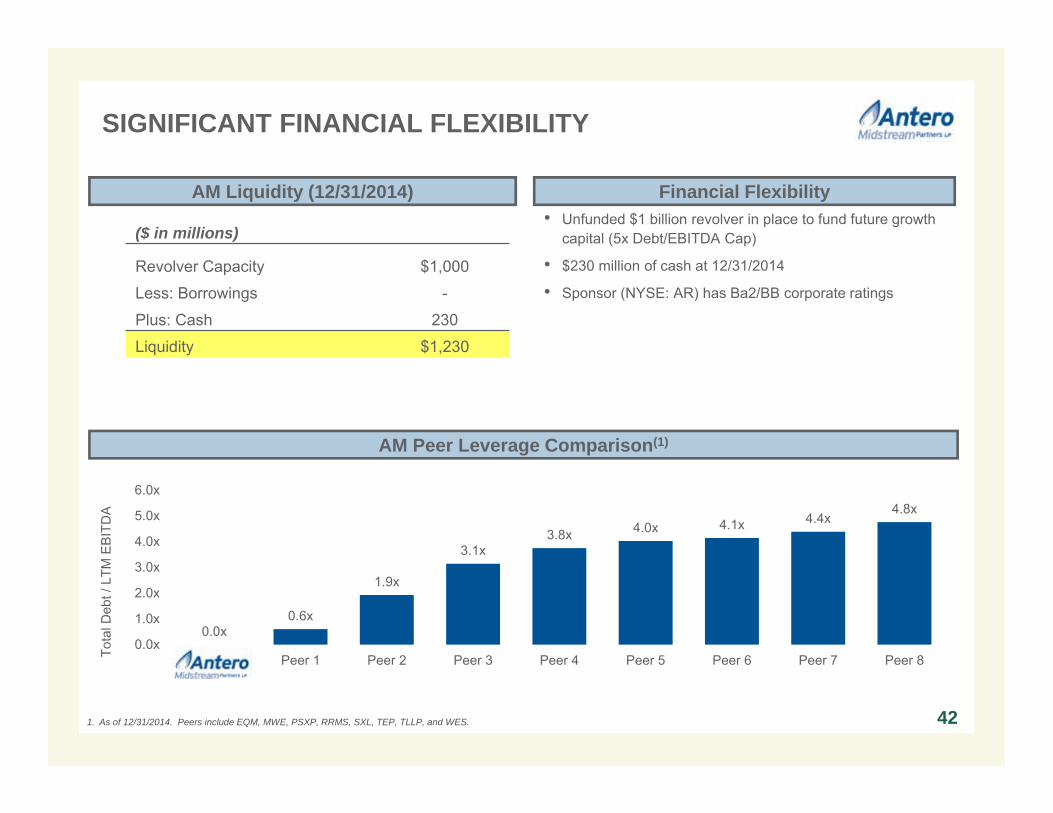
SIGNIFICANT FINANCIAL FLEXIBILITY
42
• Unfunded $1 billion revolver in place to fund future growth capital (5x Debt/EBITDA Cap)
• $230 million of cash at 12/31/2014
• Sponsor (NYSE: AR) has Ba2/BB corporate ratings
AM Liquidity (12/31/2014)
AM Peer Leverage Comparison(1)
($ in millions)
Revolver Capacity $1,000
Less: Borrowings -
Plus: Cash 230
Liquidity $1,230
1. As of 12/31/2014. Peers include EQM, MWE, PSXP, RRMS, SXL, TEP, TLLP, and WES.
Financial Flexibility
43
APPENDIX
43

44
CHANGES SINCE PRIOR MARCH 2015 PRESENTATION
New slide showing AR net production, reserves and acreage position, including liquids-rich core Slide 2
Updated liquids-rich core map showing net acreage position held by AR vs. peers Slide 10
Updated AR single well economics and sensitivity for Marcellus and Utica as of 12/31/2014 10-year strip Slide 20, 28, 31, 52, 53
Updated hedge and mark-to-market graph for AR as of 3/31/2015, with hedge gains for 1Q, 2008 – 1Q, 2015 Slide 14
Updated AR slide showing liquidity position as of 12/31/2014 pro forma and debt maturity position Slide 15
Updated AR slide showing Appalachian rig count and leading position based on 1Q 2015 average rig count Slide 7
Updated AR Marcellus production data and EUR histogram Slide 26
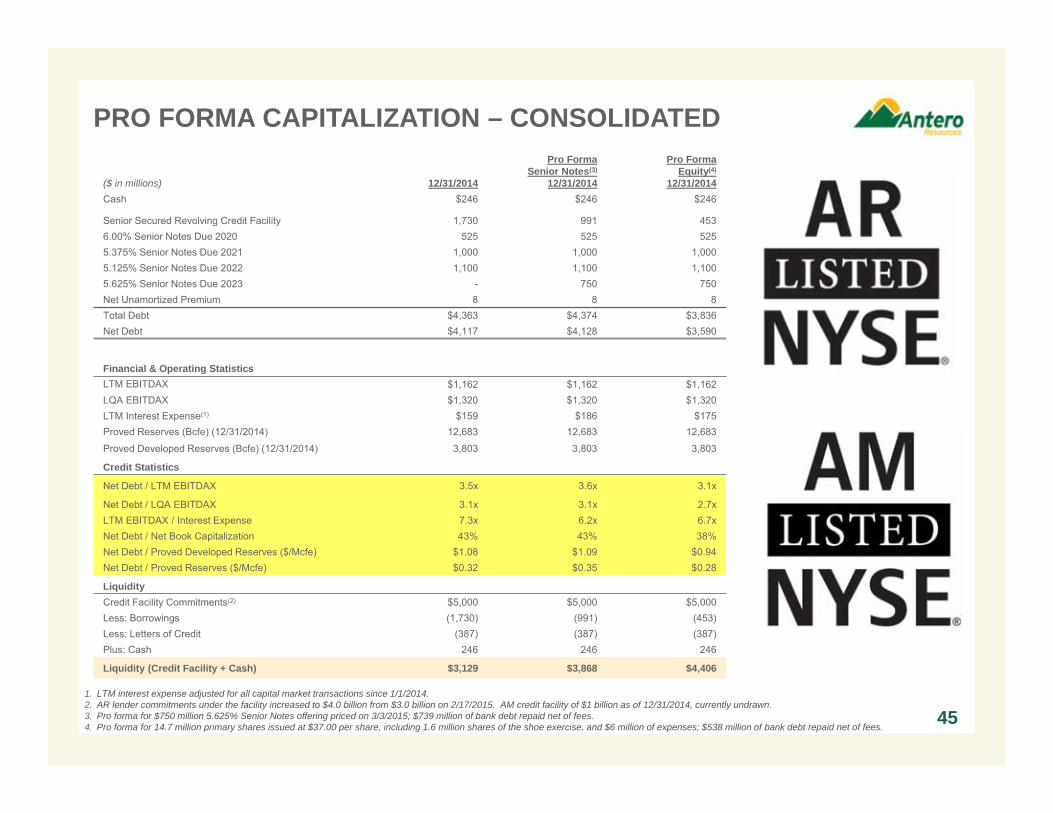
($ in millions) 12/31/2014
Pro Forma Senior Notes(3)
12/31/2014
Pro Forma Equity(4)
12/31/2014Cash $246 $246 $246
Senior Secured Revolving Credit Facility 1,730 991 4536.00% Senior Notes Due 2020 525 525 5255.375% Senior Notes Due 2021 1,000 1,000 1,0005.125% Senior Notes Due 2022 1,100 1,100 1,1005.625% Senior Notes Due 2023 - 750 750Net Unamortized Premium 8 8 8Total Debt $4,363 $4,374 $3,836Net Debt $4,117 $4,128 $3,590
Financial & Operating StatisticsLTM EBITDAX $1,162 $1,162 $1,162LQA EBITDAX $1,320 $1,320 $1,320LTM Interest Expense(1) $159 $186 $175Proved Reserves (Bcfe) (12/31/2014) 12,683 12,683 12,683
Proved Developed Reserves (Bcfe) (12/31/2014) 3,803 3,803 3,803
Credit Statistics
Net Debt / LTM EBITDAX 3.5x 3.6x 3.1x
Net Debt / LQA EBITDAX 3.1x 3.1x 2.7xLTM EBITDAX / Interest Expense 7.3x 6.2x 6.7xNet Debt / Net Book Capitalization 43% 43% 38%Net Debt / Proved Developed Reserves ($/Mcfe) $1.08 $1.09 $0.94Net Debt / Proved Reserves ($/Mcfe) $0.32 $0.35 $0.28
LiquidityCredit Facility Commitments(2) $5,000 $5,000 $5,000Less: Borrowings (1,730) (991) (453)Less: Letters of Credit (387) (387) (387)Plus: Cash 246 246 246
Liquidity (Credit Facility + Cash) $3,129 $3,868 $4,406
PRO FORMA CAPITALIZATION – CONSOLIDATED
1. LTM interest expense adjusted for all capital market transactions since 1/1/2014.2. AR lender commitments under the facility increased to $4.0 billion from $3.0 billion on 2/17/2015. AM credit facility of $1 billion as of 12/31/2014, currently undrawn. 3. Pro forma for $750 million 5.625% Senior Notes offering priced on 3/3/2015; $739 million of bank debt repaid net of fees. 4. Pro forma for 14.7 million primary shares issued at $37.00 per share, including 1.6 million shares of the shoe exercise, and $6 million of expenses; $538 million of bank debt repaid net of fees.
45
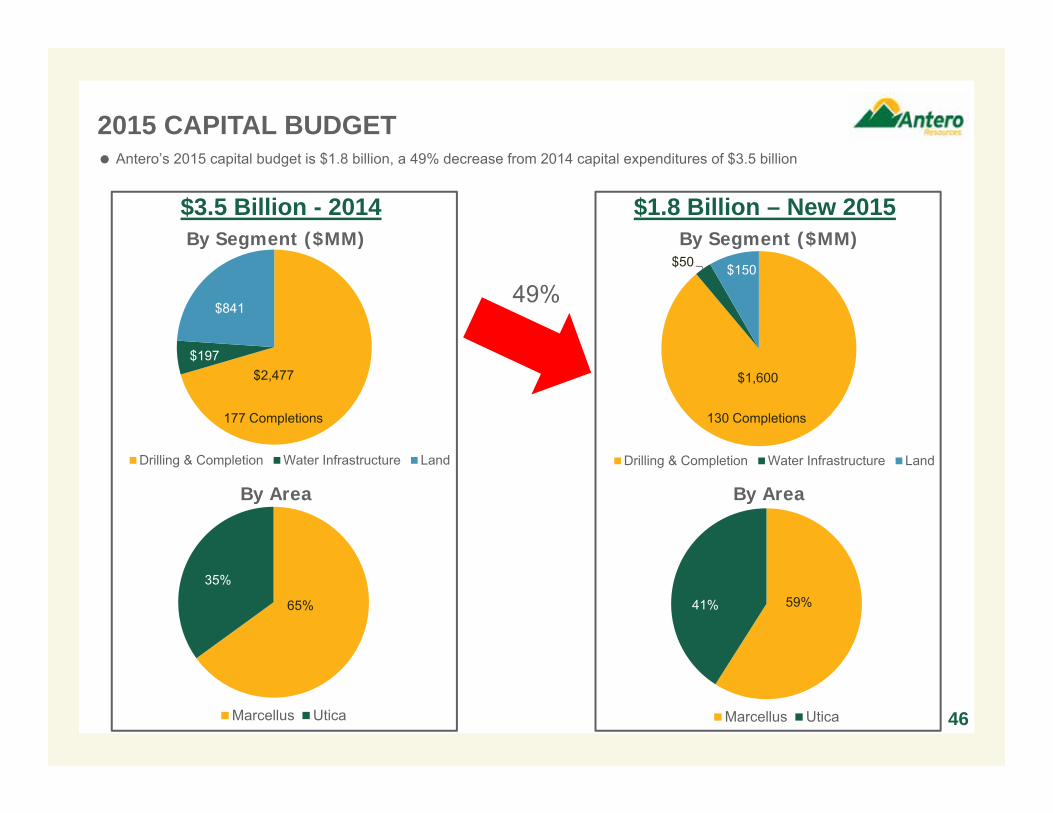
$2,477$197
$841
Drilling & Completion Water Infrastructure Land
65%
35%
Marcellus Utica
2015 CAPITAL BUDGET
By Area
46
$3.5 Billion - 2014By Segment ($MM)
$1,600
$50 $150
Drilling & Completion Water Infrastructure Land
59%41%
Marcellus Utica
By Area
$1.8 Billion – New 2015By Segment ($MM)
Antero’s 2015 capital budget is $1.8 billion, a 49% decrease from 2014 capital expenditures of $3.5 billion
49%
177 Completions 130 Completions
$0.00
$0.50
$1.00
$1.50
$2.00
$2.50
$3.00
$3.50
$4.00
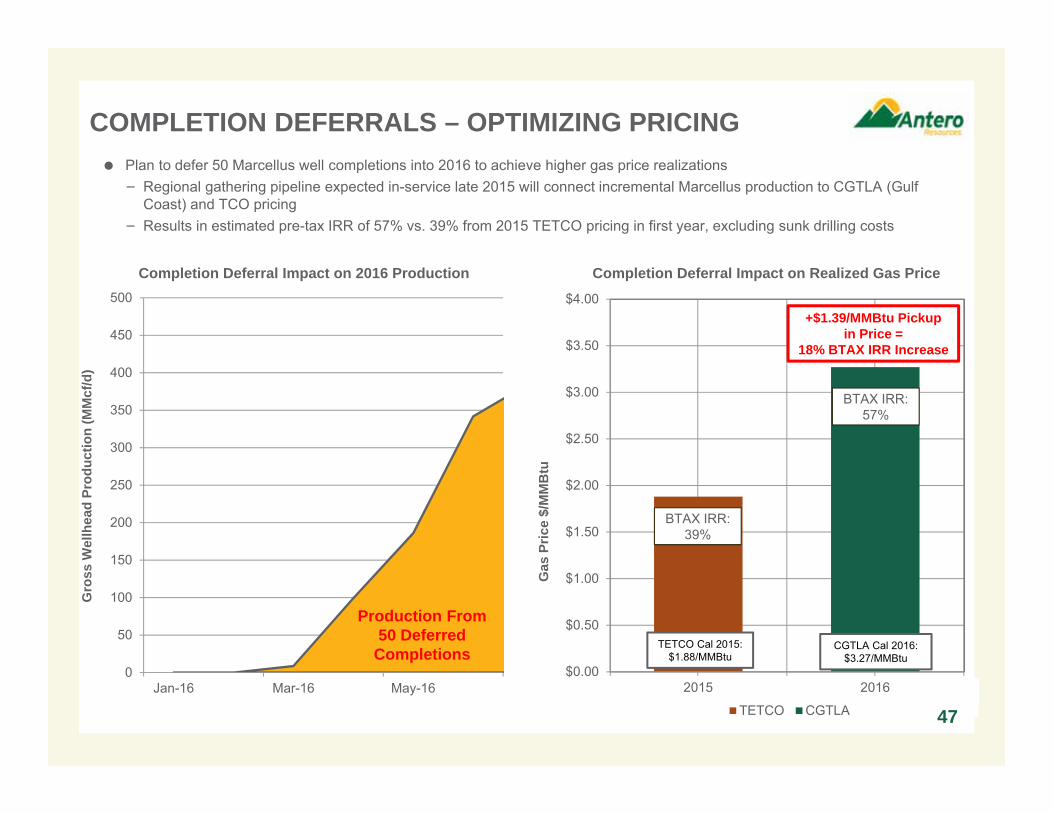
2015 2015 2016 2016 2017
Gas
Pric
e $/
MM
Btu
Completion Deferral Impact on Realized Gas Price
TETCO CGTLA
TETCO Cal 2015:$1.88/MMBtu
CGTLA Cal 2016: $3.27/MMBtu
BTAX IRR:57%
47
Plan to defer 50 Marcellus well completions into 2016 to achieve higher gas price realizations− Regional gathering pipeline expected in-service late 2015 will connect incremental Marcellus production to CGTLA (Gulf
Coast) and TCO pricing− Results in estimated pre-tax IRR of 57% vs. 39% from 2015 TETCO pricing in first year, excluding sunk drilling costs
COMPLETION DEFERRALS – OPTIMIZING PRICING
0
50
100
150
200
250
300
350
400
450
500
Jan-16 Mar-16 May-16
Gro
ss W
ellh
ead
Prod
uctio
n (M
Mcf
/d)
Completion Deferral Impact on 2016 Production
Production From 50 Deferred
Completions
+$1.39/MMBtu Pickupin Price =
18% BTAX IRR Increase
BTAX IRR:39%
ANTERO RESOURCES – 2015 GUIDANCE
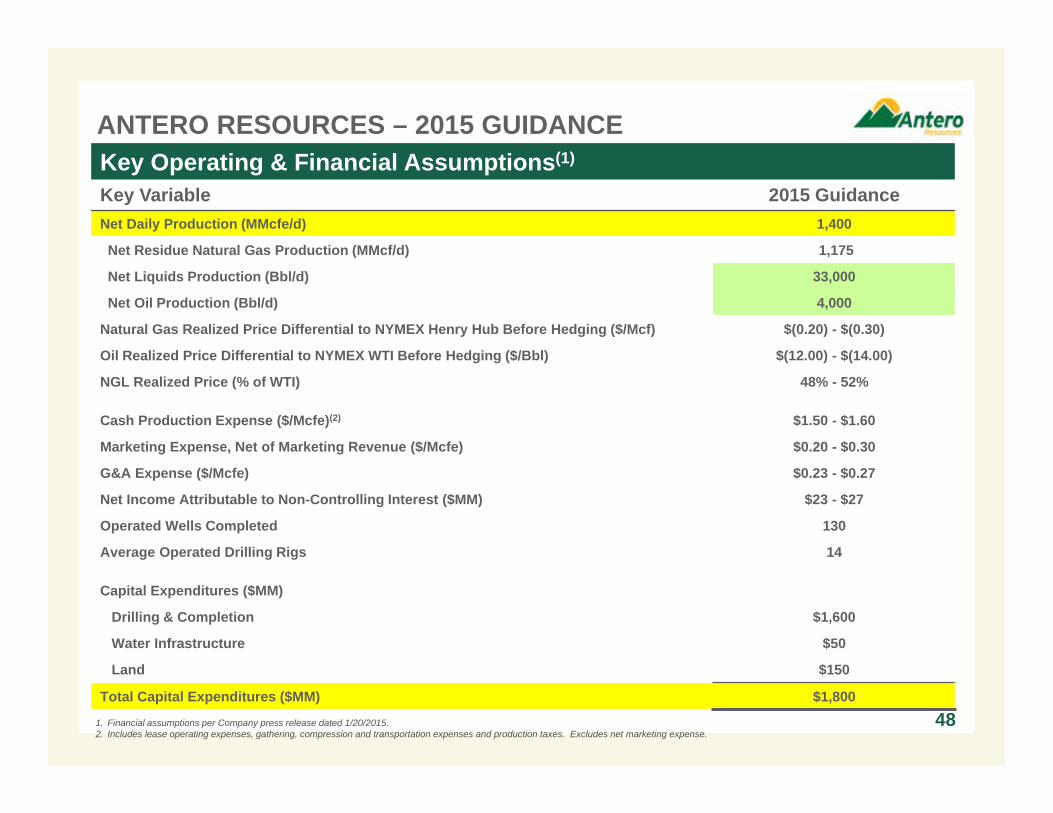
Key Variable 2015 GuidanceNet Daily Production (MMcfe/d) 1,400
Net Residue Natural Gas Production (MMcf/d) 1,175
Net Liquids Production (Bbl/d) 33,000
Net Oil Production (Bbl/d) 4,000
Natural Gas Realized Price Differential to NYMEX Henry Hub Before Hedging ($/Mcf) $(0.20) - $(0.30)
Oil Realized Price Differential to NYMEX WTI Before Hedging ($/Bbl) $(12.00) - $(14.00)
NGL Realized Price (% of WTI) 48% - 52%
Cash Production Expense ($/Mcfe)(2) $1.50 - $1.60
Marketing Expense, Net of Marketing Revenue ($/Mcfe) $0.20 - $0.30
G&A Expense ($/Mcfe) $0.23 - $0.27
Net Income Attributable to Non-Controlling Interest ($MM) $23 - $27
Operated Wells Completed 130
Average Operated Drilling Rigs 14
Capital Expenditures ($MM)
Drilling & Completion $1,600
Water Infrastructure $50
Land $150
Total Capital Expenditures ($MM) $1,800
1. Financial assumptions per Company press release dated 1/20/2015.2. Includes lease operating expenses, gathering, compression and transportation expenses and production taxes. Excludes net marketing expense.
Key Operating & Financial Assumptions(1)
48
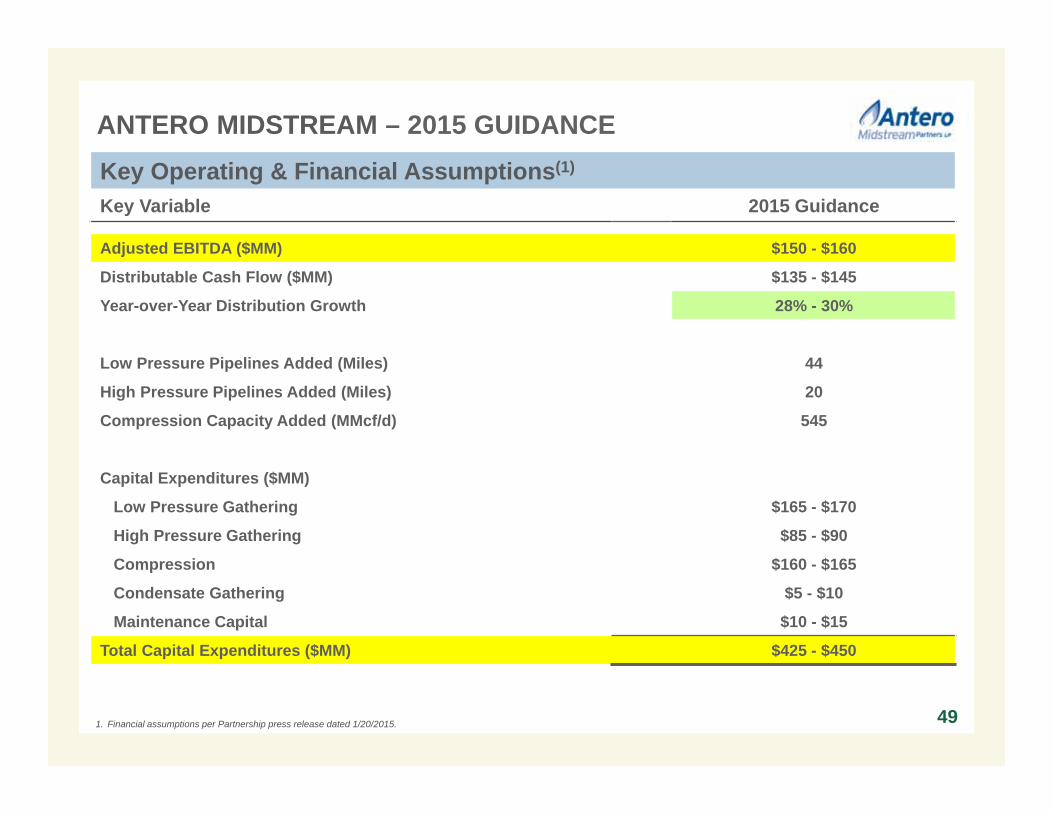
ANTERO MIDSTREAM – 2015 GUIDANCE
Key Variable 2015 Guidance
Adjusted EBITDA ($MM) $150 - $160
Distributable Cash Flow ($MM) $135 - $145
Year-over-Year Distribution Growth 28% - 30%
Low Pressure Pipelines Added (Miles) 44
High Pressure Pipelines Added (Miles) 20
Compression Capacity Added (MMcf/d) 545
Capital Expenditures ($MM)
Low Pressure Gathering $165 - $170
High Pressure Gathering $85 - $90
Compression $160 - $165
Condensate Gathering $5 - $10
Maintenance Capital $10 - $15
Total Capital Expenditures ($MM) $425 - $450
1. Financial assumptions per Partnership press release dated 1/20/2015.
Key Operating & Financial Assumptions(1)
49
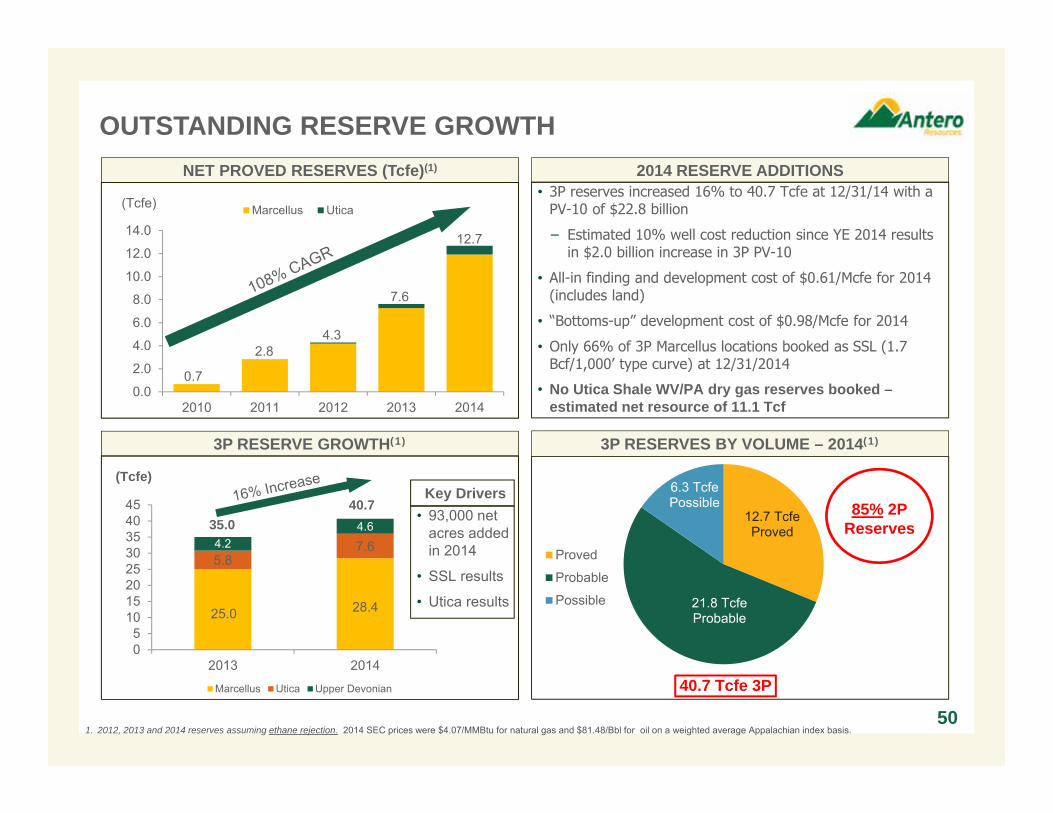
12.7 TcfeProved
21.8 TcfeProbable
6.3 TcfePossible
Proved
Probable
Possible
40.7 Tcfe 3P
85% 2P Reserves
OUTSTANDING RESERVE GROWTH
1. 2012, 2013 and 2014 reserves assuming ethane rejection. 2014 SEC prices were $4.07/MMBtu for natural gas and $81.48/Bbl for oil on a weighted average Appalachian index basis.50
3P RESERVES BY VOLUME – 2014(1)3P RESERVE GROWTH(1)
25.0 28.4
5.87.64.24.6
05
1015202530354045
2013 2014
(Tcfe)
Marcellus Utica Upper Devonian
Key Drivers
4.2
NET PROVED RESERVES (Tcfe)(1) 2014 RESERVE ADDITIONS
35.040.7
• 93,000 net acres added in 2014
• SSL results
• Utica results
• 3P reserves increased 16% to 40.7 Tcfe at 12/31/14 with a PV-10 of $22.8 billion
− Estimated 10% well cost reduction since YE 2014 results in $2.0 billion increase in 3P PV-10
• All-in finding and development cost of $0.61/Mcfe for 2014 (includes land)
• “Bottoms-up” development cost of $0.98/Mcfe for 2014
• Only 66% of 3P Marcellus locations booked as SSL (1.7 Bcf/1,000’ type curve) at 12/31/2014
• No Utica Shale WV/PA dry gas reserves booked –estimated net resource of 11.1 Tcf
0.0
2.0
4.0
6.0
8.0
10.0
12.0
14.0
2010 2011 2012 2013 2014
Marcellus Utica
0.7
2.84.3
7.6
12.7
(Tcfe)
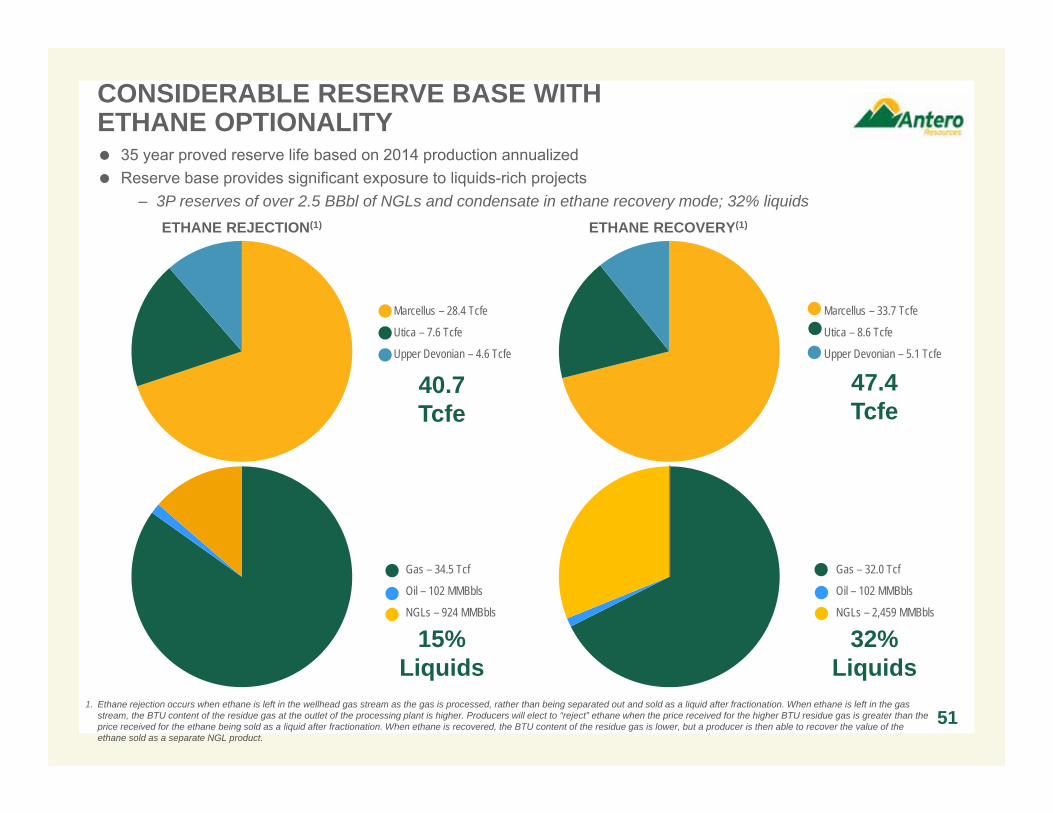
CONSIDERABLE RESERVE BASE WITH ETHANE OPTIONALITY 35 year proved reserve life based on 2014 production annualized Reserve base provides significant exposure to liquids-rich projects
– 3P reserves of over 2.5 BBbl of NGLs and condensate in ethane recovery mode; 32% liquids
1. Ethane rejection occurs when ethane is left in the wellhead gas stream as the gas is processed, rather than being separated out and sold as a liquid after fractionation. When ethane is left in the gas stream, the BTU content of the residue gas at the outlet of the processing plant is higher. Producers will elect to “reject” ethane when the price received for the higher BTU residue gas is greater than the price received for the ethane being sold as a liquid after fractionation. When ethane is recovered, the BTU content of the residue gas is lower, but a producer is then able to recover the value of the ethane sold as a separate NGL product.
ETHANE REJECTION(1) ETHANE RECOVERY(1)
51
Marcellus – 28.4 Tcfe
Utica – 7.6 Tcfe
Upper Devonian – 4.6 Tcfe
40.7Tcfe
Gas – 34.5 Tcf
Oil – 102 MMBbls
NGLs – 924 MMBbls
Marcellus – 33.7 Tcfe
Utica – 8.6 Tcfe
Upper Devonian – 5.1 Tcfe
47.4Tcfe
Gas – 32.0 Tcf
Oil – 102 MMBbls
NGLs – 2,459 MMBbls
15%Liquids
32%Liquids
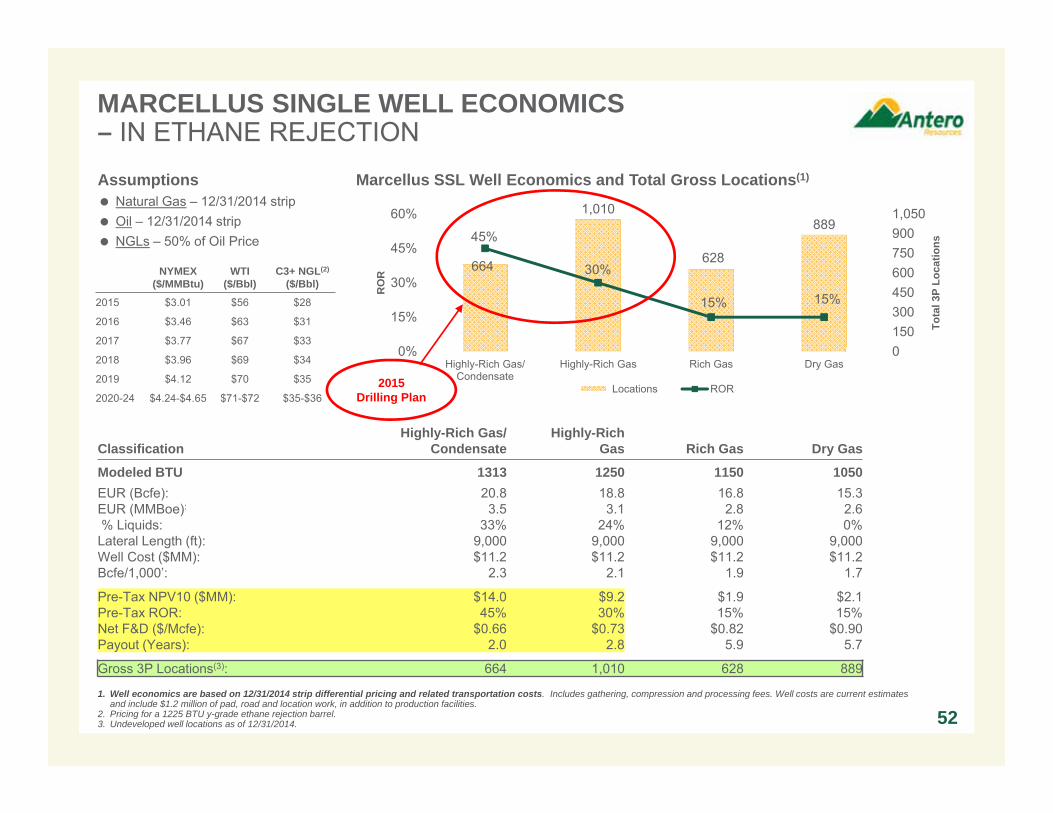
MARCELLUS SINGLE WELL ECONOMICS – IN ETHANE REJECTION
52
DRY GAS LOCATIONS RICH GAS LOCATIONS
HIGHLY RICH GAS
LOCATIONS
Assumptions Natural Gas – 12/31/2014 strip Oil – 12/31/2014 strip NGLs – 50% of Oil Price
NYMEX($/MMBtu)
WTI($/Bbl)
C3+ NGL(2)
($/Bbl)
2015 $3.01 $56 $28
2016 $3.46 $63 $31
2017 $3.77 $67 $33
2018 $3.96 $69 $34
2019 $4.12 $70 $35
2020-24 $4.24-$4.65 $71-$72 $35-$36
Marcellus SSL Well Economics and Total Gross Locations(1)
ClassificationHighly-Rich Gas/
CondensateHighly-Rich
Gas Rich Gas Dry Gas
Modeled BTU 1313 1250 1150 1050EUR (Bcfe): 20.8 18.8 16.8 15.3EUR (MMBoe): 3.5 3.1 2.8 2.6% Liquids: 33% 24% 12% 0%Lateral Length (ft): 9,000 9,000 9,000 9,000Well Cost ($MM): $11.2 $11.2 $11.2 $11.2Bcfe/1,000’: 2.3 2.1 1.9 1.7
Pre-Tax NPV10 ($MM): $14.0 $9.2 $1.9 $2.1Pre-Tax ROR: 45% 30% 15% 15%Net F&D ($/Mcfe): $0.66 $0.73 $0.82 $0.90Payout (Years): 2.0 2.8 5.9 5.7
Gross 3P Locations(3): 664 1,010 628 889
1. Well economics are based on 12/31/2014 strip differential pricing and related transportation costs. Includes gathering, compression and processing fees. Well costs are current estimates and include $1.2 million of pad, road and location work, in addition to production facilities.
2. Pricing for a 1225 BTU y-grade ethane rejection barrel.3. Undeveloped well locations as of 12/31/2014.
664
1,010
628
88945%
30%
15% 15%
01503004506007509001,050
0%
15%
30%
45%
60%
Highly-Rich Gas/Condensate
Highly-Rich Gas Rich Gas Dry Gas
Tota
l 3P
Loca
tions
RO
R Locations ROR2015
Drilling Plan
248
139
94
254289
14%
39%
55%
40%
39%
0
50
100
150
200
250
300
0%
15%
30%
45%
60%
Condensate Highly-Rich Gas/Condensate
Highly-Rich Gas Rich Gas Dry Gas
Tota
l 3P
Loca
tions
RO
RLocations ROR
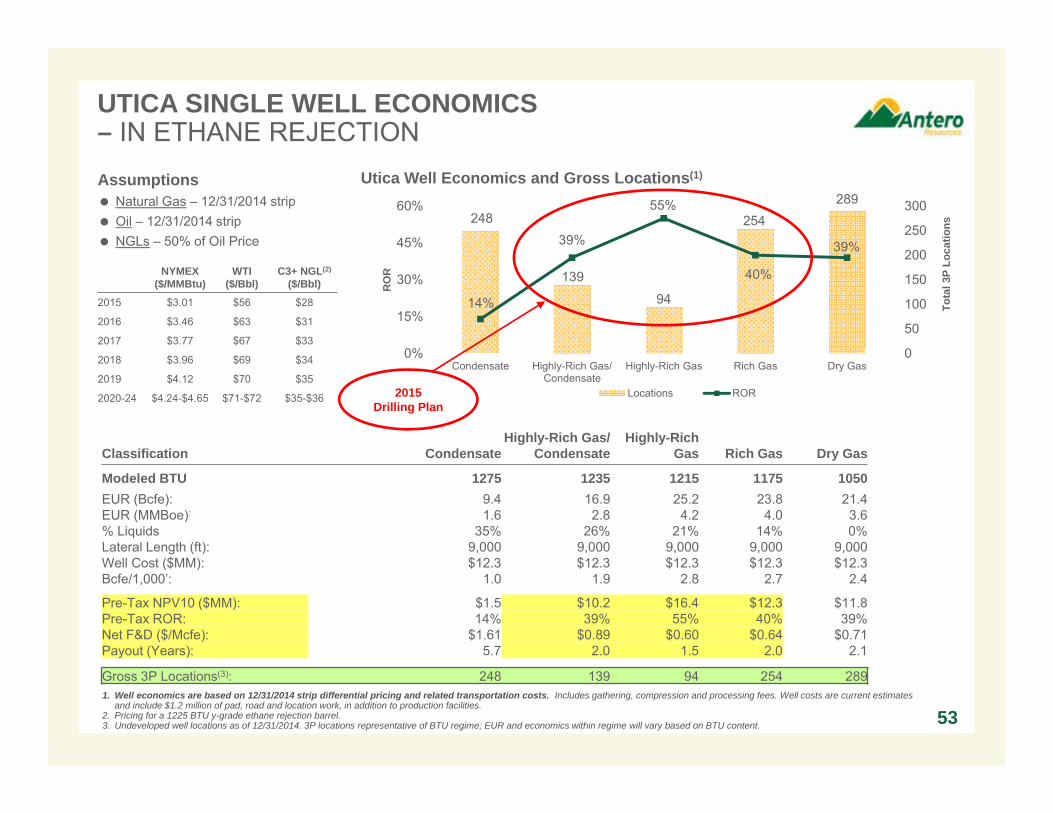
UTICA SINGLE WELL ECONOMICS – IN ETHANE REJECTION
53
DRY GAS LOCATIONS RICH GAS LOCATIONS
HIGHLY RICH GAS
LOCATIONS
Utica Well Economics and Gross Locations(1)
Classification CondensateHighly-Rich Gas/
CondensateHighly-Rich
Gas Rich Gas Dry Gas
Modeled BTU 1275 1235 1215 1175 1050EUR (Bcfe): 9.4 16.9 25.2 23.8 21.4EUR (MMBoe): 1.6 2.8 4.2 4.0 3.6% Liquids 35% 26% 21% 14% 0%Lateral Length (ft): 9,000 9,000 9,000 9,000 9,000Well Cost ($MM): $12.3 $12.3 $12.3 $12.3 $12.3Bcfe/1,000’: 1.0 1.9 2.8 2.7 2.4
Pre-Tax NPV10 ($MM): $1.5 $10.2 $16.4 $12.3 $11.8Pre-Tax ROR: 14% 39% 55% 40% 39%Net F&D ($/Mcfe): $1.61 $0.89 $0.60 $0.64 $0.71Payout (Years): 5.7 2.0 1.5 2.0 2.1
Gross 3P Locations(3): 248 139 94 254 2891. Well economics are based on 12/31/2014 strip differential pricing and related transportation costs. Includes gathering, compression and processing fees. Well costs are current estimates
and include $1.2 million of pad, road and location work, in addition to production facilities. 2. Pricing for a 1225 BTU y-grade ethane rejection barrel.3. Undeveloped well locations as of 12/31/2014. 3P locations representative of BTU regime; EUR and economics within regime will vary based on BTU content.
2015Drilling Plan
Assumptions Natural Gas – 12/31/2014 strip Oil – 12/31/2014 strip NGLs – 50% of Oil Price
NYMEX($/MMBtu)
WTI($/Bbl)
C3+ NGL(2)
($/Bbl)
2015 $3.01 $56 $28
2016 $3.46 $63 $31
2017 $3.77 $67 $33
2018 $3.96 $69 $34
2019 $4.12 $70 $35
2020-24 $4.24-$4.65 $71-$72 $35-$36
Moody's S&P
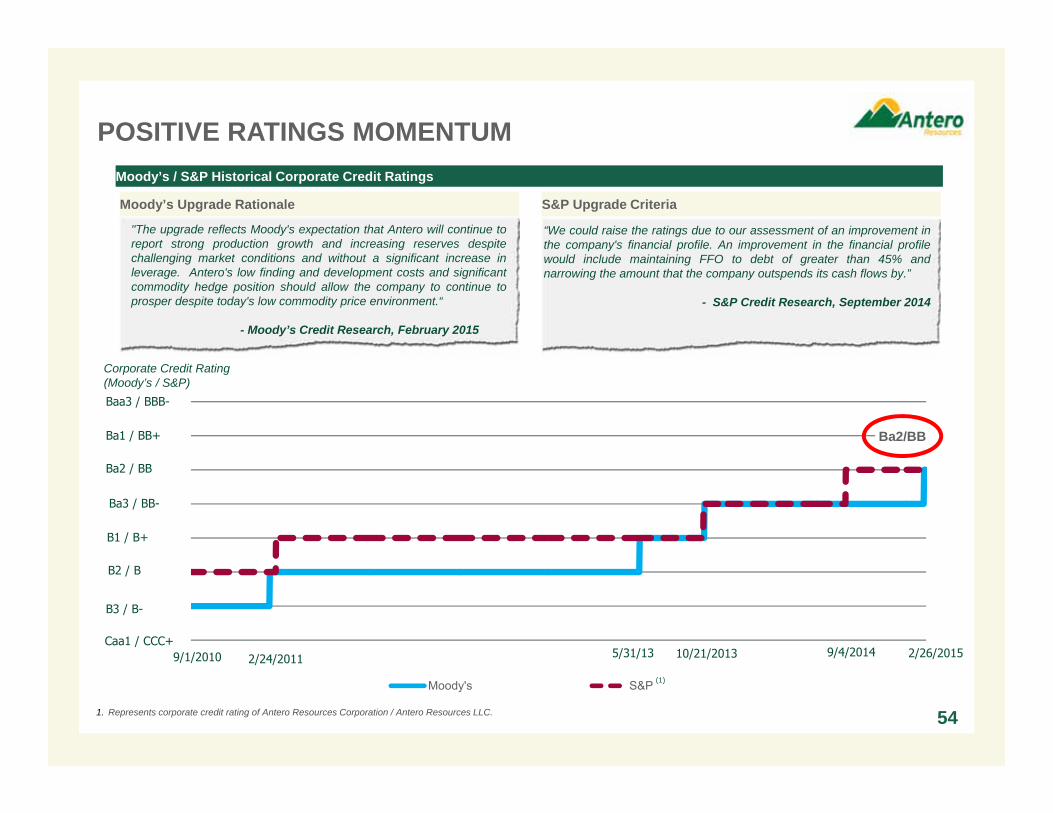
POSITIVE RATINGS MOMENTUMMoody’s / S&P Historical Corporate Credit Ratings
“We could raise the ratings due to our assessment of an improvement inthe company's financial profile. An improvement in the financial profilewould include maintaining FFO to debt of greater than 45% andnarrowing the amount that the company outspends its cash flows by.”
- S&P Credit Research, September 2014
"The upgrade reflects Moody's expectation that Antero will continue toreport strong production growth and increasing reserves despitechallenging market conditions and without a significant increase inleverage. Antero's low finding and development costs and significantcommodity hedge position should allow the company to continue toprosper despite today's low commodity price environment.“
- Moody’s Credit Research, February 2015
Corporate Credit Rating (Moody’s / S&P)
Ba3 / BB-
B1 / B+
B2 / B
B3 / B-
9/1/2010 2/24/2011 10/21/2013 9/4/20145/31/13
Ba2 / BB
Ba1 / BB+
Caa1 / CCC+
(1)
1. Represents corporate credit rating of Antero Resources Corporation / Antero Resources LLC.
Baa3 / BBB-
Moody’s Upgrade Rationale S&P Upgrade Criteria
54
2/26/2015
Ba2/BB

CAUTIONARY NOTE
The SEC permits oil and gas companies, in their filings with the SEC, to disclose only proved, probable and possible reserve estimates (collectively, “3P”). Antero has provided internally generated estimates for proved, probable and possible reserves in this presentation in accordance with SEC guidelines and definitions. The estimates of proved, probable and possible reserves as of December 31, 2014 included in this presentation have been audited by Antero’s third-party engineers. Unless otherwise noted, reserve estimates as of December 31, 2014 assume ethane rejection and strip pricing.
Actual quantities that may be ultimately recovered from Antero’s interests may differ substantially from the estimates in this presentation. Factors affecting ultimate recovery include the scope of Antero’s ongoing drilling program, which will be directly affected by commodity prices, the availability of capital, drilling and production costs, availability of drilling services and equipment, drilling results, lease expirations, transportation constraints, regulatory approvals and other factors; and actual drilling results, including geological and mechanical factors affecting recovery rates.
In this presentation:
“3P reserves” refer to Antero’s estimated aggregate proved, probable and possible reserves as of December 31, 2014. The SEC prohibits companies from aggregating proved, probable and possible reserves in filings with the SEC due to the different levels of certainty associated with each reserve category.
“EUR,” or “Estimated Ultimate Recovery,” refers to Antero’s internal estimates of per well hydrocarbon quantities that may be potentially recovered from a hypothetical future well completed as a producer in the area. These quantities do not necessarily constitute or represent reserves within the meaning of the Society of Petroleum Engineer’s Petroleum Resource Management System or the SEC’s oil and natural gas disclosure rules.
“Condensate” refers to gas having a heat content between 1250 BTU and 1300 BTU in the Utica Shale.
“Highly-Rich Gas/Condensate” refers to gas having a heat content between 1275 BTU and 1350 BTU in the Marcellus Shale and 1225 BTU and 1250 BTU in the Utica Shale.
“Highly-Rich Gas” refers to gas having a heat content between 1200 BTU and 1275 BTU in the Marcellus Shale and 1200 BTU and 1225 BTU in the Utica Shale.
“Rich Gas” refers to gas having a heat content of between 1100 BTU and 1200 BTU.
“Dry Gas” refers to gas containing insufficient quantities of hydrocarbons heavier than methane to allow their commercial extraction or to require their removal in order to render the gas suitable for fuel use.
Regarding Hydrocarbon Quantities
55