Embed Size (px)
Citation preview
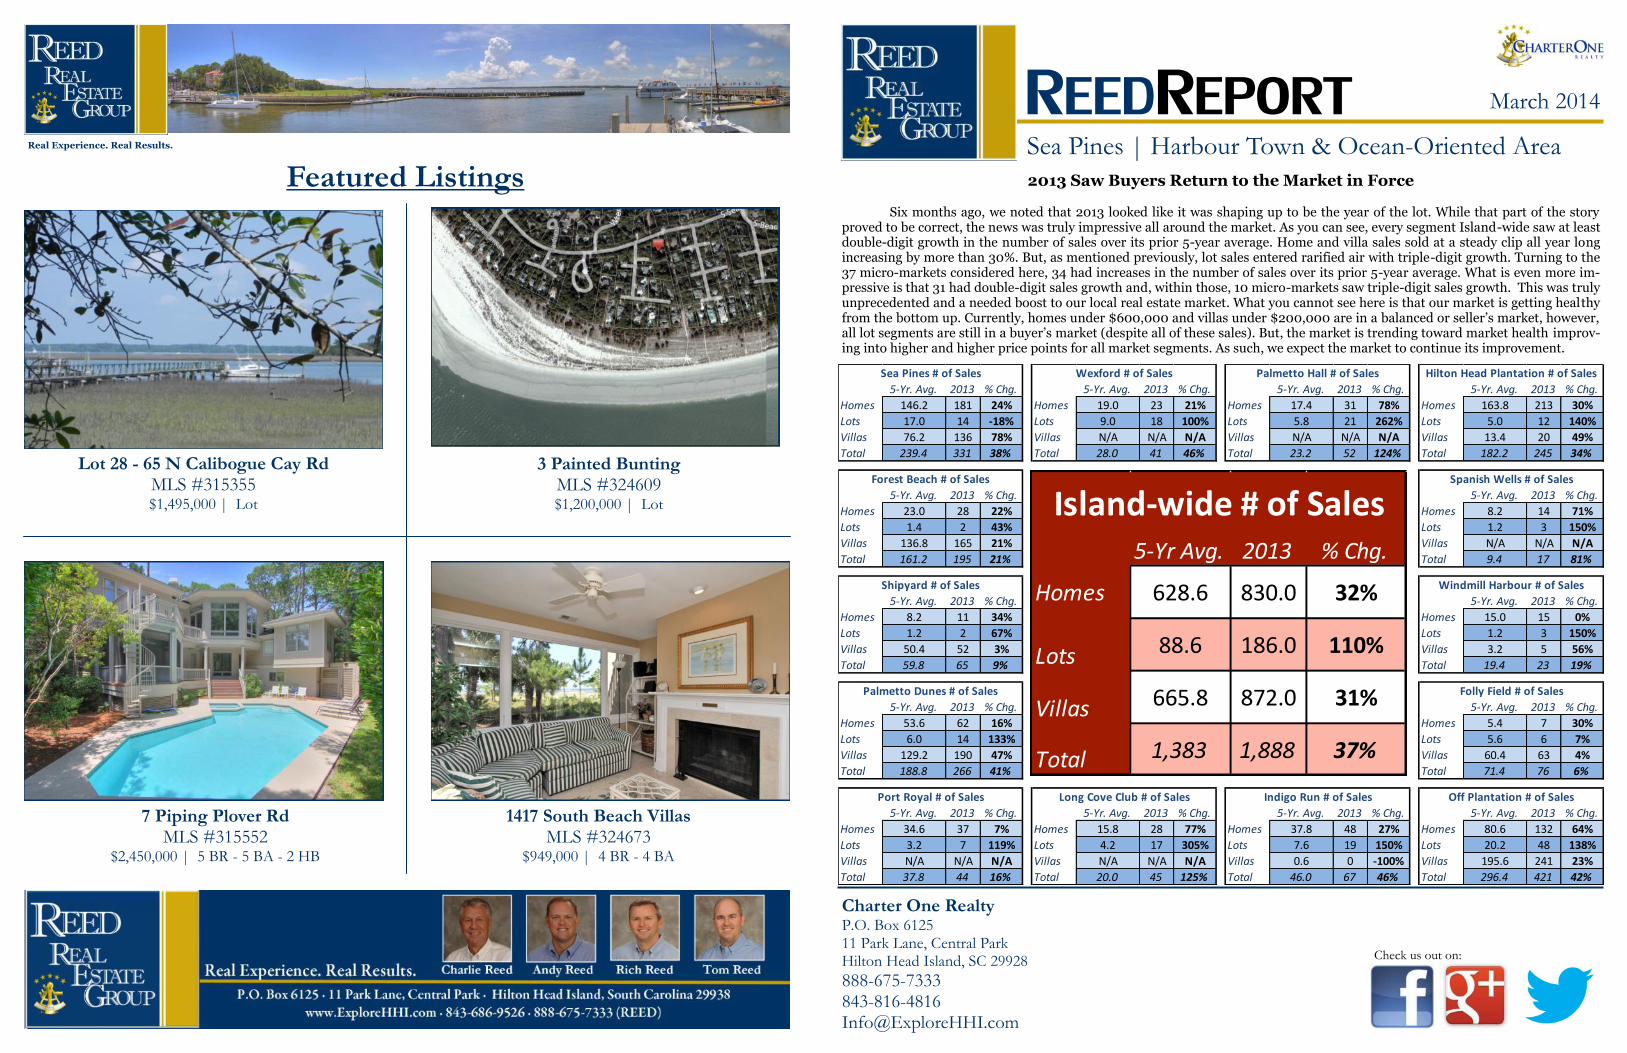
Sea Pines | Harbour Town & Ocean-Oriented Area
March 2014
Charter One Realty P.O. Box 6125 11 Park Lane, Central Park Hilton Head Island, SC 29928
888-675-7333 843-816-4816 [email protected]
REEDREPORT
Check us out on:
Real Experience. Real Results..
Lot 28 - 65 N Calibogue Cay Rd MLS #315355 $1,495,000 | Lot
3 Painted Bunting MLS #324609 $1,200,000 | Lot
Featured Listings
7 Piping Plover Rd MLS #315552
$2,450,000 | 5 BR - 5 BA - 2 HB
1417 South Beach Villas MLS #324673
$949,000 | 4 BR - 4 BA
5-Yr. Avg. 2013 % Chg. 5-Yr. Avg. 2013 % Chg. 5-Yr. Avg. 2013 % Chg. 5-Yr. Avg. 2013 % Chg.
Homes 146.2 181 24% Homes 19.0 23 21% Homes 17.4 31 78% Homes 163.8 213 30%
Lots 17.0 14 -18% Lots 9.0 18 100% Lots 5.8 21 262% Lots 5.0 12 140%
Villas 76.2 136 78% Villas N/A N/A N/A Villas N/A N/A N/A Villas 13.4 20 49%
Total 239.4 331 38% Total 28.0 41 46% Total 23.2 52 124% Total 182.2 245 34%
5-Yr. Avg. 2013 % Chg. 5-Yr. Avg. 2013 % Chg.
Homes 23.0 28 22% Homes 8.2 14 71%
Lots 1.4 2 43% Lots 1.2 3 150%
Villas 136.8 165 21% Villas N/A N/A N/A
Total 161.2 195 21% Total 9.4 17 81%
5-Yr. Avg. 2013 % Chg. 5-Yr. Avg. 2013 % Chg.
Homes 8.2 11 34% Homes 15.0 15 0%
Lots 1.2 2 67% Lots 1.2 3 150%
Villas 50.4 52 3% Villas 3.2 5 56%
Total 59.8 65 9% Total 19.4 23 19%
5-Yr. Avg. 2013 % Chg. 5-Yr. Avg. 2013 % Chg.
Homes 53.6 62 16% Homes 5.4 7 30%
Lots 6.0 14 133% Lots 5.6 6 7%
Villas 129.2 190 47% Villas 60.4 63 4%
Total 188.8 266 41% Total 71.4 76 6%
5-Yr. Avg. 2013 % Chg. 5-Yr. Avg. 2013 % Chg. 5-Yr. Avg. 2013 % Chg. 5-Yr. Avg. 2013 % Chg.
Homes 34.6 37 7% Homes 15.8 28 77% Homes 37.8 48 27% Homes 80.6 132 64%
Lots 3.2 7 119% Lots 4.2 17 305% Lots 7.6 19 150% Lots 20.2 48 138%
Villas N/A N/A N/A Villas N/A N/A N/A Villas 0.6 0 -100% Villas 195.6 241 23%
Total 37.8 44 16% Total 20.0 45 125% Total 46.0 67 46% Total 296.4 421 42%
Sea Pines # of Sales
Forest Beach # of Sales
Port Royal # of Sales
Wexford # of Sales
Indigo Run # of SalesLong Cove Club # of Sales
Palmetto Hall # of Sales Hilton Head Plantation # of Sales
Windmill Harbour # of Sales
Off Plantation # of Sales
Spanish Wells # of Sales
Folly Field # of Sales
Shipyard # of Sales
Palmetto Dunes # of Sales
5-Yr Avg. 2013 % Chg.
Homes 628.6 830.0 32%
Lots 88.6 186.0 110%
Villas 665.8 872.0 31%
Total 1,383 1,888 37%
Island-wide # of Sales
2013 Saw Buyers Return to the Market in Force Six months ago, we noted that 2013 looked like it was shaping up to be the year of the lot. While that part of the story proved to be correct, the news was truly impressive all around the market. As you can see, every segment Island-wide saw at least double-digit growth in the number of sales over its prior 5-year average. Home and villa sales sold at a steady clip all year long increasing by more than 30%. But, as mentioned previously, lot sales entered rarified air with triple-digit growth. Turning to the 37 micro-markets considered here, 34 had increases in the number of sales over its prior 5-year average. What is even more im-pressive is that 31 had double-digit sales growth and, within those, 10 micro-markets saw triple-digit sales growth. This was truly unprecedented and a needed boost to our local real estate market. What you cannot see here is that our market is getting healthy from the bottom up. Currently, homes under $600,000 and villas under $200,000 are in a balanced or seller’s market, however, all lot segments are still in a buyer’s market (despite all of these sales). But, the market is trending toward market health improv-ing into higher and higher price points for all market segments. As such, we expect the market to continue its improvement.
Real Experience. Real Results.. Real Experience. Real Results..
Charter One Realty | P.O. Box 6125 | 11 Park Lane, Central Park | Hilton Head Island, SC 29928
www.ExploreHHI.com | 888-675-7333 | 843-816-4816 | [email protected]
Charter One Realty | P.O. Box 6125 | 11 Park Lane, Central Park | Hilton Head Island, SC 29928
www.ExploreHHI.com | 888-675-7333 | 843-816-4816 | [email protected]
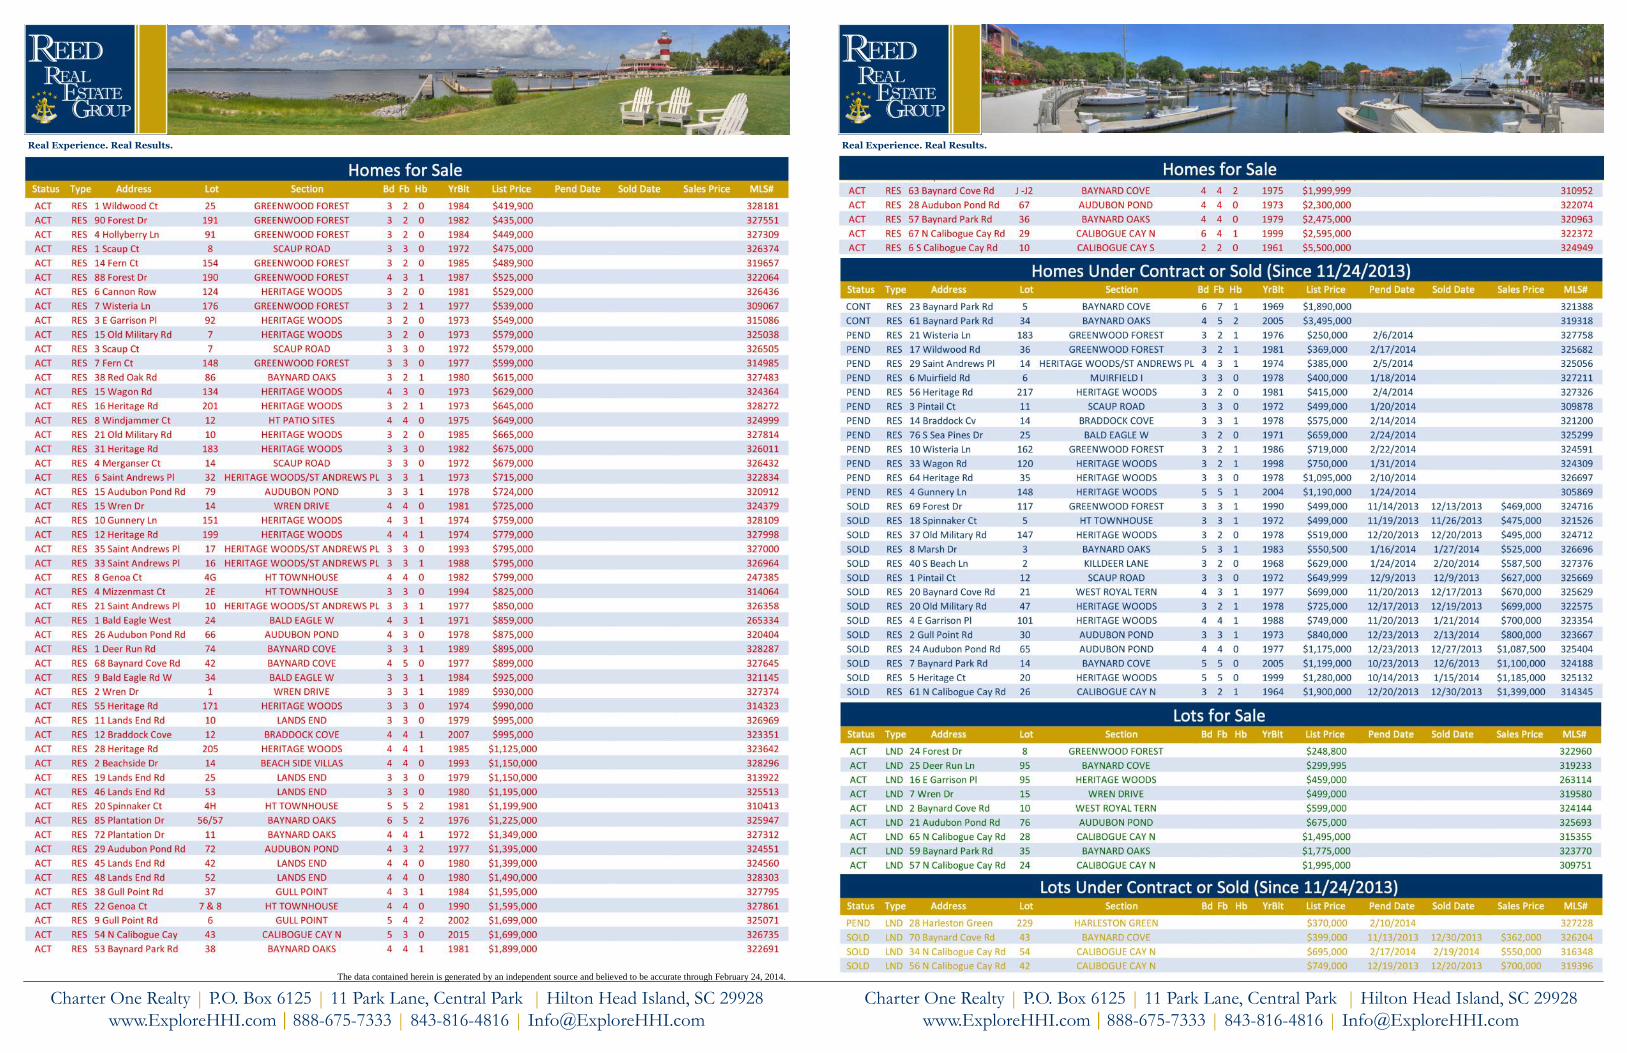
The data contained herein is generated by an independent source and believed to be accurate through February 24, 2014.
■ Homes For Sale ■ Homes Under Contract or Sold ■ Lots For Sale ■ Lots Under Contract or Sold