Embed Size (px)
Citation preview
Results for Q1/2015 May 7, 2015
7.5.2015 2
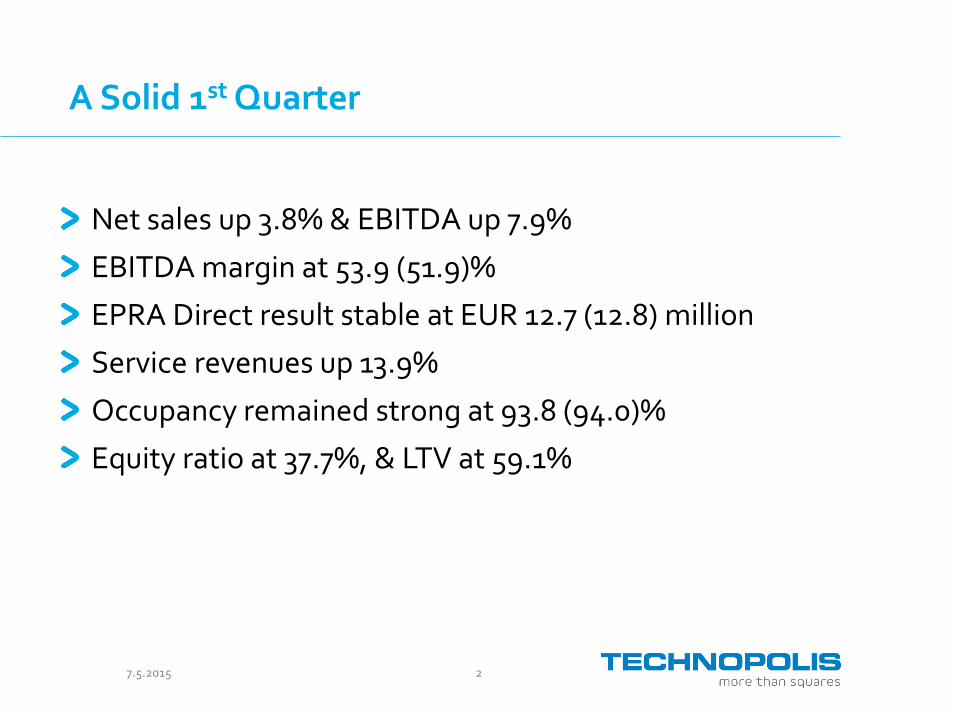
A Solid 1st Quarter
Net sales up 3.8% & EBITDA up 7.9%
EBITDA margin at 53.9 (51.9)%
EPRA Direct result stable at EUR 12.7 (12.8) million
Service revenues up 13.9%
Occupancy remained strong at 93.8 (94.0)%
Equity ratio at 37.7%, & LTV at 59.1%
7.5.2015 3
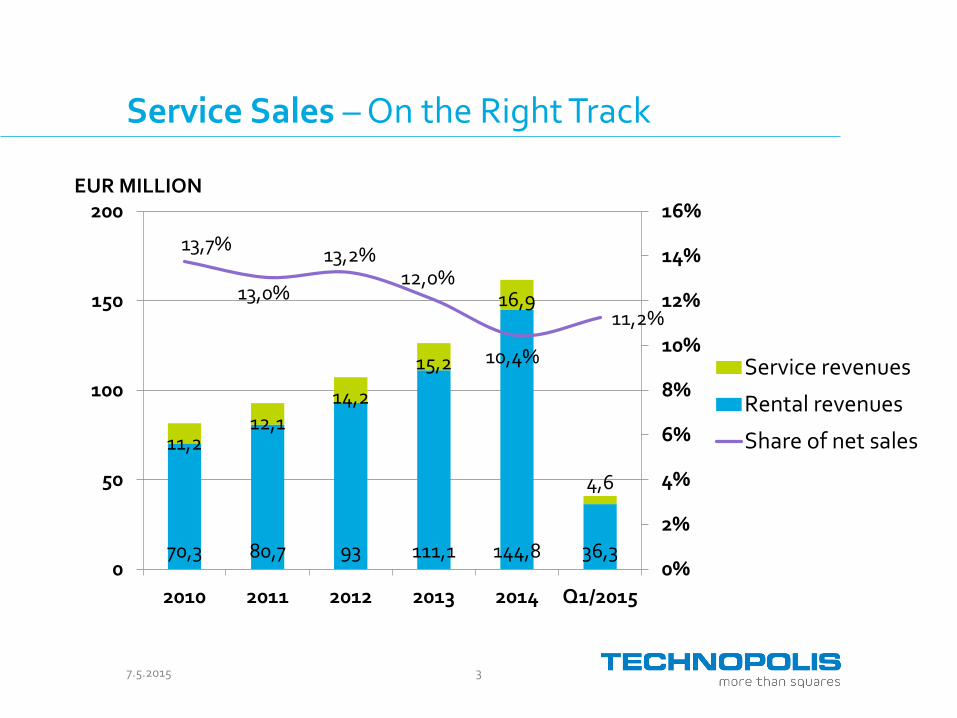
Service Sales – On the Right Track
70,3 80,7 93 111,1 144,8 36,3
11,2 12,1
14,2
15,2
16,9
4,6
13,7%
13,0%
13,2% 12,0%
10,4%
11,2%
0%
2%
4%
6%
8%
10%
12%
14%
16%
0
50
100
150
200
2010 2011 2012 2013 2014 Q1/2015
Service revenues
Rental revenues
Share of net sales
EUR MILLION
7.5.2015 4
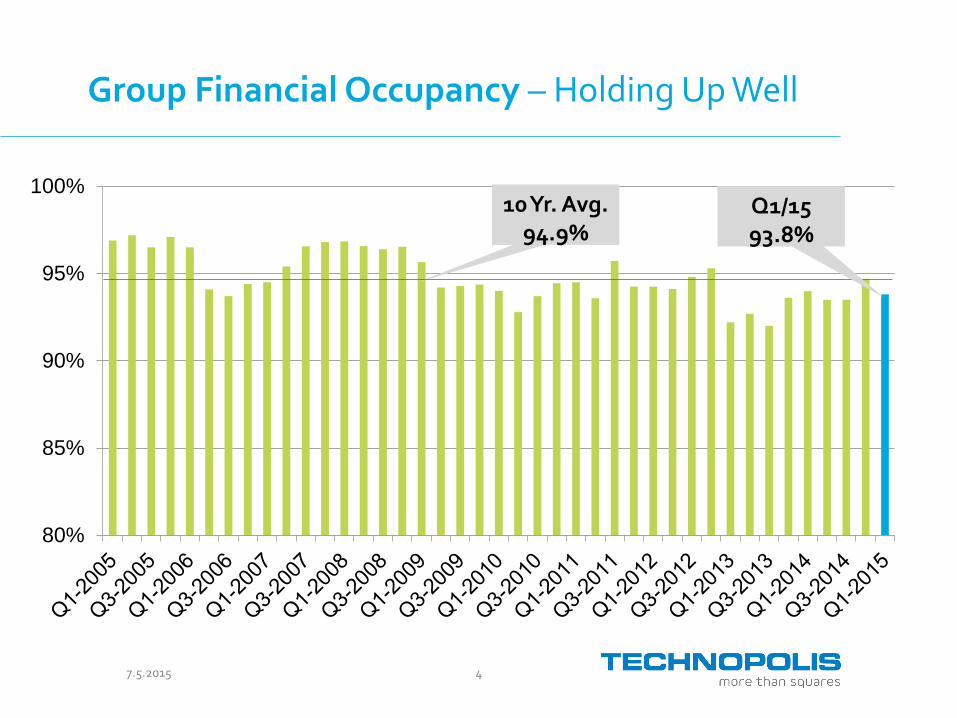
Group Financial Occupancy – Holding Up Well
80%
85%
90%
95%
100%10 Yr. Avg.
94.9% Q1/15 93.8%
7.5.2015 5
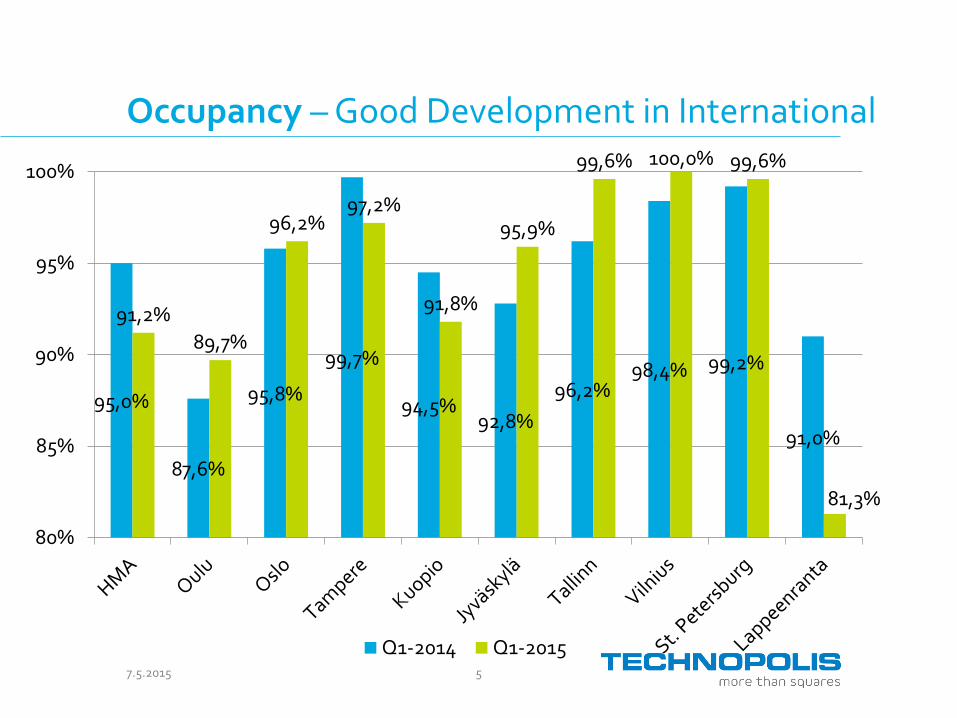
Occupancy – Good Development in International
95,0%
87,6%
95,8%
99,7%
94,5% 92,8%
96,2% 98,4% 99,2%
91,0%
91,2%
89,7%
96,2% 97,2%
91,8%
95,9%
99,6% 100,0% 99,6%
81,3%
80%
85%
90%
95%
100%
Q1-2014 Q1-2015
7.5.2015 6
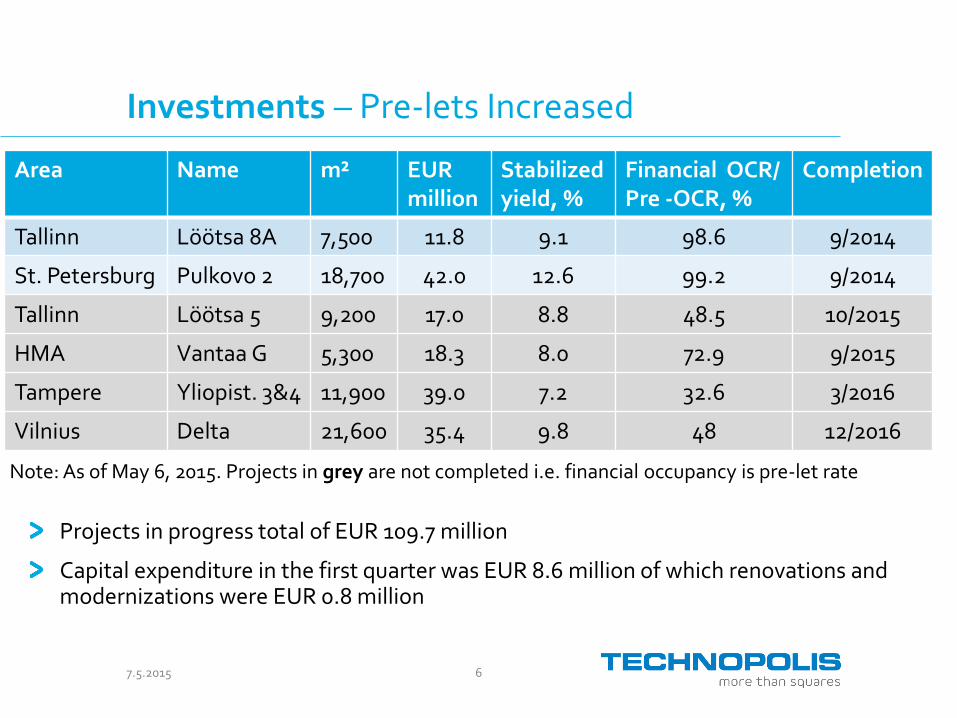
Area Name m² EUR million
Stabilized yield, %
Financial OCR/ Pre -OCR, %
Completion
Tallinn Löötsa 8A 7,500 11.8 9.1 98.6 9/2014
St. Petersburg Pulkovo 2 18,700 42.0 12.6 99.2 9/2014
Tallinn Löötsa 5 9,200 17.0 8.8 48.5 10/2015
HMA Vantaa G 5,300 18.3 8.0 72.9 9/2015
Tampere Yliopist. 3&4 11,900 39.0 7.2 32.6 3/2016
Vilnius Delta 21,600 35.4 9.8 48 12/2016
Investments – Pre-lets Increased
Projects in progress total of EUR 109.7 million
Capital expenditure in the first quarter was EUR 8.6 million of which renovations and modernizations were EUR 0.8 million
Note: As of May 6, 2015. Projects in grey are not completed i.e. financial occupancy is pre-let rate
7 7.5.2015
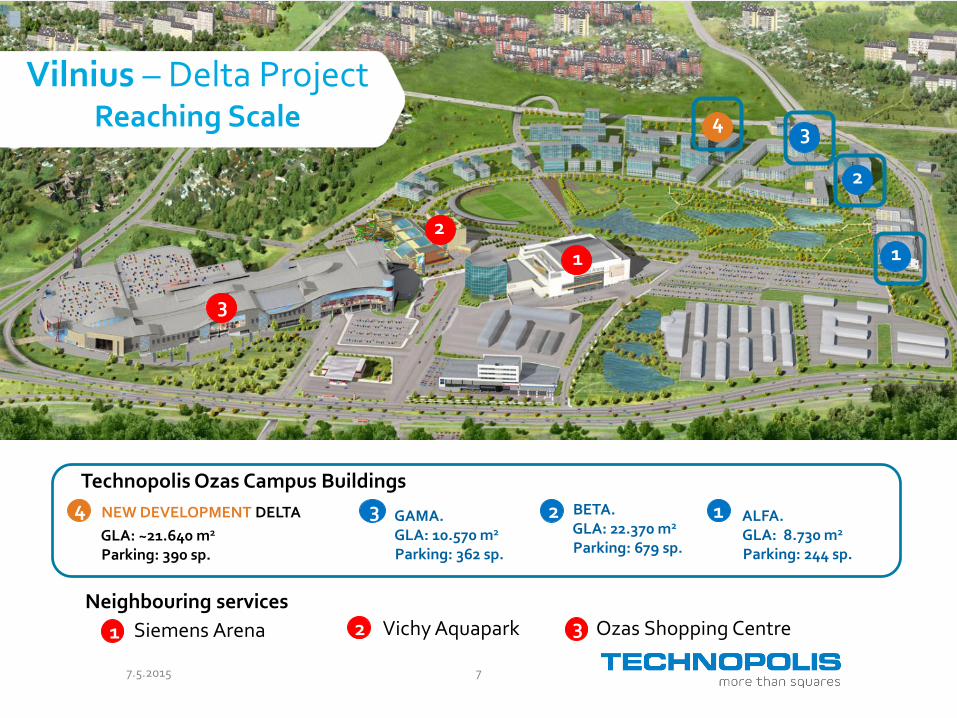
ALFA. GLA: 8.730 m2
Parking: 244 sp.
BETA. GLA: 22.370 m2
Parking: 679 sp.
GAMA. GLA: 10.570 m2
Parking: 362 sp.
NEW DEVELOPMENT DELTA
GLA: ~21.640 m2 Parking: 390 sp.
1 2 3 4
Neighbouring services
1 3 2
1
2
3 4
1
3
2
Siemens Arena Vichy Aquapark Ozas Shopping Centre
Vilnius – Delta Project Reaching Scale
Technopolis Ozas Campus Buildings
8 7.5.2015
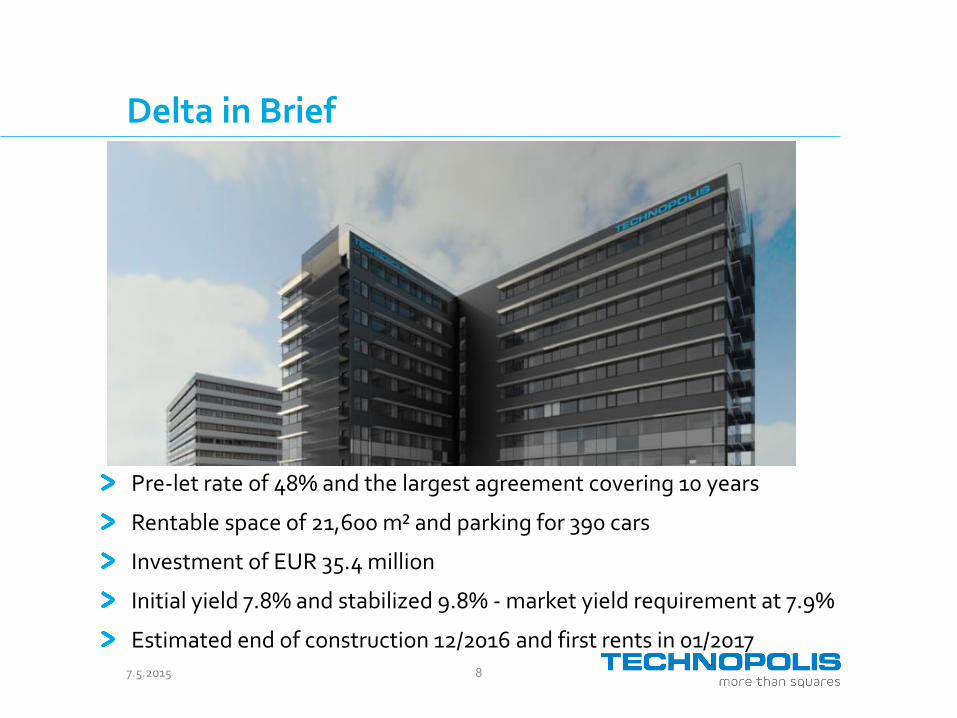
Delta in Brief
Pre-let rate of 48% and the largest agreement covering 10 years
Rentable space of 21,600 m² and parking for 390 cars
Investment of EUR 35.4 million
Initial yield 7.8% and stabilized 9.8% - market yield requirement at 7.9%
Estimated end of construction 12/2016 and first rents in 01/2017
7.5.2015 9
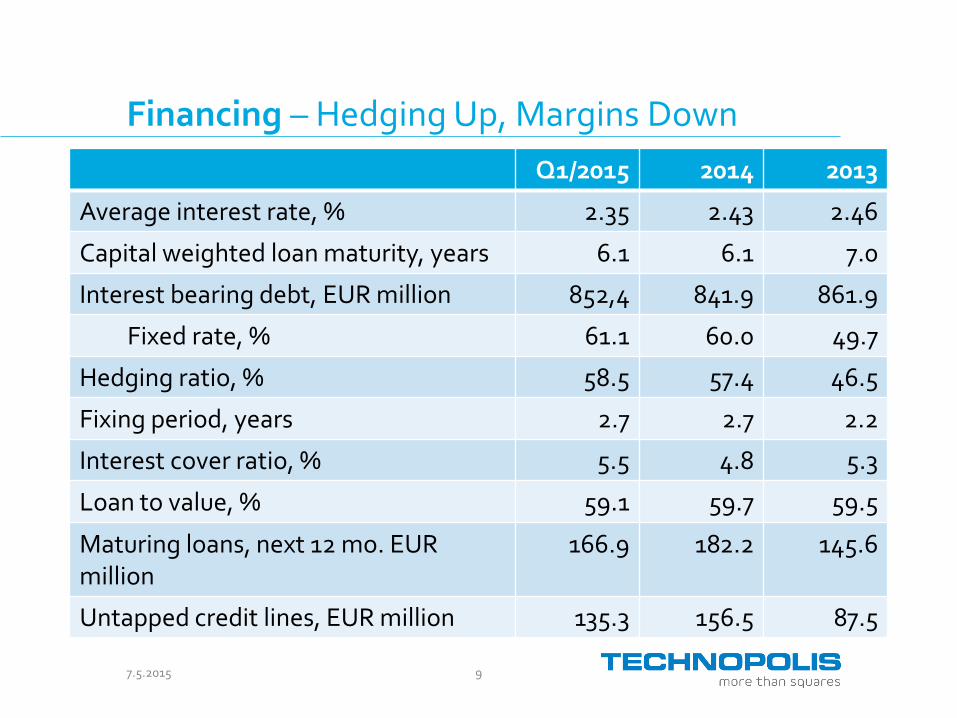
Financing – Hedging Up, Margins Down
Q1/2015 2014 2013
Average interest rate, % 2.35 2.43 2.46
Capital weighted loan maturity, years 6.1 6.1 7.0
Interest bearing debt, EUR million 852,4 841.9 861.9
Fixed rate, % 61.1 60.0 49.7
Hedging ratio, % 58.5 57.4 46.5
Fixing period, years 2.7 2.7 2.2
Interest cover ratio, % 5.5 4.8 5.3
Loan to value, % 59.1 59.7 59.5
Maturing loans, next 12 mo. EUR million
166.9 182.2 145.6
Untapped credit lines, EUR million 135.3 156.5 87.5
7.5.2015 10
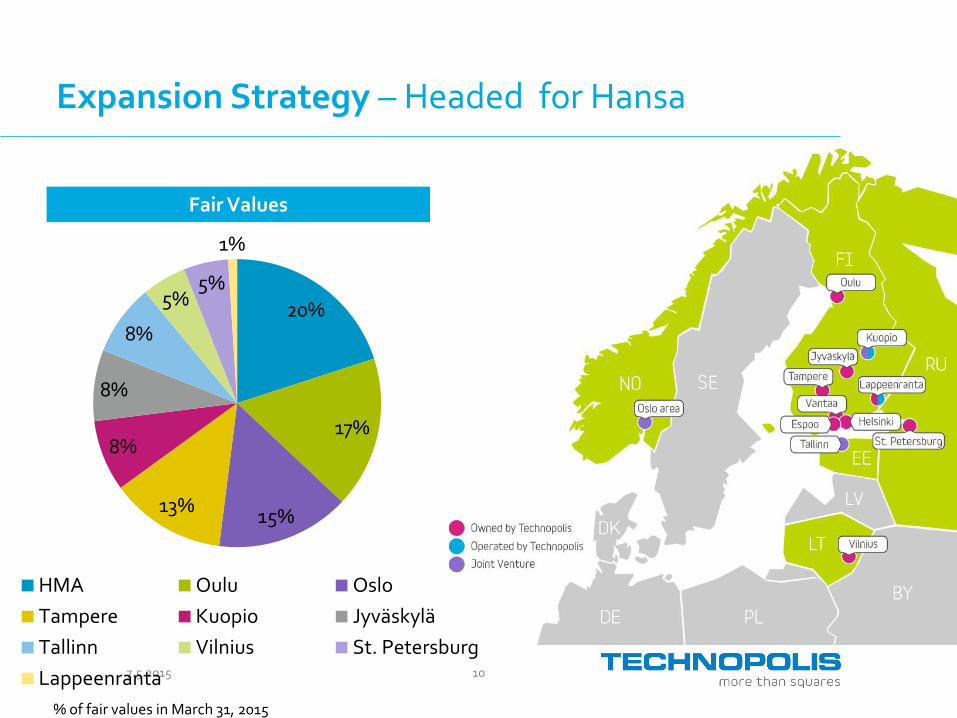
Expansion Strategy – Headed for Hansa
Fair Values
20%
17%
15% 13%
8%
8%
8%
5% 5%
1%
HMA Oulu Oslo
Tampere Kuopio Jyväskylä
Tallinn Vilnius St. Petersburg
Lappeenranta
% of fair values in March 31, 2015
7.5.2015 11
Looking Ahead – Stable Outlook
2015 growth guidance y/y:
Net sales and EBITDA to be at the same level or slightly higher than in 2014
Guidance is subject to foreign exchange changes, acquisitions and divestitures

Appendices: Additional Data
7.5.2015 13
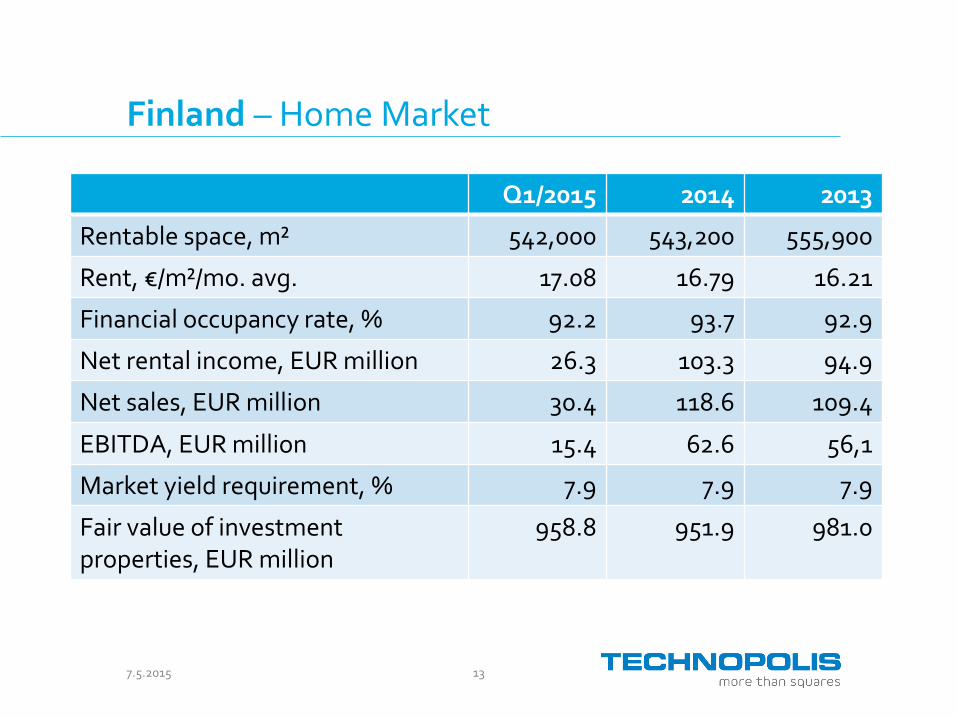
Finland – Home Market
Q1/2015 2014 2013
Rentable space, m² 542,000 543,200 555,900
Rent, €/m²/mo. avg. 17.08 16.79 16.21
Financial occupancy rate, % 92.2 93.7 92.9
Net rental income, EUR million 26.3 103.3 94.9
Net sales, EUR million 30.4 118.6 109.4
EBITDA, EUR million 15.4 62.6 56,1
Market yield requirement, % 7.9 7.9 7.9
Fair value of investment properties, EUR million
958.8 951.9 981.0
7.5.2015 14
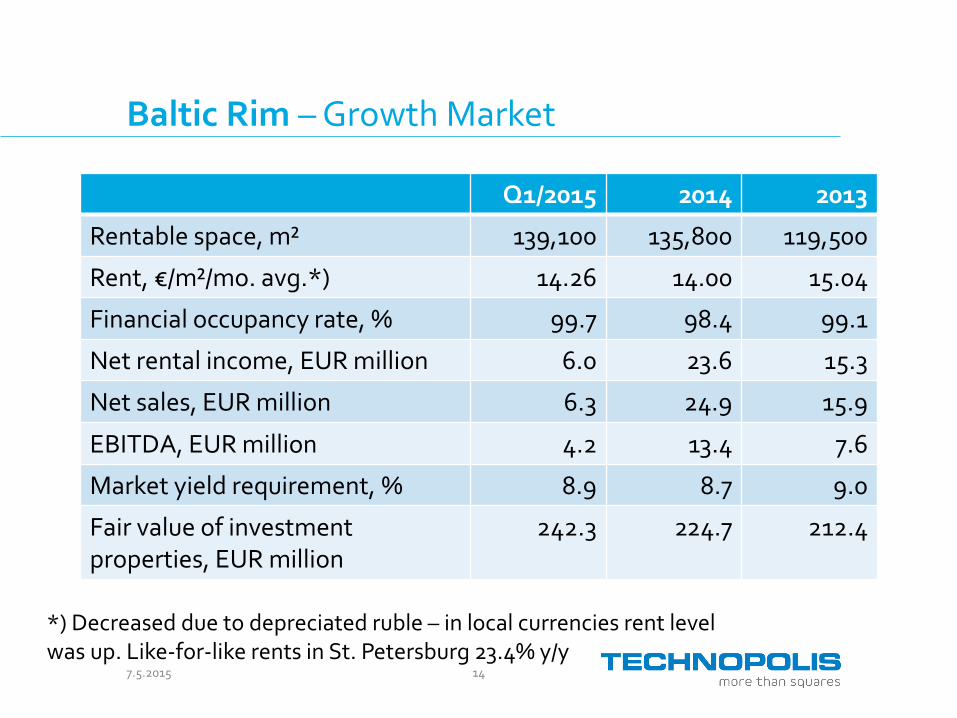
Baltic Rim – Growth Market
Q1/2015 2014 2013
Rentable space, m² 139,100 135,800 119,500
Rent, €/m²/mo. avg.*) 14.26 14.00 15.04
Financial occupancy rate, % 99.7 98.4 99.1
Net rental income, EUR million 6.0 23.6 15.3
Net sales, EUR million 6.3 24.9 15.9
EBITDA, EUR million 4.2 13.4 7.6
Market yield requirement, % 8.9 8.7 9.0
Fair value of investment properties, EUR million
242.3 224.7 212.4
*) Decreased due to depreciated ruble – in local currencies rent level was up. Like-for-like rents in St. Petersburg 23.4% y/y
7.5.2015 15
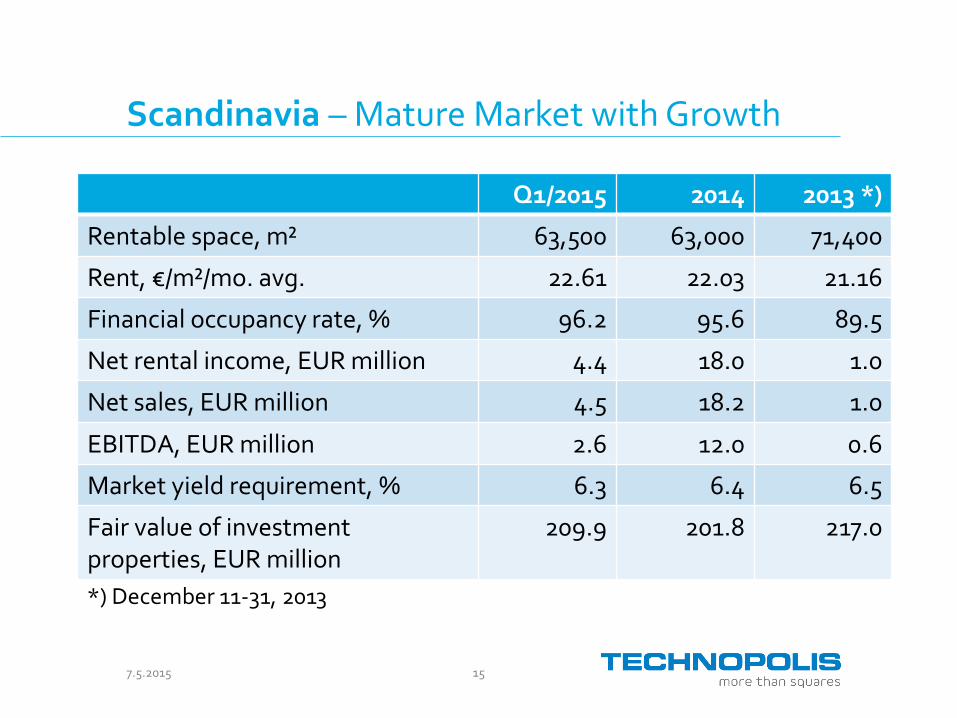
Scandinavia – Mature Market with Growth
Q1/2015 2014 2013 *)
Rentable space, m² 63,500 63,000 71,400
Rent, €/m²/mo. avg. 22.61 22.03 21.16
Financial occupancy rate, % 96.2 95.6 89.5
Net rental income, EUR million 4.4 18.0 1.0
Net sales, EUR million 4.5 18.2 1.0
EBITDA, EUR million 2.6 12.0 0.6
Market yield requirement, % 6.3 6.4 6.5
Fair value of investment properties, EUR million
209.9 201.8 217.0
*) December 11-31, 2013
7.5.2015 16
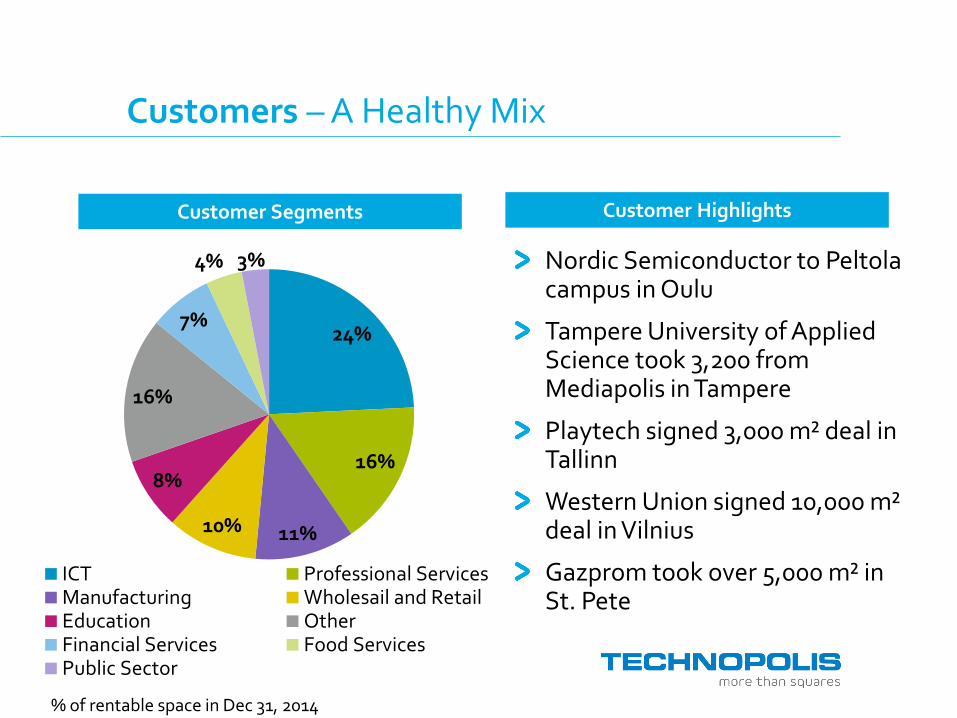
Customers – A Healthy Mix
Customer Segments
Nordic Semiconductor to Peltola campus in Oulu
Tampere University of Applied Science took 3,200 from Mediapolis in Tampere
Playtech signed 3,000 m² deal in Tallinn
Western Union signed 10,000 m² deal in Vilnius
Gazprom took over 5,000 m² in St. Pete
Customer Highlights
% of rentable space in Dec 31, 2014
24%
16%
11% 10%
8%
16%
7%
4% 3%
ICT Professional ServicesManufacturing Wholesail and RetailEducation OtherFinancial Services Food ServicesPublic Sector
7.5.2015 17
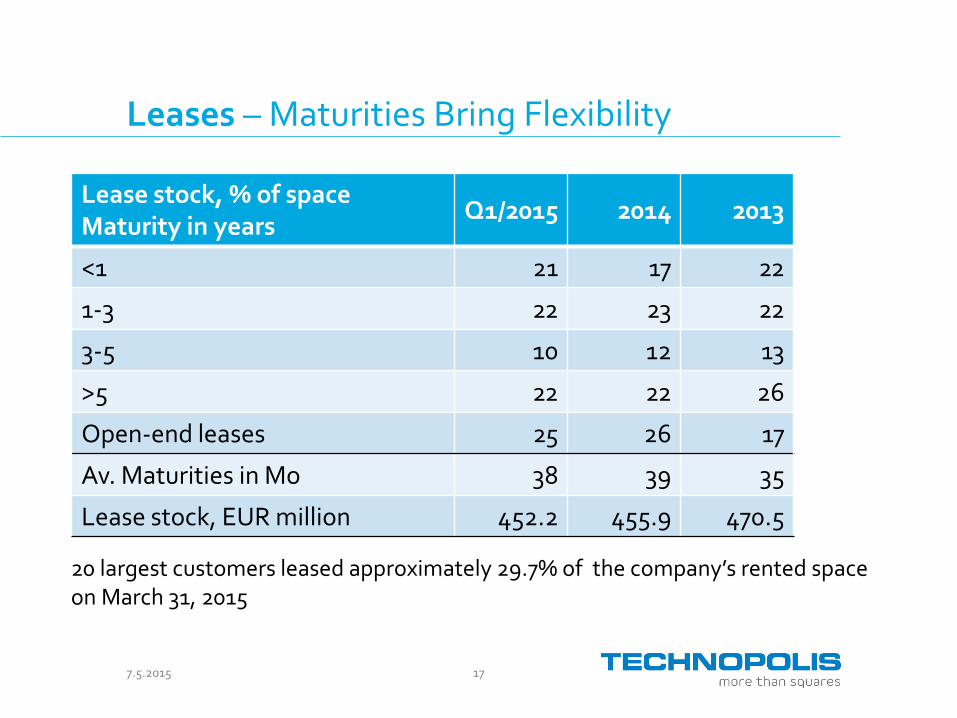
Leases – Maturities Bring Flexibility
Lease stock, % of space Maturity in years
Q1/2015 2014 2013
<1 21 17 22
1-3 22 23 22
3-5 10 12 13
>5 22 22 26
Open-end leases 25 26 17
Av. Maturities in Mo 38 39 35
Lease stock, EUR million 452.2 455.9 470.5
20 largest customers leased approximately 29.7% of the company’s rented space on March 31, 2015
7.5.2015 18
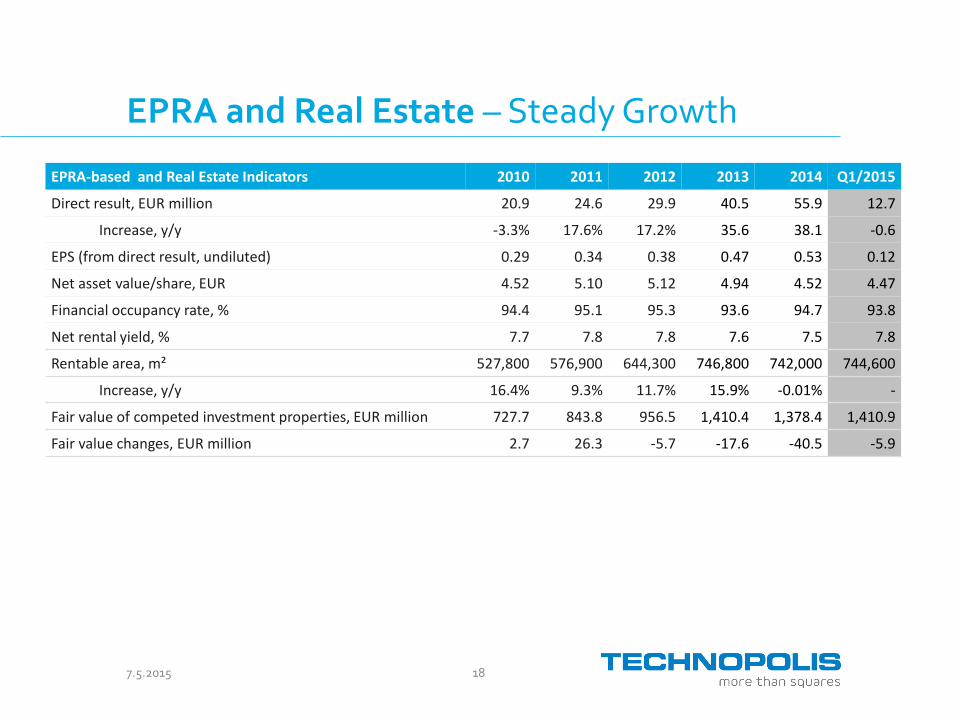
EPRA and Real Estate – Steady Growth
EPRA-based and Real Estate Indicators 2010 2011 2012 2013 2014 Q1/2015
Direct result, EUR million 20.9 24.6 29.9 40.5 55.9 12.7
Increase, y/y -3.3% 17.6% 17.2% 35.6 38.1 -0.6
EPS (from direct result, undiluted) 0.29 0.34 0.38 0.47 0.53 0.12
Net asset value/share, EUR 4.52 5.10 5.12 4.94 4.52 4.47
Financial occupancy rate, % 94.4 95.1 95.3 93.6 94.7 93.8
Net rental yield, % 7.7 7.8 7.8 7.6 7.5 7.8
Rentable area, m² 527,800 576,900 644,300 746,800 742,000 744,600
Increase, y/y 16.4% 9.3% 11.7% 15.9% -0.01% -
Fair value of competed investment properties, EUR million 727.7 843.8 956.5 1,410.4 1,378.4 1,410.9
Fair value changes, EUR million 2.7 26.3 -5.7 -17.6 -40.5 -5.9
7.5.2015 19
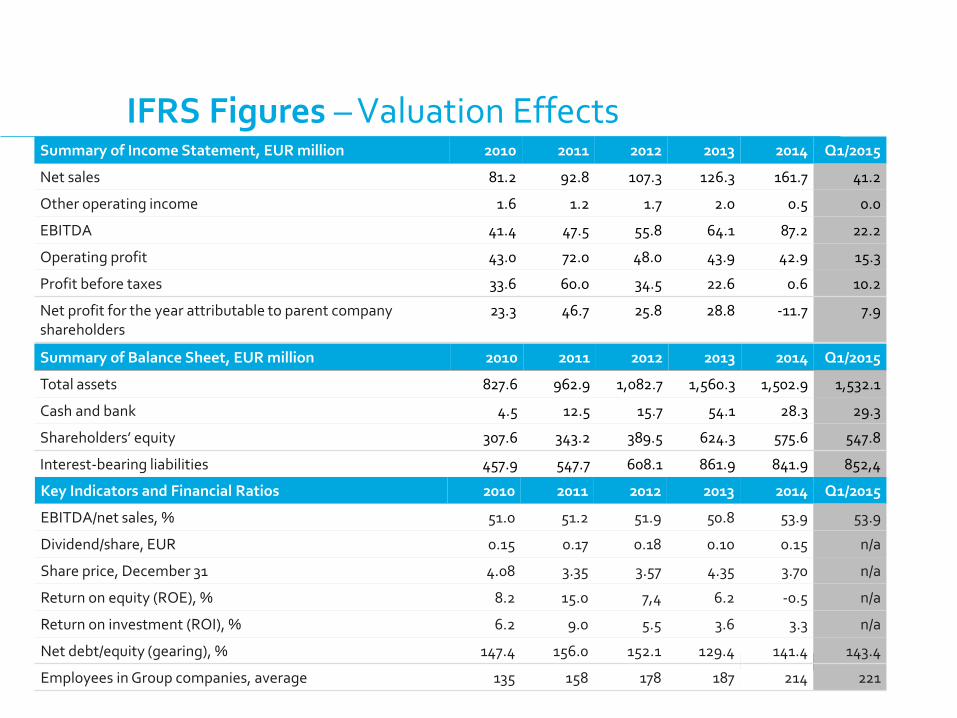
IFRS Figures – Valuation Effects Summary of Income Statement, EUR million 2010 2011 2012 2013 2014 Q1/2015
Net sales 81.2 92.8 107.3 126.3 161.7 41.2
Other operating income 1.6 1.2 1.7 2.0 0.5 0.0
EBITDA 41.4 47.5 55.8 64.1 87.2 22.2
Operating profit 43.0 72.0 48.0 43.9 42.9 15.3
Profit before taxes 33.6 60.0 34.5 22.6 0.6 10.2
Net profit for the year attributable to parent company shareholders
23.3 46.7 25.8 28.8 -11.7 7.9
Summary of Balance Sheet, EUR million 2010 2011 2012 2013 2014 Q1/2015
Total assets 827.6 962.9 1,082.7 1,560.3 1,502.9 1,532.1
Cash and bank 4.5 12.5 15.7 54.1 28.3 29.3
Shareholders’ equity 307.6 343.2 389.5 624.3 575.6 547.8
Interest-bearing liabilities 457.9 547.7 608.1 861.9 841.9 852,4
Key Indicators and Financial Ratios 2010 2011 2012 2013 2014 Q1/2015
EBITDA/net sales, % 51.0 51.2 51.9 50.8 53.9 53.9
Dividend/share, EUR 0.15 0.17 0.18 0.10 0.15 n/a
Share price, December 31 4.08 3.35 3.57 4.35 3.70 n/a
Return on equity (ROE), % 8.2 15.0 7,4 6.2 -0.5 n/a
Return on investment (ROI), % 6.2 9.0 5.5 3.6 3.3 n/a
Net debt/equity (gearing), % 147.4 156.0 152.1 129.4 141.4 143.4
Employees in Group companies, average 135 158 178 187 214 221
7.5.2015 20
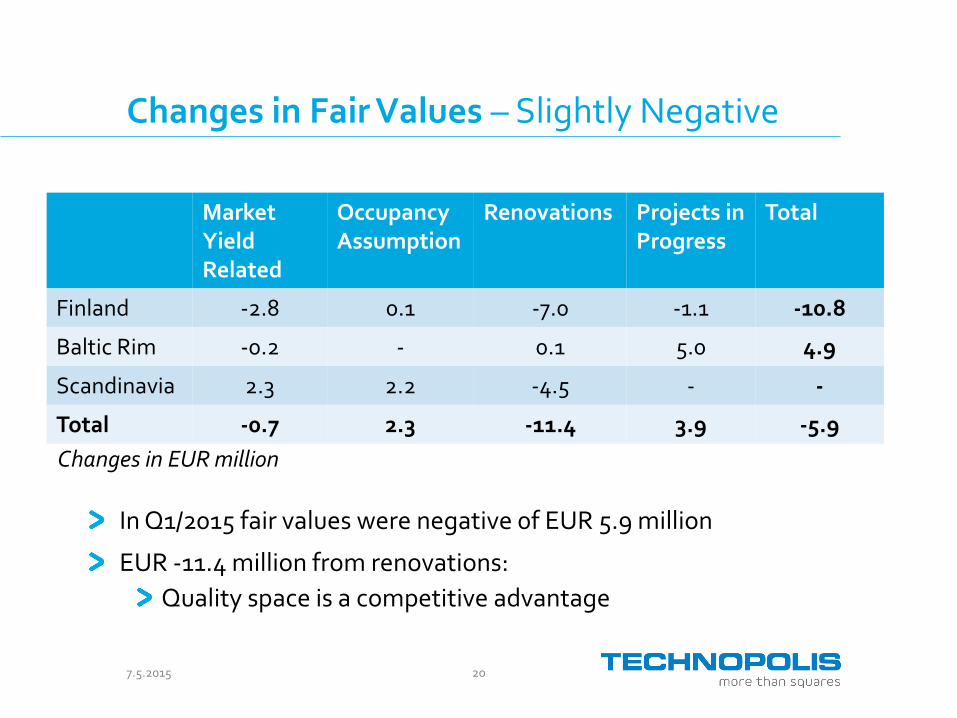
Changes in Fair Values – Slightly Negative
In Q1/2015 fair values were negative 0f EUR 5.9 million
EUR -11.4 million from renovations:
Quality space is a competitive advantage
Market Yield Related
Occupancy Assumption
Renovations Projects in Progress
Total
Finland -2.8 0.1 -7.0 -1.1 -10.8
Baltic Rim -0.2 - 0.1 5.0 4.9
Scandinavia 2.3 2.2 -4.5 - -
Total -0.7 2.3 -11.4 3.9 -5.9
Changes in EUR million
21 7.5.2015
Investment Criteria – Cash Flow Driven
Good quality, flexible buildings in good shape Excellent location with good transportation links Critical mass, at least in the 50,000 m² range Additional building rights to allow expansion Good customer mix or the potential to create it Generates good cash flow Reasonable yield generating positive EPS impact
7.5.2015 22
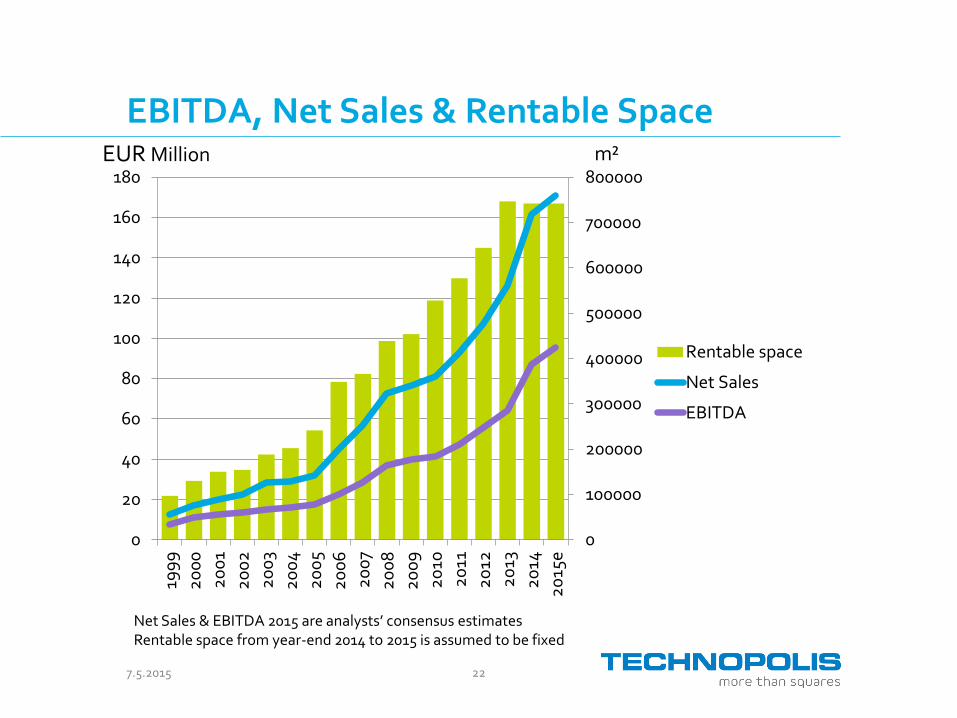
EBITDA, Net Sales & Rentable Space m² EUR Million
Net Sales & EBITDA 2015 are analysts’ consensus estimates Rentable space from year-end 2014 to 2015 is assumed to be fixed
0
100000
200000
300000
400000
500000
600000
700000
800000
0
20
40
60
80
100
120
140
160
18019
99
20
00
20
01
20
02
20
03
20
04
20
05
20
06
20
07
20
08
20
09
20
10
20
11
20
12
20
13
20
14
20
15e
Rentable space
Net Sales
EBITDA
7.5.2015 23
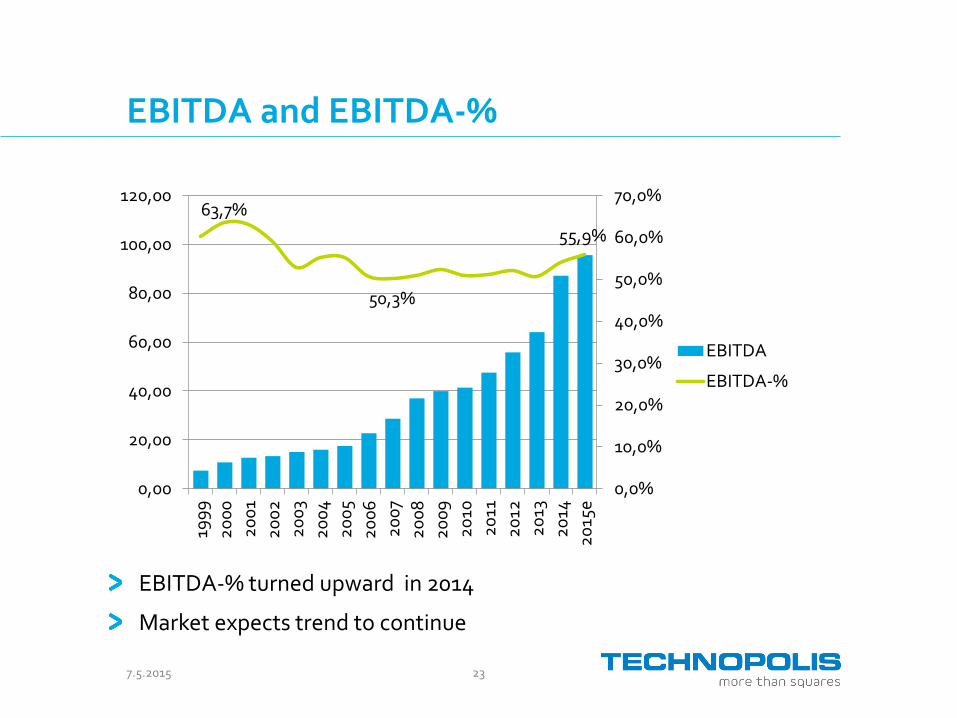
EBITDA and EBITDA-%
EBITDA-% turned upward in 2014
Market expects trend to continue
63,7%
50,3%
55,9%
0,0%
10,0%
20,0%
30,0%
40,0%
50,0%
60,0%
70,0%
0,00
20,00
40,00
60,00
80,00
100,00
120,0019
99
20
00
20
01
20
02
20
03
20
04
20
05
20
06
20
07
20
08
20
09
20
10
20
11
20
12
20
13
20
14
20
15e
EBITDA
EBITDA-%
7.5.2015 24
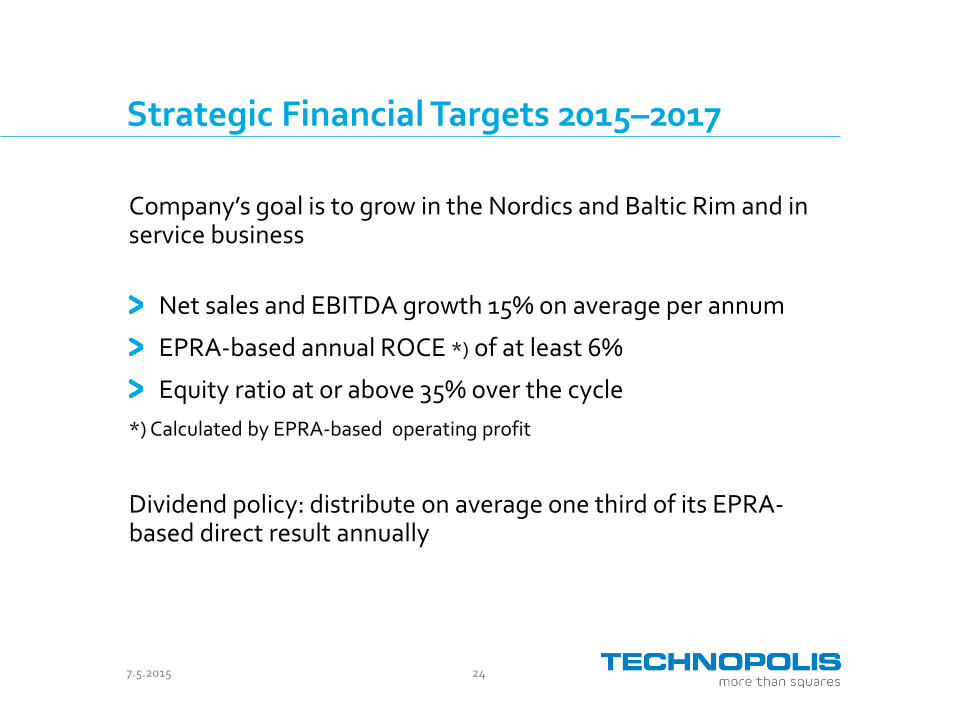
Strategic Financial Targets 2015–2017
Company’s goal is to grow in the Nordics and Baltic Rim and in service business
Net sales and EBITDA growth 15% on average per annum
EPRA-based annual ROCE *) of at least 6%
Equity ratio at or above 35% over the cycle
*) Calculated by EPRA-based operating profit
Dividend policy: distribute on average one third of its EPRA-based direct result annually
7.5.2015 25
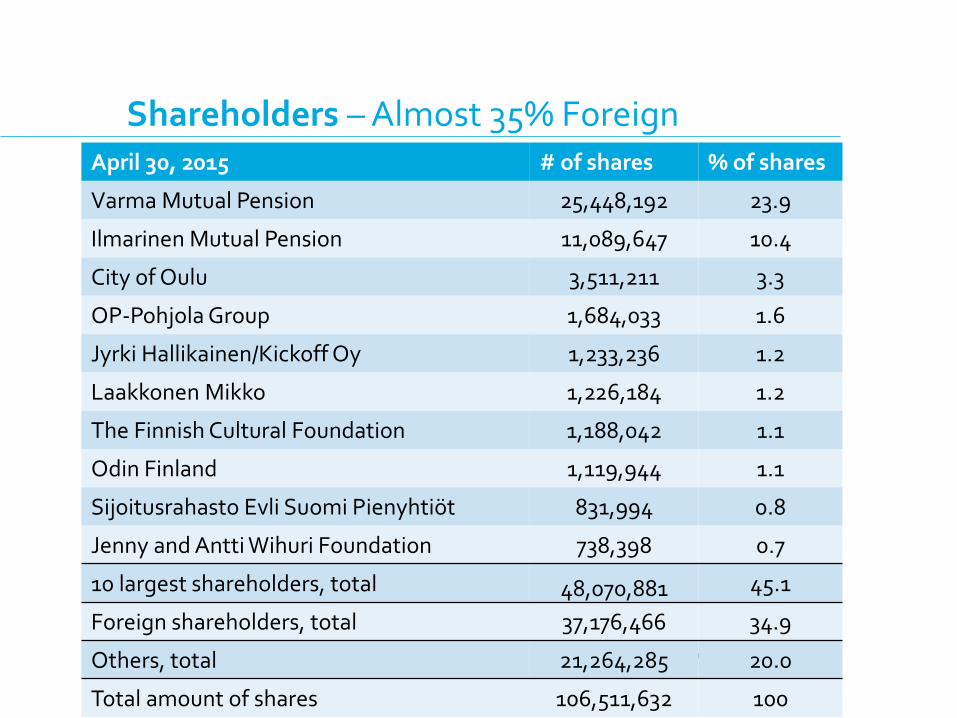
April 30, 2015 # of shares % of shares
Varma Mutual Pension 25,448,192 23.9
Ilmarinen Mutual Pension 11,089,647 10.4
City of Oulu 3,511,211 3.3
OP-Pohjola Group 1,684,033 1.6
Jyrki Hallikainen/Kickoff Oy 1,233,236 1.2
Laakkonen Mikko 1,226,184 1.2
The Finnish Cultural Foundation 1,188,042 1.1
Odin Finland 1,119,944 1.1
Sijoitusrahasto Evli Suomi Pienyhtiöt 831,994 0.8
Jenny and Antti Wihuri Foundation 738,398 0.7
10 largest shareholders, total 48,070,881 45.1
Foreign shareholders, total 37,176,466 34.9
Others, total 21,264,285 20.0
Total amount of shares 106,511,632 100
Shareholders – Almost 35% Foreign