Embed Size (px)
Citation preview
Cover Page
Free Ecommerce Business plan for Gift and handicraft
Please Visit: www.Enterslicellp.com Free Download
Requests for Investor Ready Business plan with deck and projections in excel , Business valuation , SEED / Series A funding. Please email your questions / request to the Startup support department of Enterslice Value advisors LLP at [email protected]. For product information, visit our Website: www.enterslicellp.com or call at 91-9810688728
Copyright © Enterslice, LLP., 2013-2016 All rights reserved.Noida: California

Legal Page
Confidentiality Agreement
The undersigned reader acknowledges that the information provided in this business plan is confidential; therefore, reader agrees not to disclose it without express written permission. It is acknowledged by reader that information to be furnished in this business plan is in all respects confidential in nature, other than information which is in the public domain through other means and that any disclosure or use of same by reader, may cause serious harm or damage to _______________. Upon request, this document is to be immediately returned to _______________. ____________________________ Signature ____________________________Name (typed or printed)____________________________Date This is a business plan. It does not imply an offering of securities.
Table of Contents
1.0 Executive Summary.....................................................................................................................1Chart: Highlights..........................................................................................................................1
1.1 Objectives....................................................................................................................................11.2 Mission..........................................................................................................................................21.3 Keys to Success.........................................................................................................................2
2.0 Company Summary......................................................................................................................22.1 Company Ownership...............................................................................................................22.2 Startup Summary......................................................................................................................2
Table: Startup................................................................................................................................3Chart: Startup................................................................................................................................4
2.3 Company Locations and Facilities.....................................................................................53.0 Products............................................................................................................................................5
3.1 Product Description.................................................................................................................53.2 Competitive Comparison.......................................................................................................53.3 Sales Literature.........................................................................................................................53.4 Sourcing.......................................................................................................................................53.5 Technology..................................................................................................................................53.6 Future Products.........................................................................................................................5
4.0 Market Analysis Summary........................................................................................................54.1 Market Segmentation.............................................................................................................6
Table: Market Analysis...............................................................................................................6Chart: Market Analysis (Pie)....................................................................................................7
4.2 Target Market Segment Strategy......................................................................................74.2.1 Market Needs.....................................................................................................................74.2.2 Market Trends....................................................................................................................74.2.3 Market Growth...................................................................................................................7
4.3 Industry Analysis.......................................................................................................................74.3.1 Industry Participants.......................................................................................................74.3.2 Distribution Patterns.......................................................................................................84.3.3 Competition and Buying Patterns..............................................................................84.3.4 Main Competitors.............................................................................................................8
5.0 Web Plan Summary......................................................................................................................85.1 Website Marketing Strategy................................................................................................85.2 Development Requirements.................................................................................................8
6.0 Strategy and Imlpementation Summary.............................................................................86.1 SWOT Analysis...........................................................................................................................9
6.1.1 Strengths..............................................................................................................................96.1.2 Weaknesses.........................................................................................................................96.1.3 Opportunities......................................................................................................................96.1.4 Threats..................................................................................................................................9
6.2 Strategy Pyramid......................................................................................................................96.3 Value Proposition......................................................................................................................96.4 Competitive Edge.....................................................................................................................96.5 Marketing Strategy..................................................................................................................9
6.5.1 Positioning Statement...................................................................................................106.5.2 Pricing Strategy...............................................................................................................10
Page 1
Table of Contents
6.5.3 Promotion Strategy........................................................................................................106.5.4 Distribution Strategy.....................................................................................................106.5.5 Marketing Programs......................................................................................................10
6.6 Sales Strategy..........................................................................................................................106.6.1 Sales Forecast..................................................................................................................10
Table: Sales Forecast............................................................................................................10Chart: Sales Monthly............................................................................................................11Chart: Sales by Year..............................................................................................................12
6.6.2 Sales Programs................................................................................................................126.7 Strategic Alliances.................................................................................................................126.8 Milestones..................................................................................................................................12
Table: Milestones.......................................................................................................................12Chart: Milestones.......................................................................................................................13
7.0 Management Summary............................................................................................................137.1 Organizational Structure.....................................................................................................13
Org. Chart: Organizational Chart........................................................................................147.2 Management Team.................................................................................................................147.3 Management Team Gaps.....................................................................................................147.4 Personnel Plan.........................................................................................................................14
Table: Personnel.........................................................................................................................148.0 Financial Plan...............................................................................................................................15
8.1 Startup Funding......................................................................................................................15Table: Startup Funding............................................................................................................15
8.2 Important Assumptions........................................................................................................168.3 Key Financial Indicators......................................................................................................16
Chart: Benchmarks....................................................................................................................178.4 Break-even Analysis...............................................................................................................18
Table: Break-even Analysis....................................................................................................18Chart: Break-even Analysis....................................................................................................18
8.5 Projected Profit and Loss.....................................................................................................19Table: Profit and Loss...............................................................................................................19Chart: Profit Monthly................................................................................................................20Chart: Profit Yearly....................................................................................................................20Chart: Gross Margin Monthly...............................................................................................21Chart: Gross Margin Yearly...................................................................................................21
8.6 Projected Cash Flow..............................................................................................................22Table: Cash Flow........................................................................................................................22Chart: Cash...................................................................................................................................23
8.7 Projected Balance Sheet......................................................................................................24Table: Balance Sheet................................................................................................................24
8.8 Business Ratios........................................................................................................................26Table: Ratios.................................................................................................................................26
8.9 The Investment Offering......................................................................................................27Table: Investment Offering.....................................................................................................27
8.10 Valuation..................................................................................................................................28Table: Investment Analysis.....................................................................................................28
Page 2
Table of Contents
8.11 Use of Funds..........................................................................................................................29Table: Use of Funds...................................................................................................................29
8.12 Payback....................................................................................................................................30Table: Payback.............................................................................................................................30Chart: Payback Period..............................................................................................................30
Table: Sales Forecast..........................................................................................................................1Table: Personnel...................................................................................................................................2Table: Profit and Loss.........................................................................................................................3Table: Cash Flow..................................................................................................................................5Table: Balance Sheet..........................................................................................................................7
Page 3
Table of Contents
Page 1

www.enterslicellp.com
1.0 Executive Summary
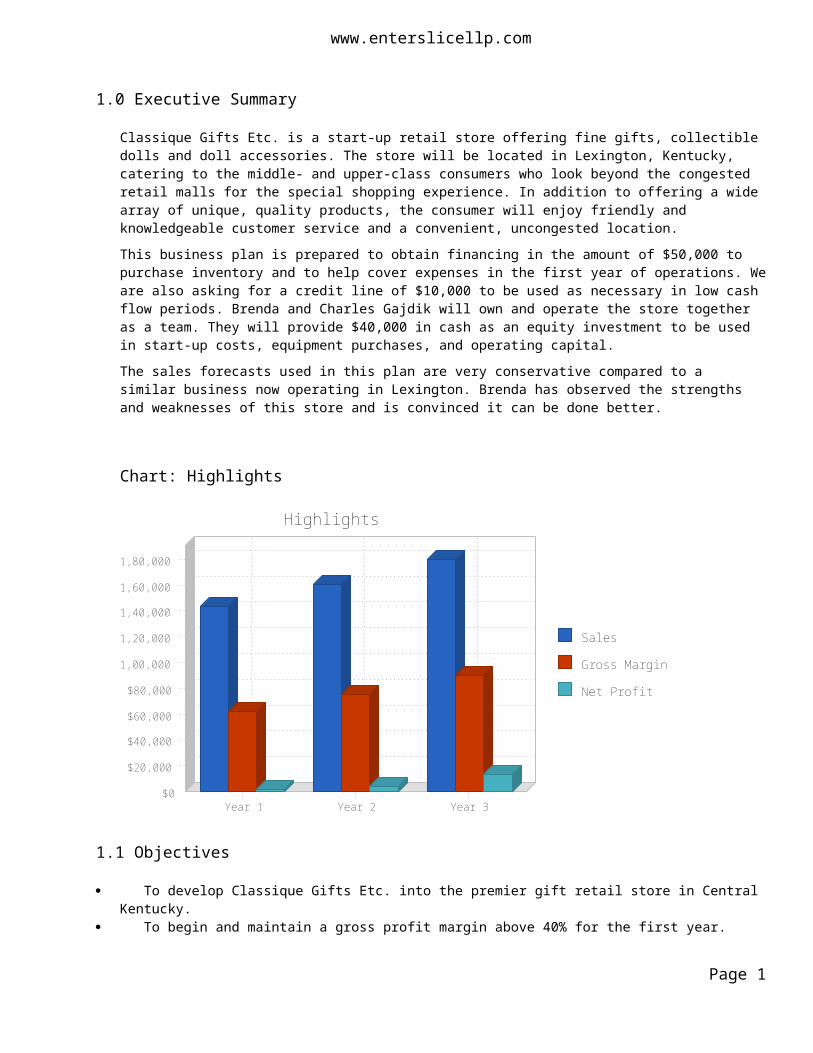
Classique Gifts Etc. is a start-up retail store offering fine gifts, collectible dolls and doll accessories. The store will be located in Lexington, Kentucky, catering to the middle- and upper-class consumers who look beyond the congested retail malls for the special shopping experience. In addition to offering a wide array of unique, quality products, the consumer will enjoy friendly and knowledgeable customer service and a convenient, uncongested location. This business plan is prepared to obtain financing in the amount of $50,000 to purchase inventory and to help cover expenses in the first year of operations. We are also asking for a credit line of $10,000 to be used as necessary in low cash flow periods. Brenda and Charles Gajdik will own and operate the store together as a team. They will provide $40,000 in cash as an equity investment to be used in start-up costs, equipment purchases, and operating capital. The sales forecasts used in this plan are very conservative compared to a similar business now operating in Lexington. Brenda has observed the strengths and weaknesses of this store and is convinced it can be done better.
Chart: Highlights
Sales
Gross Margin
Net Profit
$0
$20,000
$40,000
$60,000
$80,000
$1,00,000
$1,20,000
$1,40,000
$1,60,000
$1,80,000
Year 1 Year 2 Year 3
Highlights
1.1 Objectives
To develop Classique Gifts Etc. into the premier gift retail store in Central Kentucky. To begin and maintain a gross profit margin above 40% for the first year. To acquire a customer base of 4,000 by the end of the second year by using personal
customer service and marketing. To achieve a substantial net profit by the end of Year 3.
Page 1
www.enterslicellp.com
1.2 Mission
Classique Gifts Etc.will be a retail gift store specializing in fine gifts, collectible dolls and doll accessories. We want to provide products from quality suppliers and provide professional customer service in a friendly environment.
1.3 Keys to Success
To succeed in this business we must:
Sell products the customer desires and are of the highest quality. Provide friendly customer service. Establish excellent vendor/supplier relations that will facilitate quick shipment of orders. Advertise and promote our store immediately to take advantage of the current Christmas
shopping season. Continuously review our inventory and sales and adjust our inventory levels based on
detailed records.
2.0 Company Summary
Classique Gifts Etc. is proposed to be a sole-proprietorship company operated by Brenda and Charles Gajdik and is a newly established retail store offering unique gifts and elegant collectible dolls. Located in Lexington, Kentucky, we will cater to special consumers who are interested in finding unique items to supplement their doll collection or finding a gift that cannot be found in the national chain store in the very busy, very congested shopping mall. We intend to expand our business by carefully building a repeat customer base and provide the products and merchandise they wish to purchase. We feel it is important to offer personal customer support and services to achieve our business philosophy.
2.1 Company Ownership
Classique Gifts Etc. will begin operation as a sole-proprietorship. The company will be owned by Charles and Brenda Gajdik.
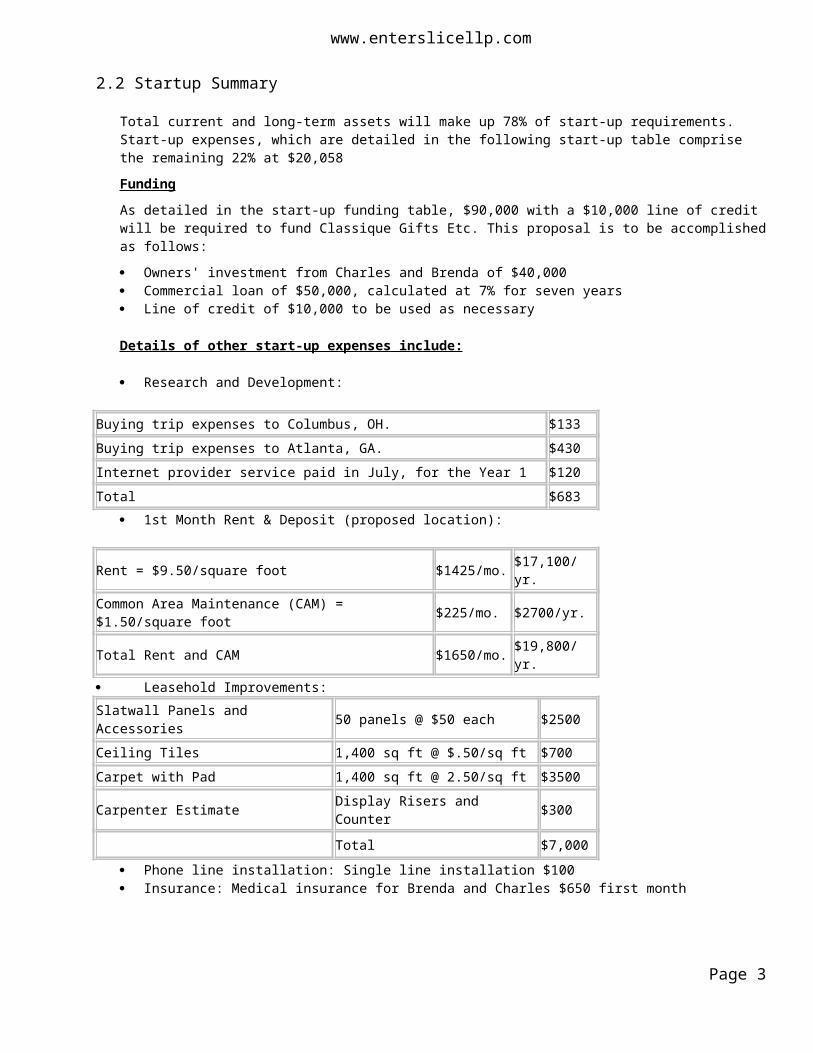
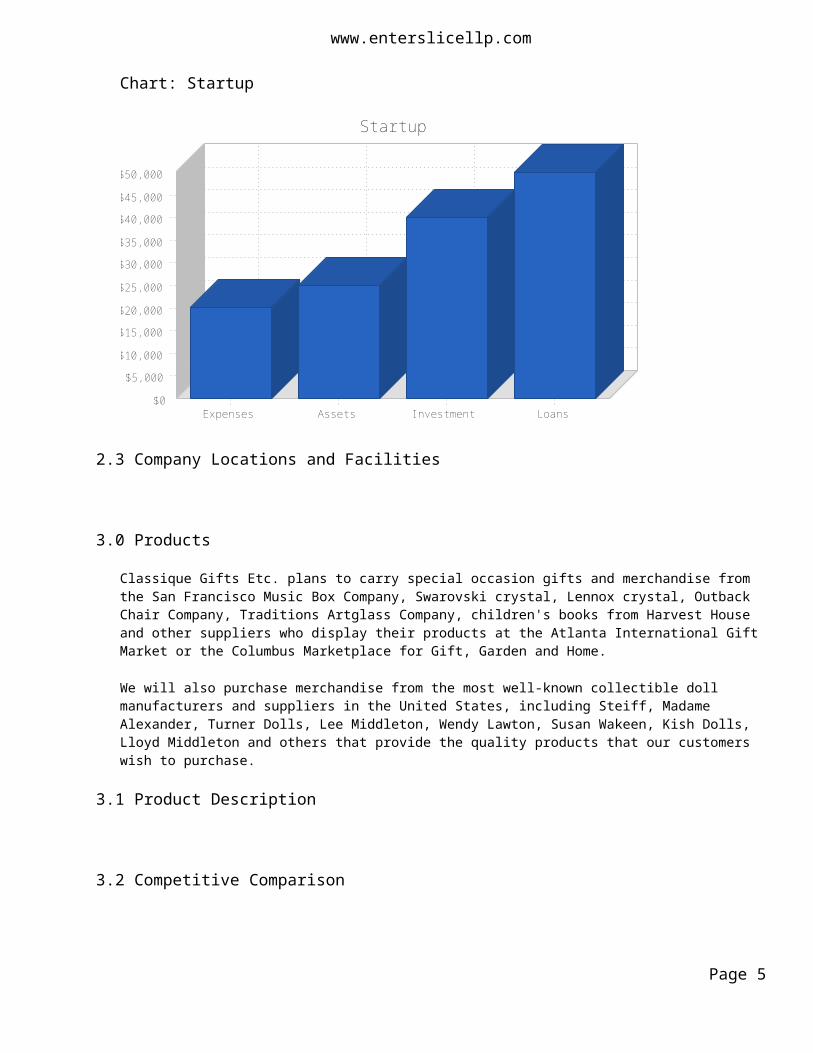
2.2 Startup Summary
Total current and long-term assets will make up 78% of start-up requirements. Start-up expenses, which are detailed in the following start-up table comprise the remaining 22% at $20,058FundingAs detailed in the start-up funding table, $90,000 with a $10,000 line of credit will be required to fund Classique Gifts Etc. This proposal is to be accomplished as follows: Owners' investment from Charles and Brenda of $40,000 Commercial loan of $50,000, calculated at 7% for seven years Line of credit of $10,000 to be used as necessary
Details of other start-up expenses include:
Research and Development:
Page 2
www.enterslicellp.com
Buying trip expenses to Columbus, OH. $133Buying trip expenses to Atlanta, GA. $430Internet provider service paid in July, for the Year 1 $120Total $683
1st Month Rent & Deposit (proposed location):
Rent = $9.50/square foot $1425/mo. $17,100/yr. Common Area Maintenance (CAM) = $1.50/square foot $225/mo. $2700/yr.
Total Rent and CAM $1650/mo. $19,800/yr. Leasehold Improvements:Slatwall Panels and Accessories 50 panels @ $50 each $2500Ceiling Tiles 1,400 sq ft @ $.50/sq ft $700Carpet with Pad 1,400 sq ft @ 2.50/sq ft $3500Carpenter Estimate Display Risers and Counter $300
Total $7,000 Phone line installation: Single line installation $100 Insurance: Medical insurance for Brenda and Charles $650 first month
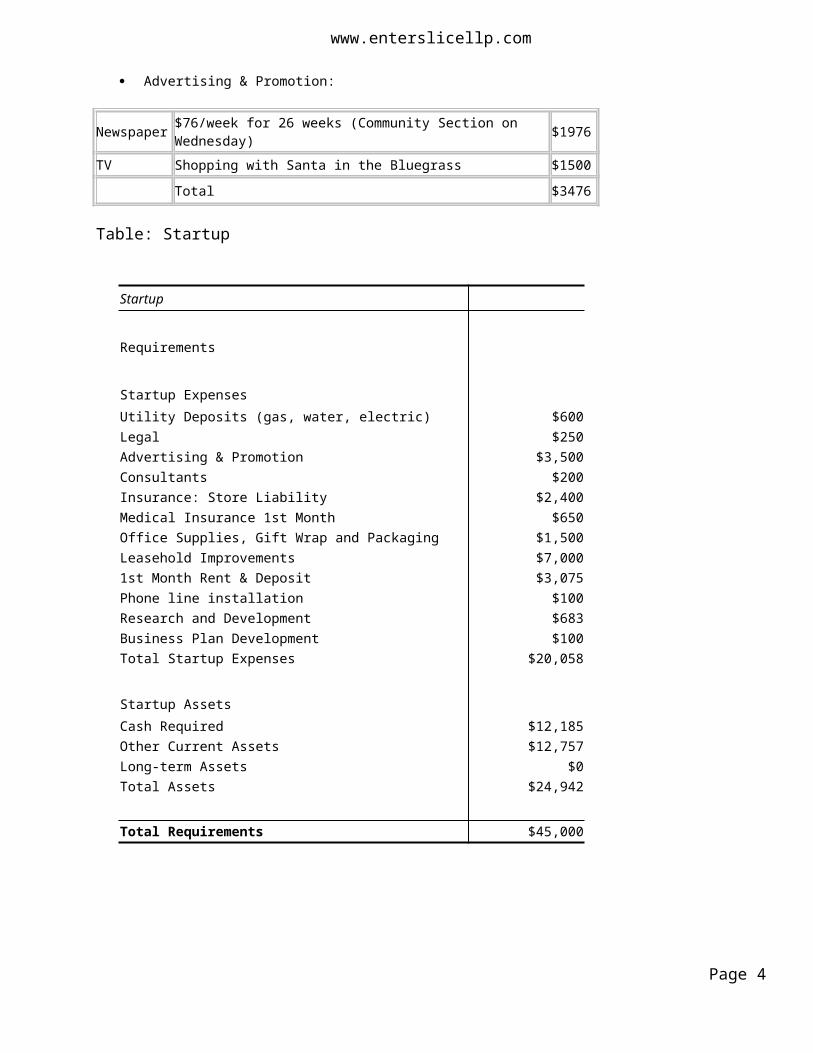
Advertising & Promotion:
Newspaper $76/week for 26 weeks (Community Section on Wednesday) $1976
TV Shopping with Santa in the Bluegrass $1500Total $3476
Table: Startup
Startup
Requirements
Startup ExpensesUtility Deposits (gas, water, electric) $600 Legal $250 Advertising & Promotion $3,500 Consultants $200 Insurance: Store Liability $2,400 Medical Insurance 1st Month $650 Office Supplies, Gift Wrap and Packaging $1,500 Leasehold Improvements $7,000 1st Month Rent & Deposit $3,075
Page 3
www.enterslicellp.com
Phone line installation $100 Research and Development $683 Business Plan Development $100 Total Startup Expenses $20,058
Startup AssetsCash Required $12,185 Other Current Assets $12,757 Long-term Assets $0 Total Assets $24,942
Total Requirements $45,000
Chart: Startup
$0
$5,000
$10,000
$15,000
$20,000
$25,000
$30,000
$35,000
$40,000
$45,000
$50,000
Expenses Assets Investment Loans
Startup
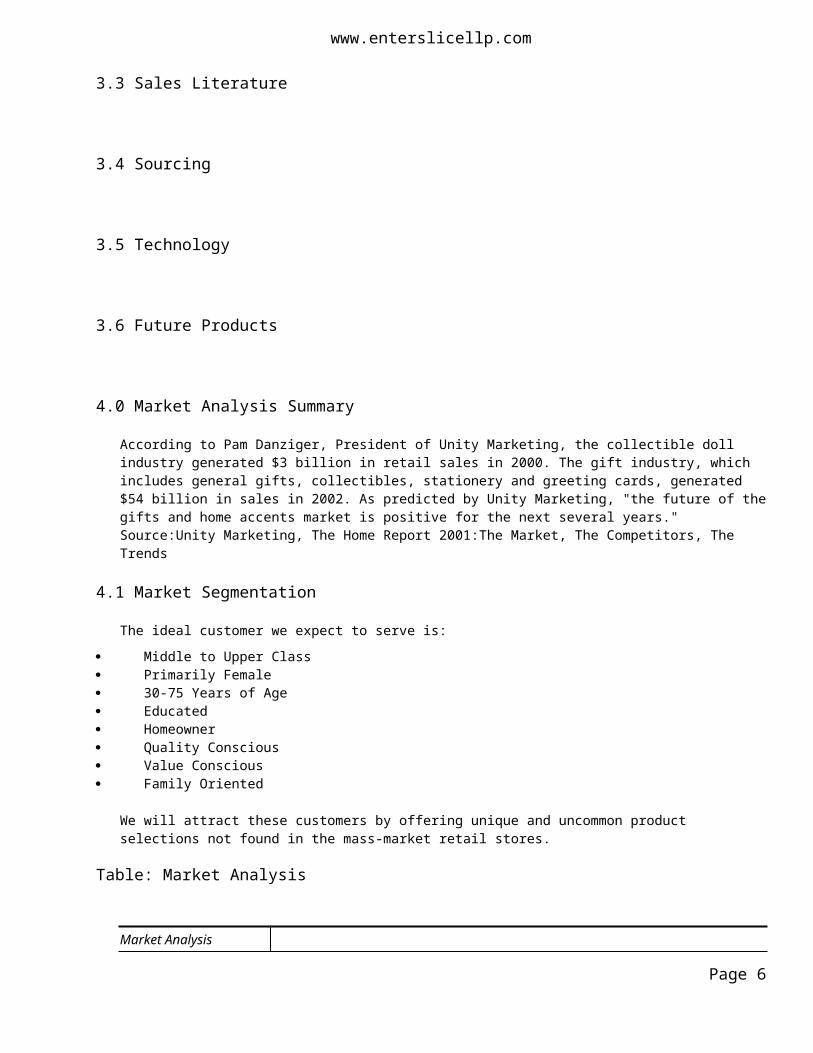
2.3 Company Locations and Facilities
3.0 Products
Classique Gifts Etc. plans to carry special occasion gifts and merchandise from the San Francisco Music Box Company, Swarovski crystal, Lennox crystal, Outback Chair Company, Traditions Artglass Company, children's books from Harvest House and other suppliers who display their products at the Atlanta International Gift Market or the Columbus Marketplace for Gift, Garden and Home.
We will also purchase merchandise from the most well-known collectible doll manufacturers and suppliers in the United States, including Steiff, Madame Alexander, Turner Dolls, Lee Middleton,
Page 4
www.enterslicellp.com
Wendy Lawton, Susan Wakeen, Kish Dolls, Lloyd Middleton and others that provide the quality products that our customers wish to purchase.
3.1 Product Description
3.2 Competitive Comparison
3.3 Sales Literature
3.4 Sourcing
3.5 Technology
3.6 Future Products
4.0 Market Analysis Summary
According to Pam Danziger, President of Unity Marketing, the collectible doll industry generated $3 billion in retail sales in 2000. The gift industry, which includes general gifts, collectibles, stationery and greeting cards, generated $54 billion in sales in 2002. As predicted by Unity Marketing, "the future of the gifts and home accents market is positive for the next several years." Source:Unity Marketing, The Home Report 2001:The Market, The Competitors, The Trends
4.1 Market Segmentation
The ideal customer we expect to serve is: Middle to Upper Class Primarily Female 30-75 Years of Age Educated Homeowner Quality Conscious Value Conscious Family Oriented
We will attract these customers by offering unique and uncommon product selections not found in the mass-market retail stores.
Page 5
www.enterslicellp.com
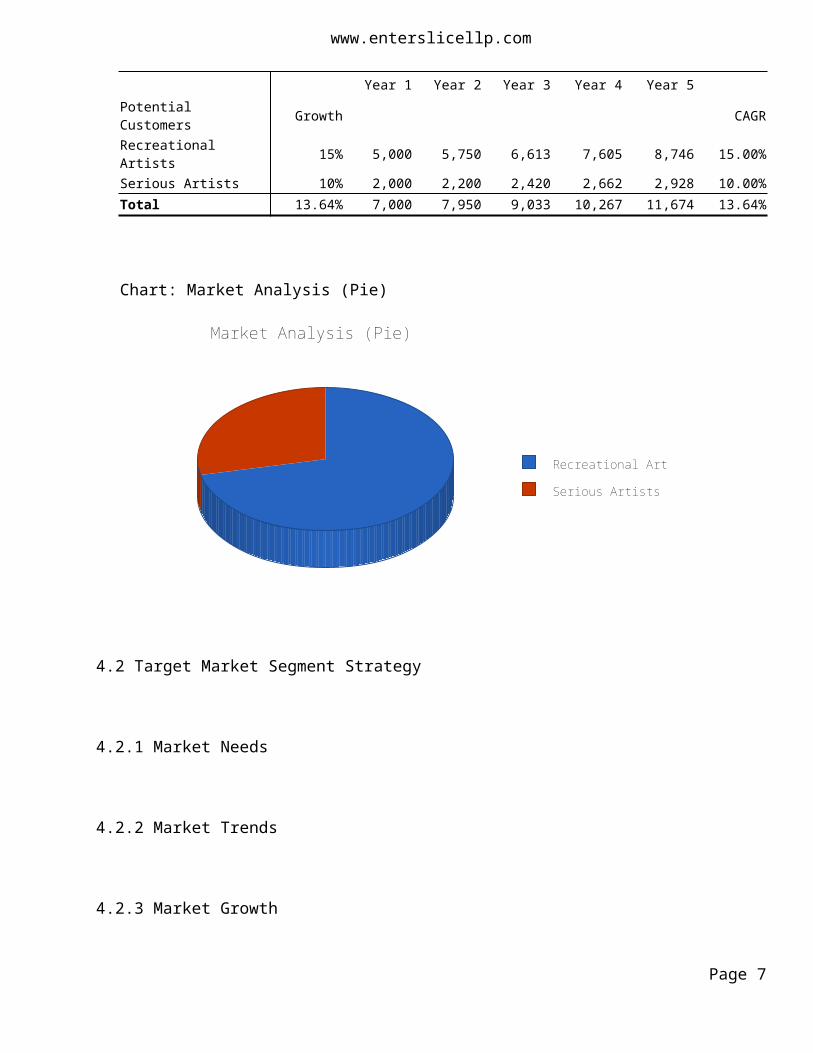
Table: Market Analysis
Market Analysis Year 1 Year 2 Year 3 Year 4 Year 5
Potential Customers Growth CAGRRecreational Artists 15% 5,000 5,750 6,613 7,605 8,746 15.00% Serious Artists 10% 2,000 2,200 2,420 2,662 2,928 10.00% Total 13.64% 7,000 7,950 9,033 10,267 11,674 13.64%
Chart: Market Analysis (Pie)
Recreational Artists
Serious Artists
Market Analysis (Pie)
4.2 Target Market Segment Strategy
4.2.1 Market Needs
4.2.2 Market Trends
4.2.3 Market Growth
Page 6
www.enterslicellp.com
4.3 Industry Analysis
More and more consumers are seeking independent retailers that offer them the feel of home with a more personalized shopping experience.
As consumers become more time-deprived, they are looking to shop at stores whose service offerings are as equal in quality and value to their products.
4.3.1 Industry Participants
4.3.2 Distribution Patterns
4.3.3 Competition and Buying Patterns
Brand name products sell well in stores that maintain a good selection, good location, and knowledgeable, friendly employees. These are the most important factors when selling collectibles and gifts.There is only one store in the Lexington area that carries a wide variety of collectible dolls. However, the doll inventory only makes up about 25% of the total inventory. We do not consider this store serious competition because their lease for the 4800 sq. ft. store expires in March, 2004, and it is rumored the business will not renew the lease.Other stores in the Central Kentucky area carry one or two lines of dolls but do not offer a wide variety of collectible doll lines. We intend to offer many different doll lines, doll accessories, personalized knowledgeable service, and a variety of other unique gift merchandise. The Internet offers dolls at discount prices. However, most of the merchandise is retired or discontinued lines that the manufacturers sell in bulk at discount wholesale prices. These are not the products we intend to carry in Classique Gifts Etc. We intend to develop a web page at some point, probably in year three to market our merchandise on the Internet.
4.3.4 Main Competitors
5.0 Web Plan Summary
5.1 Website Marketing Strategy
5.2 Development Requirements
Page 7
www.enterslicellp.com
6.0 Strategy and Imlpementation Summary
Classique Gifts Etc. will develop product offerings and marketing strategy to increase its customer base while driving sales and profit. The following sections review the various strategies that will support this effort.
6.1 SWOT Analysis
6.1.1 Strengths
6.1.2 Weaknesses
6.1.3 Opportunities
6.1.4 Threats
6.2 Strategy Pyramid
6.3 Value Proposition
6.4 Competitive Edge
Classique Gifts Etc. will establish itself competitively as a unique retail environment through product offering and friendly, personal customer service. With St. Joseph Hospital, medical offices, the Kentucky Inn, the University of Kentucky and the Campbell House all located within 1/2 mile of the proposed site, we will attempt to offer items that appeal to this diverse population as well as the doll collector.
6.5 Marketing Strategy
Classique Gifts Etc. will focus its marketing efforts by advertising in the Lexington Herald-Leader and Insight Media Advertising on cable TV.We will also increase consumer awareness, retain the existing customer base and promote sales via seasonal postcard and newsletter mailings. The mailings will announce special events or holiday specials during the year. These events will be used to sell slow-moving products and
Page 8
www.enterslicellp.com
vendor special promotions. This means our marketing resources will be centered around both sales promotions (events, displays) and personal sales (customer service, friendly atmosphere). Classique Gifts Etc. will offer $5 coupons for every $100 spent. The coupon can be used by the customer on future visits to the store.
6.5.1 Positioning Statement
6.5.2 Pricing Strategy
6.5.3 Promotion Strategy
6.5.4 Distribution Strategy
6.5.5 Marketing Programs
6.6 Sales Strategy
Classique Gifts Etc. will approach sales from a salesperson-customer relationship basis. All customers will be assisted in a very personal manner. Gathering key customer information and seeking performance feedback on the products and services offered will assist us in the following ways:
Targeting our marketing efforts more effectively. Developing product offers and merchandising formats that will increase sales.
Developing services that enhance the shopping experience. Increase awareness of Classique Gifts Etc. within the retail consumer marketplace. Develop future sales opportunities that allow for continued growth of the business.
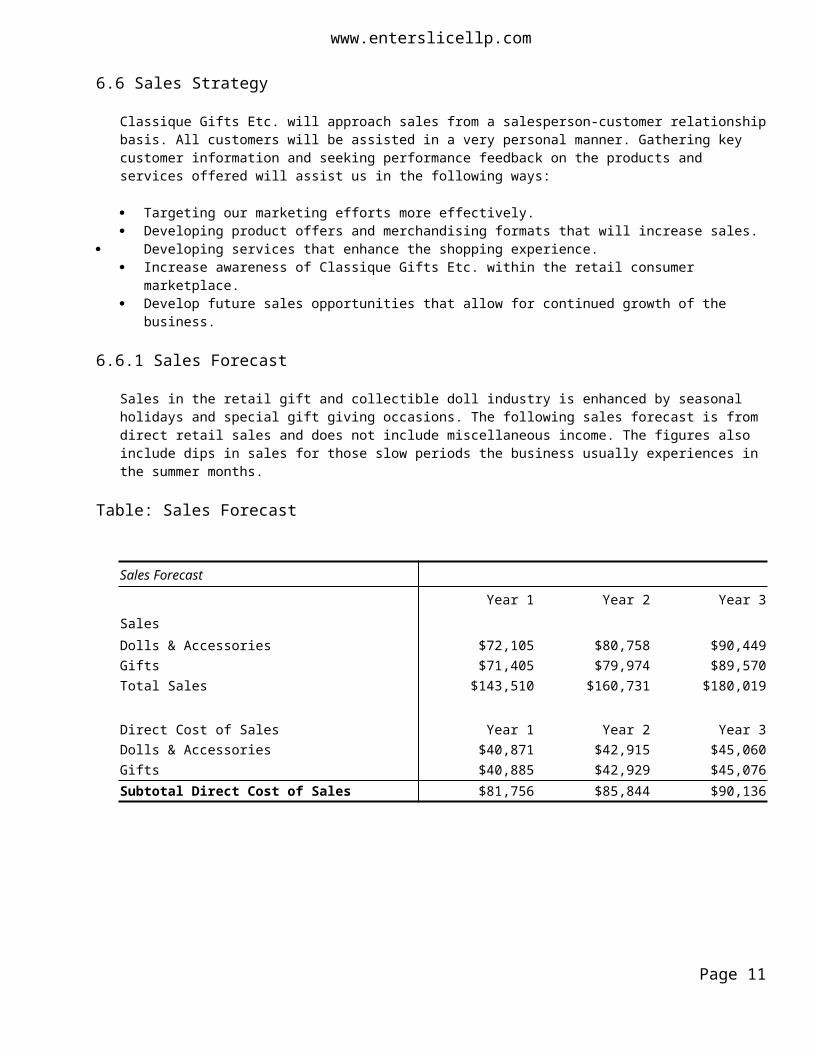
6.6.1 Sales Forecast
Sales in the retail gift and collectible doll industry is enhanced by seasonal holidays and special gift giving occasions. The following sales forecast is from direct retail sales and does not include miscellaneous income. The figures also include dips in sales for those slow periods the business usually experiences in the summer months.
Table: Sales Forecast
Sales Forecast Year 1 Year 2 Year 3
Page 9
www.enterslicellp.com
SalesDolls & Accessories $72,105 $80,758 $90,449 Gifts $71,405 $79,974 $89,570 Total Sales $143,510 $160,731 $180,019
Direct Cost of Sales Year 1 Year 2 Year 3Dolls & Accessories $40,871 $42,915 $45,060 Gifts $40,885 $42,929 $45,076 Subtotal Direct Cost of Sales $81,756 $85,844 $90,136
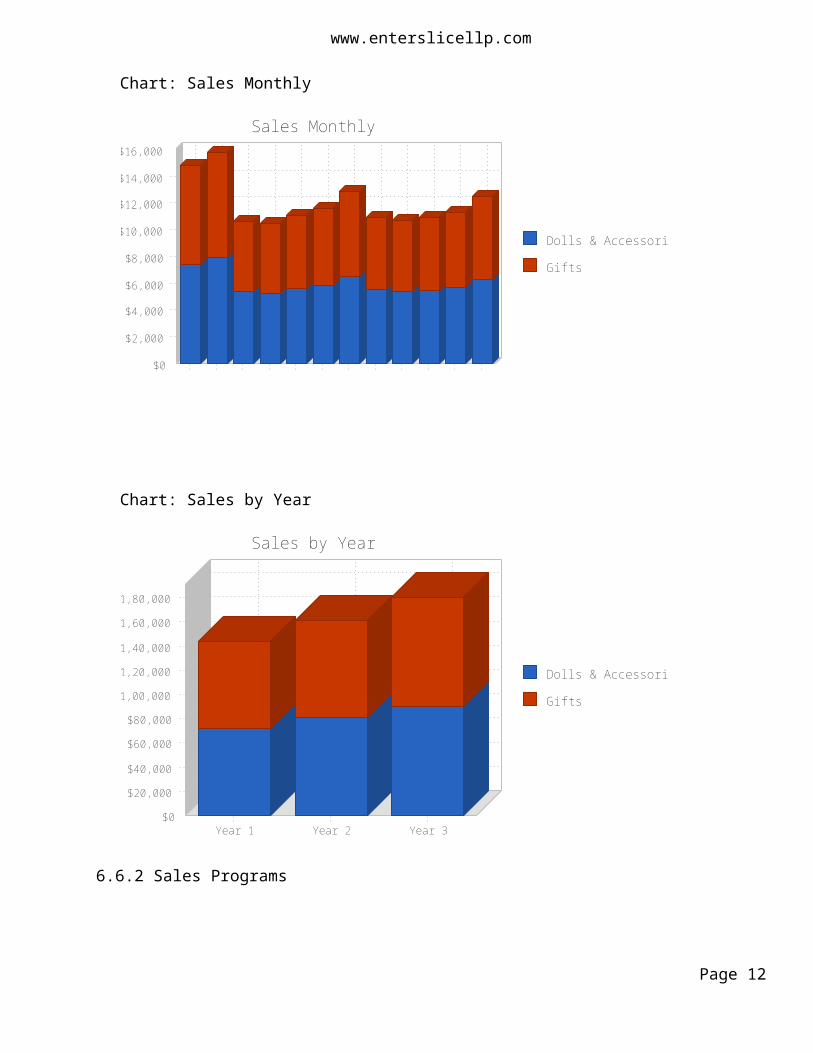
Chart: Sales Monthly
Dolls & Accessories
Gifts
$0
$2,000
$4,000
$6,000
$8,000
$10,000
$12,000
$14,000
$16,000 M
onth
1 Mon
th 2 Mon
th 3 M
onth
4 Mon
th 5 M
onth
6 Mon
th 7 M
onth
8 Mon
th 9
Mon
th 1
0 M
onth
11
Mon
th 1
2
Sales Monthly
Page 10
www.enterslicellp.com
Chart: Sales by Year
Dolls & Accessories
Gifts
$0
$20,000
$40,000
$60,000
$80,000
$1,00,000
$1,20,000
$1,40,000
$1,60,000
$1,80,000
Year 1 Year 2 Year 3
Sales by Year
6.6.2 Sales Programs
6.7 Strategic Alliances
6.8 Milestones
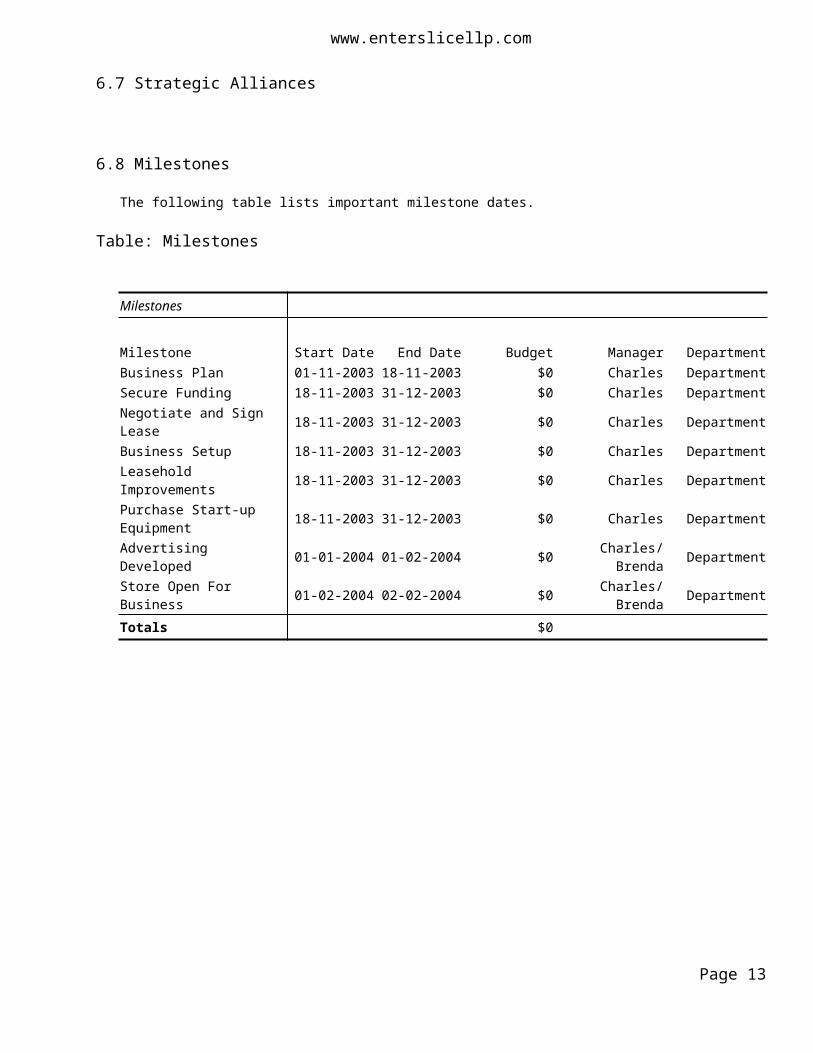
The following table lists important milestone dates.
Table: Milestones
Milestones
Milestone Start Date End Date Budget Manager DepartmentBusiness Plan 01-11-2003 18-11-2003 $0 Charles DepartmentSecure Funding 18-11-2003 31-12-2003 $0 Charles DepartmentNegotiate and Sign Lease 18-11-2003 31-12-2003 $0 Charles DepartmentBusiness Setup 18-11-2003 31-12-2003 $0 Charles DepartmentLeasehold Improvements 18-11-2003 31-12-2003 $0 Charles DepartmentPurchase Start-up Equipment 18-11-2003 31-12-2003 $0 Charles DepartmentAdvertising Developed 01-01-2004 01-02-2004 $0 Charles/Brenda Department
Page 11
www.enterslicellp.com
Store Open For Business 01-02-2004 02-02-2004 $0 Charles/Brenda DepartmentTotals $0
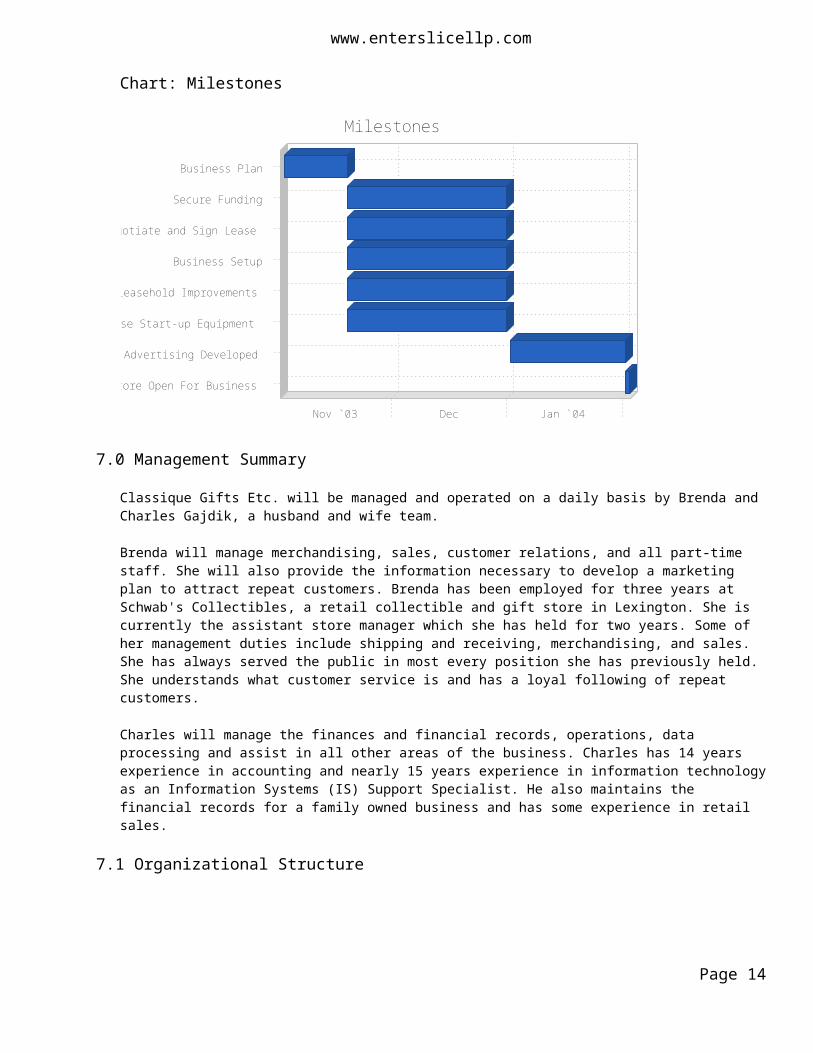
Chart: Milestones
Nov `03 Dec Jan `04
Store Open For Business
Advertising Developed
Purchase Start-up Equipment
Leasehold Improvements
Business Setup
Negotiate and Sign Lease
Secure Funding
Business Plan
Milestones
7.0 Management Summary
Classique Gifts Etc. will be managed and operated on a daily basis by Brenda and Charles Gajdik, a husband and wife team.
Brenda will manage merchandising, sales, customer relations, and all part-time staff. She will also provide the information necessary to develop a marketing plan to attract repeat customers. Brenda has been employed for three years at Schwab's Collectibles, a retail collectible and gift store in Lexington. She is currently the assistant store manager which she has held for two years. Some of her management duties include shipping and receiving, merchandising, and sales. She has always served the public in most every position she has previously held. She understands what customer service is and has a loyal following of repeat customers.
Charles will manage the finances and financial records, operations, data processing and assist in all other areas of the business. Charles has 14 years experience in accounting and nearly 15 years experience in information technology as an Information Systems (IS) Support Specialist. He also maintains the financial records for a family owned business and has some experience in retail sales.
7.1 Organizational Structure
Page 12
www.enterslicellp.com
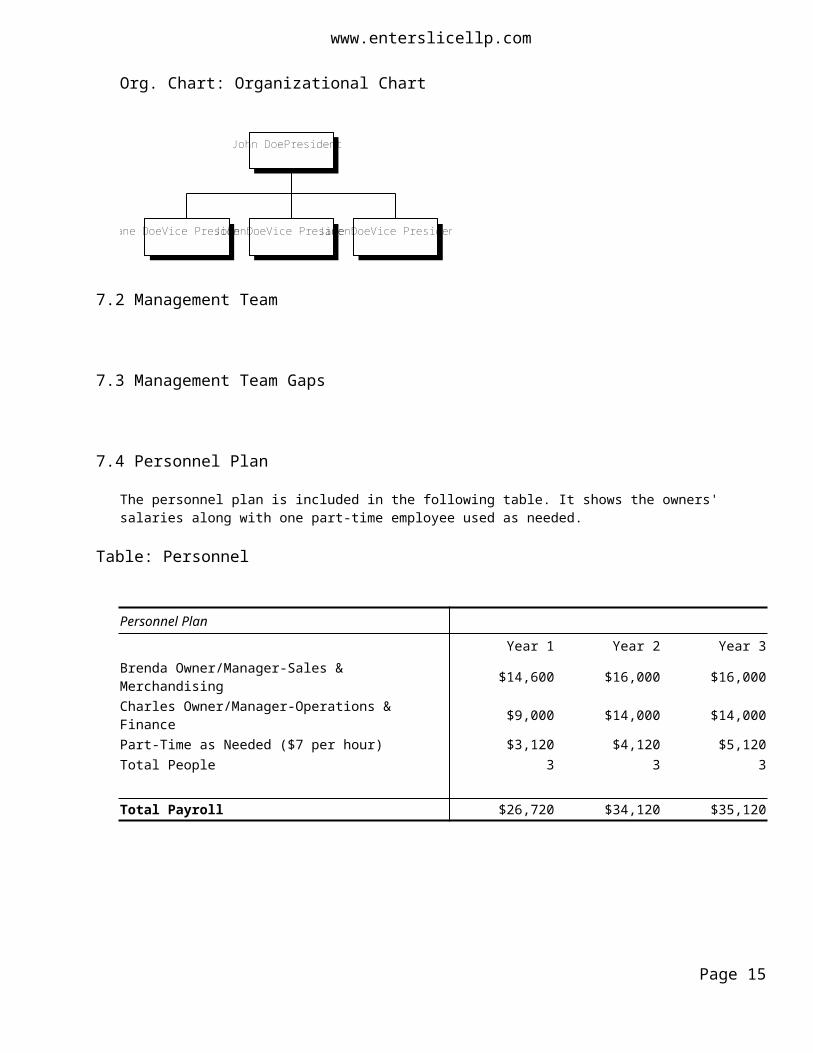
Org. Chart: Organizational Chart
John DoePresident
Jane DoeVice PresidentJohn DoeVice PresidentJane DoeVice President
7.2 Management Team
7.3 Management Team Gaps
7.4 Personnel Plan
The personnel plan is included in the following table. It shows the owners' salaries along with one part-time employee used as needed.
Table: Personnel
Personnel Plan Year 1 Year 2 Year 3
Brenda Owner/Manager-Sales & Merchandising $14,600 $16,000 $16,000 Charles Owner/Manager-Operations & Finance $9,000 $14,000 $14,000 Part-Time as Needed ($7 per hour) $3,120 $4,120 $5,120 Total People 3 3 3
Total Payroll $26,720 $34,120 $35,120
Page 13
www.enterslicellp.com
8.0 Financial Plan
Growth will be moderate. Costs will be managed and forecasts for future needs will be performed on a regular basis. Finding the right product, at the right price will enable the business to meet planned
margins and maintain inventory at an acceptable level.
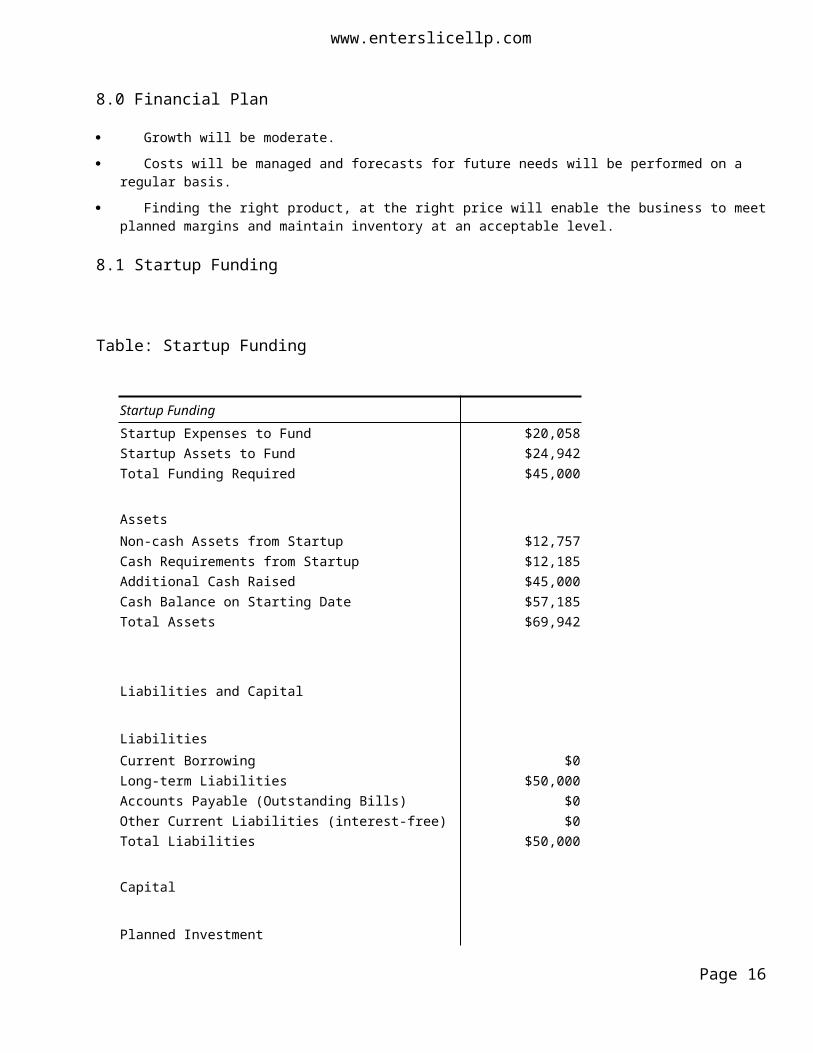
8.1 Startup Funding
Table: Startup Funding
Startup FundingStartup Expenses to Fund $20,058 Startup Assets to Fund $24,942 Total Funding Required $45,000
Assets Non-cash Assets from Startup $12,757 Cash Requirements from Startup $12,185 Additional Cash Raised $45,000 Cash Balance on Starting Date $57,185 Total Assets $69,942
Liabilities and Capital
LiabilitiesCurrent Borrowing $0 Long-term Liabilities $50,000 Accounts Payable (Outstanding Bills) $0 Other Current Liabilities (interest-free) $0 Total Liabilities $50,000
Capital
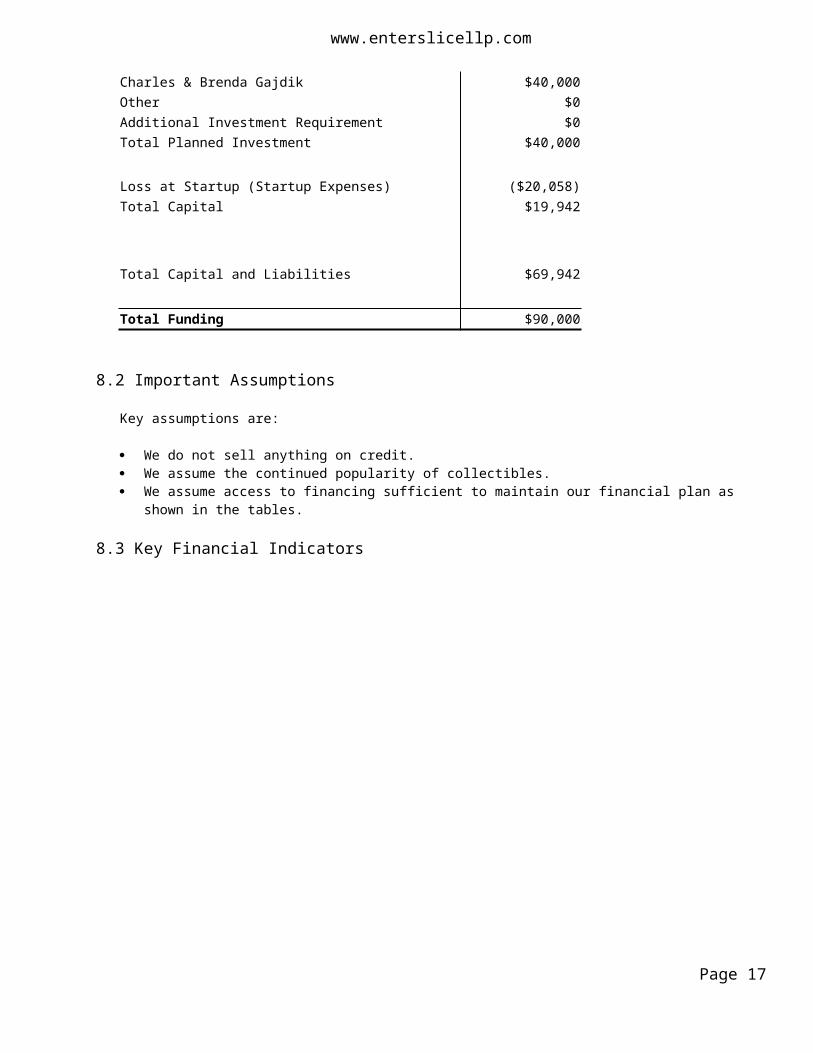
Planned InvestmentCharles & Brenda Gajdik $40,000 Other $0 Additional Investment Requirement $0 Total Planned Investment $40,000
Loss at Startup (Startup Expenses) ($20,058)Total Capital $19,942
Page 14
www.enterslicellp.com
Total Capital and Liabilities $69,942
Total Funding $90,000
8.2 Important Assumptions
Key assumptions are:
We do not sell anything on credit. We assume the continued popularity of collectibles. We assume access to financing sufficient to maintain our financial plan as shown in the
tables.
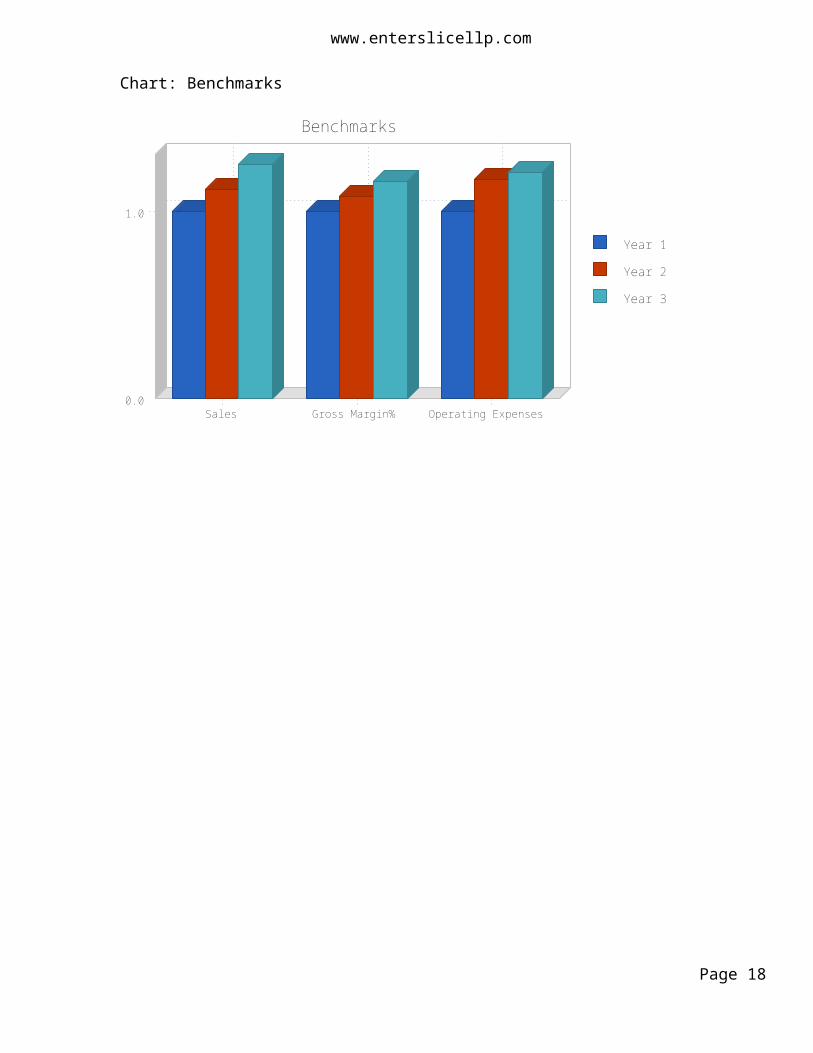
8.3 Key Financial Indicators
Chart: Benchmarks
Year 1
Year 2
Year 3
0.0
1.0
Sales Gross Margin% Operating Expenses
Benchmarks
Page 15
www.enterslicellp.com
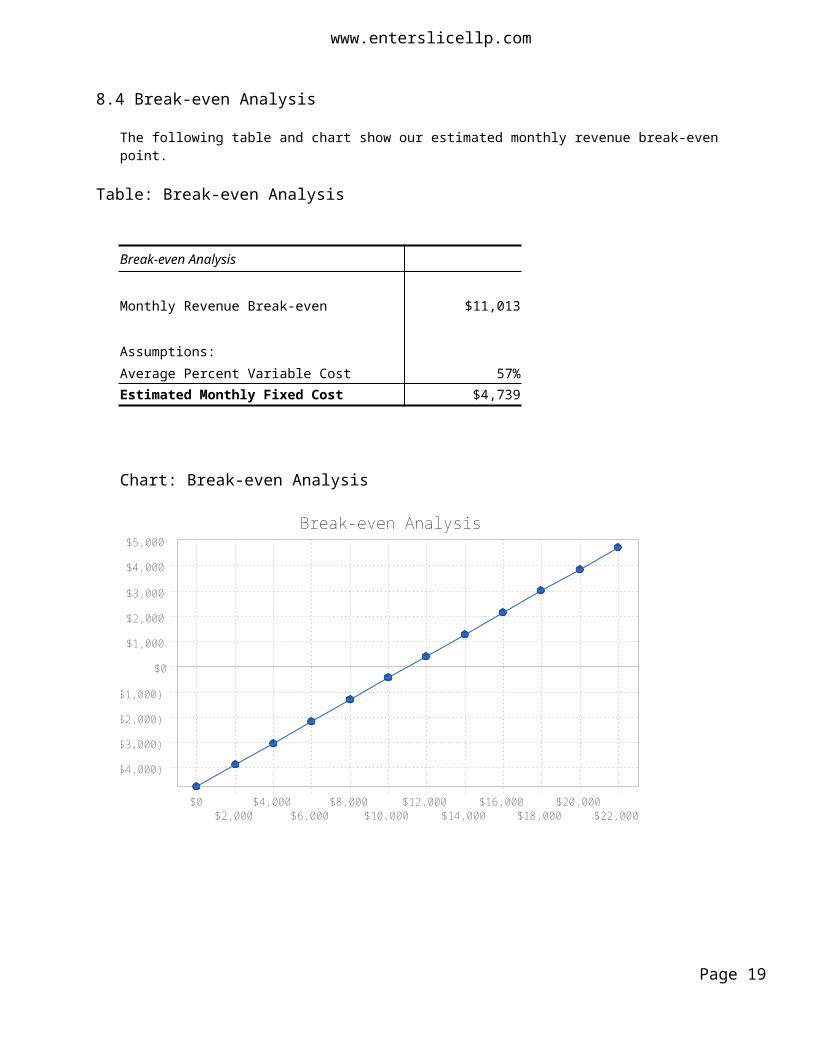
8.4 Break-even Analysis
The following table and chart show our estimated monthly revenue break-even point.
Table: Break-even Analysis
Break-even Analysis
Monthly Revenue Break-even $11,013
Assumptions:Average Percent Variable Cost 57% Estimated Monthly Fixed Cost $4,739
Chart: Break-even Analysis
$0
$1,000
$2,000
$3,000
$4,000
$5,000
($1,000)
($2,000)
($3,000)
($4,000)
$0$2,000
$4,000$6,000
$8,000$10,000
$12,000$14,000
$16,000$18,000
$20,000$22,000
Break-even Analysis
Page 16
www.enterslicellp.com
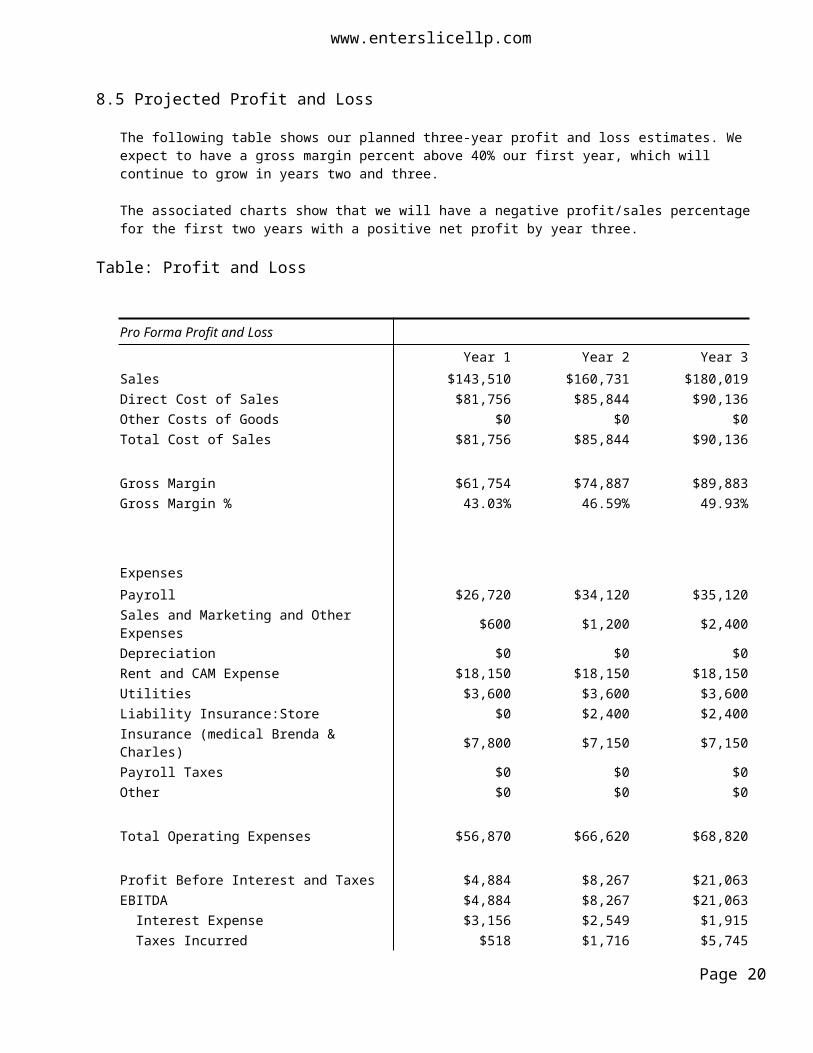
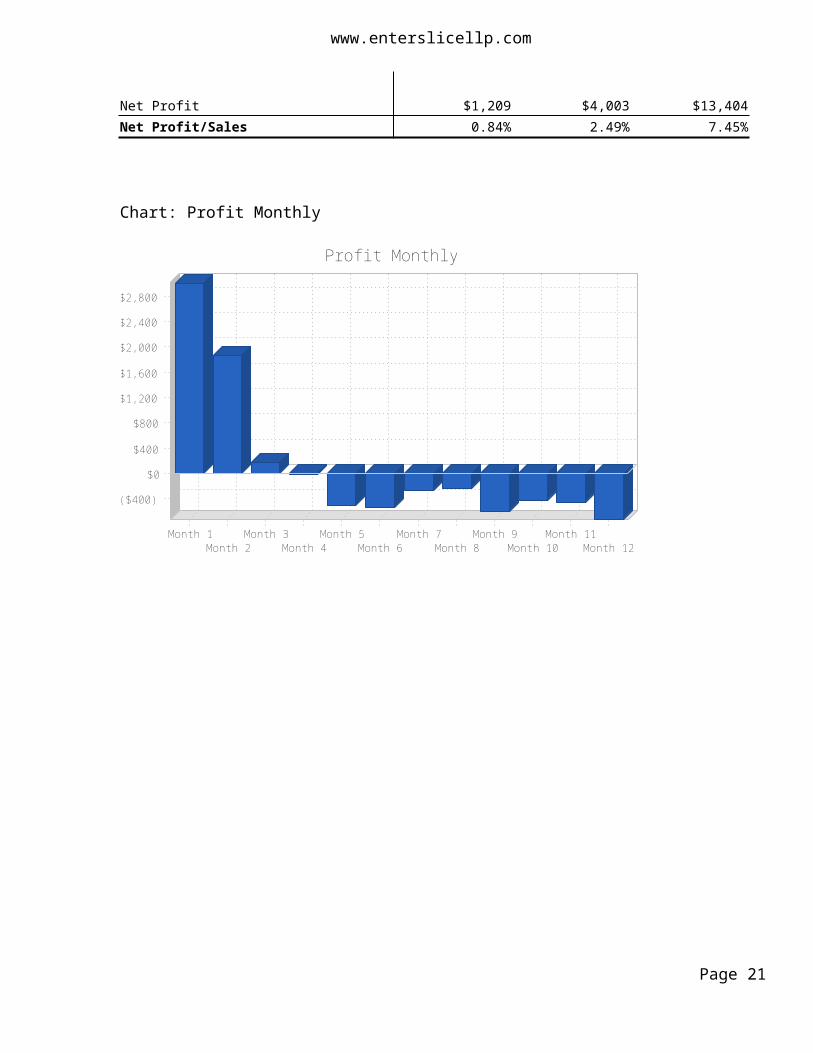
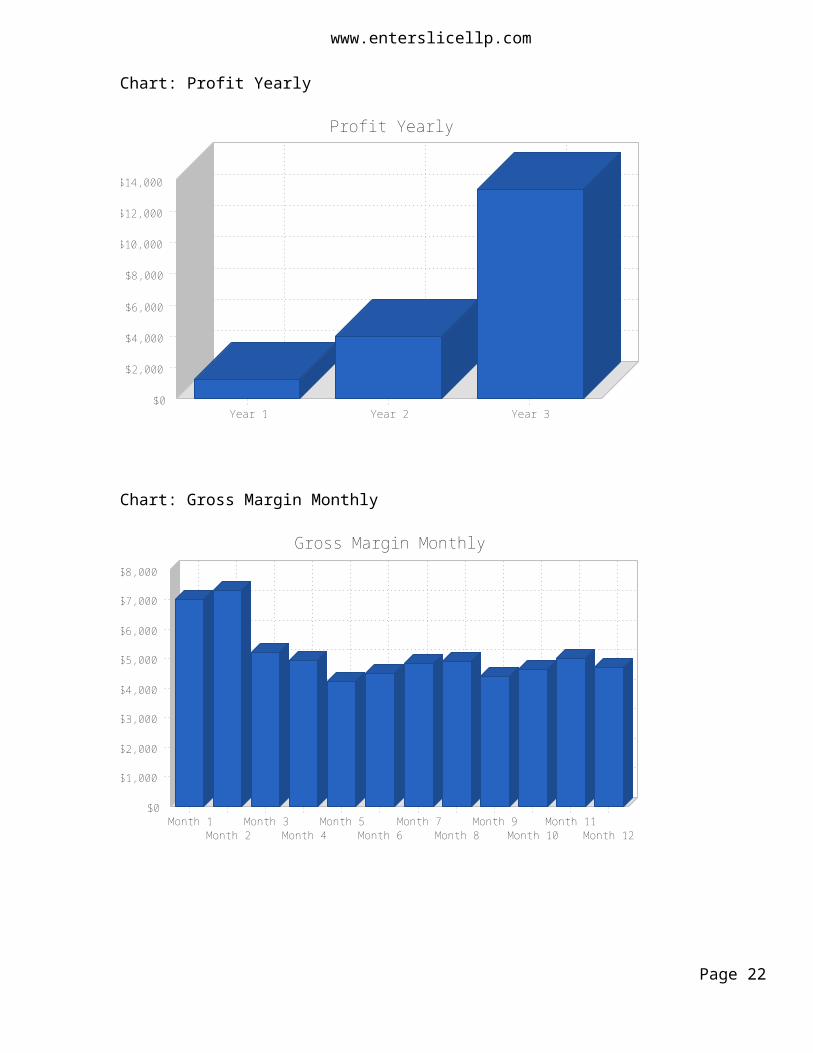
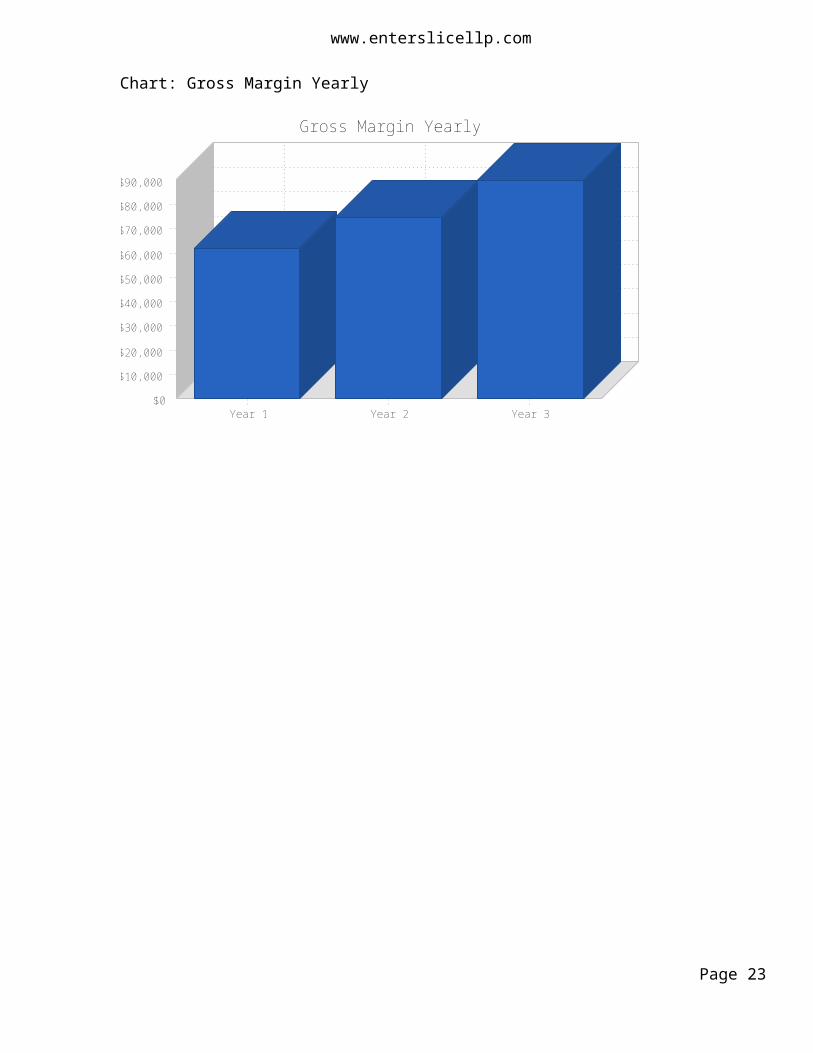
8.5 Projected Profit and Loss
The following table shows our planned three-year profit and loss estimates. We expect to have a gross margin percent above 40% our first year, which will continue to grow in years two and three.
The associated charts show that we will have a negative profit/sales percentage for the first two years with a positive net profit by year three.
Table: Profit and Loss
Pro Forma Profit and Loss Year 1 Year 2 Year 3
Sales $143,510 $160,731 $180,019 Direct Cost of Sales $81,756 $85,844 $90,136 Other Costs of Goods $0 $0 $0 Total Cost of Sales $81,756 $85,844 $90,136
Gross Margin $61,754 $74,887 $89,883 Gross Margin % 43.03% 46.59% 49.93%
ExpensesPayroll $26,720 $34,120 $35,120 Sales and Marketing and Other Expenses $600 $1,200 $2,400 Depreciation $0 $0 $0 Rent and CAM Expense $18,150 $18,150 $18,150 Utilities $3,600 $3,600 $3,600 Liability Insurance:Store $0 $2,400 $2,400 Insurance (medical Brenda & Charles) $7,800 $7,150 $7,150 Payroll Taxes $0 $0 $0 Other $0 $0 $0
Total Operating Expenses $56,870 $66,620 $68,820
Profit Before Interest and Taxes $4,884 $8,267 $21,063 EBITDA $4,884 $8,267 $21,063 Interest Expense $3,156 $2,549 $1,915 Taxes Incurred $518 $1,716 $5,745
Net Profit $1,209 $4,003 $13,404 Net Profit/Sales 0.84% 2.49% 7.45%
Page 17
www.enterslicellp.com
Chart: Profit Monthly
$0
$400
$800
$1,200
$1,600
$2,000
$2,400
$2,800
($400)
Month 1 Month 2
Month 3 Month 4
Month 5 Month 6
Month 7 Month 8
Month 9 Month 10
Month 11 Month 12
Profit Monthly
Chart: Profit Yearly
$0
$2,000
$4,000
$6,000
$8,000
$10,000
$12,000
$14,000
Year 1 Year 2 Year 3
Profit Yearly
Page 18
www.enterslicellp.com
Chart: Gross Margin Monthly
$0
$1,000
$2,000
$3,000
$4,000
$5,000
$6,000
$7,000
$8,000
Month 1 Month 2
Month 3 Month 4
Month 5 Month 6
Month 7 Month 8
Month 9 Month 10
Month 11 Month 12
Gross Margin Monthly
Chart: Gross Margin Yearly
$0
$10,000
$20,000
$30,000
$40,000
$50,000
$60,000
$70,000
$80,000
$90,000
Year 1 Year 2 Year 3
Gross Margin Yearly
Page 19
www.enterslicellp.com
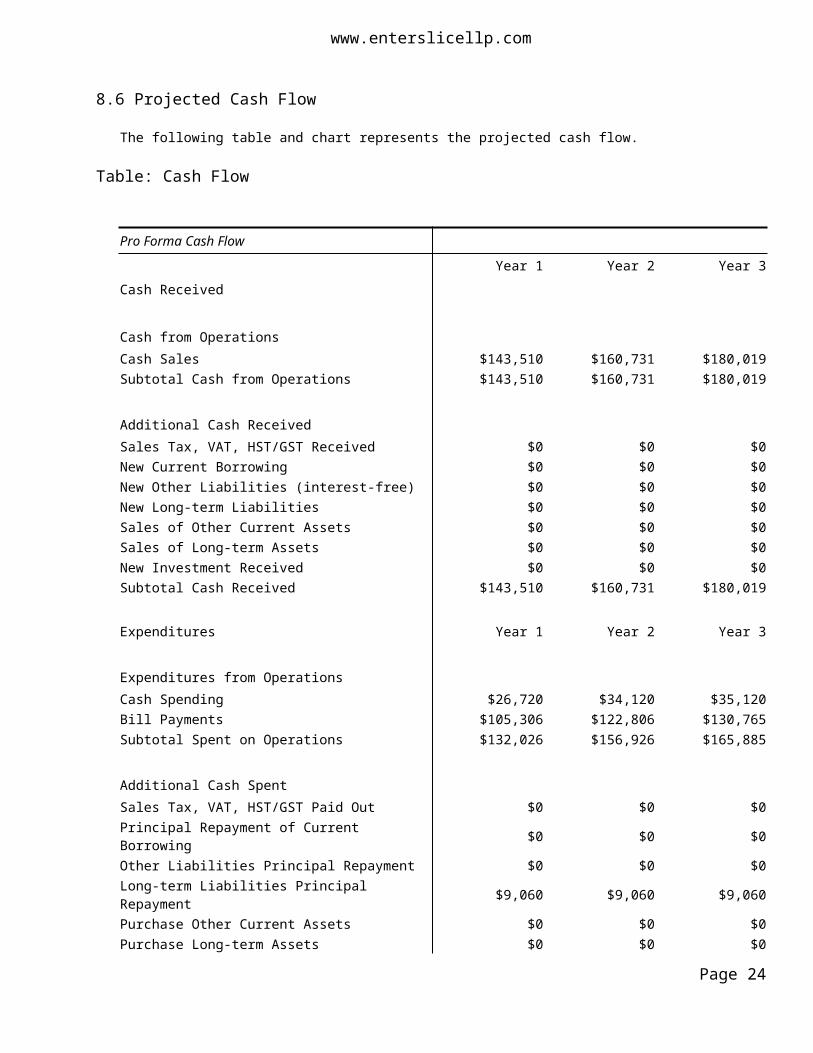
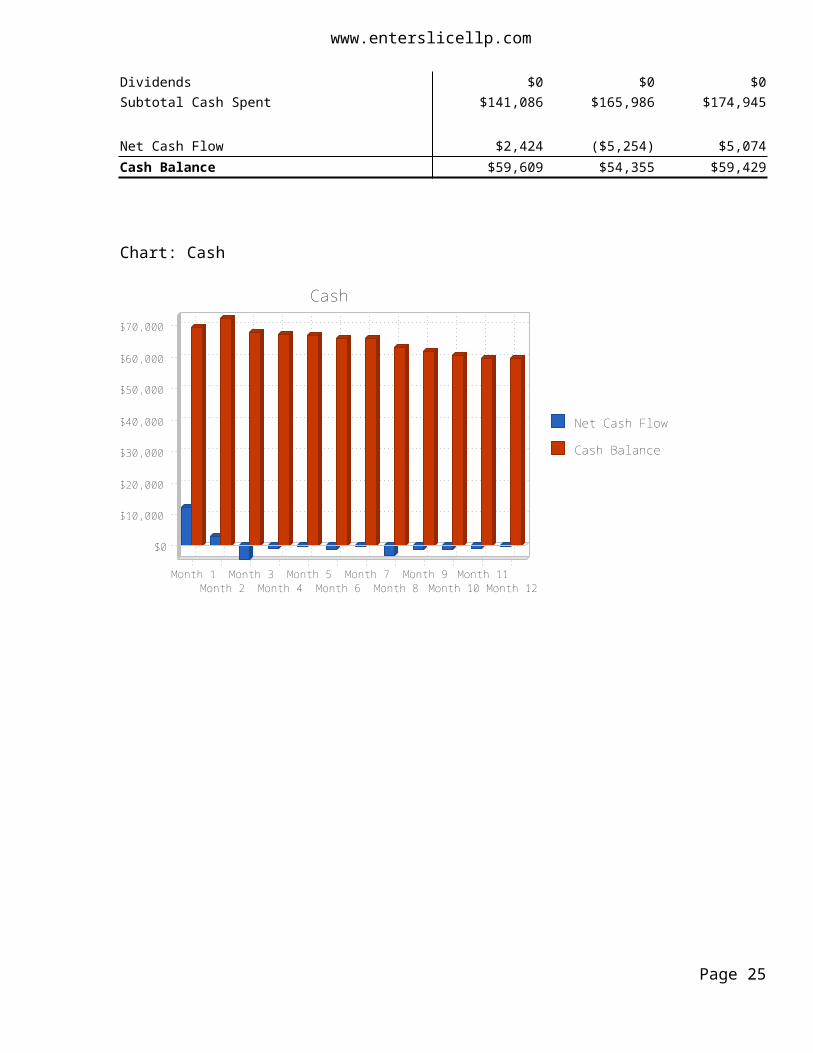
8.6 Projected Cash Flow
The following table and chart represents the projected cash flow.
Table: Cash Flow
Pro Forma Cash Flow Year 1 Year 2 Year 3
Cash Received
Cash from OperationsCash Sales $143,510 $160,731 $180,019 Subtotal Cash from Operations $143,510 $160,731 $180,019
Additional Cash ReceivedSales Tax, VAT, HST/GST Received $0 $0 $0 New Current Borrowing $0 $0 $0 New Other Liabilities (interest-free) $0 $0 $0 New Long-term Liabilities $0 $0 $0 Sales of Other Current Assets $0 $0 $0 Sales of Long-term Assets $0 $0 $0 New Investment Received $0 $0 $0 Subtotal Cash Received $143,510 $160,731 $180,019
Expenditures Year 1 Year 2 Year 3
Expenditures from OperationsCash Spending $26,720 $34,120 $35,120 Bill Payments $105,306 $122,806 $130,765 Subtotal Spent on Operations $132,026 $156,926 $165,885
Additional Cash SpentSales Tax, VAT, HST/GST Paid Out $0 $0 $0 Principal Repayment of Current Borrowing $0 $0 $0 Other Liabilities Principal Repayment $0 $0 $0 Long-term Liabilities Principal Repayment $9,060 $9,060 $9,060 Purchase Other Current Assets $0 $0 $0 Purchase Long-term Assets $0 $0 $0 Dividends $0 $0 $0 Subtotal Cash Spent $141,086 $165,986 $174,945
Net Cash Flow $2,424 ($5,254) $5,074 Cash Balance $59,609 $54,355 $59,429
Page 20
www.enterslicellp.com
Chart: Cash
Net Cash Flow
Cash Balance
$0
$10,000
$20,000
$30,000
$40,000
$50,000
$60,000
$70,000
Month 1 Month 2
Month 3 Month 4
Month 5 Month 6
Month 7 Month 8
Month 9 Month 10
Month 11 Month 12
Cash
Page 21
www.enterslicellp.com
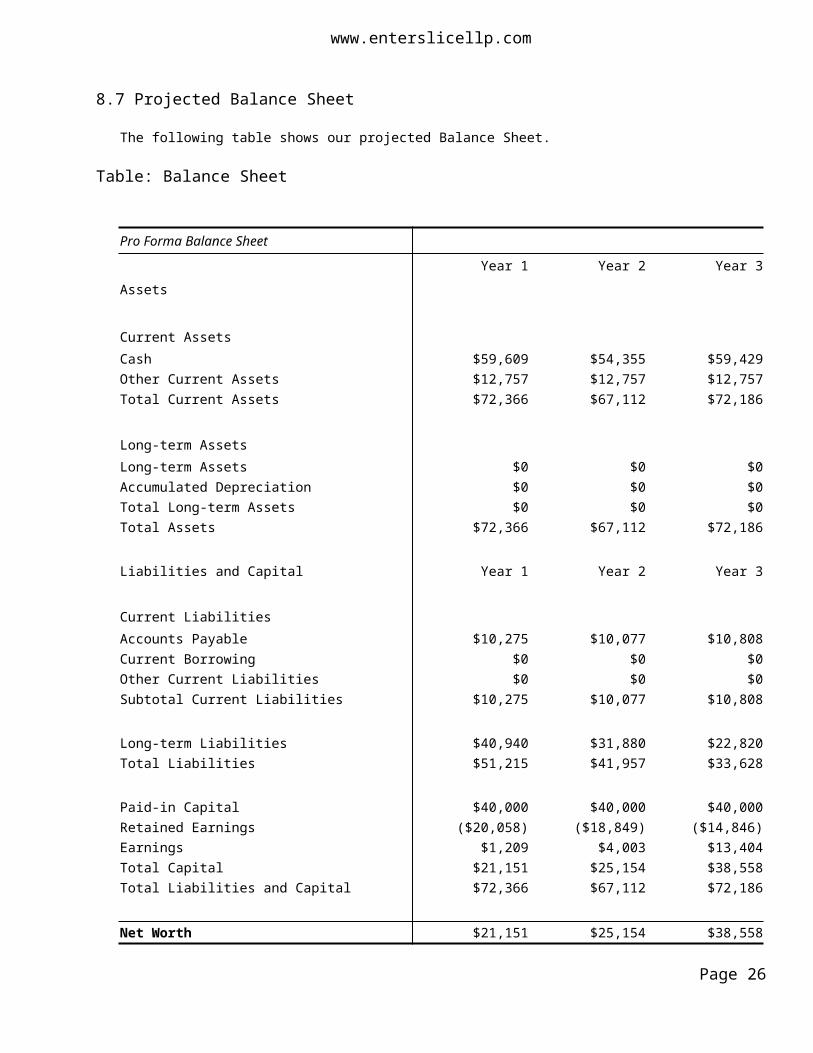
8.7 Projected Balance Sheet
The following table shows our projected Balance Sheet.
Table: Balance Sheet
Pro Forma Balance Sheet Year 1 Year 2 Year 3
Assets
Current AssetsCash $59,609 $54,355 $59,429 Other Current Assets $12,757 $12,757 $12,757 Total Current Assets $72,366 $67,112 $72,186
Long-term AssetsLong-term Assets $0 $0 $0 Accumulated Depreciation $0 $0 $0 Total Long-term Assets $0 $0 $0 Total Assets $72,366 $67,112 $72,186
Liabilities and Capital Year 1 Year 2 Year 3
Current LiabilitiesAccounts Payable $10,275 $10,077 $10,808 Current Borrowing $0 $0 $0 Other Current Liabilities $0 $0 $0 Subtotal Current Liabilities $10,275 $10,077 $10,808
Long-term Liabilities $40,940 $31,880 $22,820 Total Liabilities $51,215 $41,957 $33,628
Paid-in Capital $40,000 $40,000 $40,000 Retained Earnings ($20,058) ($18,849) ($14,846)Earnings $1,209 $4,003 $13,404 Total Capital $21,151 $25,154 $38,558 Total Liabilities and Capital $72,366 $67,112 $72,186
Net Worth $21,151 $25,154 $38,558
Page 22
www.enterslicellp.com
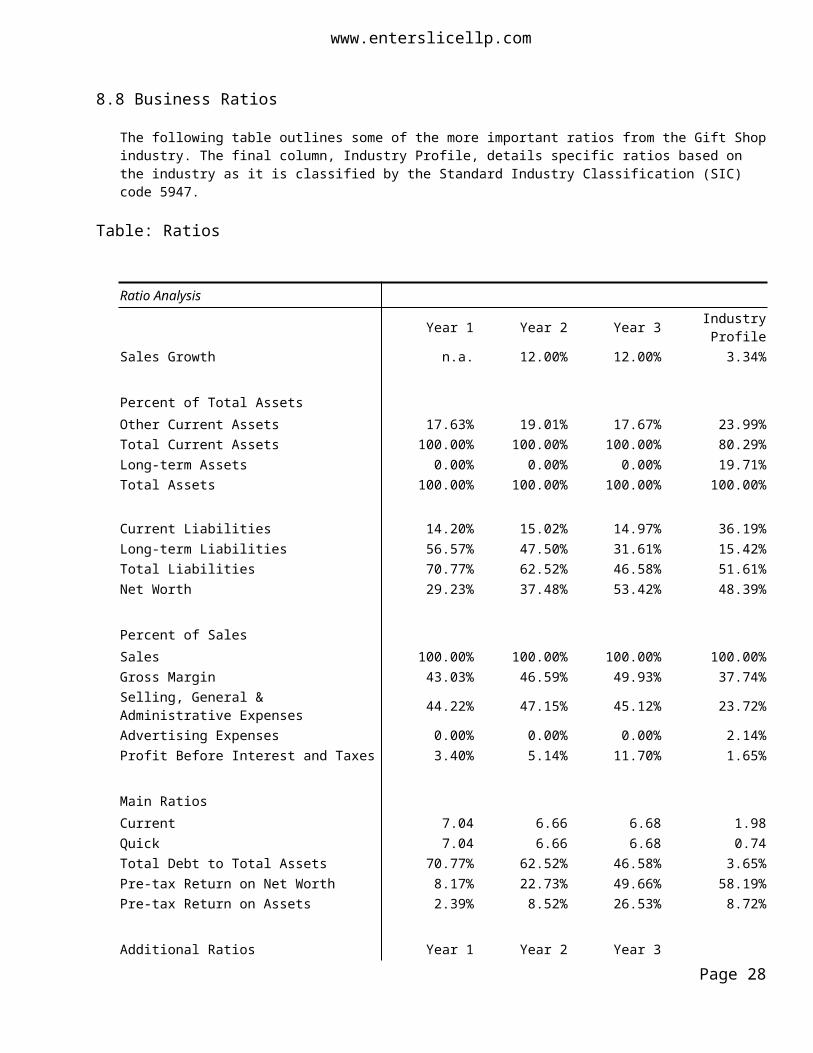
8.8 Business Ratios
The following table outlines some of the more important ratios from the Gift Shop industry. The final column, Industry Profile, details specific ratios based on the industry as it is classified by the Standard Industry Classification (SIC) code 5947.
Table: Ratios
Ratio Analysis Year 1 Year 2 Year 3 Industry Profile
Sales Growth n.a. 12.00% 12.00% 3.34%
Percent of Total AssetsOther Current Assets 17.63% 19.01% 17.67% 23.99% Total Current Assets 100.00% 100.00% 100.00% 80.29% Long-term Assets 0.00% 0.00% 0.00% 19.71% Total Assets 100.00% 100.00% 100.00% 100.00%
Current Liabilities 14.20% 15.02% 14.97% 36.19% Long-term Liabilities 56.57% 47.50% 31.61% 15.42% Total Liabilities 70.77% 62.52% 46.58% 51.61% Net Worth 29.23% 37.48% 53.42% 48.39%
Percent of SalesSales 100.00% 100.00% 100.00% 100.00% Gross Margin 43.03% 46.59% 49.93% 37.74% Selling, General & Administrative Expenses 44.22% 47.15% 45.12% 23.72% Advertising Expenses 0.00% 0.00% 0.00% 2.14% Profit Before Interest and Taxes 3.40% 5.14% 11.70% 1.65%
Main RatiosCurrent 7.04 6.66 6.68 1.98 Quick 7.04 6.66 6.68 0.74 Total Debt to Total Assets 70.77% 62.52% 46.58% 3.65% Pre-tax Return on Net Worth 8.17% 22.73% 49.66% 58.19% Pre-tax Return on Assets 2.39% 8.52% 26.53% 8.72%
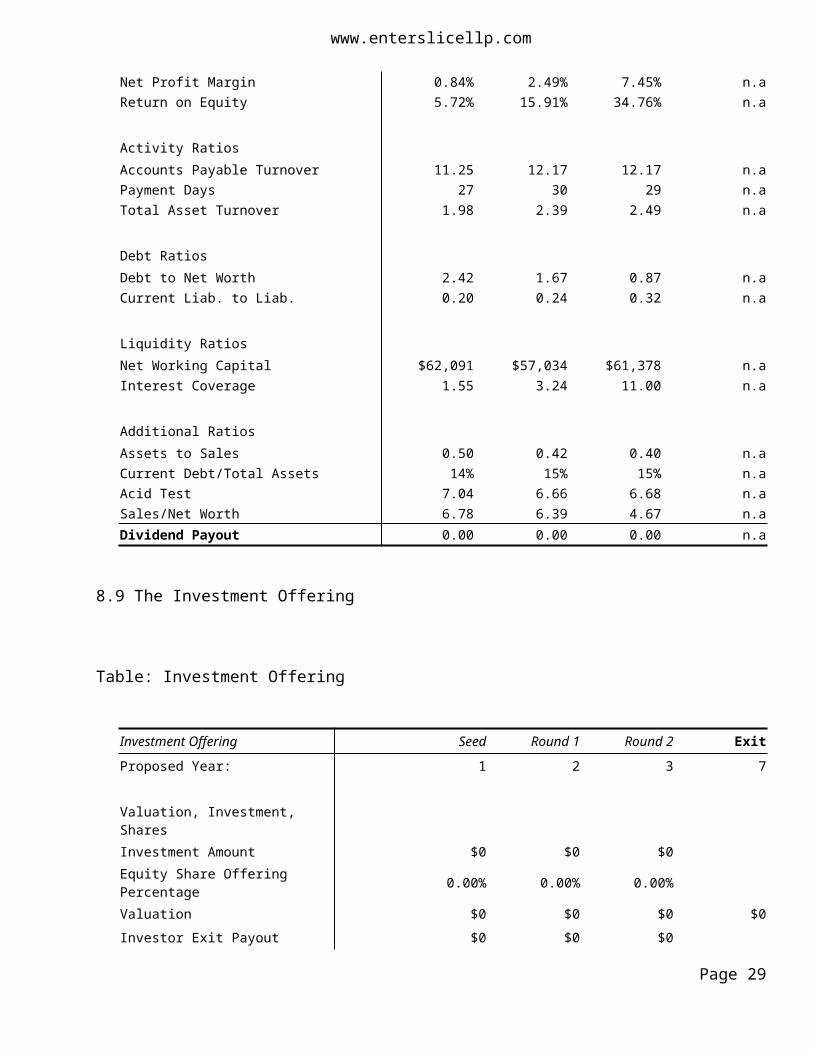
Additional Ratios Year 1 Year 2 Year 3Net Profit Margin 0.84% 2.49% 7.45% n.aReturn on Equity 5.72% 15.91% 34.76% n.a
Activity RatiosAccounts Payable Turnover 11.25 12.17 12.17 n.aPayment Days 27 30 29 n.aTotal Asset Turnover 1.98 2.39 2.49 n.a
Page 23
www.enterslicellp.com
Debt RatiosDebt to Net Worth 2.42 1.67 0.87 n.aCurrent Liab. to Liab. 0.20 0.24 0.32 n.a
Liquidity RatiosNet Working Capital $62,091 $57,034 $61,378 n.aInterest Coverage 1.55 3.24 11.00 n.a
Additional RatiosAssets to Sales 0.50 0.42 0.40 n.aCurrent Debt/Total Assets 14% 15% 15% n.aAcid Test 7.04 6.66 6.68 n.aSales/Net Worth 6.78 6.39 4.67 n.aDividend Payout 0.00 0.00 0.00 n.a
8.9 The Investment Offering
Table: Investment Offering
Investment Offering Seed Round 1 Round 2 ExitProposed Year: 1 2 3 7
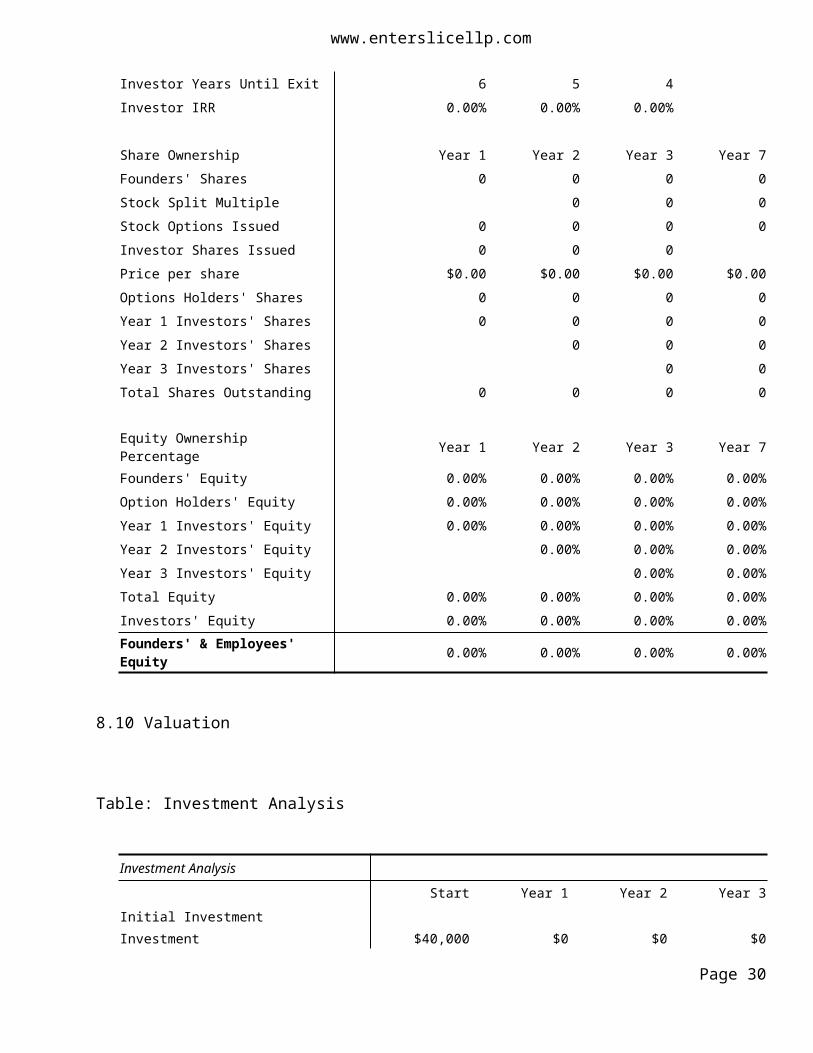
Valuation, Investment, SharesInvestment Amount $0 $0 $0 Equity Share Offering Percentage 0.00% 0.00% 0.00% Valuation $0 $0 $0 $0 Investor Exit Payout $0 $0 $0 Investor Years Until Exit 6 5 4Investor IRR 0.00% 0.00% 0.00%
Share Ownership Year 1 Year 2 Year 3 Year 7Founders' Shares 0 0 0 0 Stock Split Multiple 0 0 0 Stock Options Issued 0 0 0 0 Investor Shares Issued 0 0 0 Price per share $0.00 $0.00 $0.00 $0.00 Options Holders' Shares 0 0 0 0 Year 1 Investors' Shares 0 0 0 0 Year 2 Investors' Shares 0 0 0 Year 3 Investors' Shares 0 0
Page 24
www.enterslicellp.com
Total Shares Outstanding 0 0 0 0
Equity Ownership Percentage Year 1 Year 2 Year 3 Year 7Founders' Equity 0.00% 0.00% 0.00% 0.00% Option Holders' Equity 0.00% 0.00% 0.00% 0.00% Year 1 Investors' Equity 0.00% 0.00% 0.00% 0.00% Year 2 Investors' Equity 0.00% 0.00% 0.00% Year 3 Investors' Equity 0.00% 0.00% Total Equity 0.00% 0.00% 0.00% 0.00% Investors' Equity 0.00% 0.00% 0.00% 0.00% Founders' & Employees' Equity 0.00% 0.00% 0.00% 0.00%
8.10 Valuation
Table: Investment Analysis
Investment AnalysisStart Year 1 Year 2 Year 3
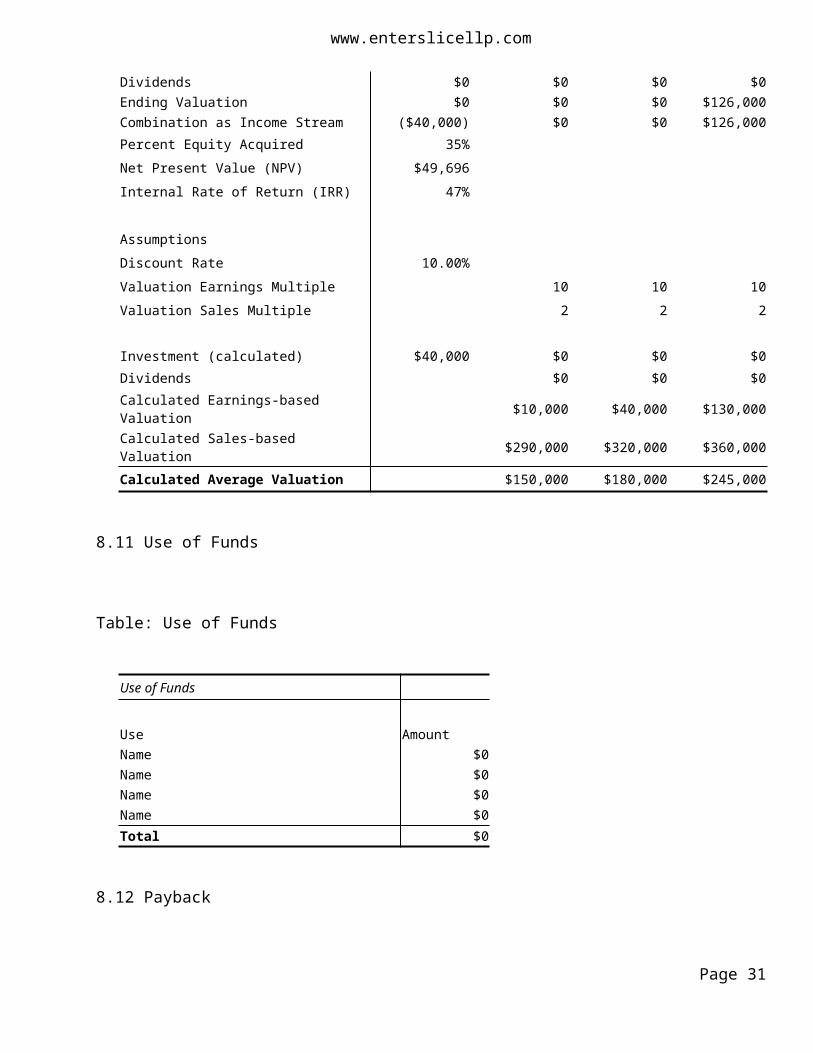
Initial InvestmentInvestment $40,000 $0 $0 $0 Dividends $0 $0 $0 $0 Ending Valuation $0 $0 $0 $126,000 Combination as Income Stream ($40,000) $0 $0 $126,000 Percent Equity Acquired 35% Net Present Value (NPV) $49,696 Internal Rate of Return (IRR) 47%
AssumptionsDiscount Rate 10.00% Valuation Earnings Multiple 10 10 10 Valuation Sales Multiple 2 2 2
Investment (calculated) $40,000 $0 $0 $0 Dividends $0 $0 $0 Calculated Earnings-based Valuation $10,000 $40,000 $130,000 Calculated Sales-based Valuation $290,000 $320,000 $360,000 Calculated Average Valuation $150,000 $180,000 $245,000
Page 25
www.enterslicellp.com
8.11 Use of Funds
Table: Use of Funds
Use of Funds
Use AmountName $0 Name $0 Name $0 Name $0 Total $0
8.12 Payback
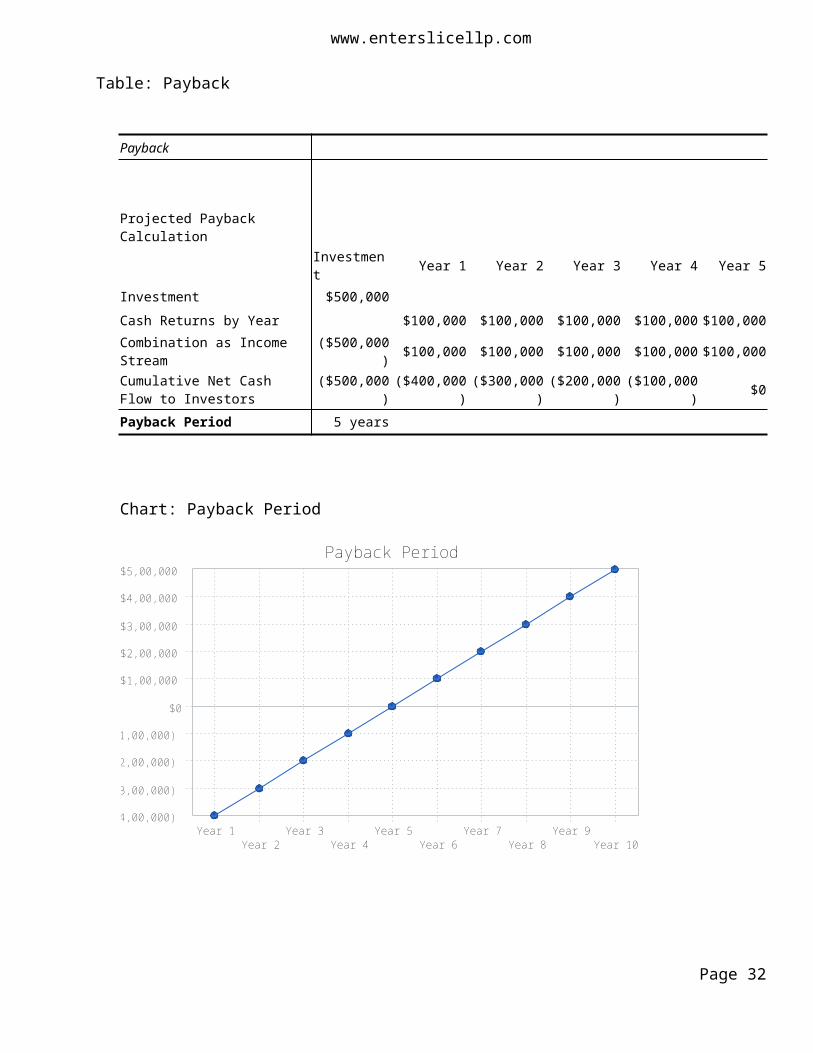
Table: Payback
Payback
Projected Payback Calculation
Investment Year 1 Year 2 Year 3 Year 4 Year 5Investment $500,000 Cash Returns by Year $100,000 $100,000 $100,000 $100,000 $100,000 Combination as Income Stream ($500,000) $100,000 $100,000 $100,000 $100,000 $100,000 Cumulative Net Cash Flow to Investors ($500,000) ($400,000) ($300,000) ($200,000) ($100,000) $0 Payback Period 5 years
Page 26
www.enterslicellp.com
Chart: Payback Period
$0
$1,00,000
$2,00,000
$3,00,000
$4,00,000
$5,00,000
($1,00,000)
($2,00,000)
($3,00,000)
($4,00,000) Year 1
Year 2 Year 3
Year 4 Year 5
Year 6 Year 7
Year 8 Year 9
Year 10
Payback Period
Page 27

Appendix
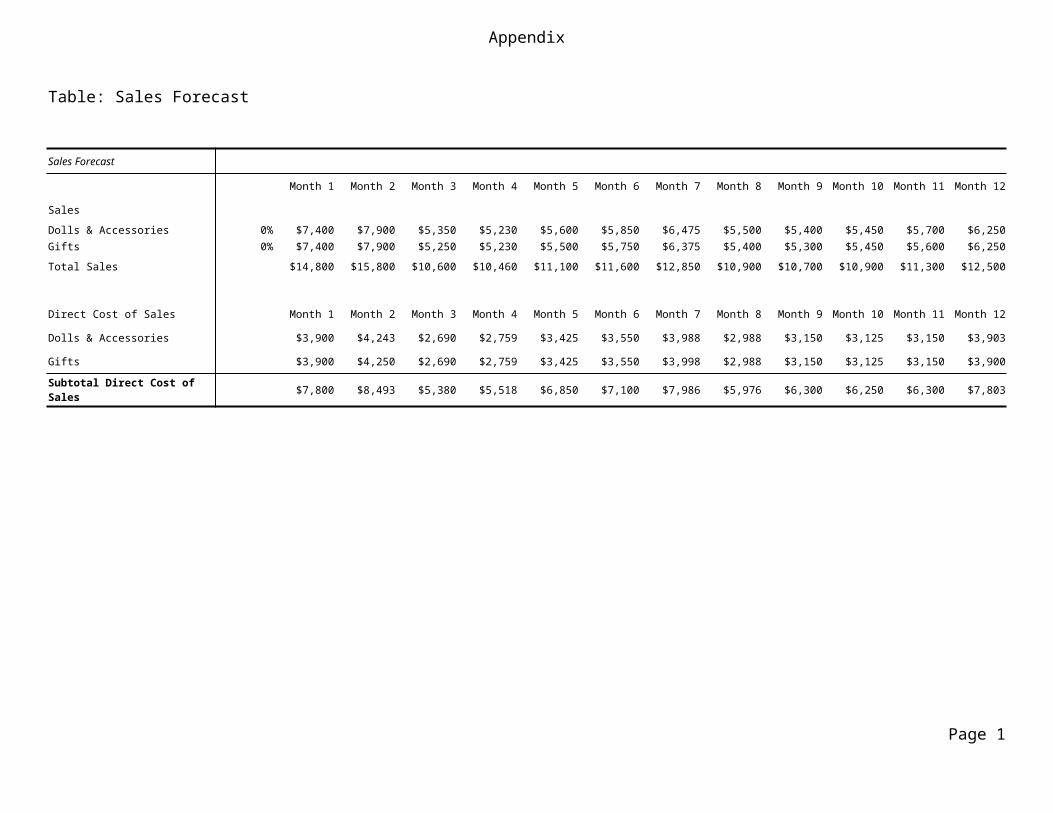
Table: Sales Forecast
Sales Forecast
Month 1 Month 2 Month 3 Month 4 Month 5 Month 6 Month 7 Month 8 Month 9 Month 10 Month 11 Month 12SalesDolls & Accessories 0% $7,400 $7,900 $5,350 $5,230 $5,600 $5,850 $6,475 $5,500 $5,400 $5,450 $5,700 $6,250 Gifts 0% $7,400 $7,900 $5,250 $5,230 $5,500 $5,750 $6,375 $5,400 $5,300 $5,450 $5,600 $6,250 Total Sales $14,800 $15,800 $10,600 $10,460 $11,100 $11,600 $12,850 $10,900 $10,700 $10,900 $11,300 $12,500
Direct Cost of Sales Month 1 Month 2 Month 3 Month 4 Month 5 Month 6 Month 7 Month 8 Month 9 Month 10 Month 11 Month 12Dolls & Accessories $3,900 $4,243 $2,690 $2,759 $3,425 $3,550 $3,988 $2,988 $3,150 $3,125 $3,150 $3,903 Gifts $3,900 $4,250 $2,690 $2,759 $3,425 $3,550 $3,998 $2,988 $3,150 $3,125 $3,150 $3,900 Subtotal Direct Cost of Sales $7,800 $8,493 $5,380 $5,518 $6,850 $7,100 $7,986 $5,976 $6,300 $6,250 $6,300 $7,803
Page 1
Appendix
Table: Personnel
Personnel Plan
Month 1 Month 2 Month 3 Month 4 Month 5 Month 6 Month 7 Month 8 Month 9 Month 10 Month 11 Month 12Brenda Owner/Manager-Sales & Merchandising 0% $1,200 $1,200 $1,200 $1,200 $1,200 $1,200 $1,200 $1,200 $1,200 $1,200 $1,300 $1,300 Charles Owner/Manager-Operations & Finance 0% $0 $0 $900 $900 $900 $900 $900 $900 $900 $900 $900 $900 Part-Time as Needed ($7 per hour) 0% $280 $560 $0 $0 $0 $300 $300 $320 $320 $320 $320 $400
Total People 3 3 2 2 2 3 3 3 3 3 3 3
Total Payroll $1,480 $1,760 $2,100 $2,100 $2,100 $2,400 $2,400 $2,420 $2,420 $2,420 $2,520 $2,600
Page 2
Appendix
Table: Profit and Loss
Pro Forma Profit and Loss
Month 1 Month 2 Month 3 Month 4 Month 5 Month 6 Month 7 Month 8 Month 9 Month 10 Month 11 Month 12Sales $14,800 $15,800 $10,600 $10,460 $11,100 $11,600 $12,850 $10,900 $10,700 $10,900 $11,300 $12,500 Direct Cost of Sales $7,800 $8,493 $5,380 $5,518 $6,850 $7,100 $7,986 $5,976 $6,300 $6,250 $6,300 $7,803 Other Costs of Goods $0 $0 $0 $0 $0 $0 $0 $0 $0 $0 $0 $0 Total Cost of Sales $7,800 $8,493 $5,380 $5,518 $6,850 $7,100 $7,986 $5,976 $6,300 $6,250 $6,300 $7,803
Gross Margin $7,000 $7,307 $5,220 $4,942 $4,250 $4,500 $4,864 $4,924 $4,400 $4,650 $5,000 $4,697 Gross Margin % 47.30% 46.25% 49.25% 47.25% 38.29% 38.79% 37.85% 45.17% 41.12% 42.66% 44.25% 37.58%
ExpensesPayroll $1,480 $1,760 $2,100 $2,100 $2,100 $2,400 $2,400 $2,420 $2,420 $2,420 $2,520 $2,600 Sales and Marketing and Other Expenses $0 $0 $0 $0 $0 $0 $0 $0 $0 $0 $300 $300
Depreciation $0 $0 $0 $0 $0 $0 $0 $0 $0 $0 $0 $0 Rent and CAM Expense $0 $1,650 $1,650 $1,650 $1,650 $1,650 $1,650 $1,650 $1,650 $1,650 $1,650 $1,650 Utilities $300 $300 $300 $300 $300 $300 $300 $300 $300 $300 $300 $300 Liability Insurance:Store $0 $0 $0 $0 $0 $0 $0 $0 $0 $0 $0 $0 Insurance (medical Brenda & Charles) $650 $650 $650 $650 $650 $650 $650 $650 $650 $650 $650 $650 Payroll Taxes 15% $0 $0 $0 $0 $0 $0 $0 $0 $0 $0 $0 $0 Other $0 $0 $0 $0 $0 $0 $0 $0 $0 $0 $0 $0
Total Operating Expenses $2,430 $4,360 $4,700 $4,700 $4,700 $5,000 $5,000 $5,020 $5,020 $5,020 $5,420 $5,500
Profit Before Interest and Taxes $4,570 $2,947 $520 $242 ($450) ($500) ($136) ($96) ($620) ($370) ($420) ($803)
EBITDA $4,570 $2,947 $520 $242 ($450) ($500) ($136) ($96) ($620) ($370) ($420) ($803) Interest Expense $287 $283 $278 $274 $270 $265 $261 $256 $252 $248 $243 $239
Page 3
Appendix
Taxes Incurred $1,285 $799 $72 ($10) ($216) ($230) ($119) ($106) ($262) ($185) ($199) ($313)
Net Profit $2,998 $1,865 $169 ($22) ($504) ($536) ($278) ($247) ($610) ($432) ($464) ($729)Net Profit/Sales 20.26% 11.80% 1.60% -0.21% -4.54% -4.62% -2.16% -2.26% -5.70% -3.97% -4.11% -5.83%
Page 4
Appendix
Table: Cash Flow
Pro Forma Cash Flow
Month 1 Month 2 Month 3 Month 4 Month 5 Month 6 Month 7 Month 8 Month 9 Month 10 Month 11 Month 12Cash Received
Cash from OperationsCash Sales $14,800 $15,800 $10,600 $10,460 $11,100 $11,600 $12,850 $10,900 $10,700 $10,900 $11,300 $12,500 Subtotal Cash from Operations $14,800 $15,800 $10,600 $10,460 $11,100 $11,600 $12,850 $10,900 $10,700 $10,900 $11,300 $12,500
Additional Cash ReceivedSales Tax, VAT, HST/GST Received 0.00% $0 $0 $0 $0 $0 $0 $0 $0 $0 $0 $0 $0
New Current Borrowing $0 $0 $0 $0 $0 $0 $0 $0 $0 $0 $0 $0 New Other Liabilities (interest-free) $0 $0 $0 $0 $0 $0 $0 $0 $0 $0 $0 $0
New Long-term Liabilities $0 $0 $0 $0 $0 $0 $0 $0 $0 $0 $0 $0 Sales of Other Current Assets $0 $0 $0 $0 $0 $0 $0 $0 $0 $0 $0 $0 Sales of Long-term Assets $0 $0 $0 $0 $0 $0 $0 $0 $0 $0 $0 $0 New Investment Received $0 $0 $0 $0 $0 $0 $0 $0 $0 $0 $0 $0 Subtotal Cash Received $14,800 $15,800 $10,600 $10,460 $11,100 $11,600 $12,850 $10,900 $10,700 $10,900 $11,300 $12,500
Expenditures Month 1 Month 2 Month 3 Month 4 Month 5 Month 6 Month 7 Month 8 Month 9 Month 10 Month 11 Month 12
Expenditures from OperationsCash Spending $1,480 $1,760 $2,100 $2,100 $2,100 $2,400 $2,400 $2,420 $2,420 $2,420 $2,520 $2,600 Bill Payments $344 $10,384 $12,047 $8,333 $8,420 $9,511 $9,769 $10,661 $8,732 $8,891 $8,923 $9,290 Subtotal Spent on Operations $1,824 $12,144 $14,147 $10,433 $10,520 $11,911 $12,169 $13,081 $11,152 $11,311 $11,443 $11,890
Additional Cash SpentSales Tax, VAT, HST/GST Paid Out $0 $0 $0 $0 $0 $0 $0 $0 $0 $0 $0 $0
Page 5
Appendix
Principal Repayment of Current Borrowing $0 $0 $0 $0 $0 $0 $0 $0 $0 $0 $0 $0 Other Liabilities Principal Repayment $0 $0 $0 $0 $0 $0 $0 $0 $0 $0 $0 $0 Long-term Liabilities Principal Repayment $755 $755 $755 $755 $755 $755 $755 $755 $755 $755 $755 $755
Purchase Other Current Assets $0 $0 $0 $0 $0 $0 $0 $0 $0 $0 $0 $0 Purchase Long-term Assets $0 $0 $0 $0 $0 $0 $0 $0 $0 $0 $0 $0 Dividends $0 $0 $0 $0 $0 $0 $0 $0 $0 $0 $0 $0 Subtotal Cash Spent $2,579 $12,899 $14,902 $11,188 $11,275 $12,666 $12,924 $13,836 $11,907 $12,066 $12,198 $12,645
Net Cash Flow $12,221 $2,901 ($4,302) ($728) ($175) ($1,066) ($74) ($2,936) ($1,207) ($1,166) ($898) ($145)Cash Balance $69,406 $72,307 $68,005 $67,277 $67,103 $66,036 $65,962 $63,026 $61,819 $60,653 $59,755 $59,609
Page 6
Appendix
Table: Balance Sheet
Pro Forma Balance Sheet
Month 1 Month 2 Month 3 Month 4 Month 5 Month 6 Month 7 Month 8 Month 9 Month 10 Month 11 Month 12
Assets Starting Balances
Current AssetsCash $57,185 $69,406 $72,307 $68,005 $67,277 $67,103 $66,036 $65,962 $63,026 $61,819 $60,653 $59,755 $59,609 Other Current Assets $12,757 $12,757 $12,757 $12,757 $12,757 $12,757 $12,757 $12,757 $12,757 $12,757 $12,757 $12,757 $12,757 Total Current Assets $69,942 $82,163 $85,064 $80,762 $80,034 $79,860 $78,793 $78,719 $75,783 $74,576 $73,410 $72,512 $72,366
Long-term AssetsLong-term Assets $0 $0 $0 $0 $0 $0 $0 $0 $0 $0 $0 $0 $0 Accumulated Depreciation $0 $0 $0 $0 $0 $0 $0 $0 $0 $0 $0 $0 $0 Total Long-term Assets $0 $0 $0 $0 $0 $0 $0 $0 $0 $0 $0 $0 $0 Total Assets $69,942 $82,163 $85,064 $80,762 $80,034 $79,860 $78,793 $78,719 $75,783 $74,576 $73,410 $72,512 $72,366
Liabilities and Capital Month 1 Month 2 Month 3 Month 4 Month 5 Month 6 Month 7 Month 8 Month 9 Month 10 Month 11 Month 12
Current LiabilitiesAccounts Payable $0 $9,978 $11,769 $8,053 $8,103 $9,187 $9,411 $10,370 $8,436 $8,594 $8,615 $8,936 $10,275 Current Borrowing $0 $0 $0 $0 $0 $0 $0 $0 $0 $0 $0 $0 $0 Other Current Liabilities $0 $0 $0 $0 $0 $0 $0 $0 $0 $0 $0 $0 $0 Subtotal Current Liabilities $0 $9,978 $11,769 $8,053 $8,103 $9,187 $9,411 $10,370 $8,436 $8,594 $8,615 $8,936 $10,275
Long-term Liabilities $50,000 $49,245 $48,490 $47,735 $46,980 $46,225 $45,470 $44,715 $43,960 $43,205 $42,450 $41,695 $40,940 Total Liabilities $50,000 $59,223 $60,259 $55,788 $55,083 $55,412 $54,881 $55,085 $52,396 $51,799 $51,065 $50,631 $51,215
Paid-in Capital $40,000 $40,000 $40,000 $40,000 $40,000 $40,000 $40,000 $40,000 $40,000 $40,000 $40,000 $40,000 $40,000 Retained Earnings ($20,058) ($20,058) ($20,058) ($20,058) ($20,058) ($20,058) ($20,058) ($20,058) ($20,058) ($20,058) ($20,058) ($20,058) ($20,058)Earnings $0 $2,998 $4,863 $5,032 $5,009 $4,506 $3,970 $3,692 $3,446 $2,835 $2,403 $1,939 $1,209 Total Capital $19,942 $22,940 $24,805 $24,974 $24,951 $24,448 $23,912 $23,634 $23,388 $22,777 $22,345 $21,881 $21,151 Total Liabilities and Capital $69,942 $82,163 $85,064 $80,762 $80,034 $79,860 $78,793 $78,719 $75,783 $74,576 $73,410 $72,512 $72,366
Net Worth $19,942 $22,940 $24,805 $24,974 $24,951 $24,448 $23,912 $23,634 $23,388 $22,777 $22,345 $21,881 $21,151
Page 7