Embed Size (px)
Citation preview
A data intensive future: how can biology best take
advantage of the coming data deluge?
C. Titus Brown
Associate Professor, UC Davis
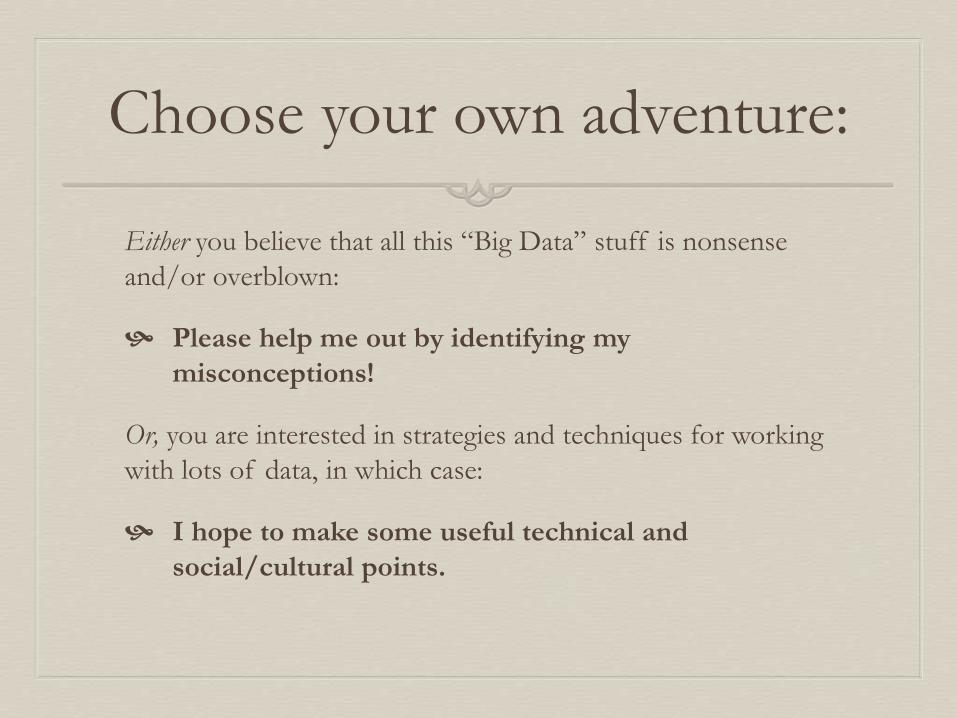
Choose your own adventure:
Either you believe that all this “Big Data” stuff is nonsense
and/or overblown:
Please help me out by identifying my
misconceptions!
Or, you are interested in strategies and techniques for working
with lots of data, in which case:
I hope to make some useful technical and
social/cultural points.
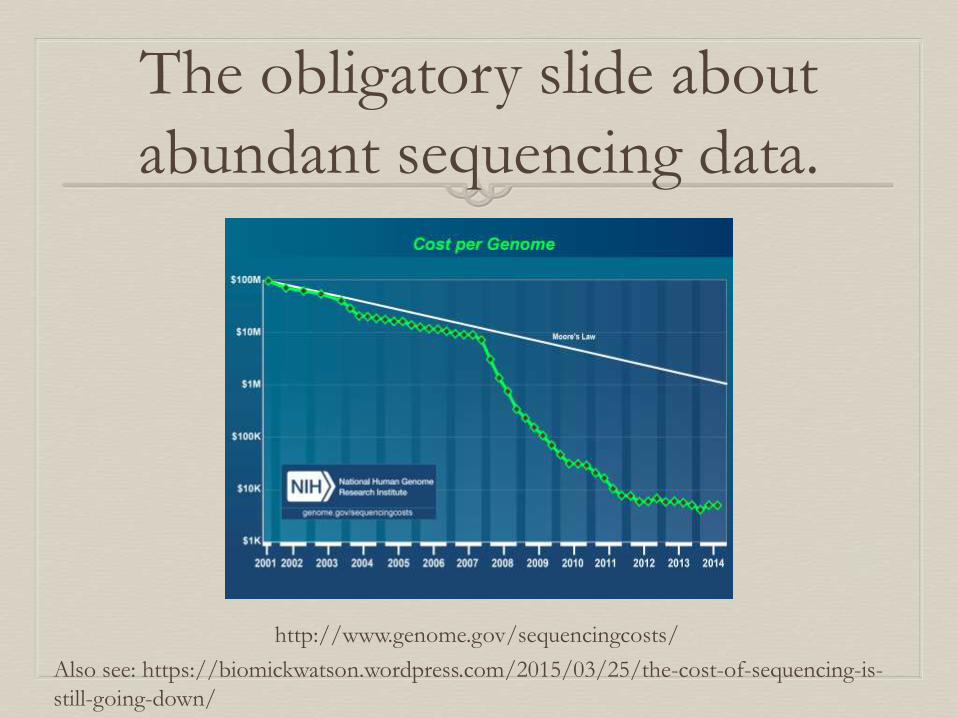
The obligatory slide about
abundant sequencing data.
http://www.genome.gov/sequencingcosts/
Also see: https://biomickwatson.wordpress.com/2015/03/25/the-cost-of-sequencing-is-
still-going-down/
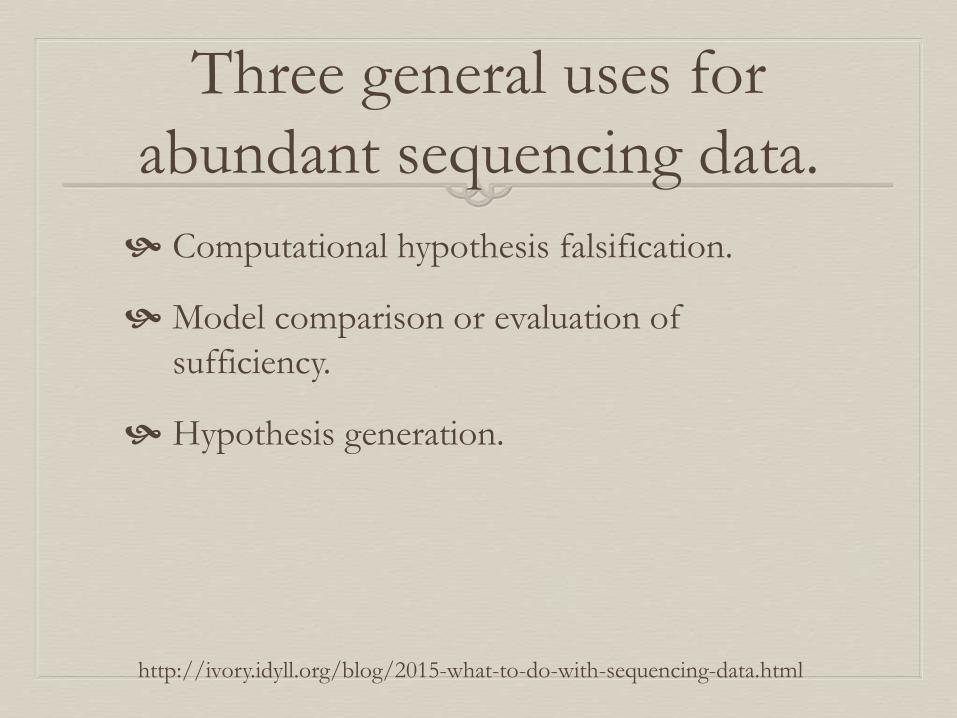
Three general uses for
abundant sequencing data.
Computational hypothesis falsification.
Model comparison or evaluation of
sufficiency.
Hypothesis generation.
http://ivory.idyll.org/blog/2015-what-to-do-with-sequencing-data.html
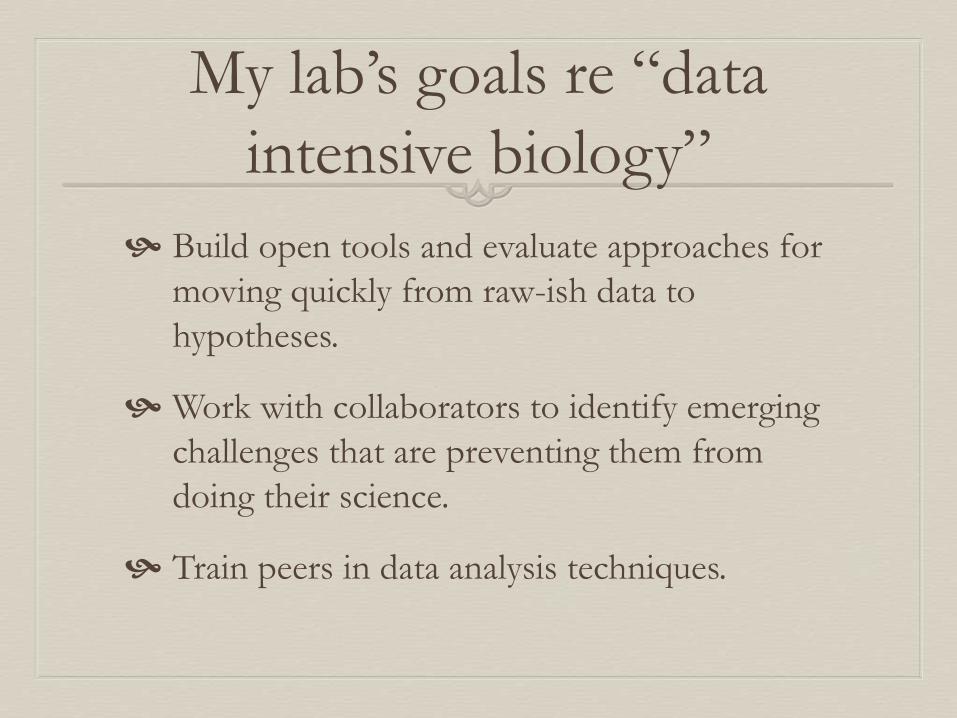
My lab’s goals re “data
intensive biology”
Build open tools and evaluate approaches for
moving quickly from raw-ish data to
hypotheses.
Work with collaborators to identify emerging
challenges that are preventing them from
doing their science.
Train peers in data analysis techniques.
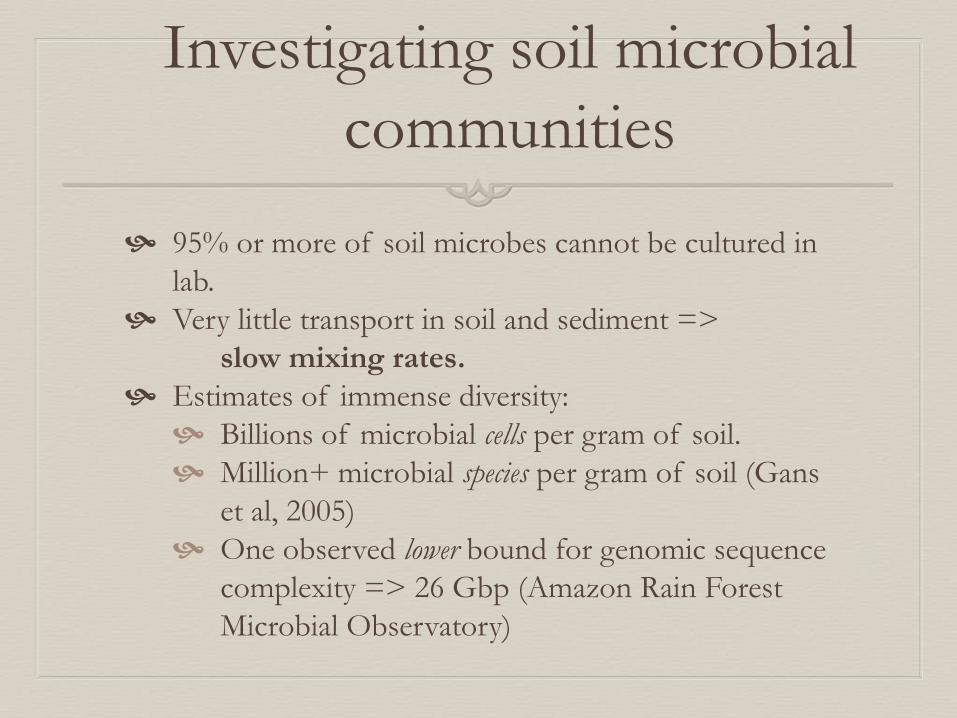
Investigating soil microbial
communities
95% or more of soil microbes cannot be cultured in
lab.
Very little transport in soil and sediment =>
slow mixing rates.
Estimates of immense diversity:
Billions of microbial cells per gram of soil.
Million+ microbial species per gram of soil (Gans
et al, 2005)
One observed lower bound for genomic sequence
complexity => 26 Gbp (Amazon Rain Forest
Microbial Observatory)
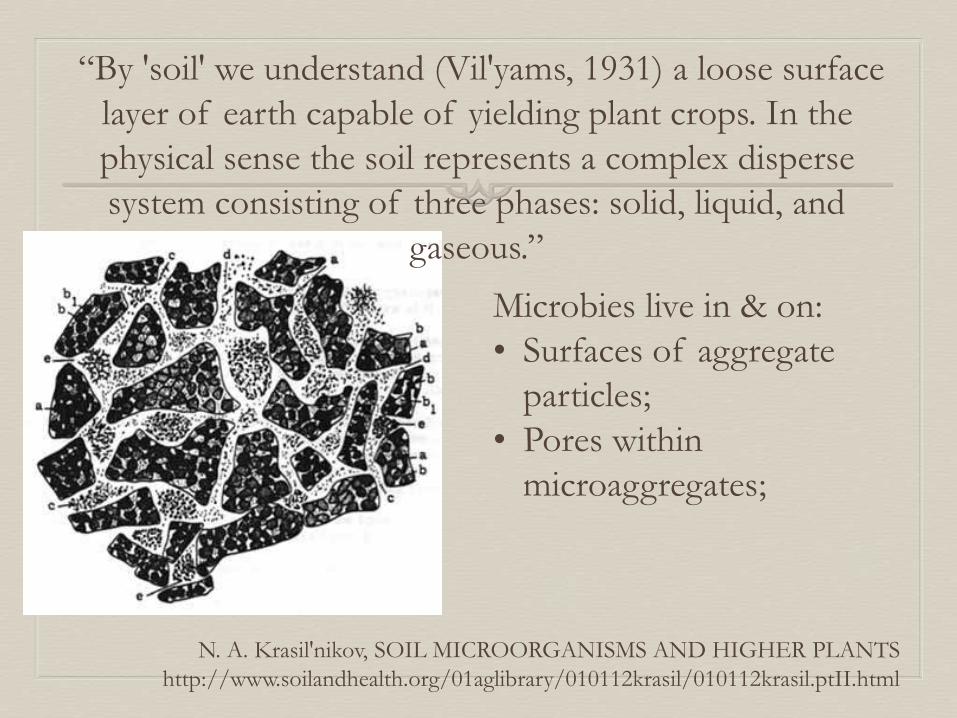
N. A. Krasil'nikov, SOIL MICROORGANISMS AND HIGHER PLANTS
http://www.soilandhealth.org/01aglibrary/010112krasil/010112krasil.ptII.html
“By 'soil' we understand (Vil'yams, 1931) a loose surface
layer of earth capable of yielding plant crops. In the
physical sense the soil represents a complex disperse
system consisting of three phases: solid, liquid, and
gaseous.”
Microbies live in & on:
• Surfaces of aggregate
particles;
• Pores within
microaggregates;

Questions to address
Role of soil microbes in nutrient cycling:
How does agricultural soil differ from native soil?
How do soil microbial communities respond to
climate perturbation?
Genome-level questions:
What kind of strain-level heterogeneity is present
in the population?
What are the phage and viral populations &
dynamic?
What species are where, and how much is shared
between different geographical locations?
Must use culture
independent approaches Many reasons why you can’t or don’t want to
culture: cross-feeding, niche specificity, dormancy,
etc.
If you want to get at underlying function, 16s
analysis alone is not sufficient.
Single-cell sequencing & shotgun metagenomics
are two common ways to investigate complex
microbial communities.

Shotgun metagenomics
Collect samples;
Extract DNA;
Feed into sequencer;
Computationally analyze.
Wikipedia: Environmental shotgun
sequencing.png
“Sequence it all and let the
bioinformaticians sort it out”
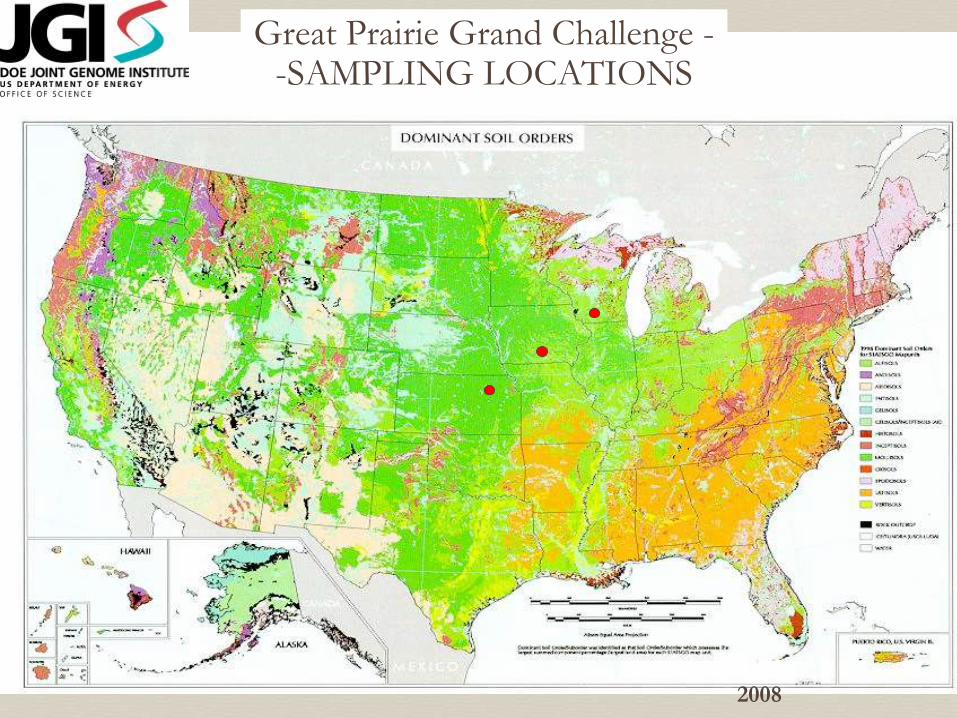
Great Prairie Grand Challenge --SAMPLING LOCATIONS
2008
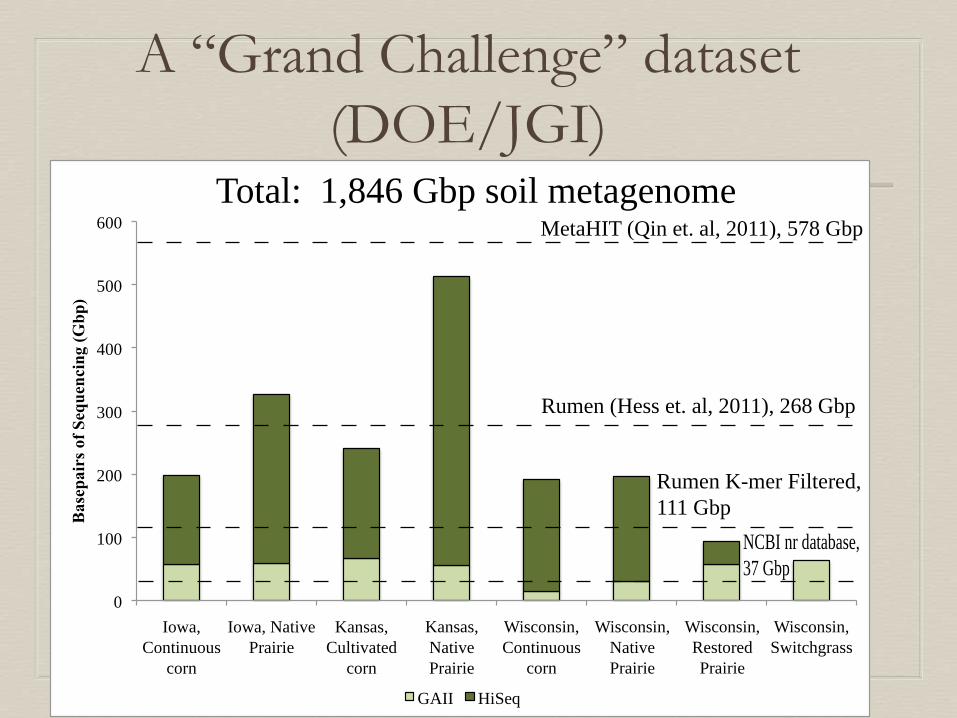
A “Grand Challenge” dataset
(DOE/JGI)
0
100
200
300
400
500
600
Iowa,
Continuous
corn
Iowa, Native
Prairie
Kansas,
Cultivated
corn
Kansas,
Native
Prairie
Wisconsin,
Continuous
corn
Wisconsin,
Native
Prairie
Wisconsin,
Restored
Prairie
Wisconsin,
Switchgrass
Ba
sep
air
s of
Seq
uen
cin
g (
Gb
p)
GAII HiSeq
Rumen (Hess et. al, 2011), 268 Gbp
MetaHIT (Qin et. al, 2011), 578 Gbp
NCBI nr database,
37 Gbp
Total: 1,846 Gbp soil metagenome
Rumen K-mer Filtered,
111 Gbp
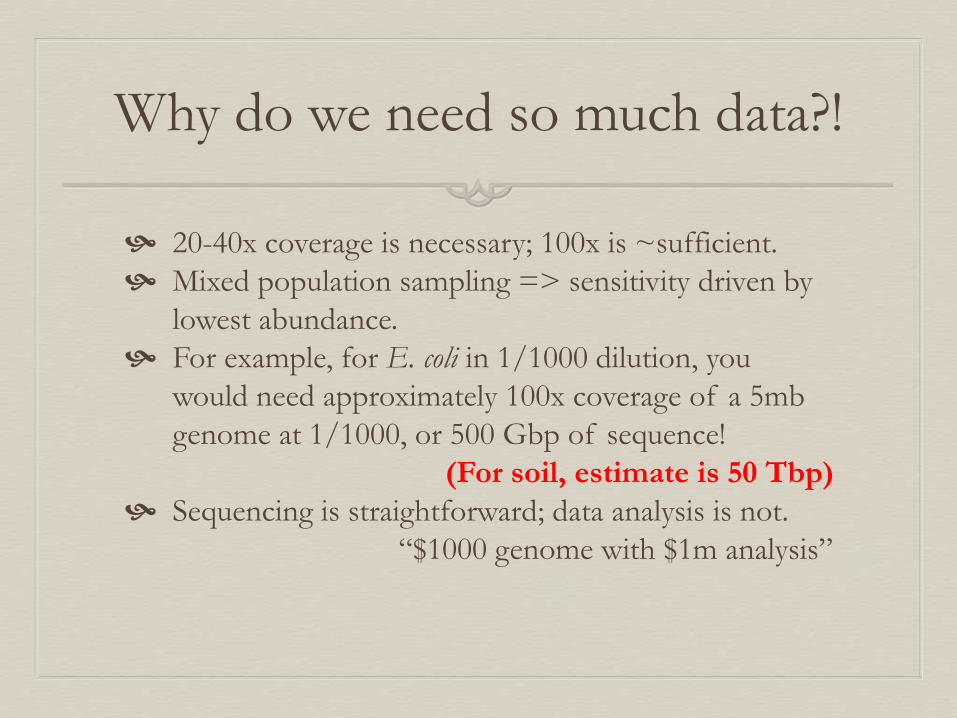
Why do we need so much data?!
20-40x coverage is necessary; 100x is ~sufficient.
Mixed population sampling => sensitivity driven by
lowest abundance.
For example, for E. coli in 1/1000 dilution, you
would need approximately 100x coverage of a 5mb
genome at 1/1000, or 500 Gbp of sequence!
(For soil, estimate is 50 Tbp)
Sequencing is straightforward; data analysis is not.
“$1000 genome with $1m analysis”
Great Prairie Grand
Challenge - goals
How much of the source metagenome can we reconstruct
from ~300-600 Gbp+ of shotgun sequencing? (Largest
data set ever sequenced, ~2010.)
What can we learn about soil from looking at the
reconstructed metagenome? (See list of questions)
Great Prairie Grand
Challenge - goals
How much of the source metagenome can we reconstruct
from ~300-600 Gbp+ of shotgun sequencing? (Largest
data set ever sequenced, ~2010.)
What can we learn about soil from looking at the
reconstructed metagenome? (See list of questions)
(For complex ecological and evolutionary systems, we’re just
starting to get past the first question. More on that later.)
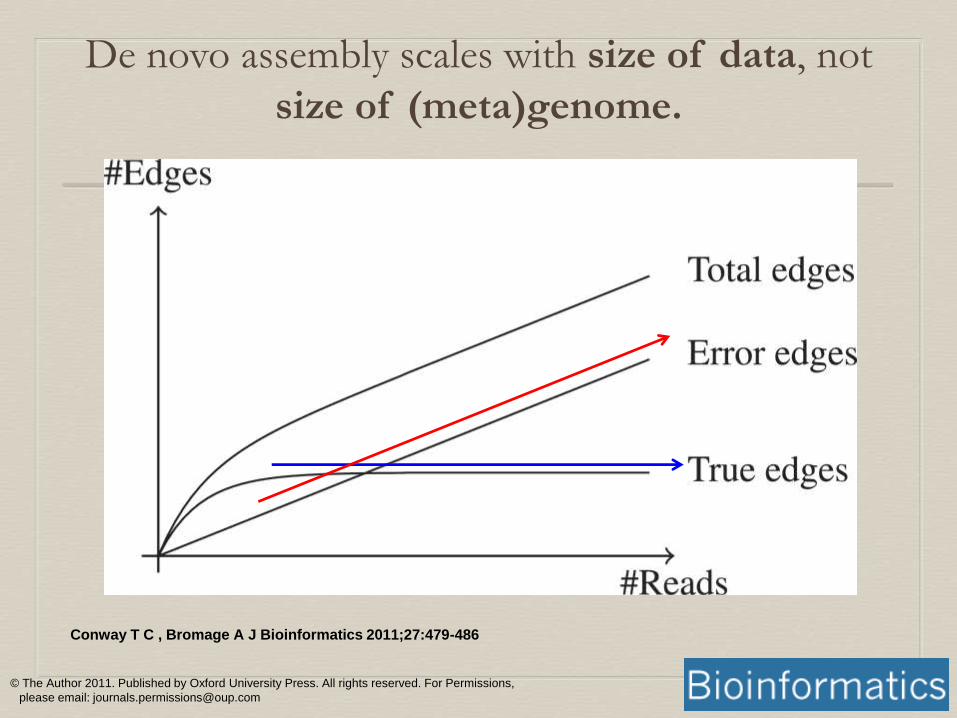
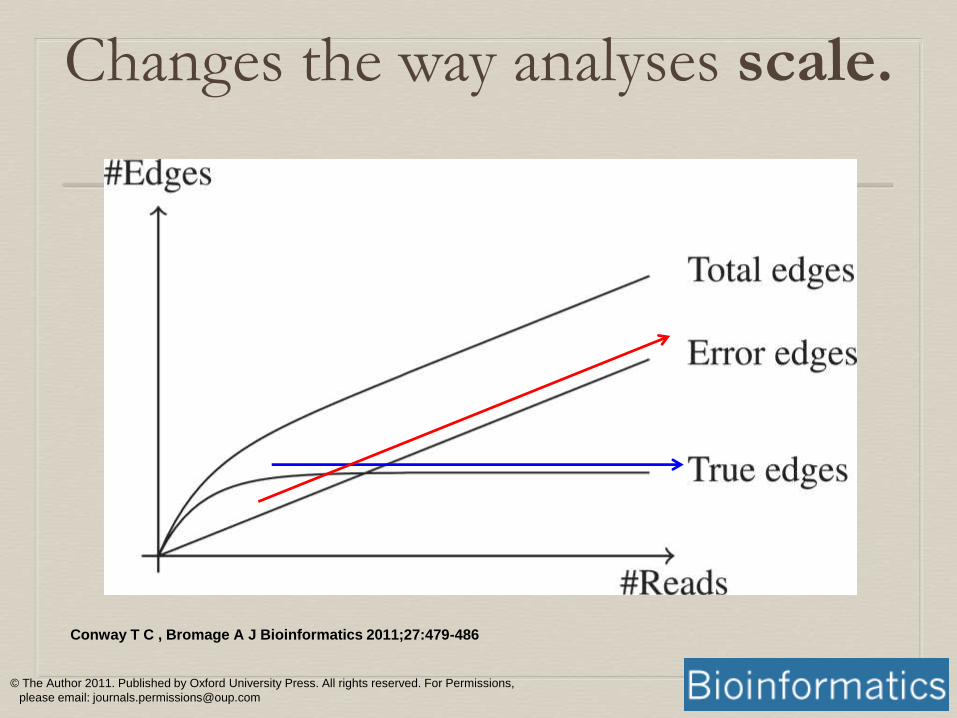
Conway T C , Bromage A J Bioinformatics 2011;27:479-486
© The Author 2011. Published by Oxford University Press. All rights reserved. For Permissions,
please email: [email protected]
De novo assembly scales with size of data, not
size of (meta)genome.
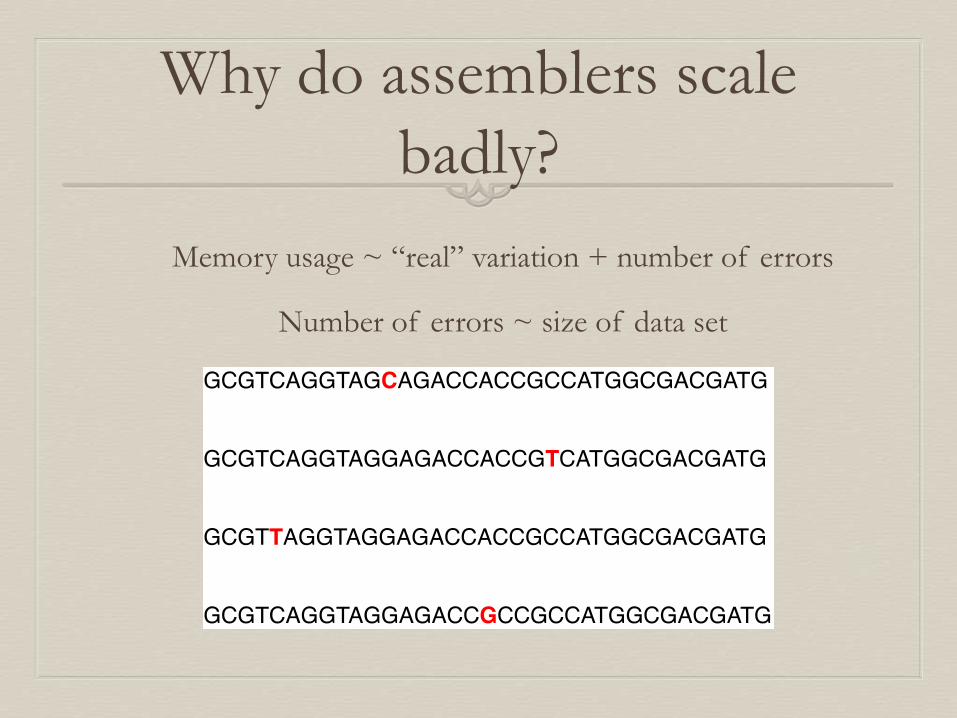
Why do assemblers scale
badly?
Memory usage ~ “real” variation + number of errors
Number of errors ~ size of data set
Our problem, in a nutshell:
We had so much data that we couldn’t
compute on it.
(This was, and is, a common problem in non-
model systems.)
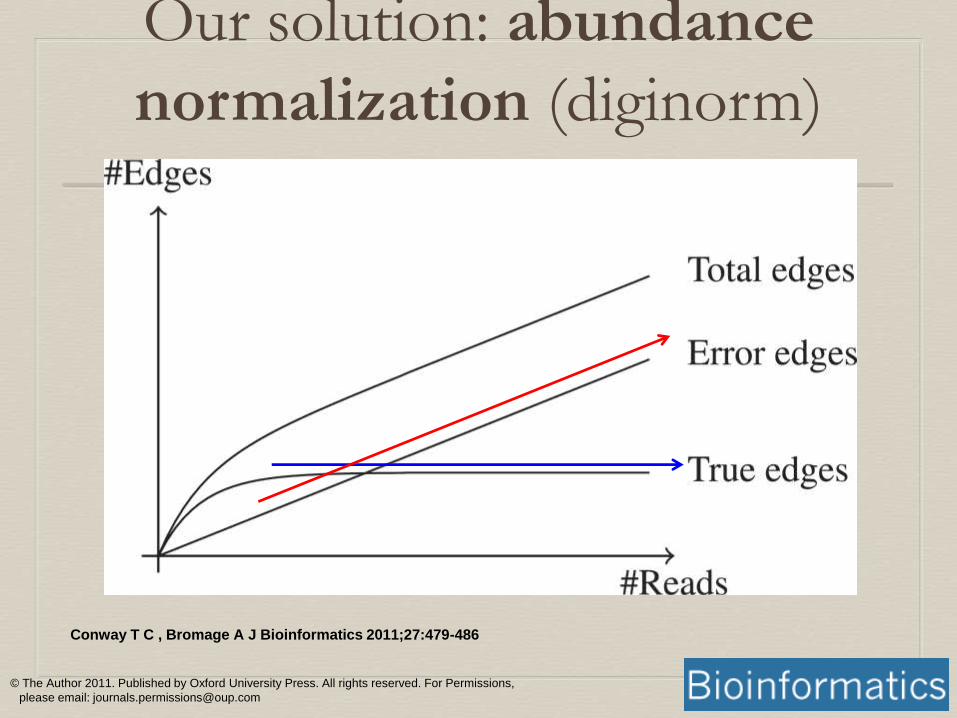
Our solution: abundance
normalization (diginorm)
Conway T C , Bromage A J Bioinformatics 2011;27:479-486
© The Author 2011. Published by Oxford University Press. All rights reserved. For Permissions,
please email: [email protected]
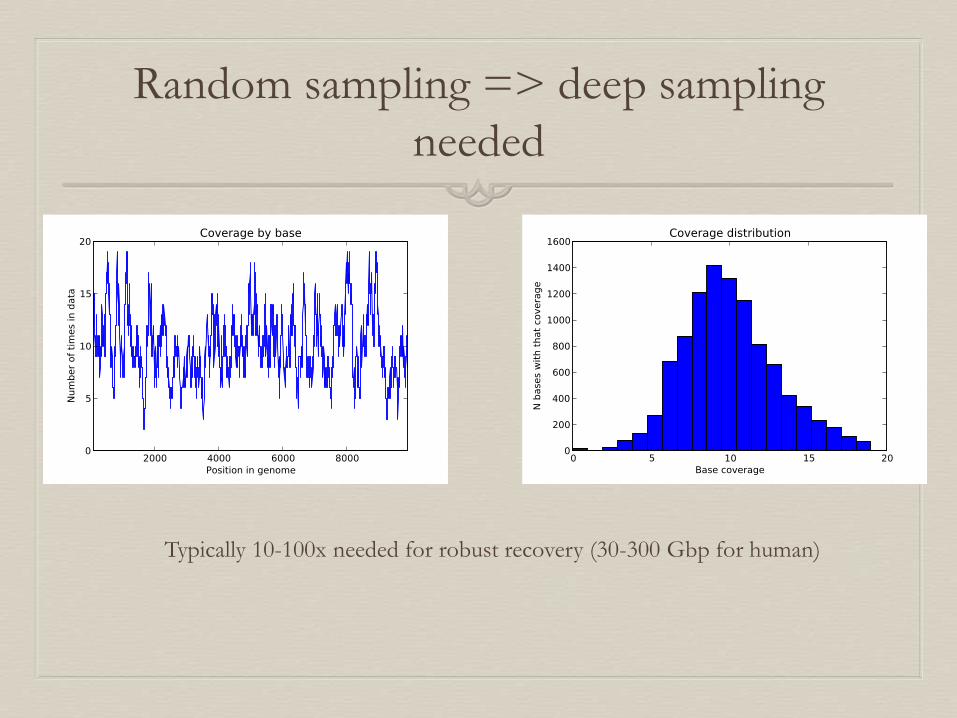
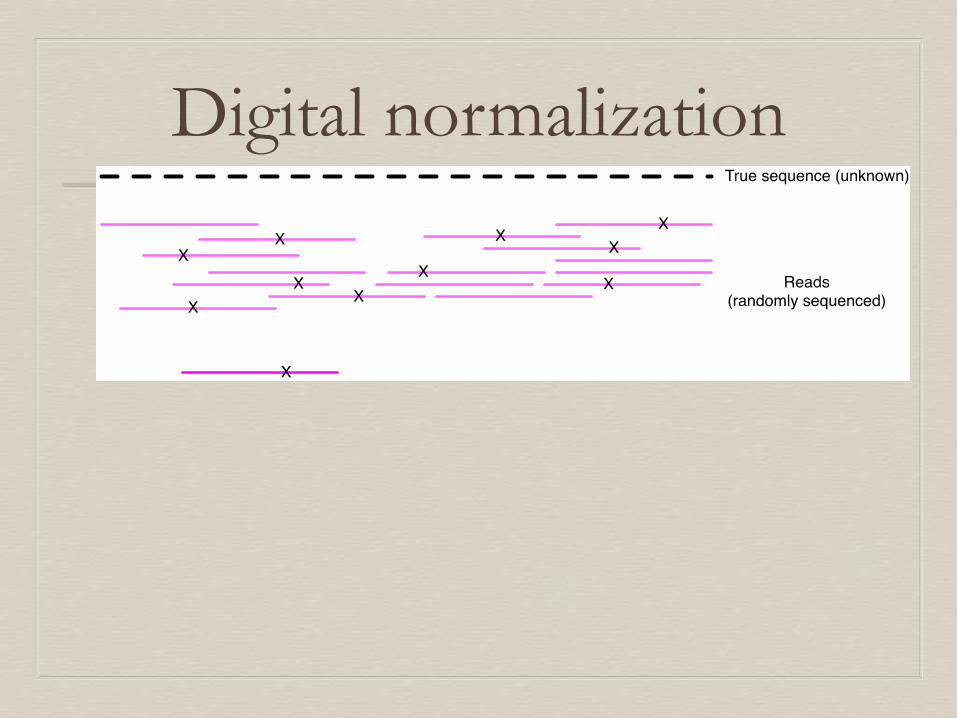
Random sampling => deep sampling
needed
Typically 10-100x needed for robust recovery (30-300 Gbp for human)
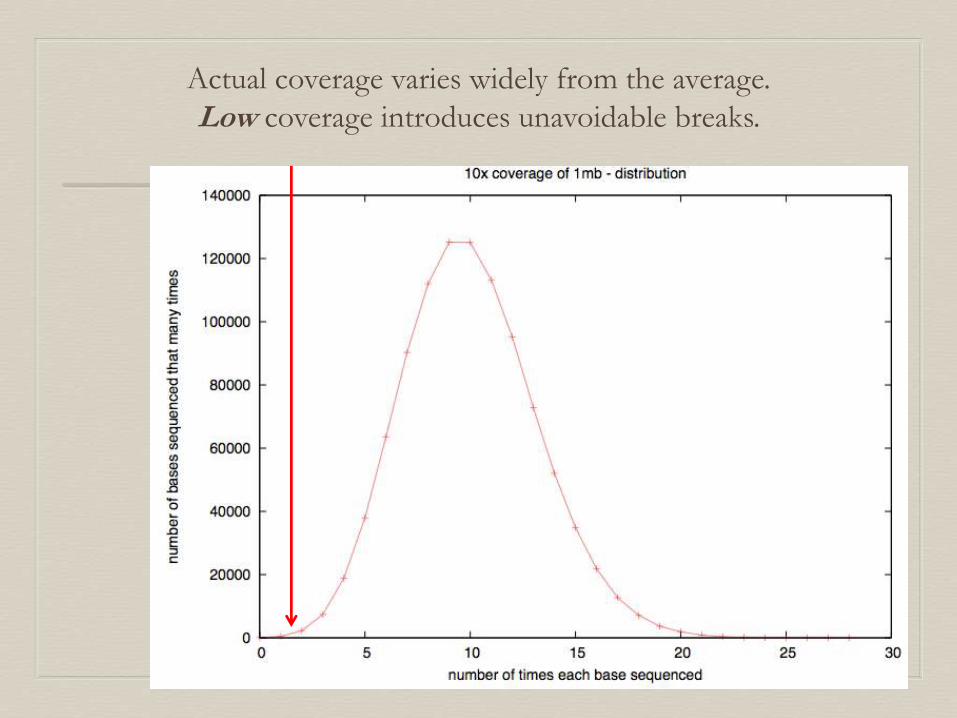
Actual coverage varies widely from the average.
Low coverage introduces unavoidable breaks.
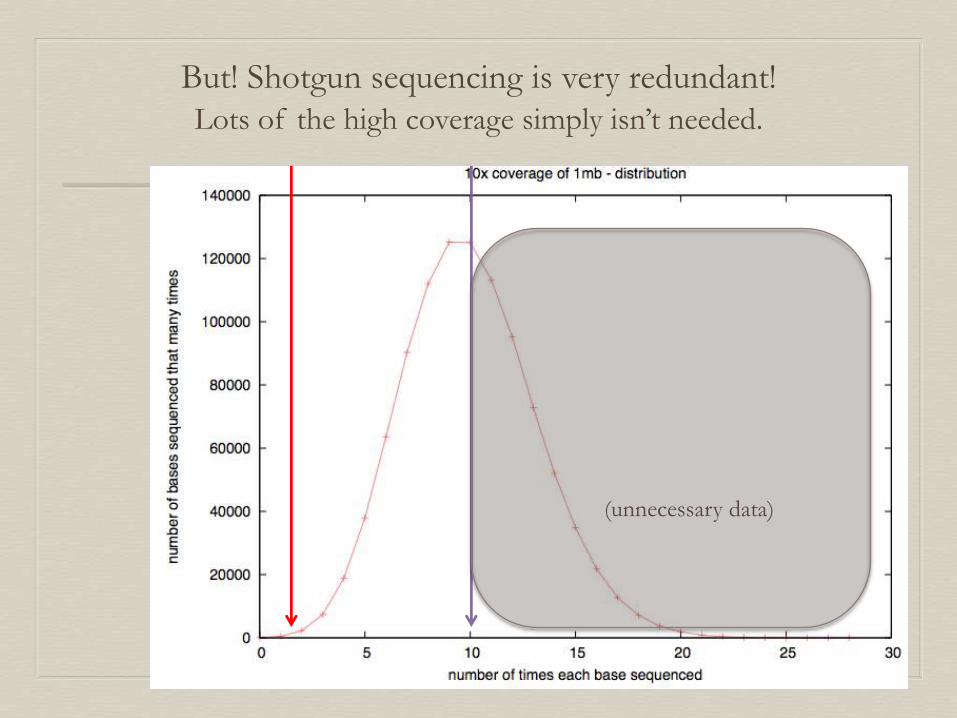
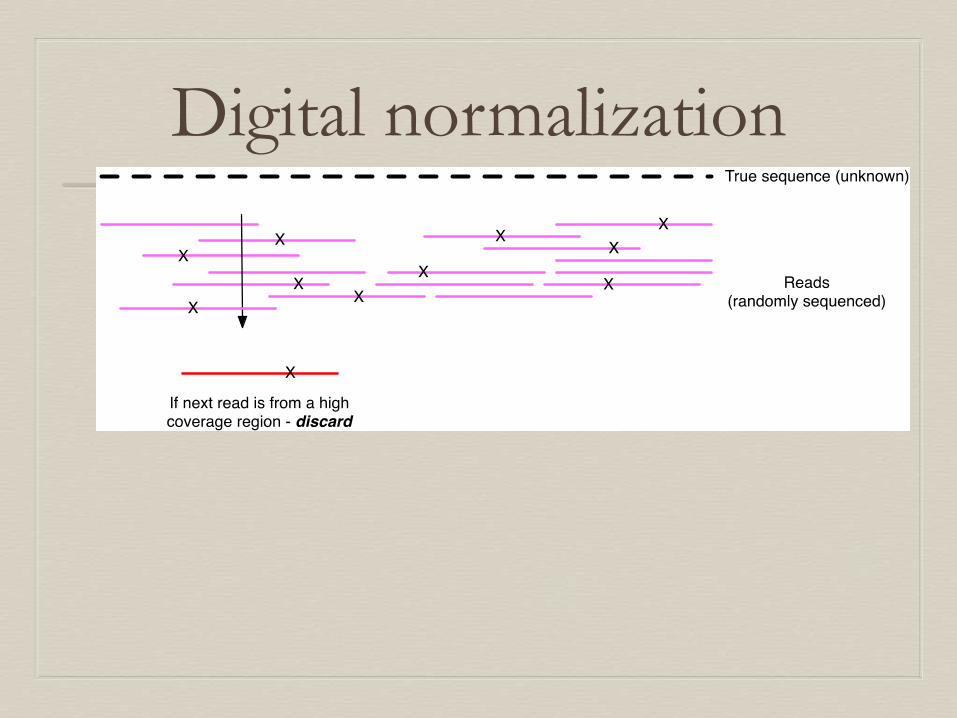
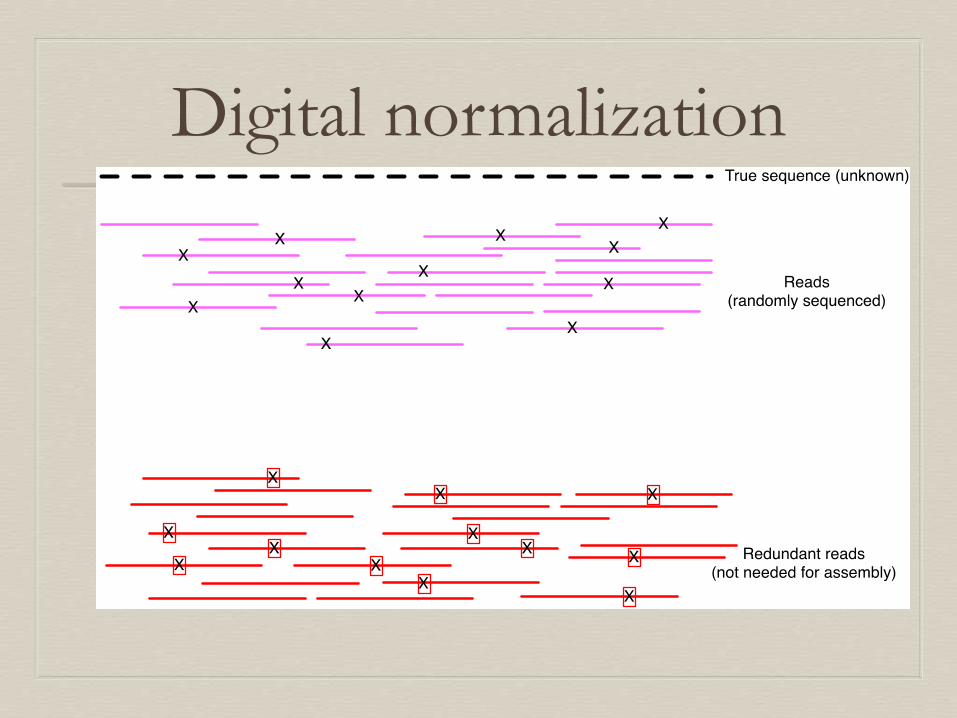
But! Shotgun sequencing is very redundant!
Lots of the high coverage simply isn’t needed.
(unnecessary data)
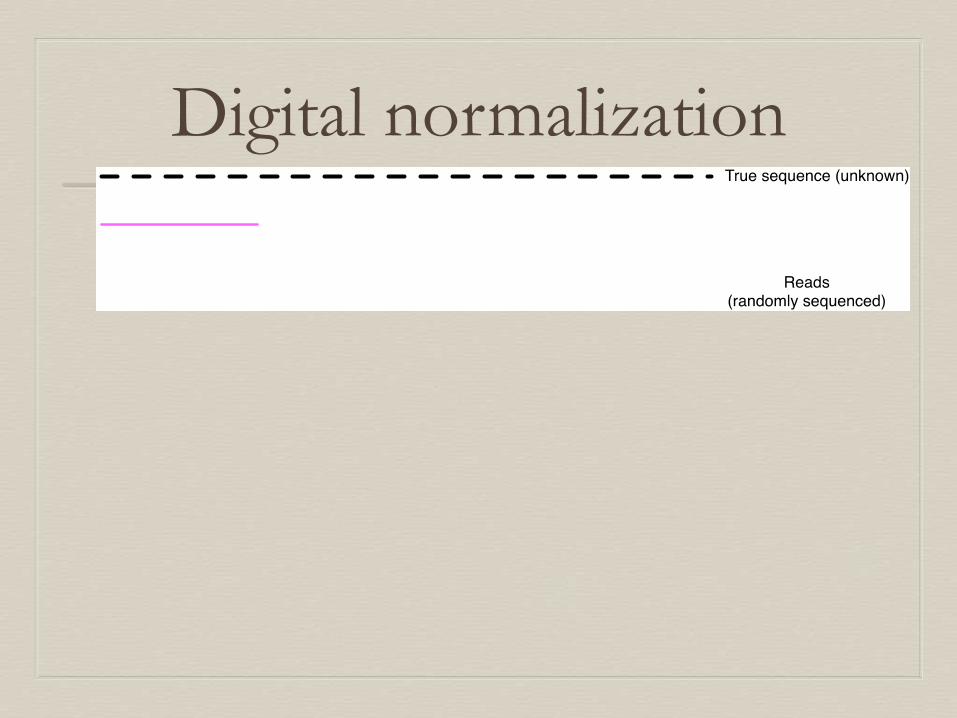
Digital normalization
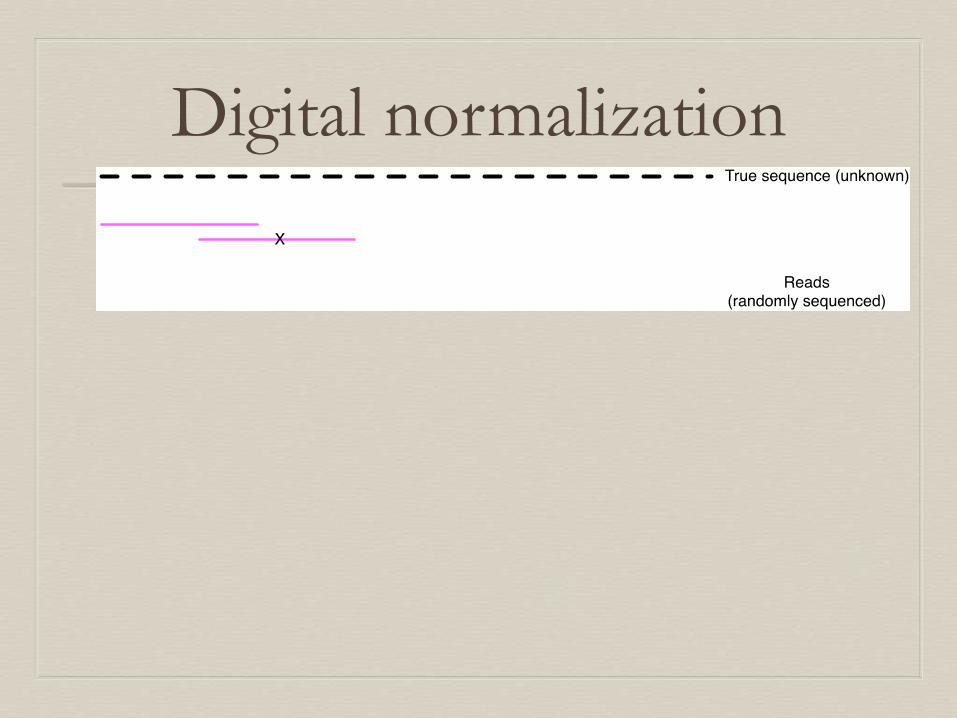
Digital normalization
Digital normalization

Digital normalization
Digital normalization
Digital normalization
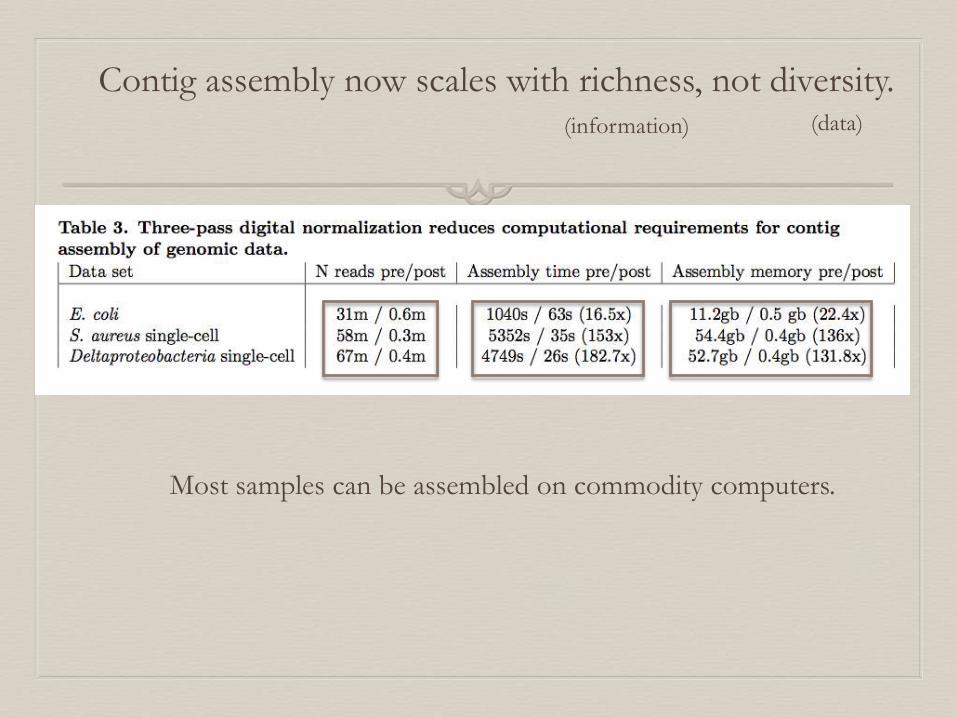
Contig assembly now scales with richness, not diversity.
Most samples can be assembled on commodity computers.
(information) (data)
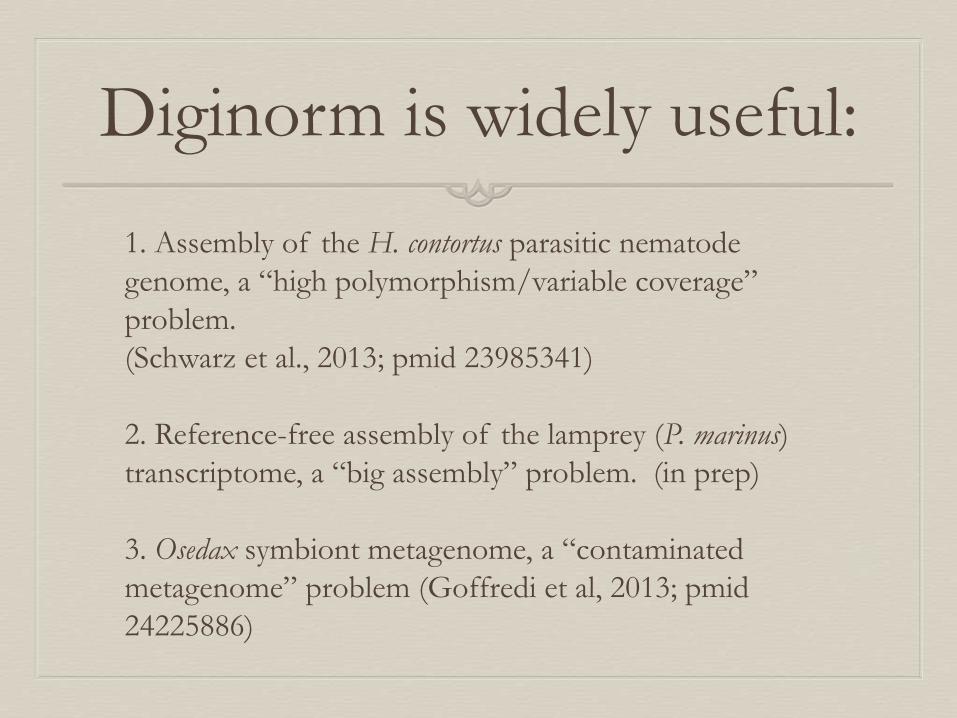
Diginorm is widely useful:
1. Assembly of the H. contortus parasitic nematode
genome, a “high polymorphism/variable coverage”
problem.
(Schwarz et al., 2013; pmid 23985341)
2. Reference-free assembly of the lamprey (P. marinus)
transcriptome, a “big assembly” problem. (in prep)
3. Osedax symbiont metagenome, a “contaminated
metagenome” problem (Goffredi et al, 2013; pmid
24225886)
Changes the way analyses scale.
Conway T C , Bromage A J Bioinformatics 2011;27:479-486
© The Author 2011. Published by Oxford University Press. All rights reserved. For Permissions,
please email: [email protected]

Question: does this approach
negatively affect results? (No.)
370
251
36
13563
3513
7
4 23 8 1
6
5
Diginorm V/O Raw V/O
Diginorm trinity Raw trinity
Evaluation of Molgula occulta transcriptome assembly approaches.
Lowe et al., 2014, https://peerj.com/preprints/505/
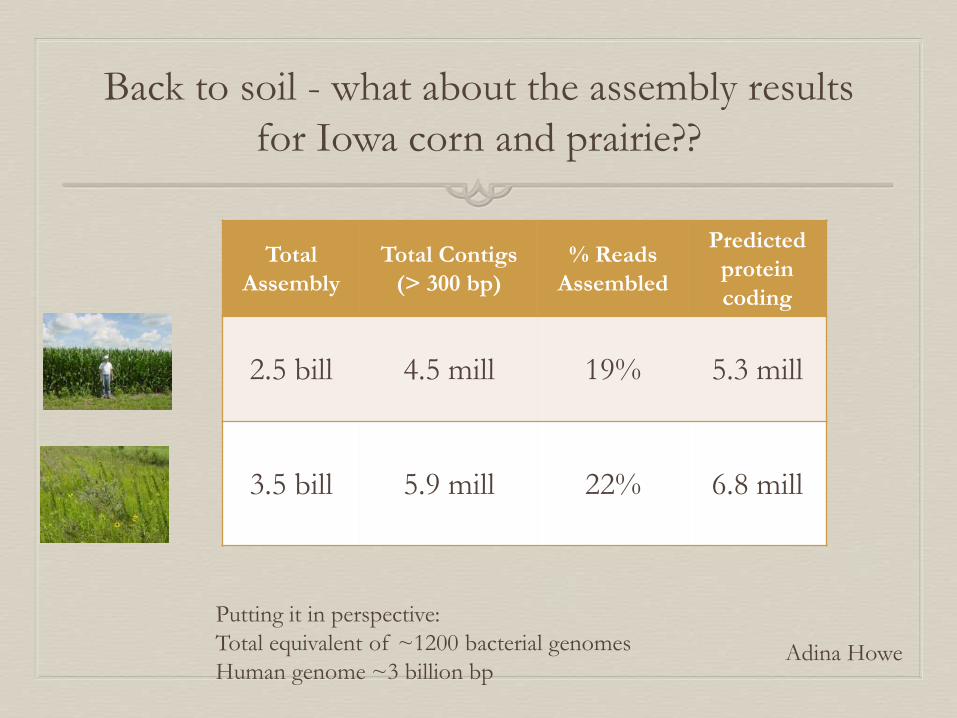
Putting it in perspective:
Total equivalent of ~1200 bacterial genomes
Human genome ~3 billion bp
Back to soil - what about the assembly results
for Iowa corn and prairie??
Total
Assembly
Total Contigs
(> 300 bp)
% Reads
Assembled
Predicted
protein
coding
2.5 bill 4.5 mill 19% 5.3 mill
3.5 bill 5.9 mill 22% 6.8 mill
Adina Howe
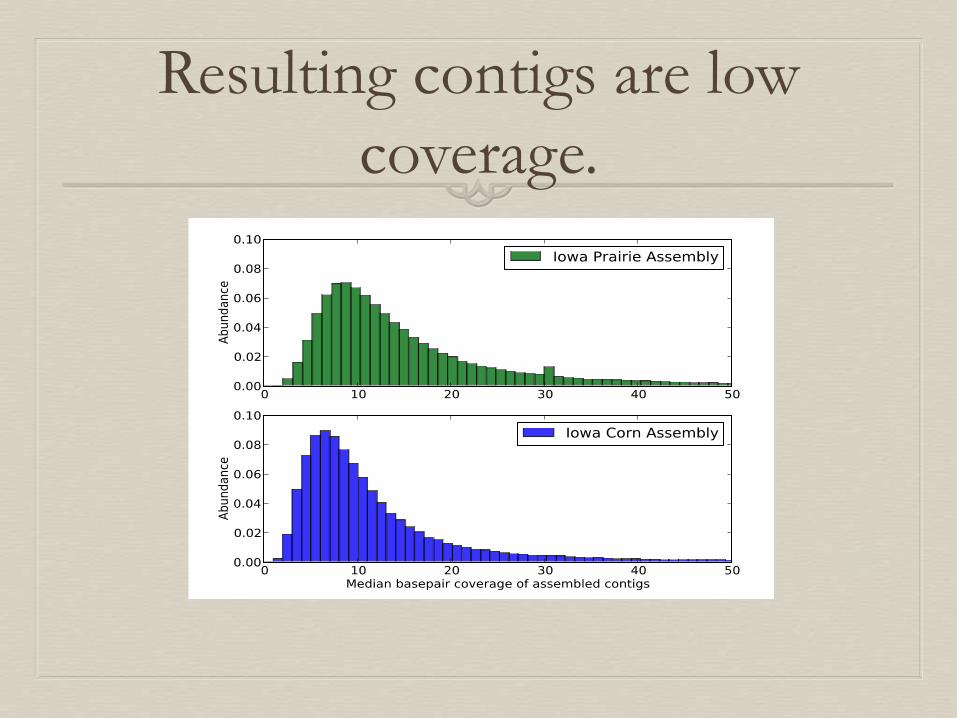
Resulting contigs are low
coverage.
Figure11: Coverage (median basepair) dist ribut ion of assembled cont igs from soil metagenomes.
20
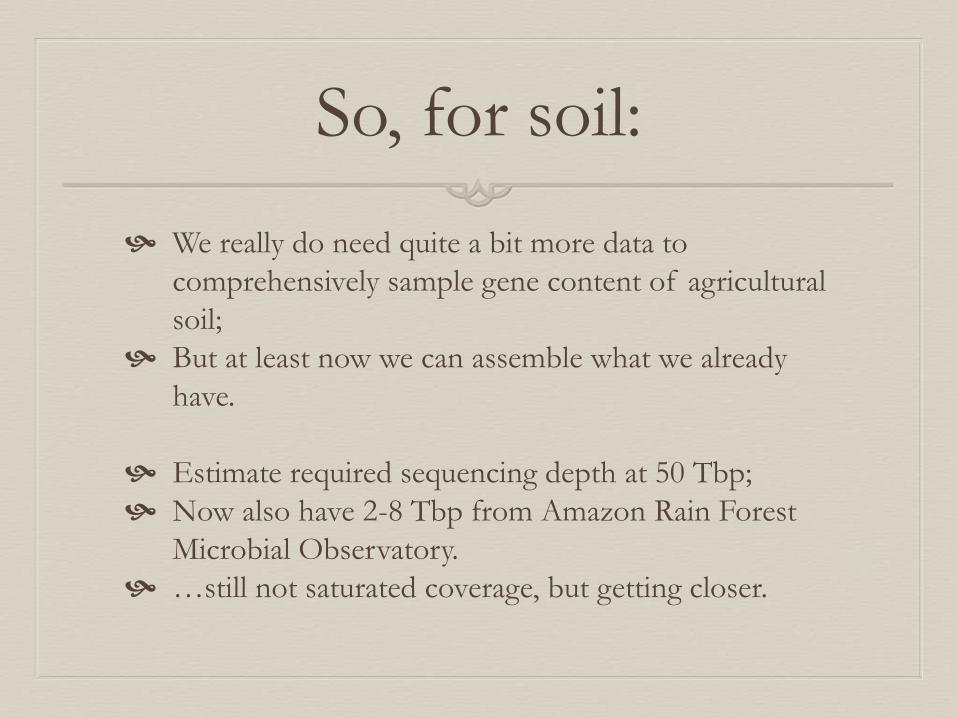
So, for soil:
We really do need quite a bit more data to
comprehensively sample gene content of agricultural
soil;
But at least now we can assemble what we already
have.
Estimate required sequencing depth at 50 Tbp;
Now also have 2-8 Tbp from Amazon Rain Forest
Microbial Observatory.
…still not saturated coverage, but getting closer.
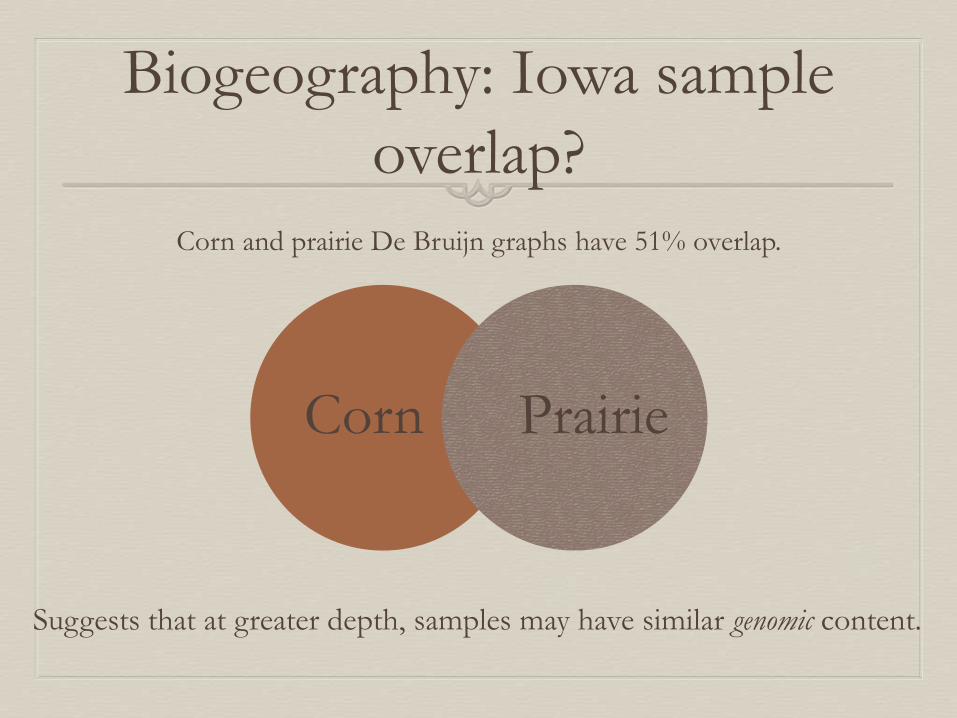
Biogeography: Iowa sample
overlap?
Corn and prairie De Bruijn graphs have 51% overlap.
Corn Prairie
Suggests that at greater depth, samples may have similar genomic content.

Putting it in perspective:
Total equivalent of ~1200 bacterial genomes
Human genome ~3 billion bp
Blocking problem: we don’t know what
most genes do!
Total
Assembly
Total Contigs
(> 300 bp)
% Reads
Assembled
Predicted
protein
coding
2.5 bill 4.5 mill 19% 5.3 mill
3.5 bill 5.9 mill 22% 6.8 mill
Howe et al, 2014; pmid 24632729
Reminder: the real challenge
is understanding
We have gotten distracted by shiny toys:
sequencing!! Data!!
Data is now plentiful! But:
We typically have no knowledge of what > 50%
of an environmental metagenome “means”,
functionally.
http://ivory.idyll.org/blog/2014-function-of-unknown-genes.html
Data integration as a next
challenge
In 5-10 years, we will have nigh-infinite data.
(Genomic, transcriptomic, proteomic,
metabolomic, …?)
How do we explore these data sets?
Registration, cross-validation, integration with
models…
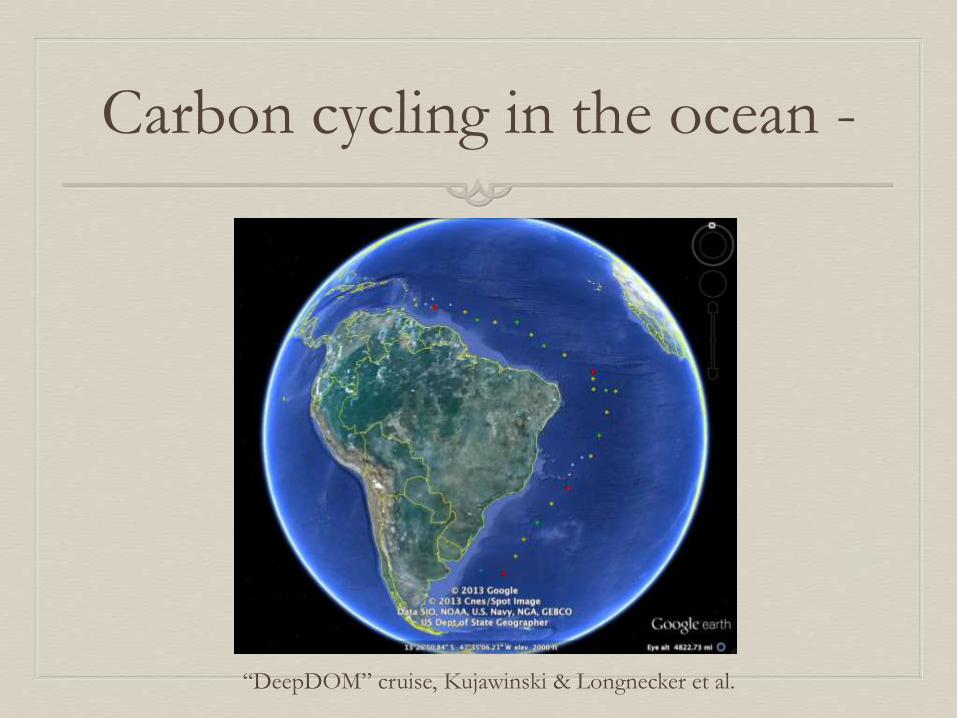
Carbon cycling in the ocean -
“DeepDOM” cruise, Kujawinski & Longnecker et al.
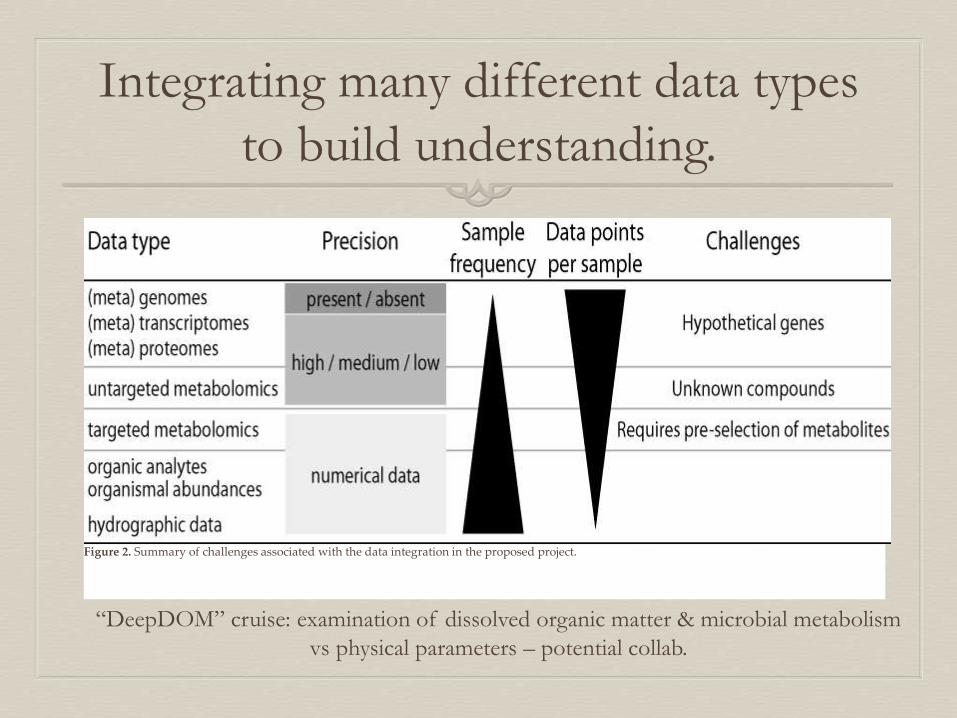
Integrating many different data types
to build understanding.
Figure 2. Summary of challenges associated with the data integration in the proposed project.
“DeepDOM” cruise: examination of dissolved organic matter & microbial metabolism
vs physical parameters – potential collab.
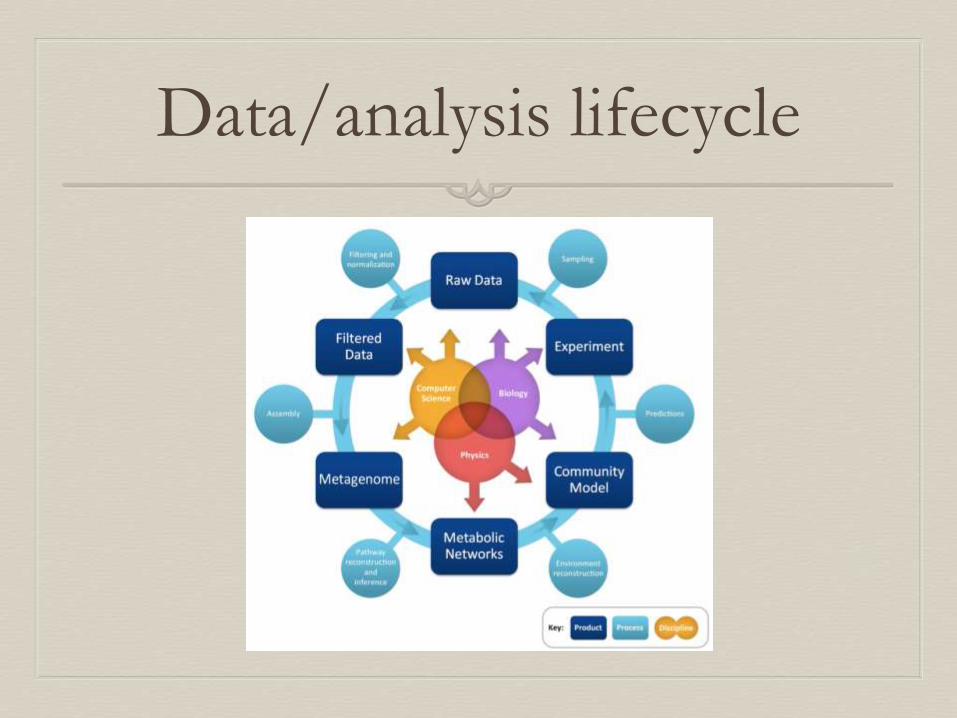
Data/analysis lifecycle
A few thoughts on next
steps.
Enable scientists with better tools.
Train a bioinformatics “middle class.”
Accelerate science via the open science
“network effect”.
That is… what now?
Once you have all this data, what do you do?
"Business as usual simply cannot work.”
- David Haussler, 2014
Looking at millions to billions of (human)
genomes in the next 5-10 years.
Enabling scientists with
better tools -
Build robust, flexible computational frameworks
for data exploration, and make them open and
remixable.
Develop theory, algorithms, & software together,
and train people in its use.
(Oh, and stop pretending that we can develop
“black boxes” that will give you the right answer.)
Education and training - towards a
bioinformatics “middle class”
Biology is underprepared for data-intensive investigation.
We must teach and train the next generations.
=> Build a cohort of “data intensive biologists” who can use
data and tools as an intrinsic and unremarkable part of their
research.
~10-20 workshops / year, novice -> masterclass; open
materials.
dib-training.rtfd.org/

Can open science trigger a
“network effect”?
http://prasoondiwakar.com/wordpress/trivia/the-network-effect
The open science “network
effect”
If we have open tools, and trained users,
then what remains to hold us back?
Access to data.
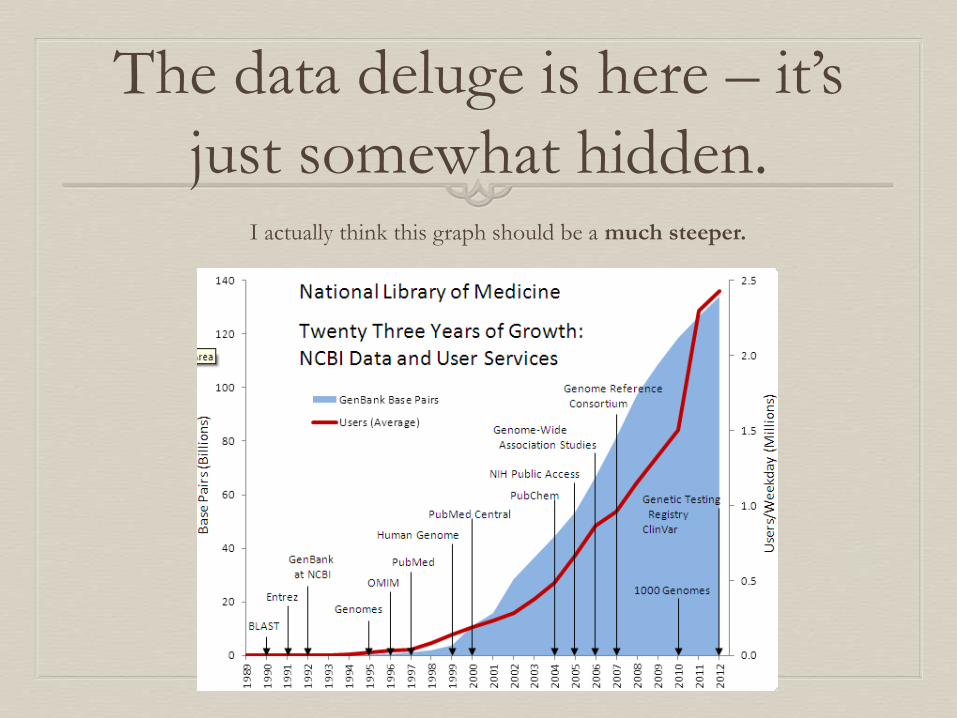
The data deluge is here – it’s
just somewhat hidden.I actually think this graph should be a much steeper.
Tackling data availability…
In 5-10 years, we will have nigh-infinite data.
(Genomic, transcriptomic, proteomic,
metabolomic, …?)
We currently have no good way of querying,
exploring, investigating, or mining these data
sets, especially across multiple locations..
Moreover, most data is unavailable until after
publication, and often it must then be “curated”
to become useful.
Pre-publication data sharing?
There is no obvious reason to make data available prior
to publication of its analysis.
There is no immediate reward for doing so.
Neither is there much systematized reward for doing
so.
(Citations and kudos feel good, but are cold comfort.)
Worse, there are good reasons not to do so.
If you make your data available, others can take
advantage of it…

This bears some similarity to
the Prisoners’ Dilemma:
Where “confession” is not
sharing your data.
Note: I’m not a game theorist
(but some of my best friends
are).
(Leighton Pritchard modification of
http://www.acting-man.com/?p=34313)
So, how do we get academics to
share their data!?
Well, what are people doing now?
Two successful “systems” (send me more!!)
1. Oceanographic research
2. Biomedical research
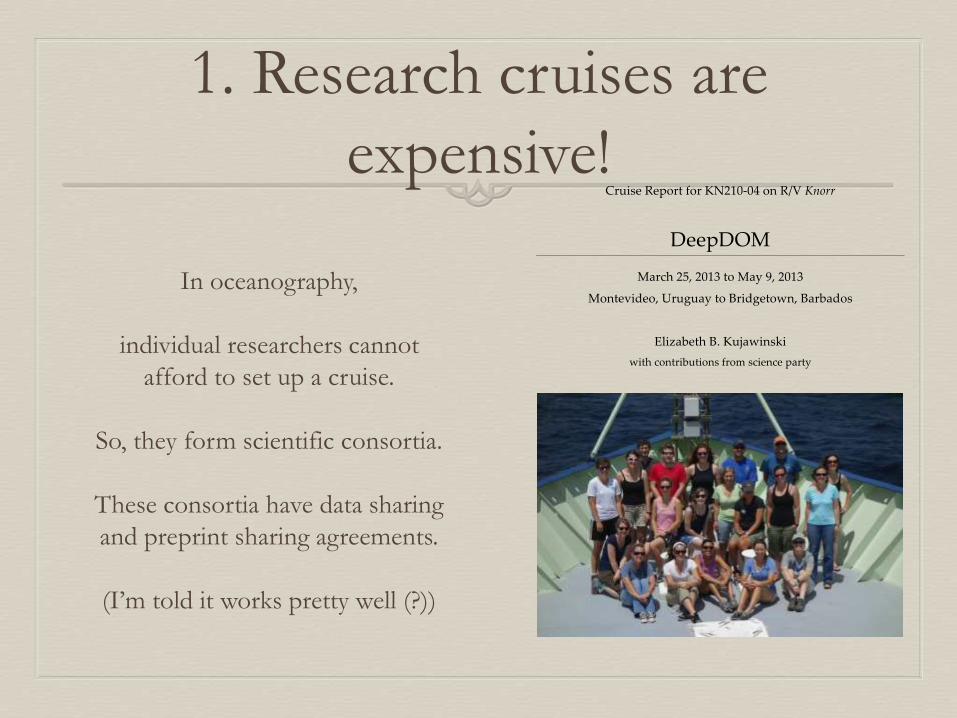
1. Research cruises are
expensive!
In oceanography,
individual researchers cannot
afford to set up a cruise.
So, they form scientific consortia.
These consortia have data sharing
and preprint sharing agreements.
(I’m told it works pretty well (?))
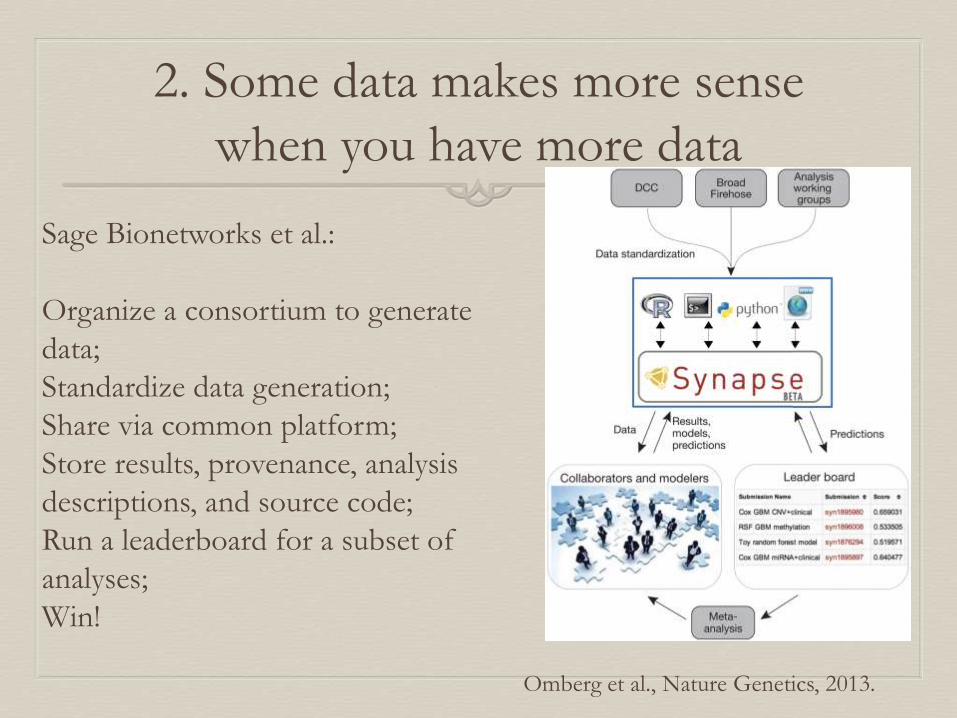
2. Some data makes more sense
when you have more data
Omberg et al., Nature Genetics, 2013.
Sage Bionetworks et al.:
Organize a consortium to generate
data;
Standardize data generation;
Share via common platform;
Store results, provenance, analysis
descriptions, and source code;
Run a leaderboard for a subset of
analyses;
Win!
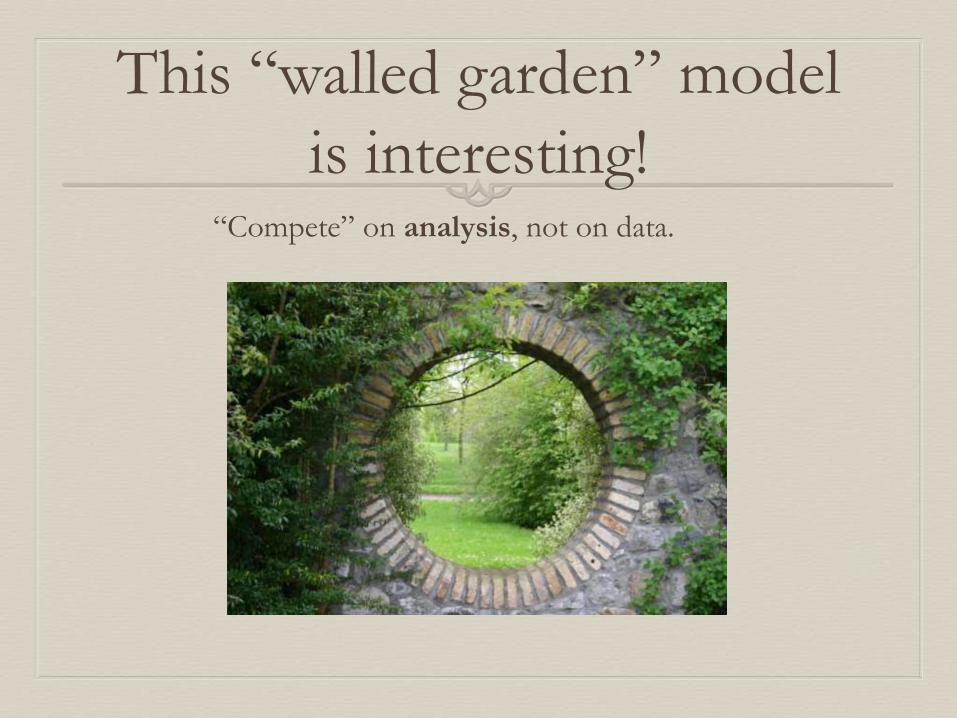
This “walled garden” model
is interesting!“Compete” on analysis, not on data.
Some notes -
Sage model requires ~similar data in
common format;
Common analysis platform then becomes
immediately useful;
Data is ~easily re-usable by participants;
Publication of data becomes straightforward;
Both models are centralized and
coordinated. :(
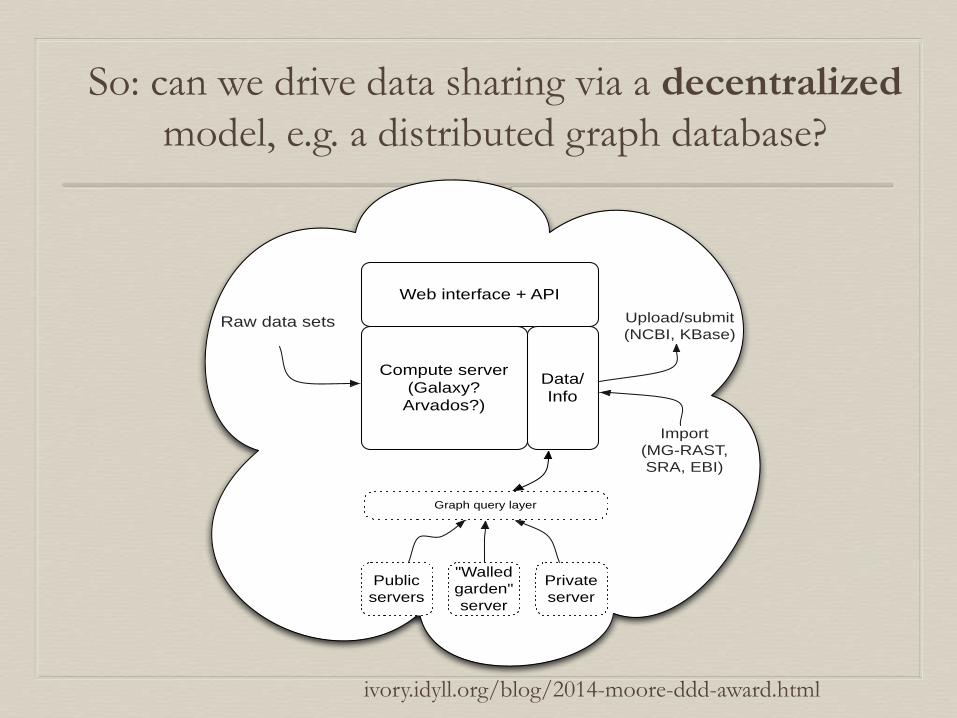
So: can we drive data sharing via a decentralized
model, e.g. a distributed graph database?
Compute server
(Galaxy?
Arvados?)
Web interface + API
Data/
Info
Raw data sets
Public
servers
"Walled
garden"
server
Private
server
Graph query layer
Upload/submit
(NCBI, KBase)
Import
(MG-RAST,
SRA, EBI)
ivory.idyll.org/blog/2014-moore-ddd-award.html
My larger research vision:
100% buzzword compliantTM
Enable and incentivize sharing by providing
immediate utility; frictionless sharing.
Permissionless innovation for e.g. new data
mining approaches.
Plan for poverty with federated infrastructure
built on open & cloud.
Solve people’s current problems, while
remaining agile for the future.
ivory.idyll.org/blog/2014-moore-ddd-award.html
Thanks!
Please contact me at [email protected]!
Soil collaborators: Tiedje (MSU), Jansson (PNNL), Tringe (JGI/DOE)