Embed Size (px)
Citation preview
Developing the field of biodiversity informatics in South Africa through the use of primary data and informatics tools to address key biodiversity challenges
Insert partner logos here
Fatima Parker-Allie
SAMSS – 6 July
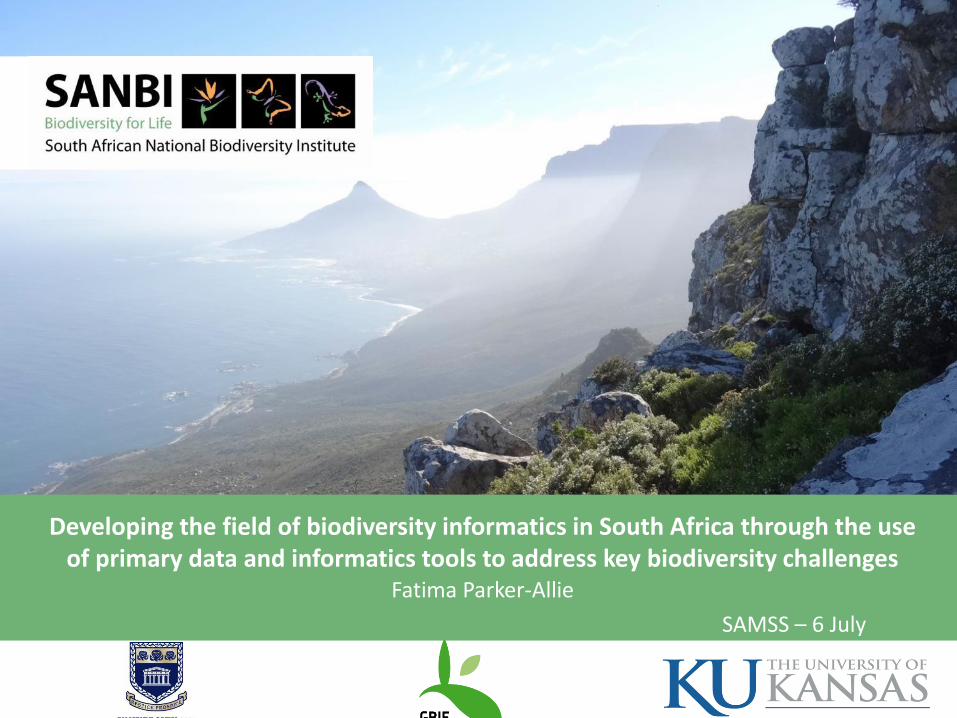
• NSI and Biodiversity Informatics
• Developing a Centre for Biodiversity Information Management
• As part of this broader context, expand on a research project which looks at “Developing the field of biodiversity informatics in South Africa through the use of primary data and informatics tools to address key biodiversity challenges”
o Curriculum, research priorities
o Data management
o Niche Modelling
Overview Background
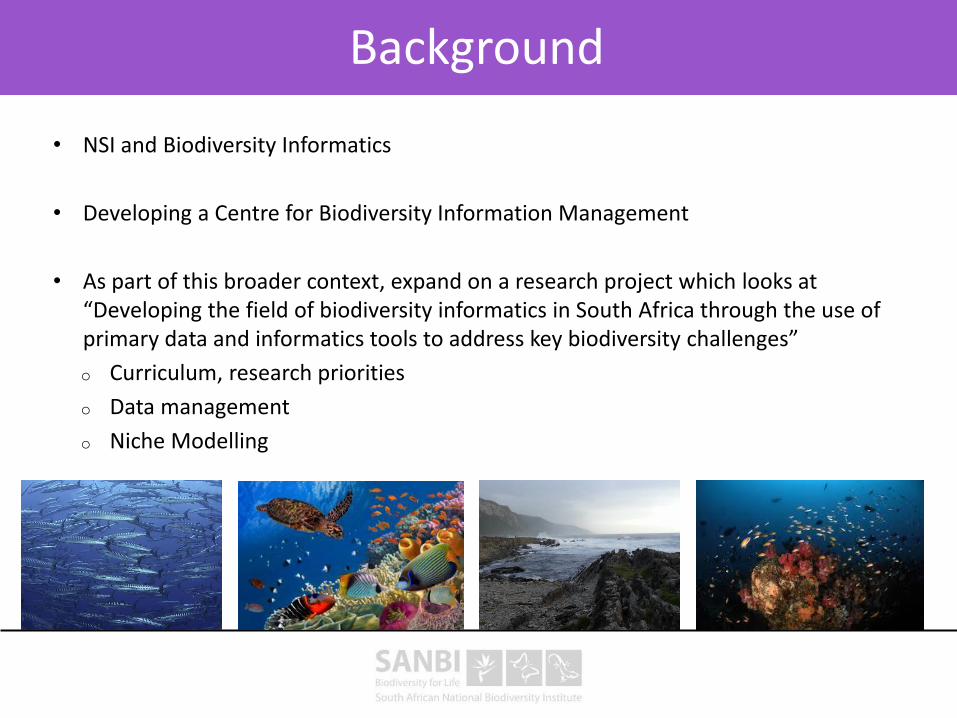
• South Africa’s prospects for improved competitiveness and economic growth rely, to a great degree, on science and technology.
• Its ten-year innovation plan and bioeconomy strategy, which is built on the foundation of the National System of Innovation (NSI), recognizes that the country needs to take further steps to becoming a knowledge-based economy in order to meet its developmental objectives.
• Knowledge is the basic form of capital for innovation (knowledge generation, accumulation, and exploitation). Economic growth is driven by innovation, and the key driver for innovation is “high-end” human capital.
• A significant strengthening of the production of human capital and the institutional environment for knowledge generation is necessary, in collaboration with international partners.
• This especially in light of the fact that today, a growing percentage of the wealth in the world’s largest economies is created by knowledge-based industries that rely heavily on human capital and technological innovation.
Background
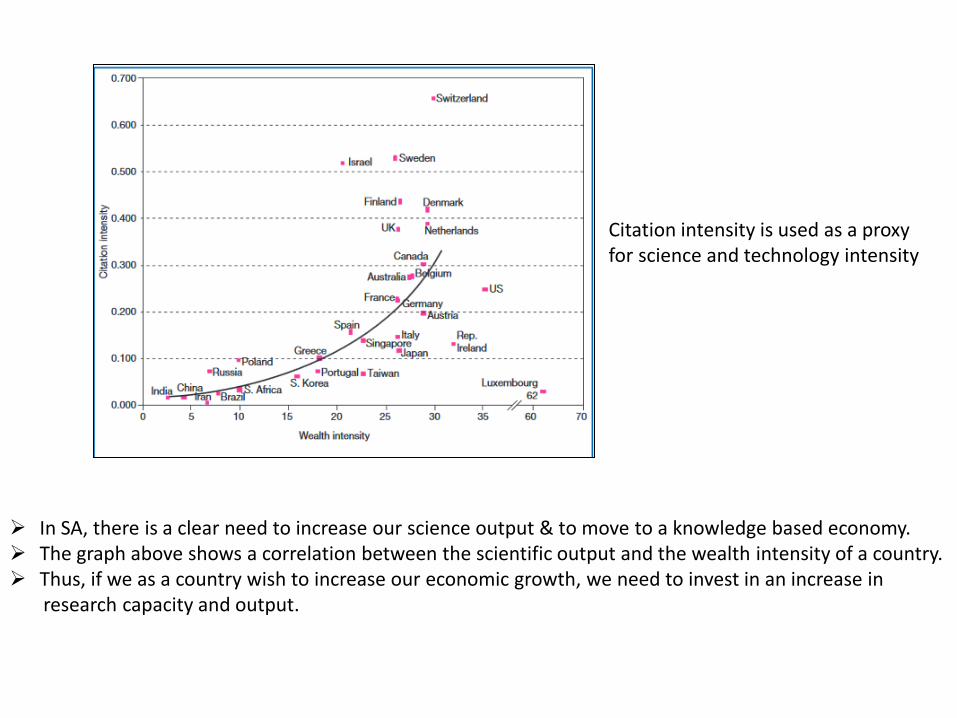
In SA, there is a clear need to increase our science output & to move to a knowledge based economy. The graph above shows a correlation between the scientific output and the wealth intensity of a country. Thus, if we as a country wish to increase our economic growth, we need to invest in an increase in research capacity and output.
Citation intensity is used as a proxy for science and technology intensity

human wellbeing improved service delivery
job creation harnessing biodiversity value
investment in ecological infrastructure ecosystem-based adaptation to climate change
streamlined environmental decision-making
FOUNDATIONS OF BIODIVERSITY: collections| taxonomy | inventory | maps | classification of
ecosystems and species
BUILDING BIODIVERSITY KNOWLEDGE: assessments | status | trends | monitoring | modelling
SCIENCE INTO POLICY / ACTION: information | planning | policy advice | models | tools
HU
MA
N C
AP
ITA
L D
EVEL
OP
MEN
T
GA
RD
ENS
win
do
ws
on
bio
div
ersi
ty
WH
AT
WE
DO
SANBI as a Biodiversity Informatics Institution
• SANBI is a dedicated national biodiversity institution that bridges science, knowledge, policy and implementation. SANBI’s value chain operates across the divisions.
• As a knowledge-based organisation, biodiversity information is the key resource which drive research and innovation, inform planning and policy development processes, informs decisions and is the basis to evaluate progress and impact.
• It is therefore important that our biodiversity information is managed as a strategic asset that will leverage shared value to South Africa in supporting sustainable decisions towards the broader national developmental objectives.
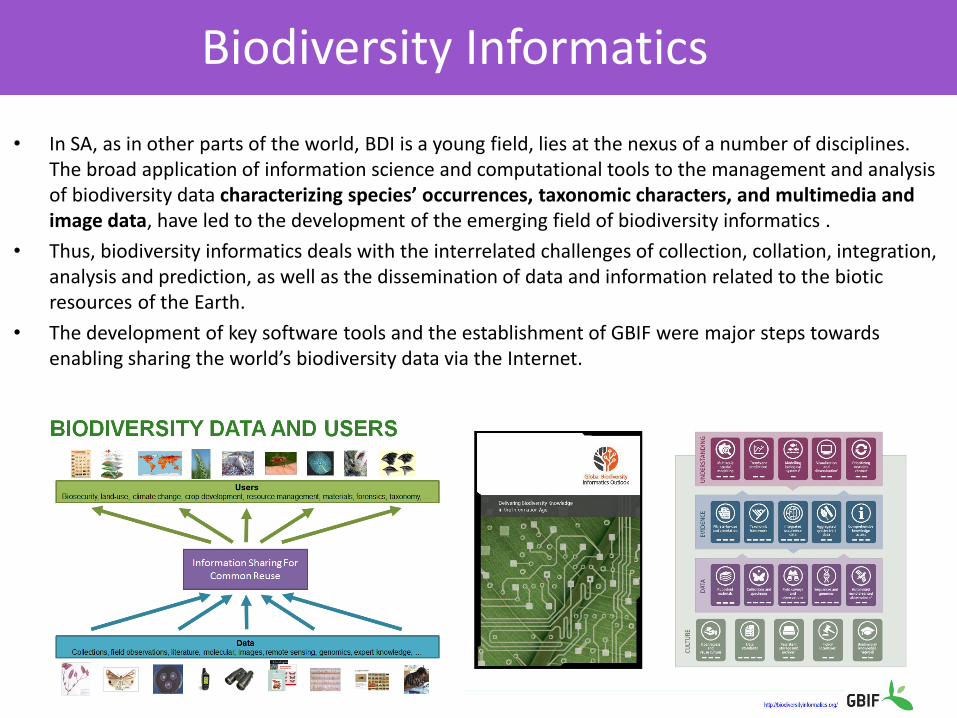
• In SA, as in other parts of the world, BDI is a young field, lies at the nexus of a number of disciplines. The broad application of information science and computational tools to the management and analysis of biodiversity data characterizing species’ occurrences, taxonomic characters, and multimedia and image data, have led to the development of the emerging field of biodiversity informatics .
• Thus, biodiversity informatics deals with the interrelated challenges of collection, collation, integration, analysis and prediction, as well as the dissemination of data and information related to the biotic resources of the Earth.
• The development of key software tools and the establishment of GBIF were major steps towards enabling sharing the world’s biodiversity data via the Internet.
Biodiversity Informatics
GBIF
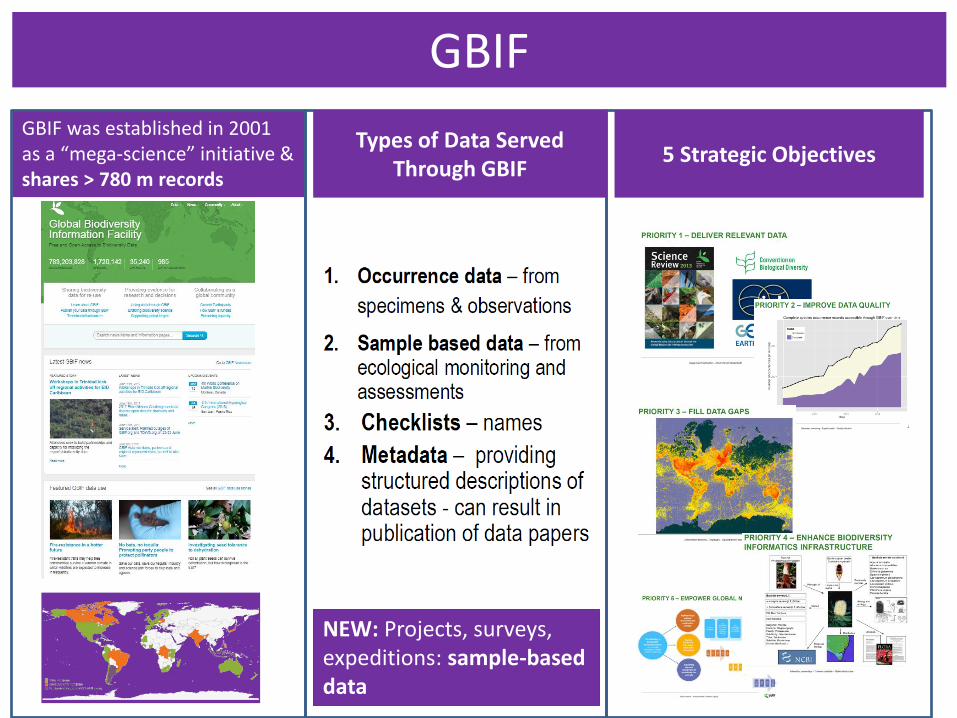
GBIF was established in 2001 as a “mega-science” initiative & shares > 780 m records
NEW: Projects, surveys, expeditions: sample-based data
Types of Data Served Through GBIF
5 Strategic Objectives
Establishment of SABIF
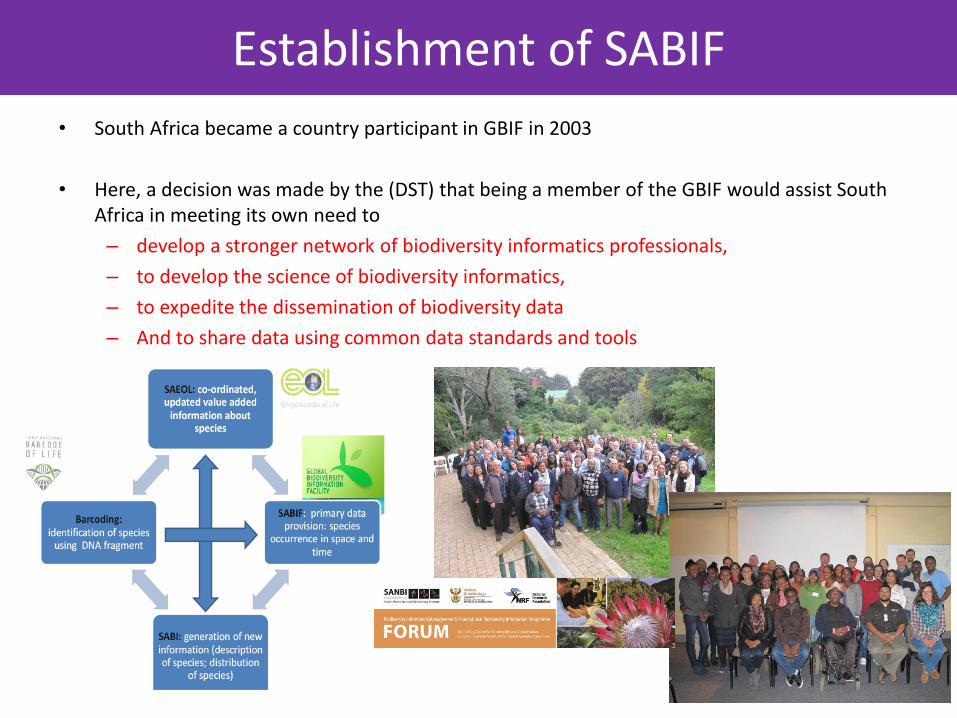
• South Africa became a country participant in GBIF in 2003
• Here, a decision was made by the (DST) that being a member of the GBIF would assist South Africa in meeting its own need to
– develop a stronger network of biodiversity informatics professionals,
– to develop the science of biodiversity informatics,
– to expedite the dissemination of biodiversity data
– And to share data using common data standards and tools
• Thus SANBI-GBIF plays a critical role in the BDI landscape in SA including data sharing and developing BDI as a field of science.
• Being such a new and dynamic field, there are enormous challenges in recruitment, training and retention of BIM personnel, for the mobilisation, management, coordination and use of biodiversity information for key conservation and biodiversity outcomes such as IPBES and CBD Aichi targets that require data to meet the science-policy and decision making needs
• This critical lack thus demands broad efforts to build human capital in the field.
• As an organisation SANBI has a number of key drivers in place that lays the foundations for the development of a Centre for Biodiversity Informatics, and provides a growth path for this relatively new field of science.
SANBI-GBIF & HCD
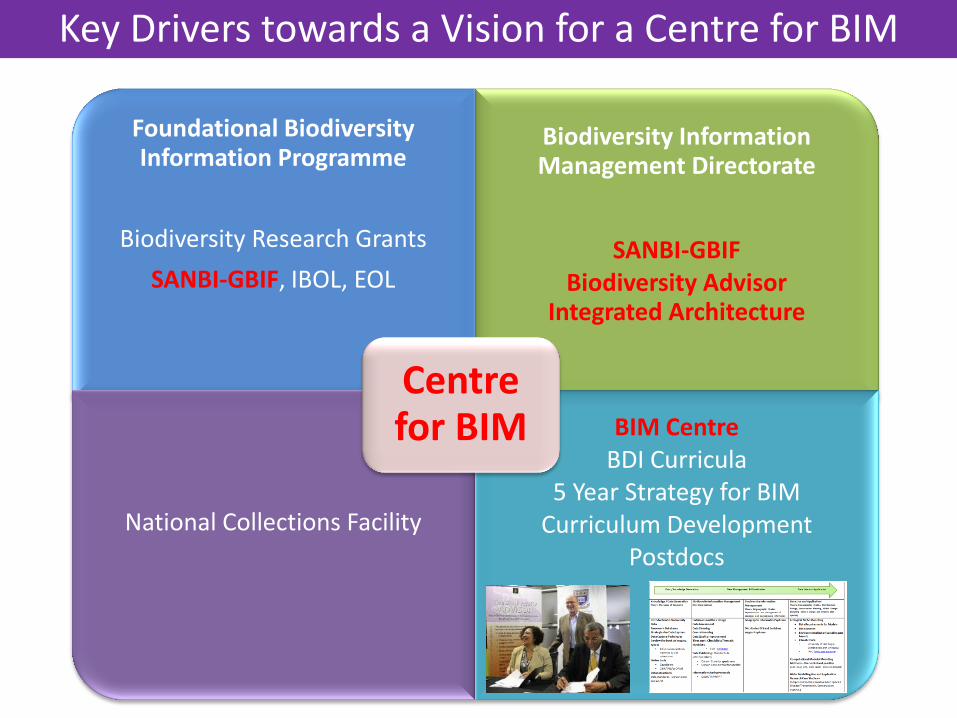
Foundational Biodiversity Information Programme
Biodiversity Research Grants
SANBI-GBIF, IBOL, EOL
Biodiversity Information Management Directorate
SANBI-GBIF Biodiversity Advisor
Integrated Architecture
National Collections Facility
BIM Centre BDI Curricula
5 Year Strategy for BIM Curriculum Development
Postdocs
Centre for BIM
Key Drivers towards a Vision for a Centre for BIM
1. Develop a conceptual framework for BDI including an extended BIM Honours curriculum.
2. Address the management and improvement of biodiversity data toward achievement of full fitness for use in research applications;
3. Explore a research theme that demonstrates the use and relevance of GBIF-mediated data,
• utilizing niche models based on primary biodiversity data to describe current and predict future distributions of fish species under different climate scenarios in the marine realm;
This project sets out to develop the field of biodiversity informatics in SA through a three-phased approach

1. Developing the field of BDI • Developed a 5 year strategy for the establishment of a Centre for BIM
• Engagements with UWC, Sol Plaatjes and UCT are ongoing with regards to course implementation and research
• A curriculum framework has been developed, for an extended Honours course – and will work towards
engaging with Universities for uptake & implementation (engagements at nat/reg/global level)
• SANBI has funded 2 Postdocs (UWC/UCT), and will be funding a 3rd soon
• Engagements with the DST/NRF and FBIP Steering Committees
• Development of a TOR for a Research Chair in BDI
2. The management and improvement of biodiversity data towards full fitness for use in research applications
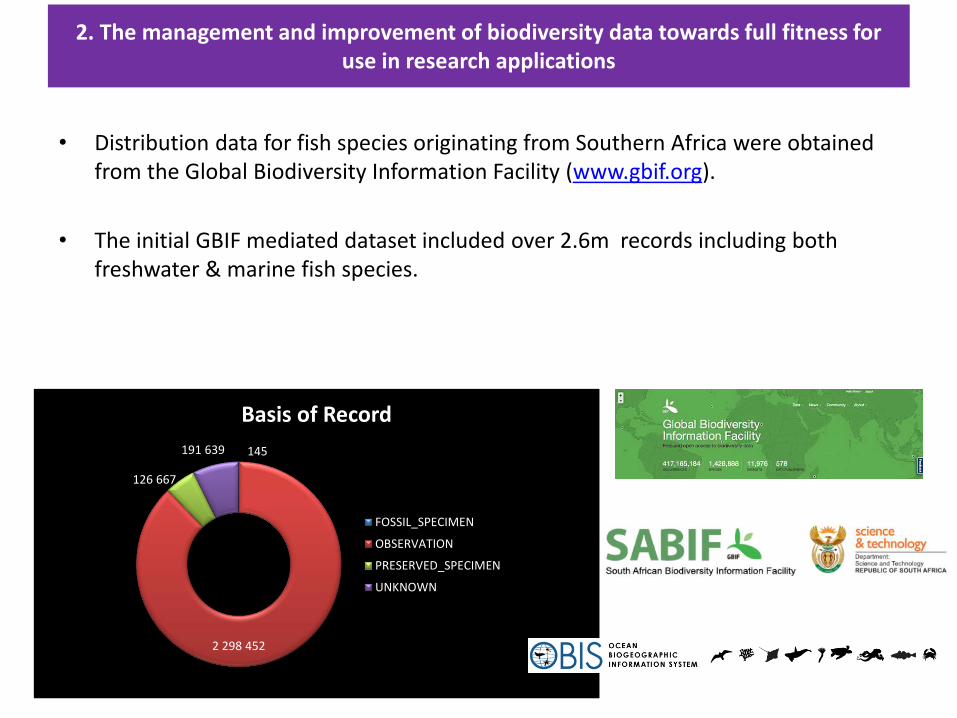
• Distribution data for fish species originating from Southern Africa were obtained from the Global Biodiversity Information Facility (www.gbif.org).
• The initial GBIF mediated dataset included over 2.6m records including both freshwater & marine fish species.
145
2 298 452
126 667
191 639
Basis of Record
FOSSIL_SPECIMEN
OBSERVATION
PRESERVED_SPECIMEN
UNKNOWN
1
10
100
1 000
10 000
100 000
1 000 000
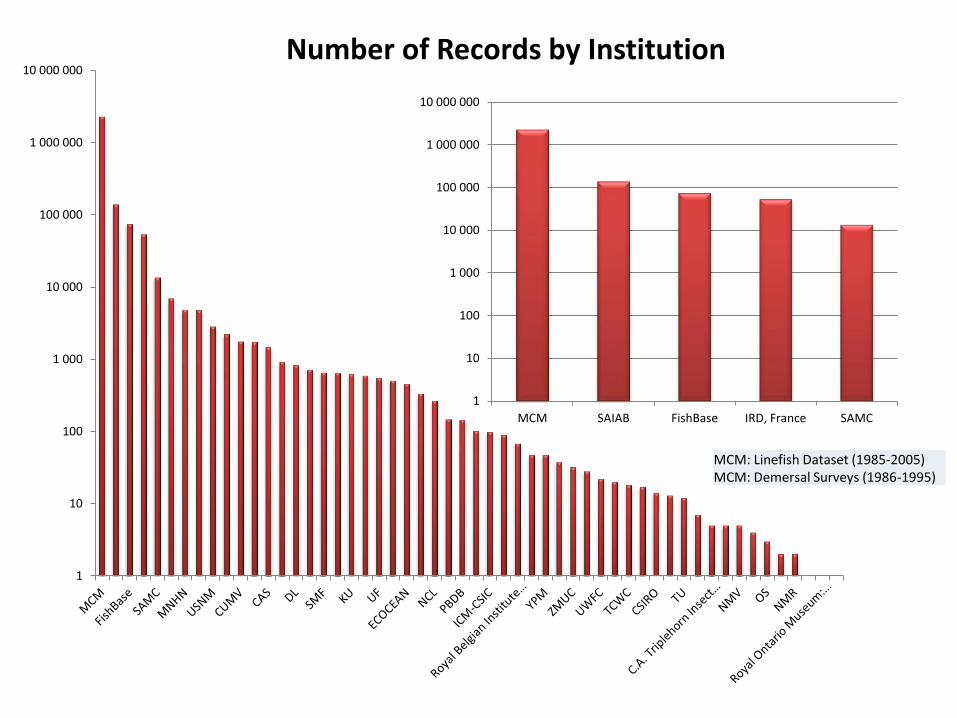
10 000 000Number of Records by Institution
1
10
100
1 000
10 000
100 000
1 000 000
10 000 000
MCM SAIAB FishBase IRD, France SAMC
MCM: Linefish Dataset (1985-2005) MCM: Demersal Surveys (1986-1995)
2. Data Management
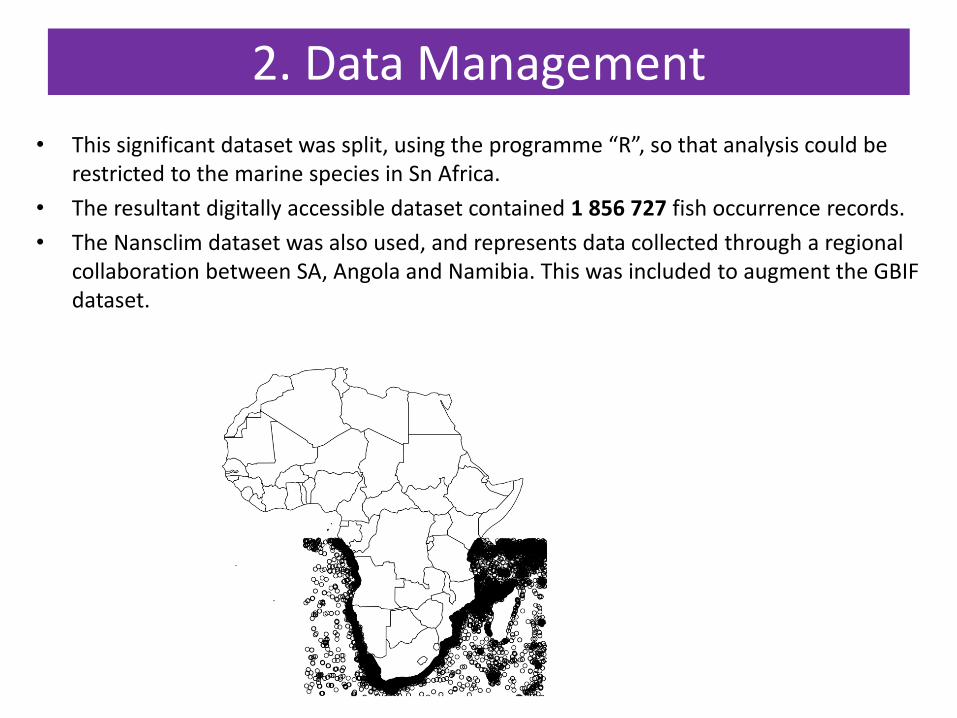
• This significant dataset was split, using the programme “R”, so that analysis could be restricted to the marine species in Sn Africa.
• The resultant digitally accessible dataset contained 1 856 727 fish occurrence records.
• The Nansclim dataset was also used, and represents data collected through a regional collaboration between SA, Angola and Namibia. This was included to augment the GBIF dataset.
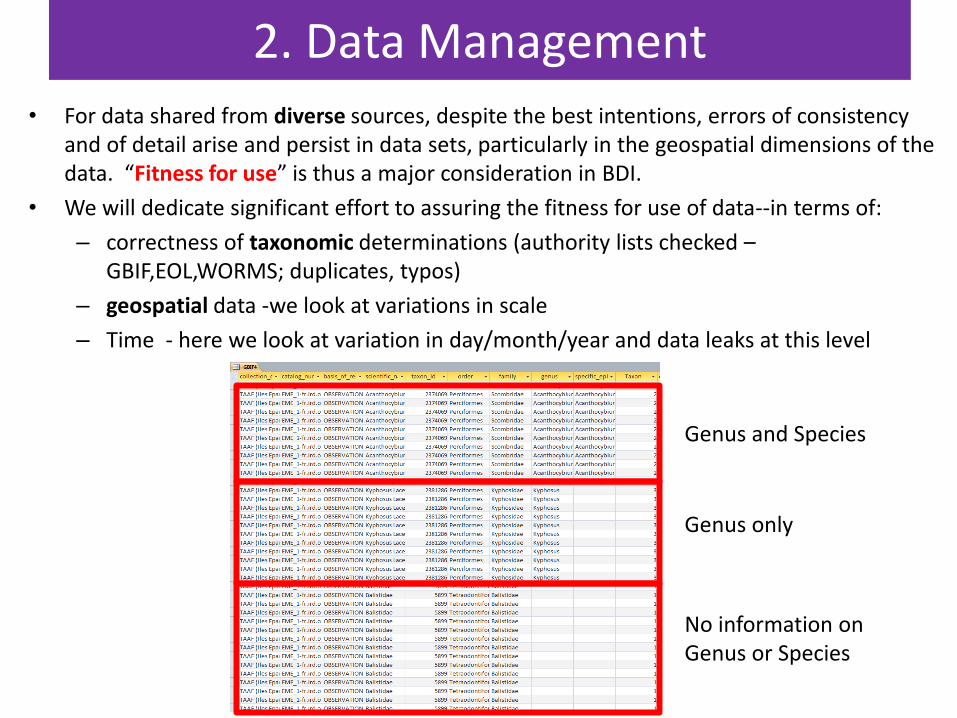
• For data shared from diverse sources, despite the best intentions, errors of consistency and of detail arise and persist in data sets, particularly in the geospatial dimensions of the data. “Fitness for use” is thus a major consideration in BDI.
• We will dedicate significant effort to assuring the fitness for use of data--in terms of:
– correctness of taxonomic determinations (authority lists checked – GBIF,EOL,WORMS; duplicates, typos)
– geospatial data -we look at variations in scale
– Time - here we look at variation in day/month/year and data leaks at this level
2. Data Management
Genus and Species
Genus only
No information on Genus or Species
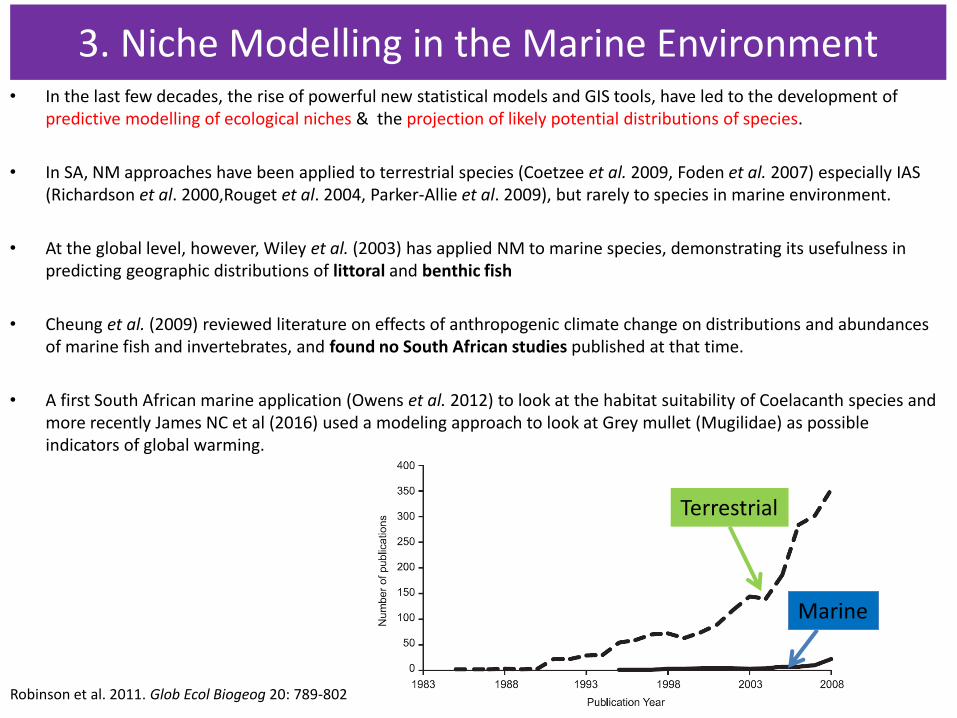
3. Niche Modelling in the Marine Environment • In the last few decades, the rise of powerful new statistical models and GIS tools, have led to the development of
predictive modelling of ecological niches & the projection of likely potential distributions of species.
• In SA, NM approaches have been applied to terrestrial species (Coetzee et al. 2009, Foden et al. 2007) especially IAS (Richardson et al. 2000,Rouget et al. 2004, Parker-Allie et al. 2009), but rarely to species in marine environment.
• At the global level, however, Wiley et al. (2003) has applied NM to marine species, demonstrating its usefulness in predicting geographic distributions of littoral and benthic fish
• Cheung et al. (2009) reviewed literature on effects of anthropogenic climate change on distributions and abundances of marine fish and invertebrates, and found no South African studies published at that time.
• A first South African marine application (Owens et al. 2012) to look at the habitat suitability of Coelacanth species and more recently James NC et al (2016) used a modeling approach to look at Grey mullet (Mugilidae) as possible indicators of global warming.
Robinson et al. 2011. Glob Ecol Biogeog 20: 789-802
Terrestrial
Marine
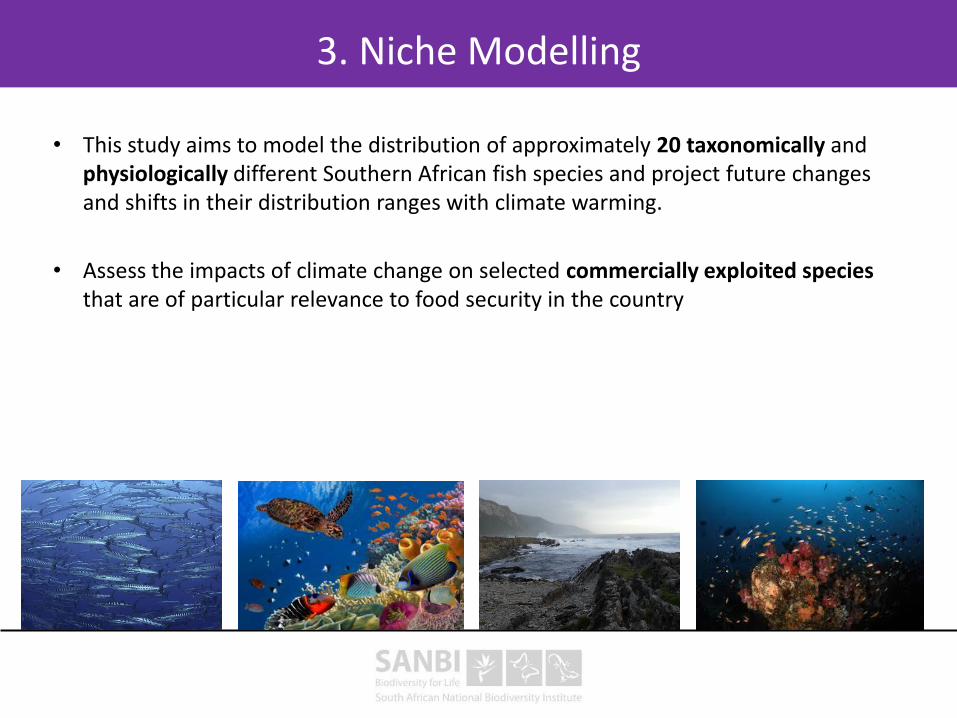
• This study aims to model the distribution of approximately 20 taxonomically and physiologically different Southern African fish species and project future changes and shifts in their distribution ranges with climate warming.
• Assess the impacts of climate change on selected commercially exploited species that are of particular relevance to food security in the country
3. Niche Modelling
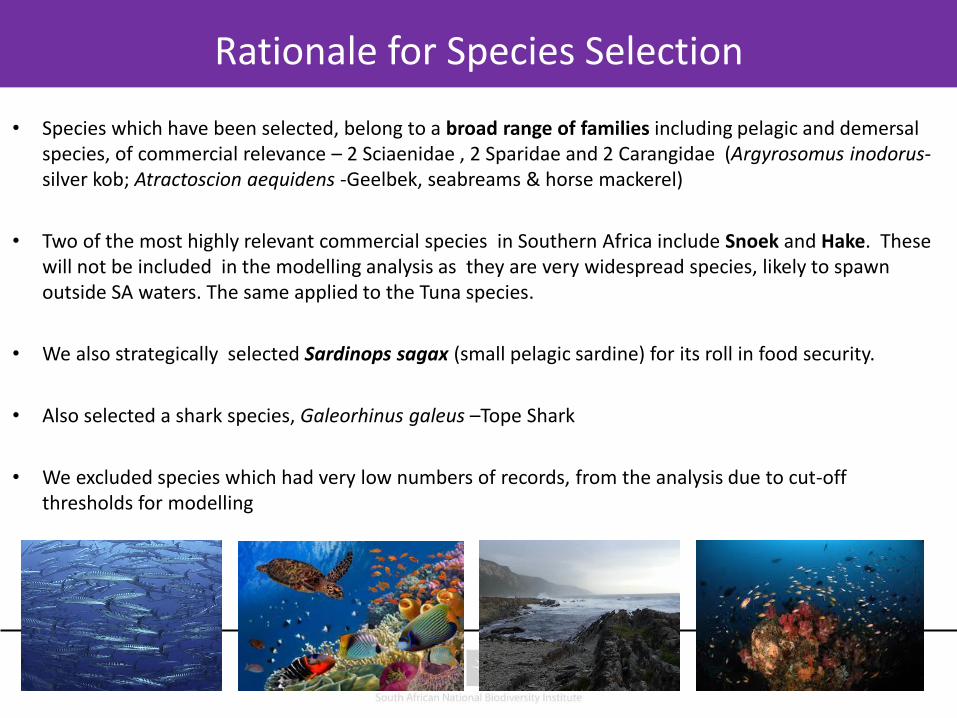
• Species which have been selected, belong to a broad range of families including pelagic and demersal species, of commercial relevance – 2 Sciaenidae , 2 Sparidae and 2 Carangidae (Argyrosomus inodorus-silver kob; Atractoscion aequidens -Geelbek, seabreams & horse mackerel)
• Two of the most highly relevant commercial species in Southern Africa include Snoek and Hake. These will not be included in the modelling analysis as they are very widespread species, likely to spawn outside SA waters. The same applied to the Tuna species.
• We also strategically selected Sardinops sagax (small pelagic sardine) for its roll in food security.
• Also selected a shark species, Galeorhinus galeus –Tope Shark
• We excluded species which had very low numbers of records, from the analysis due to cut-off thresholds for modelling
Rationale for Species Selection
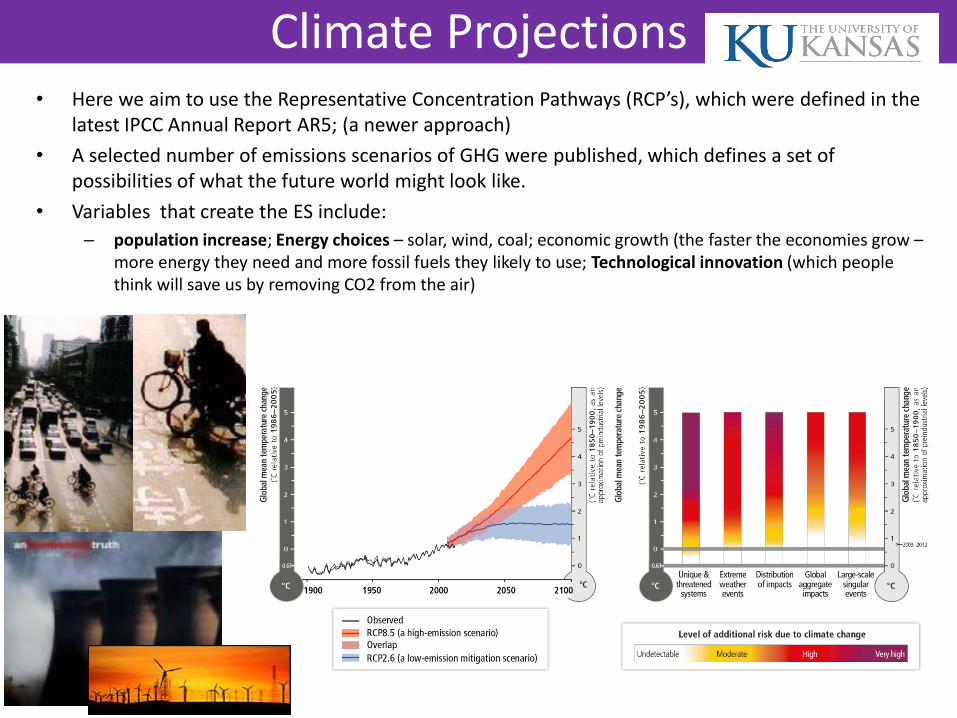
Climate Projections • Here we aim to use the Representative Concentration Pathways (RCP’s), which were defined in the
latest IPCC Annual Report AR5; (a newer approach)
• A selected number of emissions scenarios of GHG were published, which defines a set of possibilities of what the future world might look like.
• Variables that create the ES include:
– population increase; Energy choices – solar, wind, coal; economic growth (the faster the economies grow – more energy they need and more fossil fuels they likely to use; Technological innovation (which people think will save us by removing CO2 from the air)

• Biodiversity information has a potential role in supporting many of the Sustainable Development Goals.
• In a world that counts the United Nations describe data as the lifeblood of decision making and the raw material for accountability. Thus, good and accurate data is the key building blocks for analysis, in support the 17 Sustainable Development Goals.
• Ultimately, we need to ensure that the data which supports our analysis, are mobilized and priority datasets are available to support analysis for amongst other things, natural capital accounting; and sectors such as energy, climate, water, food, infrastructure, mining and extractives as well as trade and investment.
IEAG 2014. A world that counts. Mobilising the Data Revolution for Sustainable Development. Report prepared by The United Nations Secretary-General’s Independent Expert Advisory Group on a Data Revolution for Sustainable Development, at the request of Secretary General of the United Nations, New York.
Sustainable Development Goals