Embed Size (px)
Citation preview
1
NEON AIRBORNE OBSERVATION
PLATFORM (AOP) OVERVIEWKeith Krause, Algorithm Scientist
National Ecological Observatory Network
2
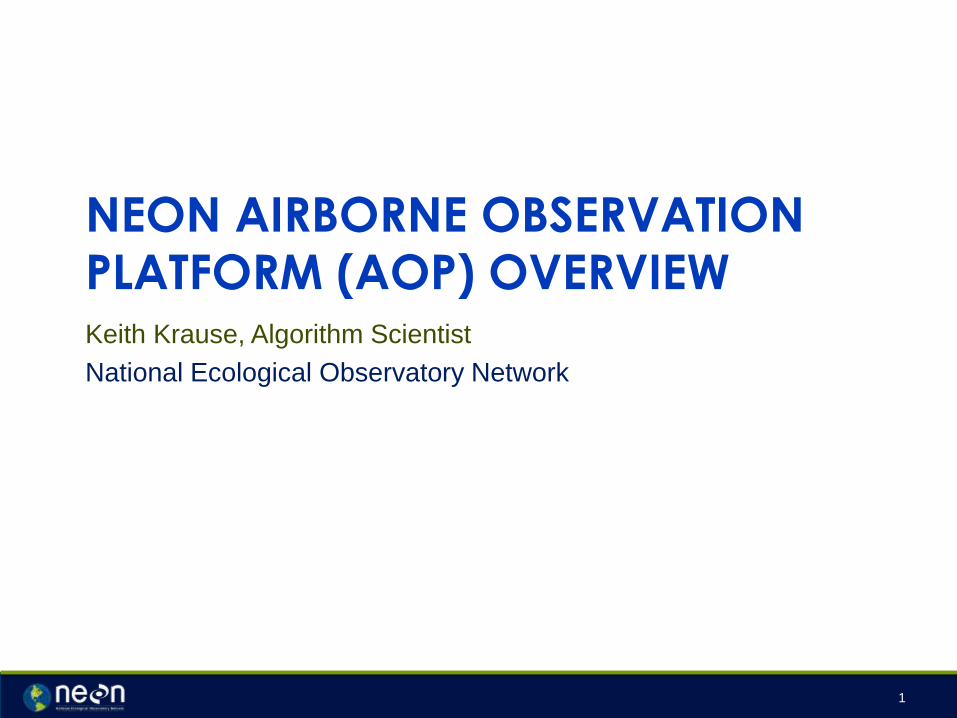
Integrated ObservationsWaveform Light Detection and Ranging
+
What are we after?
• Detailed chemical, structural and
taxonomic information on ecosystems at
fine spatial resolution
0
0.1
0.2
0.3
0.4
0.5
0.6
0.7
0.8
0.9
1
350 850 1350 1850 2350
Reflectance
Wavelength(nm)
Aspen
Conifer
0
0.1
0.2
0.3
0.4
0.5
0.6
0.7
0.8
0.9
1
350 850 1350 1850 2350
Reflectance
Wavelength(nm)
Snow
0
0.1
0.2
0.3
0.4
0.5
0.6
0.7
0.8
0.9
1
350 850 1350 1850 2350
Reflectance
Wavelength(nm)
DesiccatedGrass
Fallendeadpine
DesiccatedBush
Aspen & Pine Dead Grass Snow
3
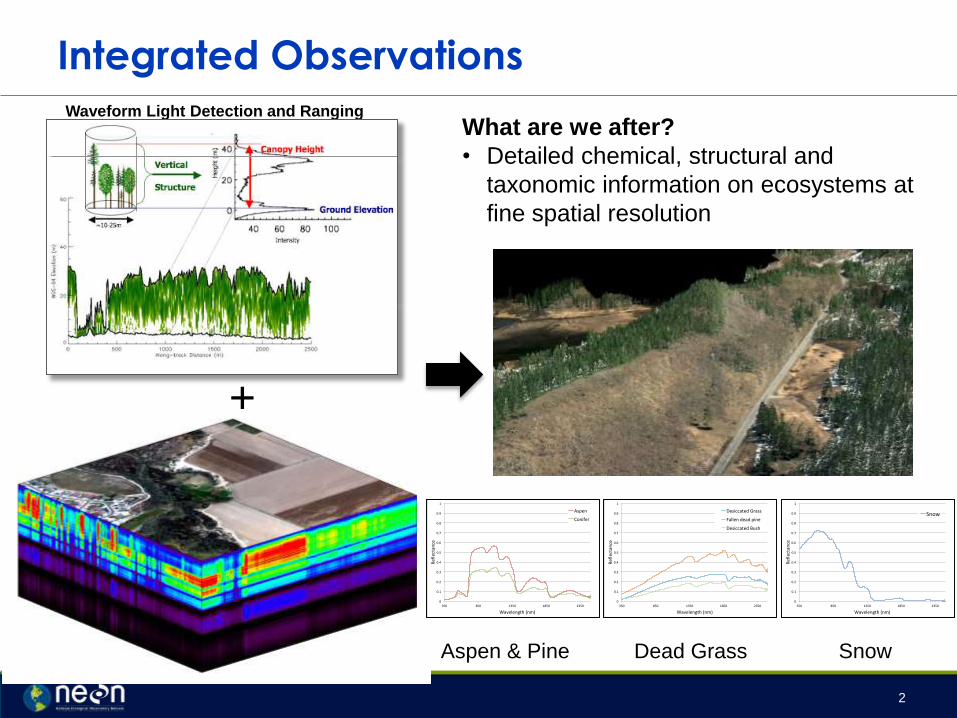
AOP Flight Concept
4
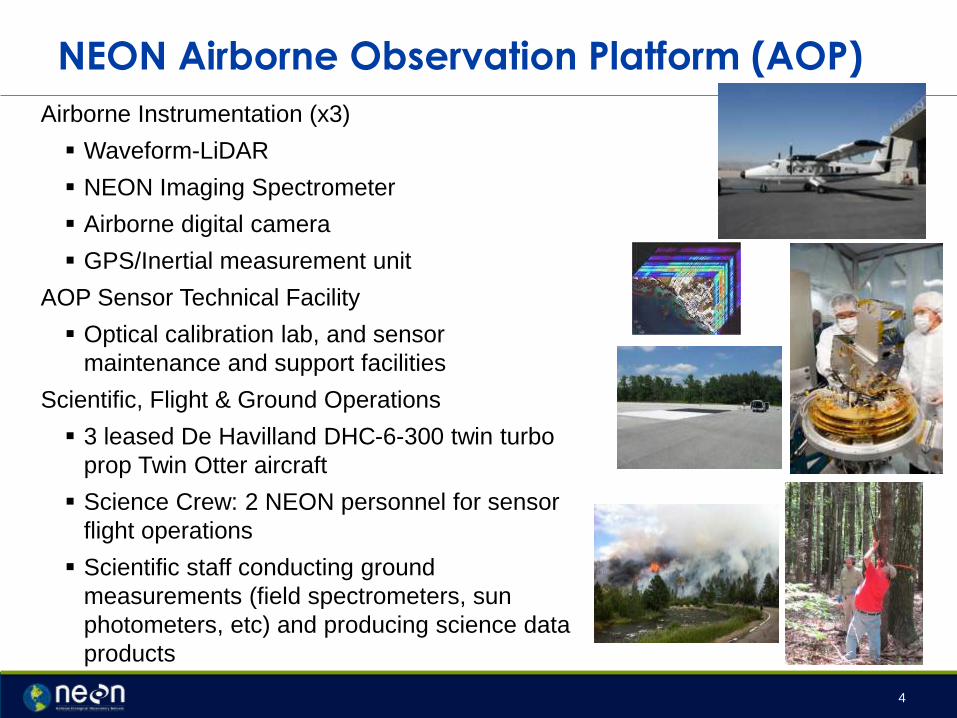
NEON Airborne Observation Platform (AOP)
Airborne Instrumentation (x3)
Waveform-LiDAR
NEON Imaging Spectrometer
Airborne digital camera
GPS/Inertial measurement unit
AOP Sensor Technical Facility
Optical calibration lab, and sensor
maintenance and support facilities
Scientific, Flight & Ground Operations
3 leased De Havilland DHC-6-300 twin turbo
prop Twin Otter aircraft
Science Crew: 2 NEON personnel for sensor
flight operations
Scientific staff conducting ground
measurements (field spectrometers, sun
photometers, etc) and producing science data
products
5
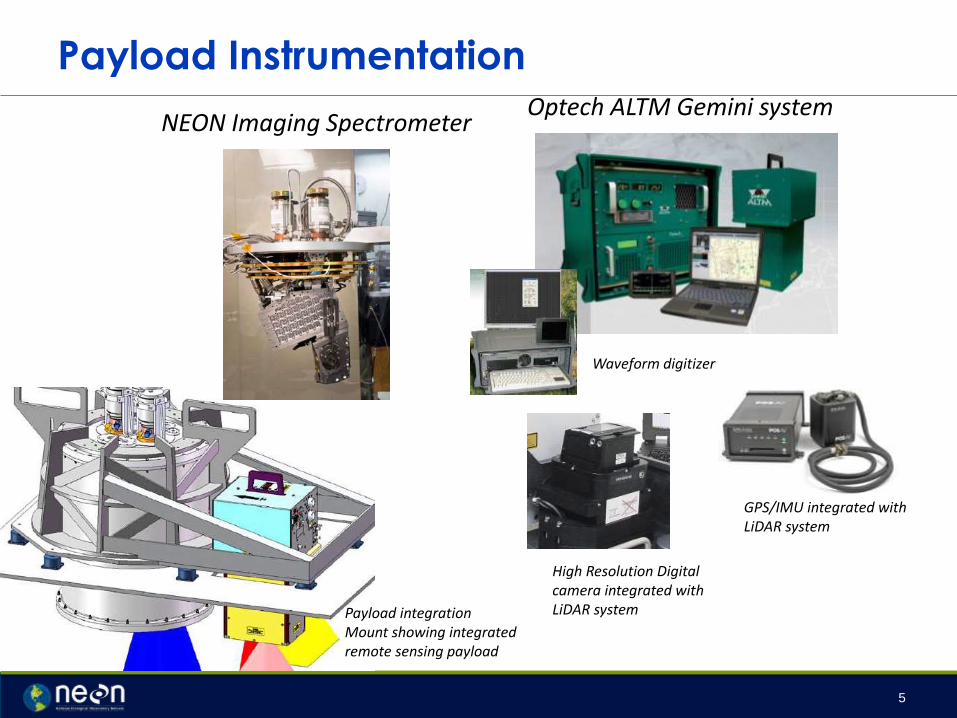
Payload Instrumentation
5
NEON Imaging SpectrometerOptech ALTM Gemini system
GPS/IMU integrated with LiDAR system
Waveform digitizer
High Resolution Digital camera integrated with LiDAR systemPayload integration
Mount showing integrated remote sensing payload
6
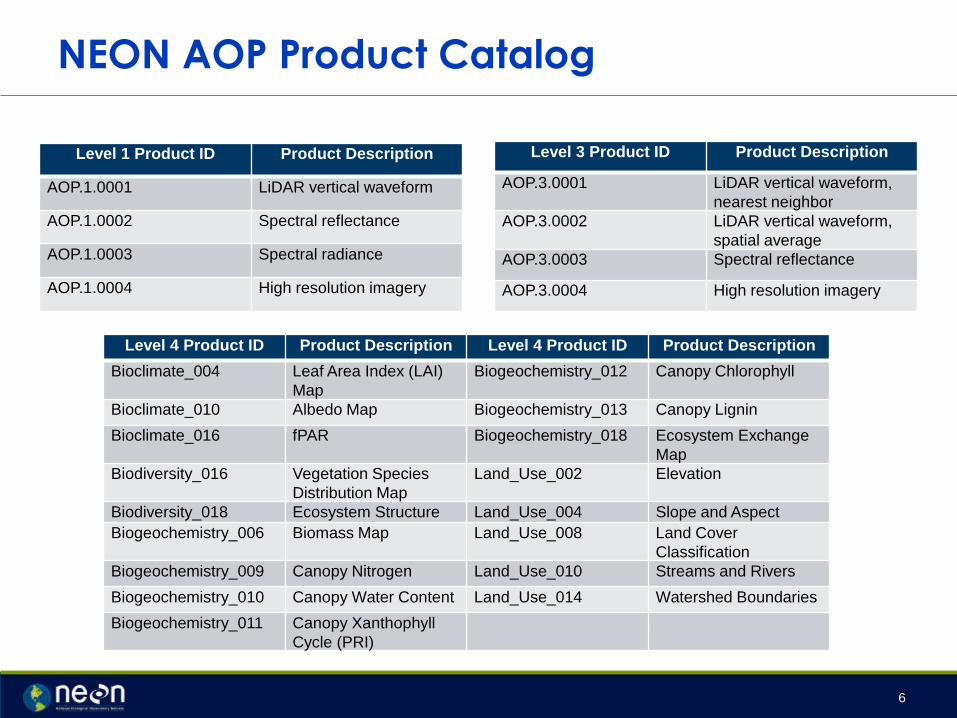
NEON AOP Product Catalog
Level 1 Product ID Product Description
AOP.1.0001 LiDAR vertical waveform
AOP.1.0002 Spectral reflectance
AOP.1.0003 Spectral radiance
AOP.1.0004 High resolution imagery
Level 3 Product ID Product Description
AOP.3.0001 LiDAR vertical waveform,
nearest neighbor
AOP.3.0002 LiDAR vertical waveform,
spatial average
AOP.3.0003 Spectral reflectance
AOP.3.0004 High resolution imagery
Level 4 Product ID Product Description Level 4 Product ID Product Description
Bioclimate_004 Leaf Area Index (LAI)
Map
Biogeochemistry_012 Canopy Chlorophyll
Bioclimate_010 Albedo Map Biogeochemistry_013 Canopy Lignin
Bioclimate_016 fPAR Biogeochemistry_018 Ecosystem Exchange
Map
Biodiversity_016 Vegetation Species
Distribution Map
Land_Use_002 Elevation
Biodiversity_018 Ecosystem Structure Land_Use_004 Slope and Aspect
Biogeochemistry_006 Biomass Map Land_Use_008 Land Cover
Classification
Biogeochemistry_009 Canopy Nitrogen Land_Use_010 Streams and Rivers
Biogeochemistry_010 Canopy Water Content Land_Use_014 Watershed Boundaries
Biogeochemistry_011 Canopy Xanthophyll
Cycle (PRI)
7
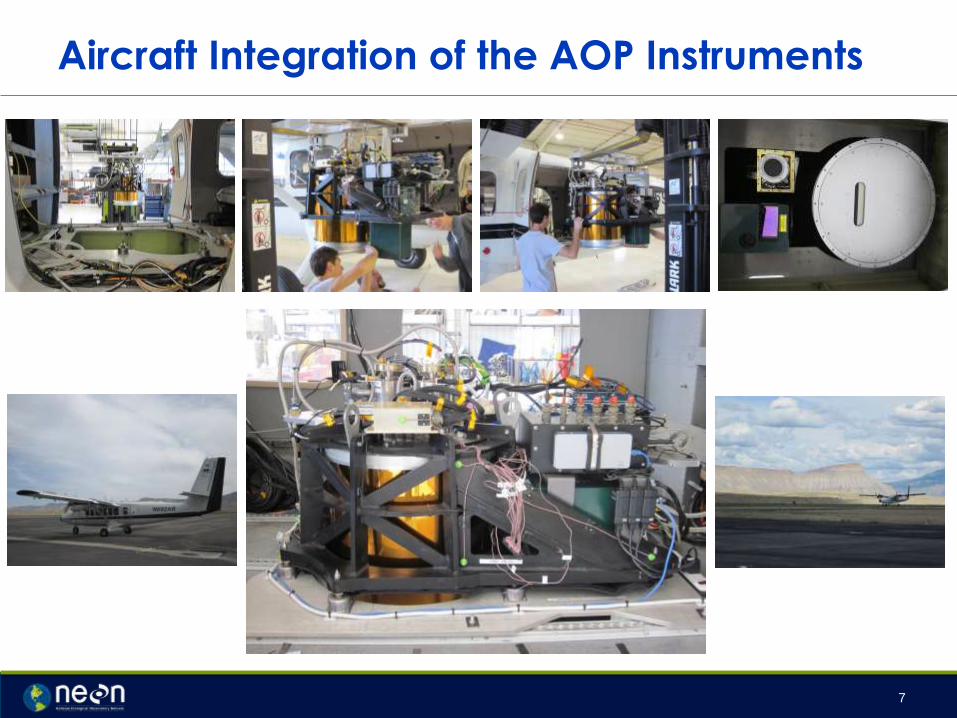
Aircraft Integration of the AOP Instruments
8
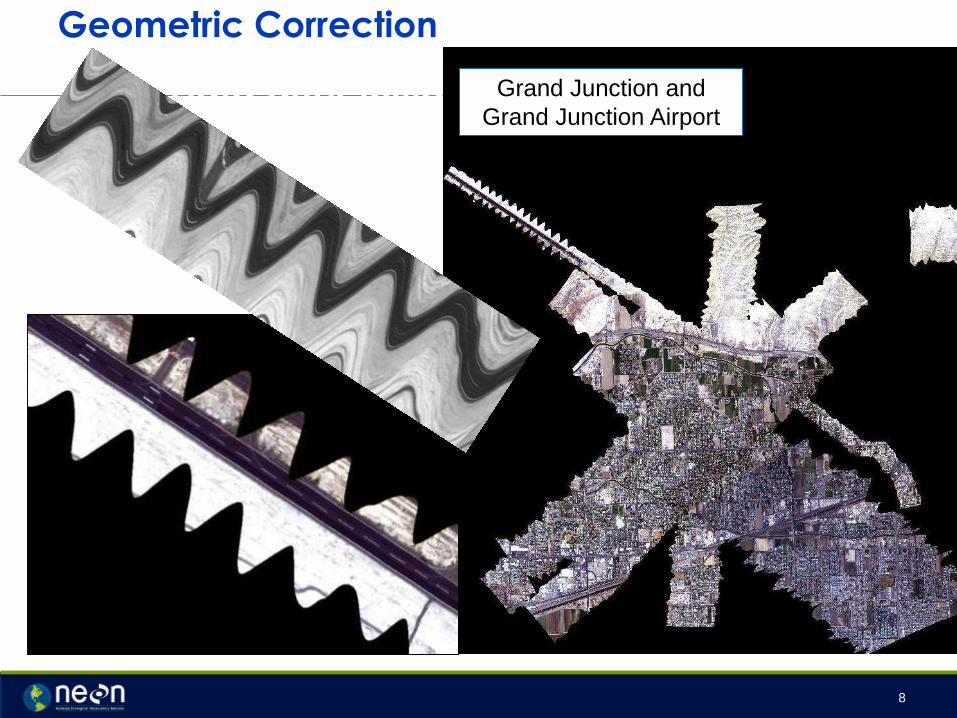
Overlay of Day 1 Flight lines Spectrometer
Data after Initial Geolocation Correction
• ww
Grand Junction and
Grand Junction Airport
Geometric Correction
9
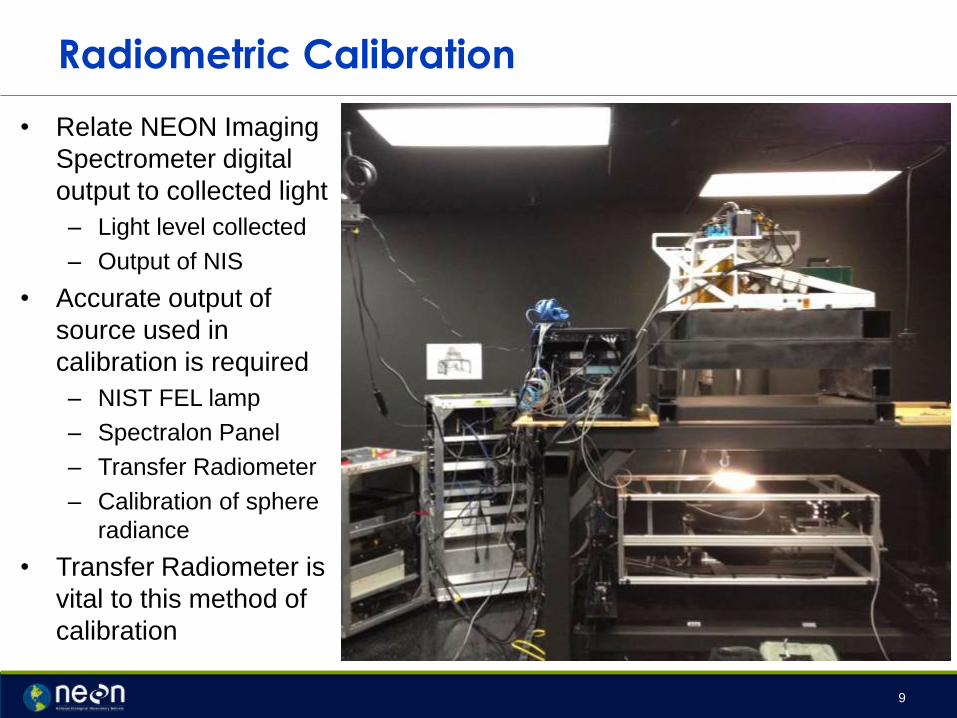
Radiometric Calibration
• Relate NEON Imaging
Spectrometer digital
output to collected light
– Light level collected
– Output of NIS
• Accurate output of
source used in
calibration is required
– NIST FEL lamp
– Spectralon Panel
– Transfer Radiometer
– Calibration of sphere
radiance
• Transfer Radiometer is
vital to this method of
calibration
10
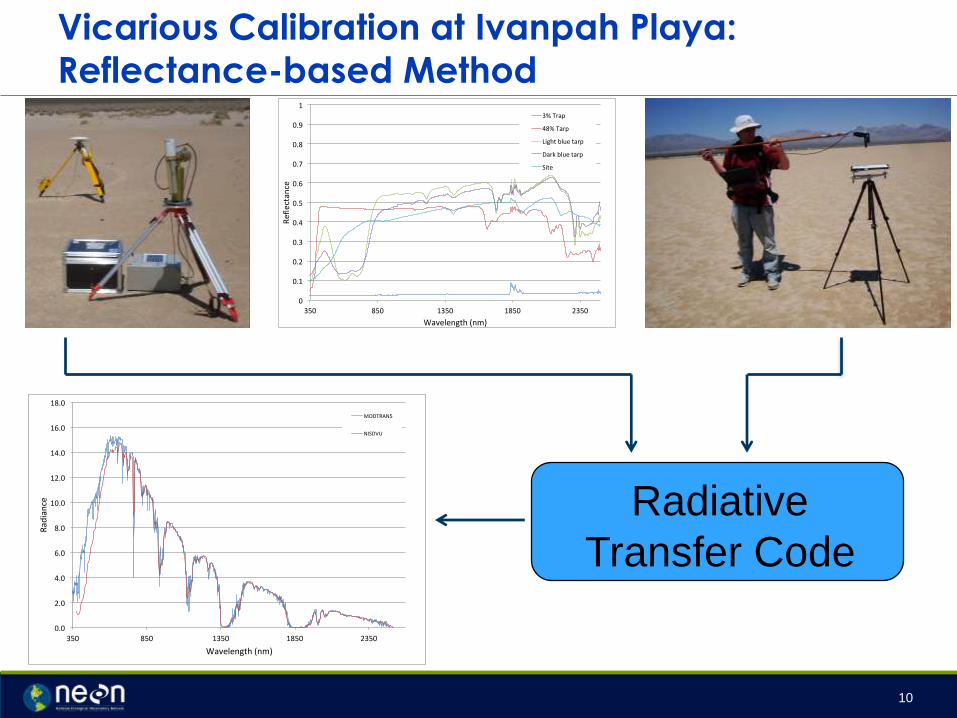
Vicarious Calibration at Ivanpah Playa:
Reflectance-based Method
Radiative
Transfer Code
0
0.1
0.2
0.3
0.4
0.5
0.6
0.7
0.8
0.9
1
350 850 1350 1850 2350
Reflectance
Wavelength(nm)
3%Trap
48%Tarp
Lightbluetarp
Darkbluetarp
Site
0.0
2.0
4.0
6.0
8.0
10.0
12.0
14.0
16.0
18.0
350 850 1350 1850 2350
Radiance
Wavelength(nm)
MODTRAN5
NISDVU
11
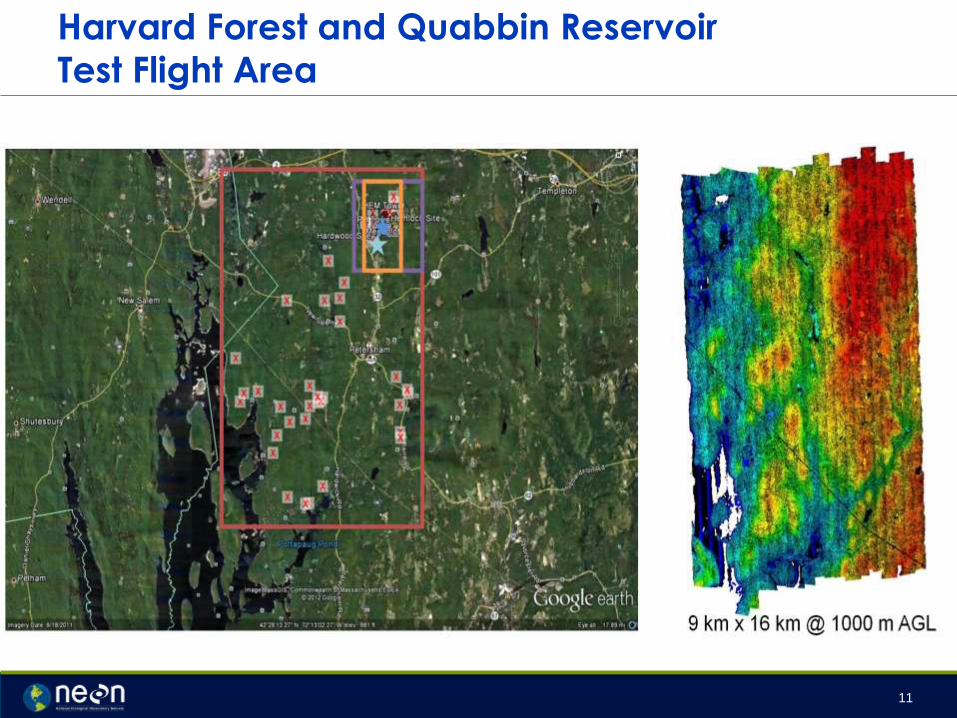
Harvard Forest and Quabbin Reservoir
Test Flight Area
12
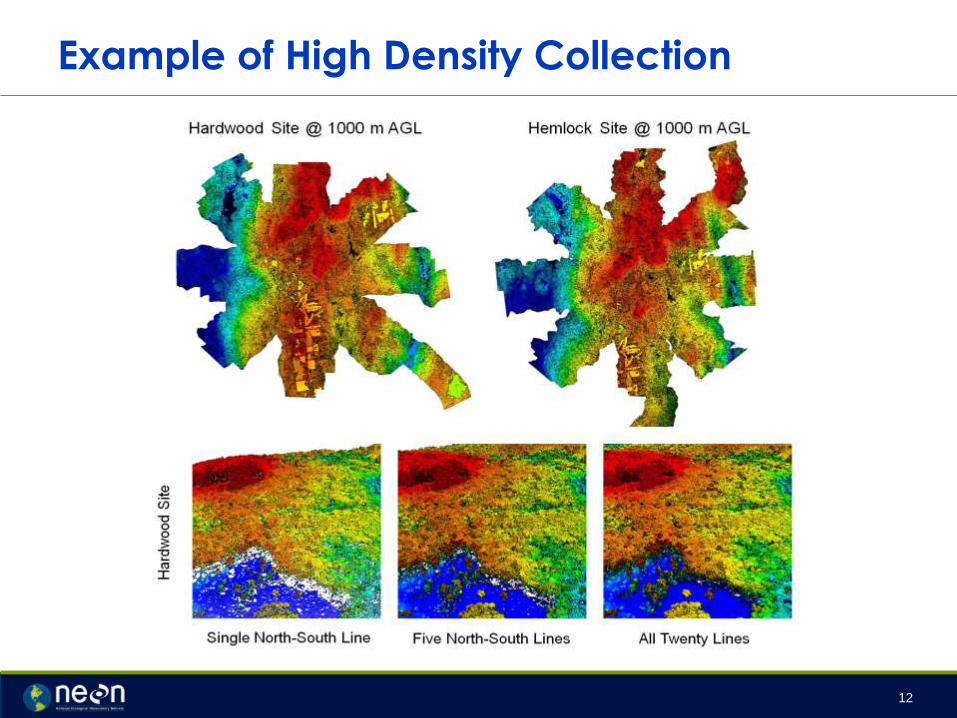
Example of High Density Collection
13
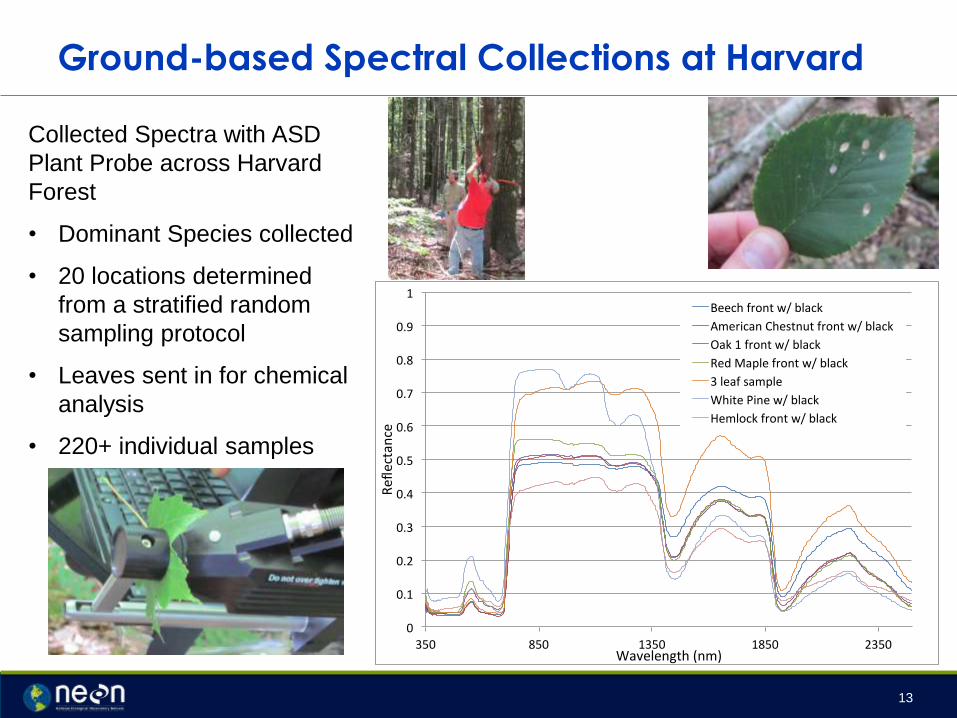
Ground-based Spectral Collections at Harvard
0
0.1
0.2
0.3
0.4
0.5
0.6
0.7
0.8
0.9
1
350 850 1350 1850 2350
Reflectance
Wavelength(nm)
Beechfrontw/black
AmericanChestnutfrontw/black
Oak1frontw/black
RedMaplefrontw/black
3leafsample
WhitePinew/black
Hemlockfrontw/black
Collected Spectra with ASD
Plant Probe across Harvard
Forest
• Dominant Species collected
• 20 locations determined
from a stratified random
sampling protocol
• Leaves sent in for chemical
analysis
• 220+ individual samples
14
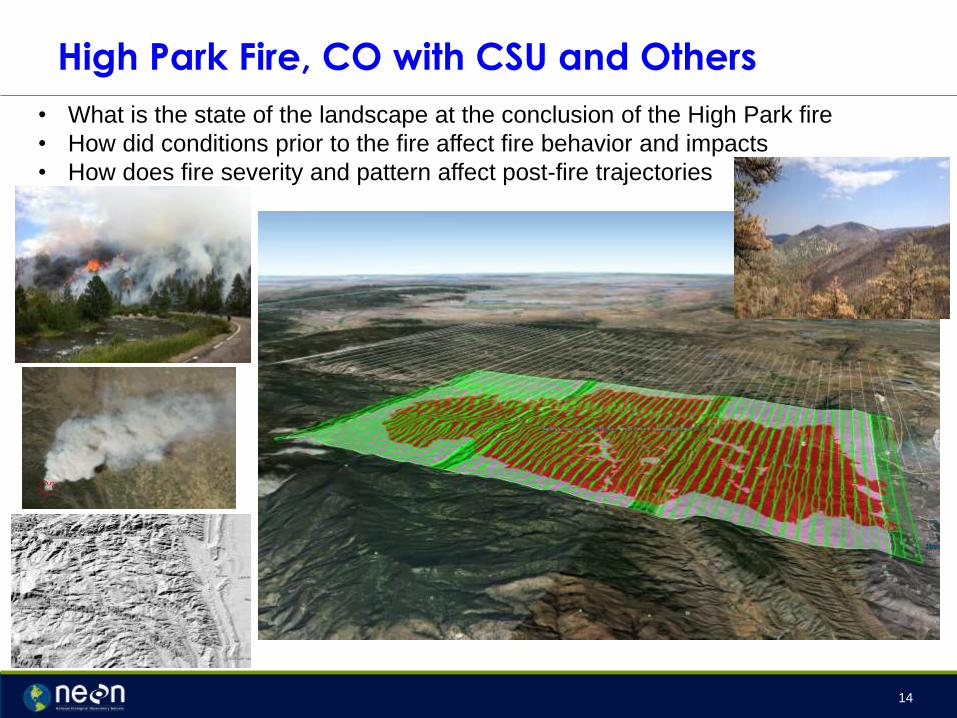
High Park Fire, CO with CSU and Others
• What is the state of the landscape at the conclusion of the High Park fire
• How did conditions prior to the fire affect fire behavior and impacts
• How does fire severity and pattern affect post-fire trajectories
15
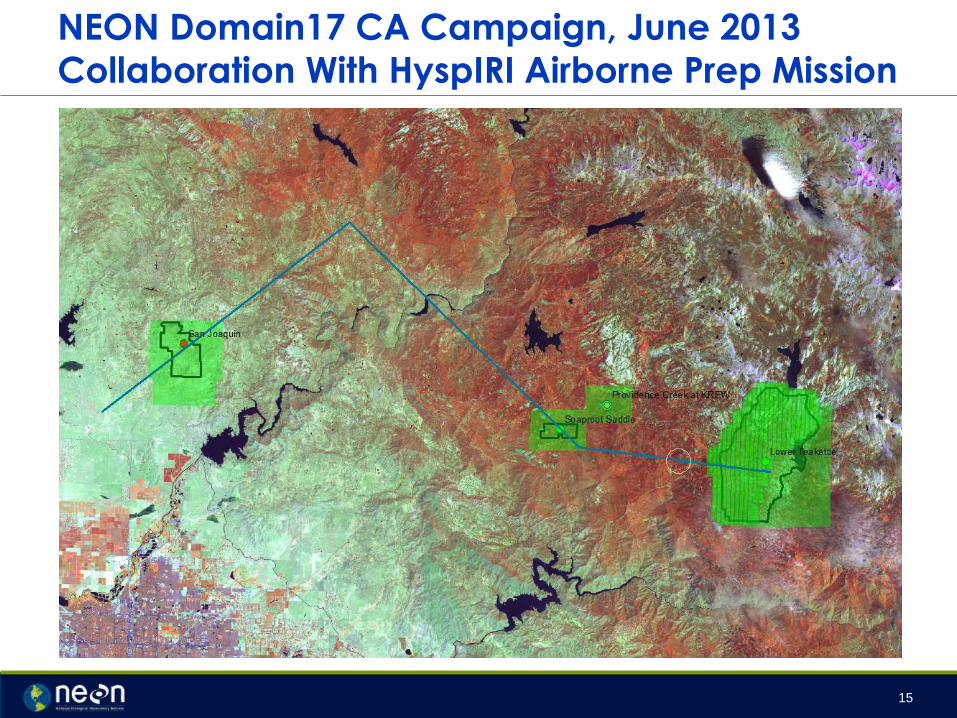
NEON Domain17 CA Campaign, June 2013
Collaboration With HyspIRI Airborne Prep Mission
16
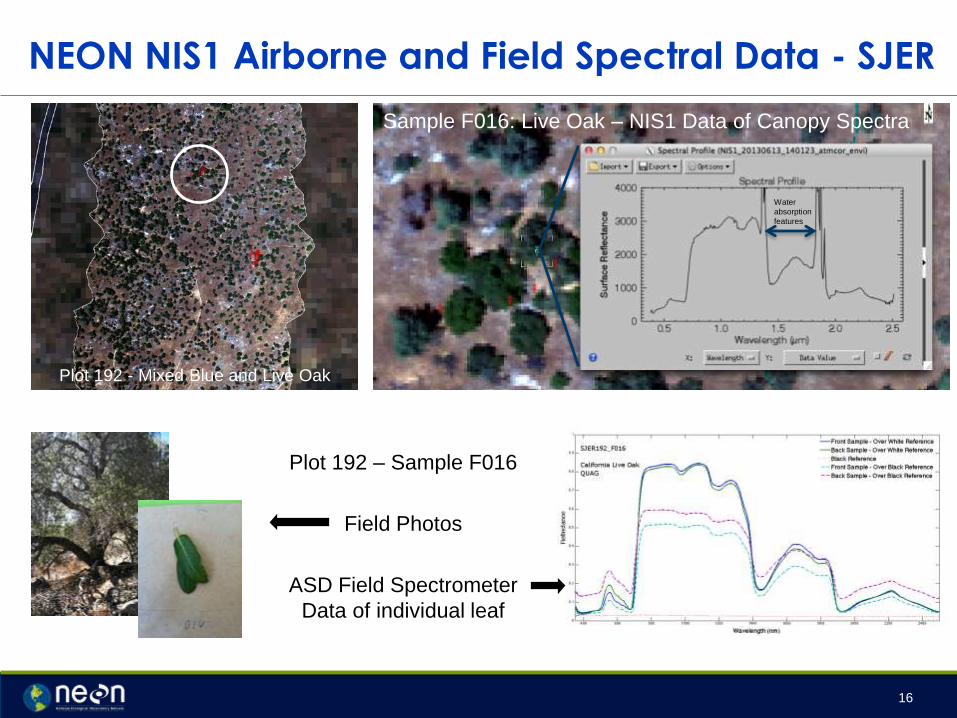
NEON NIS1 Airborne and Field Spectral Data - SJER
Plot 192 - Mixed Blue and Live Oak
Sample F016: Live Oak – NIS1 Data of Canopy Spectra
Plot 192 – Sample F016
Field Photos
ASD Field Spectrometer
Data of individual leaf
Water
absorption
features
17
• AOP flew 21 days of flights in 2012 including: – Test flights around Grand Junction, CO and part of Grand Mesa National Forest, CO
– Cuprite, NV,
– Radiometric calibration flight at Ivanpah, CA
– Nominal collections and instrument/altitude tests at Harvard Forest, MA
– Two flight campaigns to map the High Park Fire burn scar here in Colorado
• Data collection in 2013 includes:– Test flights in Grand Junction, CO
– Radiometric calibration in Railroad Valley, NV
– Nominal data collections in Domain17 (San Joaquin, Soaproot Saddle, and Lower Teakettle, CA)
– Nominal data collections in Domain10 (CPER, Sterling, and RMNP CASTNET, CO)
– Re-flight of the High Park Fire burn scar
• Data collection in 2014 includes:– Test flights in Grand Junction, CO
– Radiometric calibration in Railroad Valley, NV
– Nominal flights at all three D03 sites: Disney, Ordway-Swisher Biological Station, and Jones Ecological Research Center
– Nominal flights at D01 sites: Harvard Forest, Bartlett Forest, and Burlington
– More engineering flights to come plus re-flight of the High Park Fire burn scar
• We are currently working on data processing. Some of the D17 provisional data has been recently released to the science community and we hope to release the D03 and D01 data in the near future.
High Level Update
18
The National Ecological Observatory Network is a project sponsored by the National Science
Foundation and managed under cooperative agreement by NEON Inc.