Embed Size (px)
Citation preview
Simone VincenziEU Marie Curie FellowUniversity of California Santa Cruz, USPolytechnic of Milan, Italysimonevincenzi.com (publications)
HMS, July 2015
Eco-evolutionary responses to extreme events
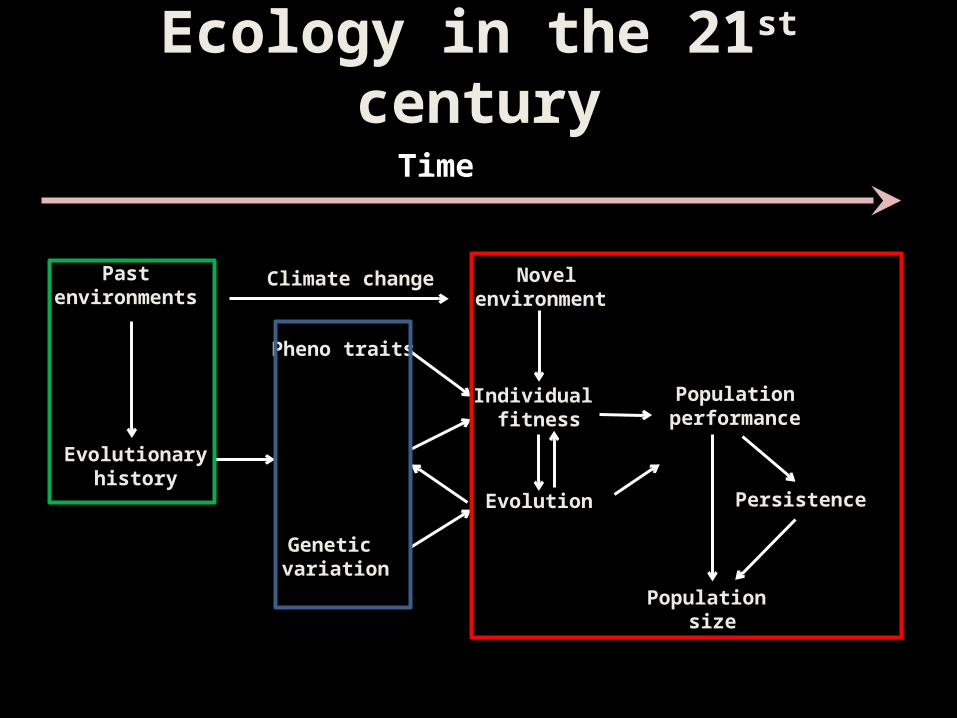
Ecology in the 21st century
Past environments
Evolutionary history
Pheno traits
Genetic variation
Climate change Novelenvironment
Individual fitness
Evolution
Population performance
Population size
Persistence
Time
The world is becoming more extreme
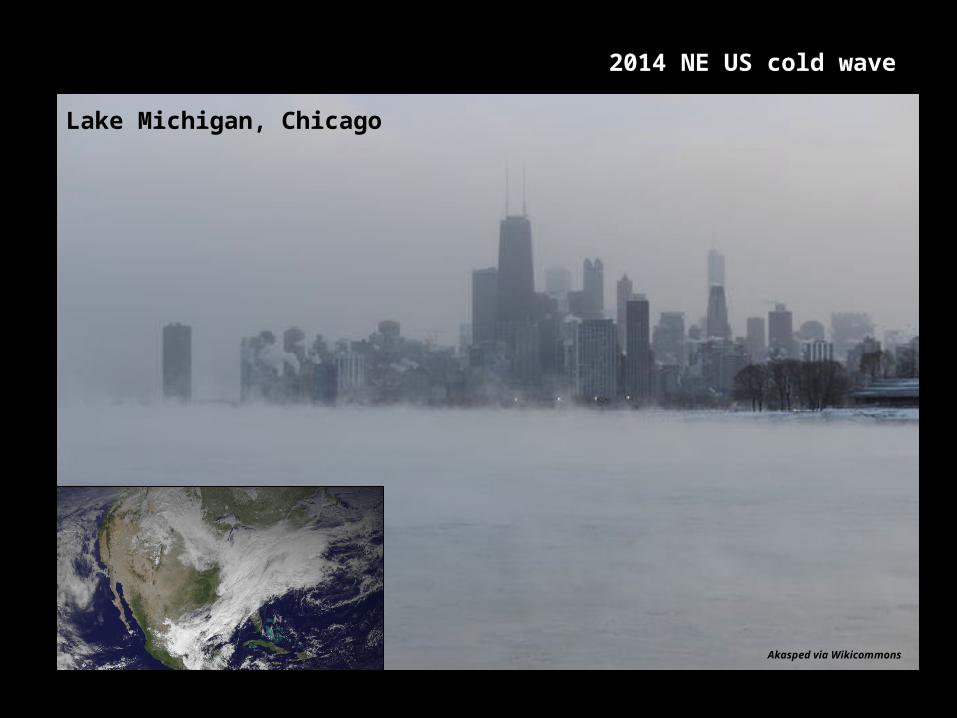
2014 NE US cold wave
Akasped via Wikicommons
Lake Michigan, Chicago
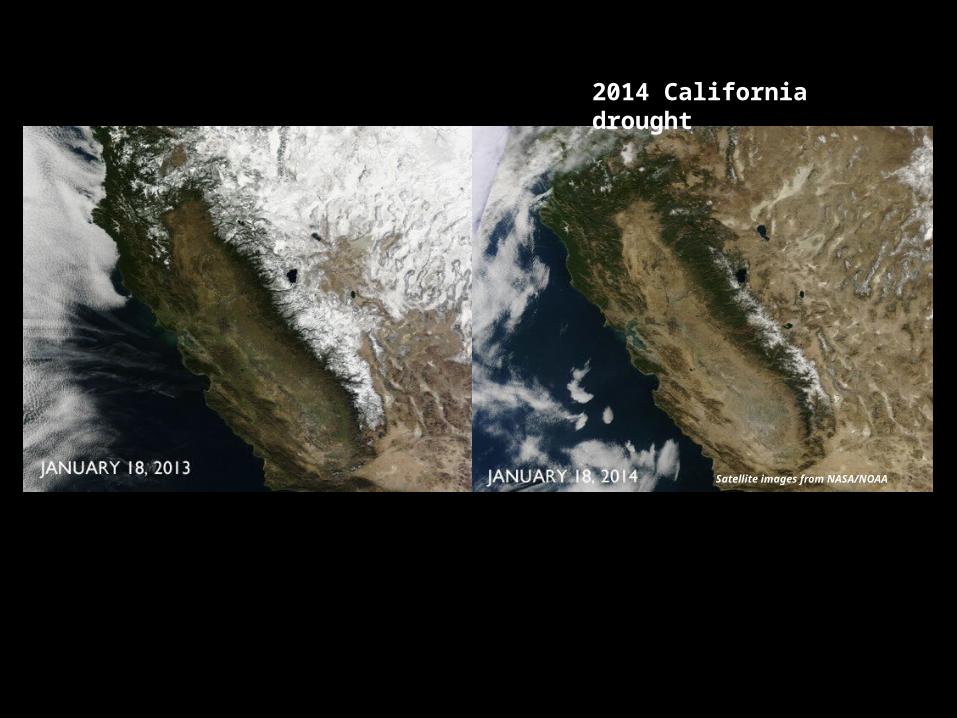
2014 California drought
Satellite images from NASA/NOAA
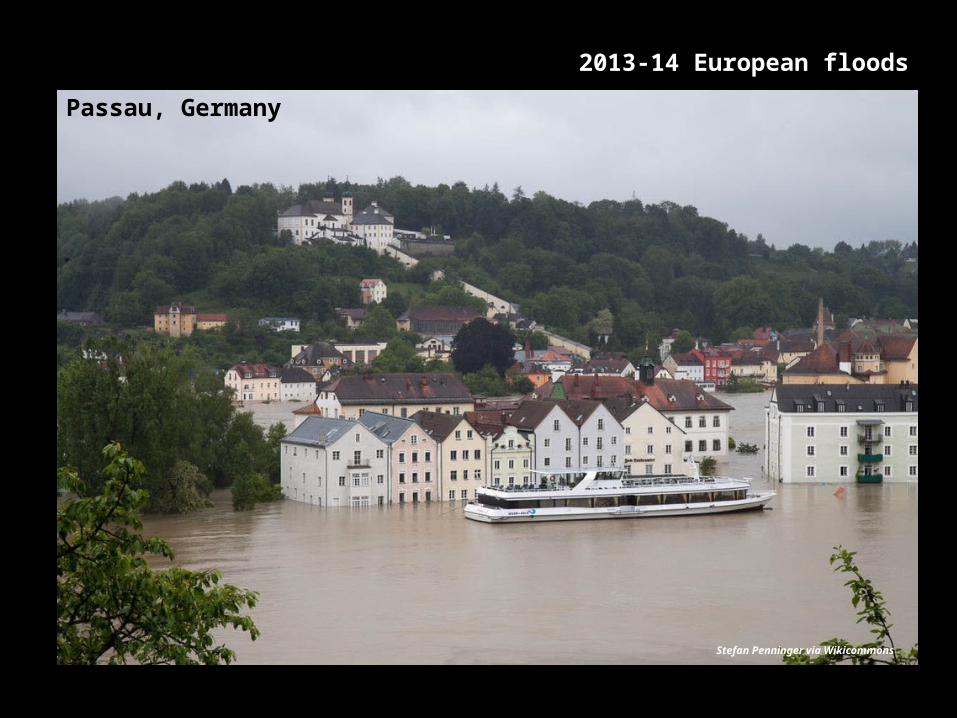
2013-14 European floods
Stefan Penninger via Wikicommons
Passau, Germany
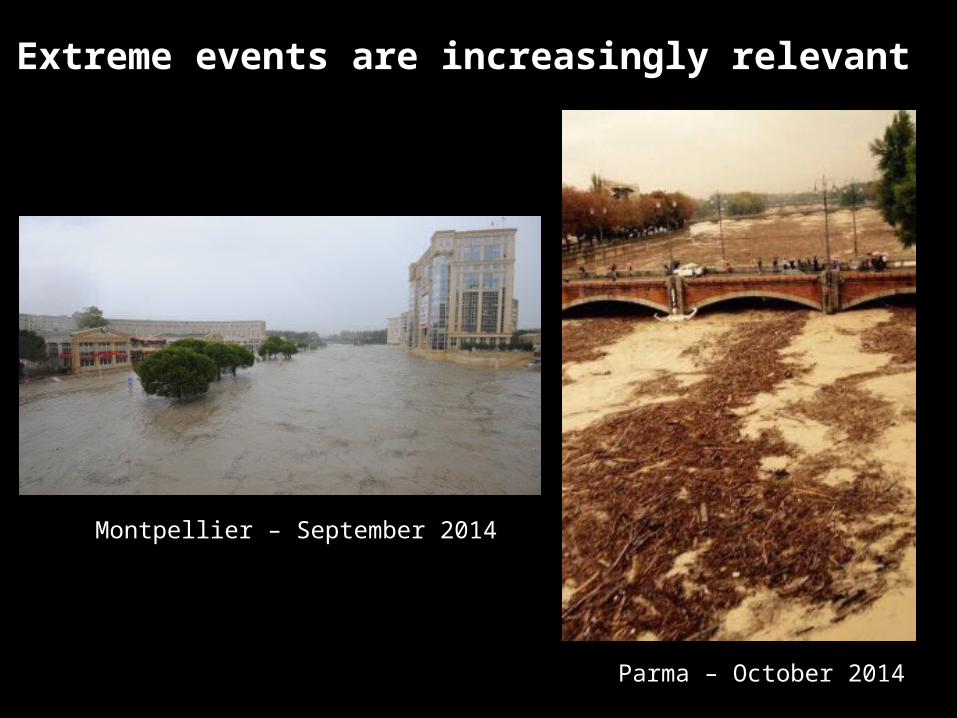
Extreme events are increasingly relevant
Montpellier – September 2014
Parma – October 2014
Adaptations?
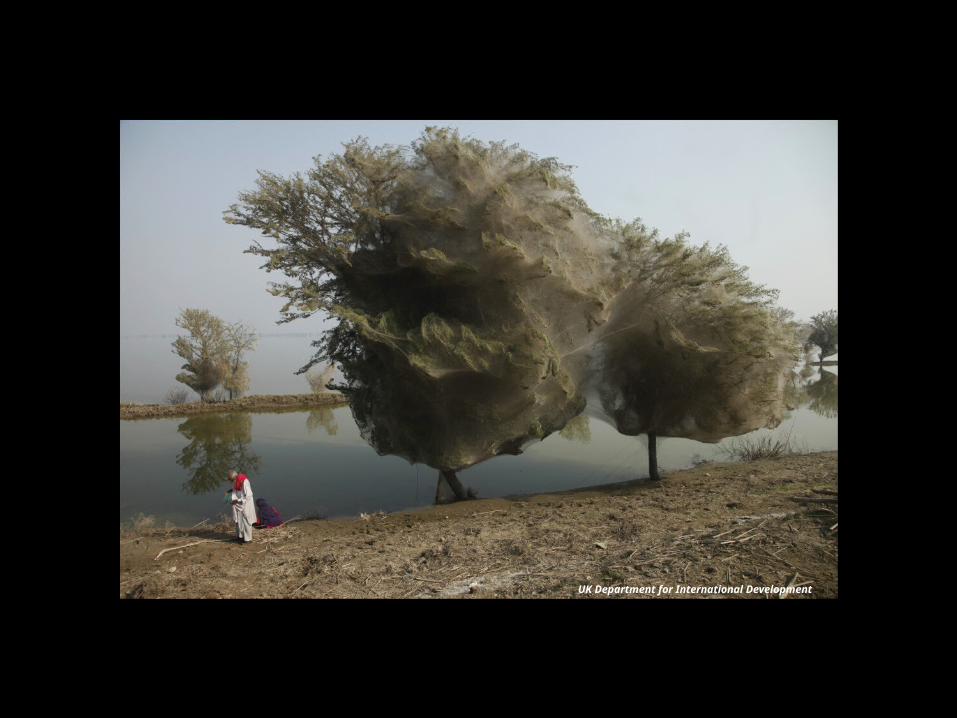
UK Department for International Development
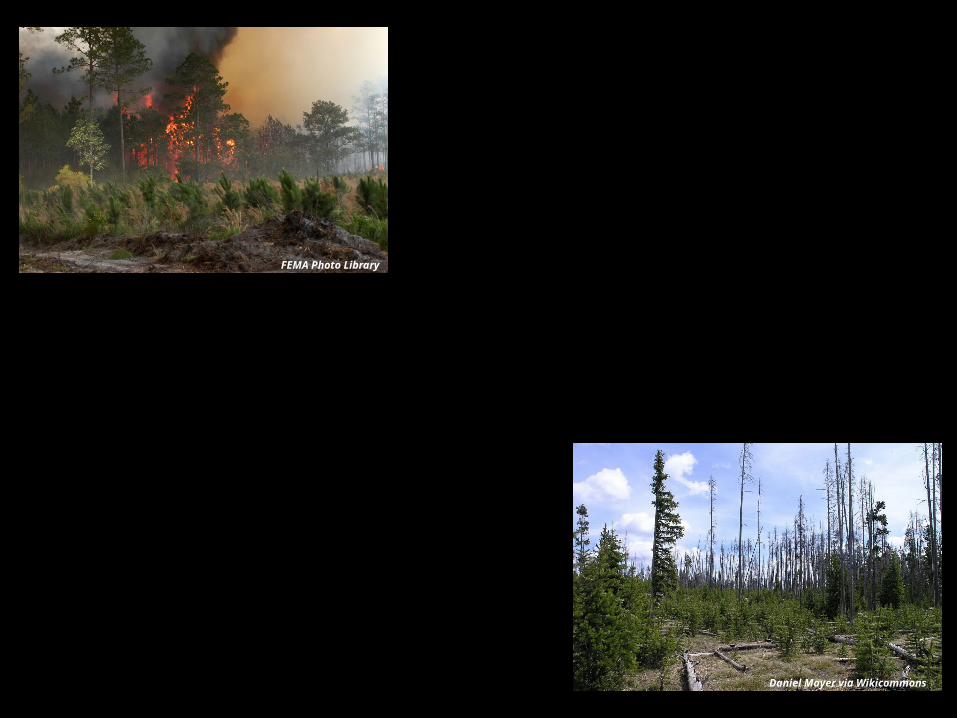
FEMA Photo Library
Daniel Mayer via Wikicommons
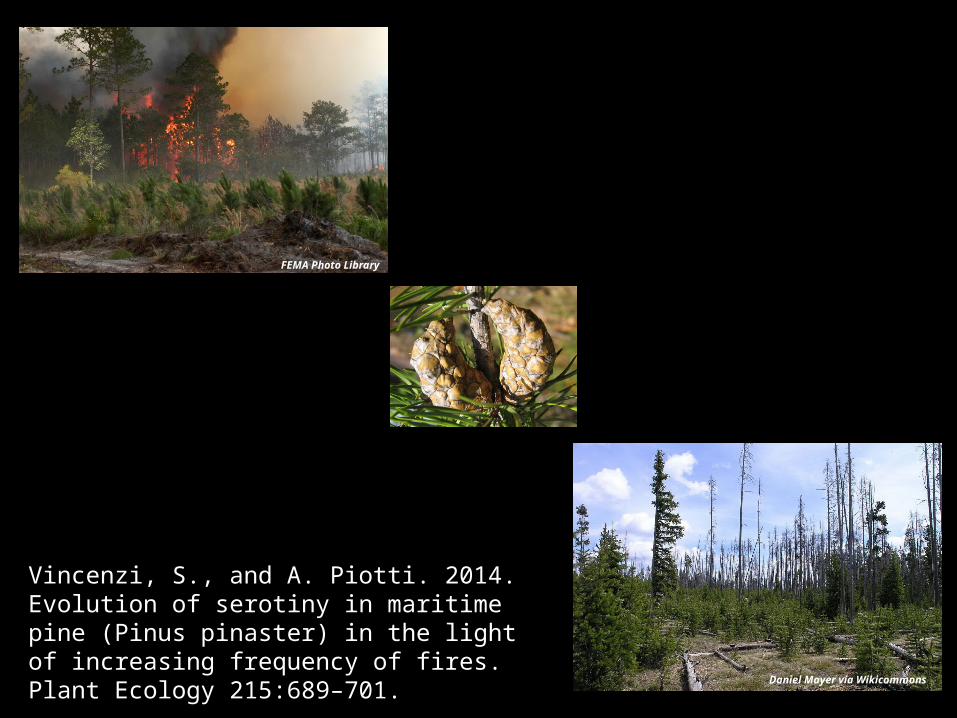
FEMA Photo Library
Daniel Mayer via Wikicommons
Vincenzi, S., and A. Piotti. 2014. Evolution of serotiny in maritime pine (Pinus pinaster) in the light of increasing frequency of fires. Plant Ecology 215:689–701.
Example from my study system
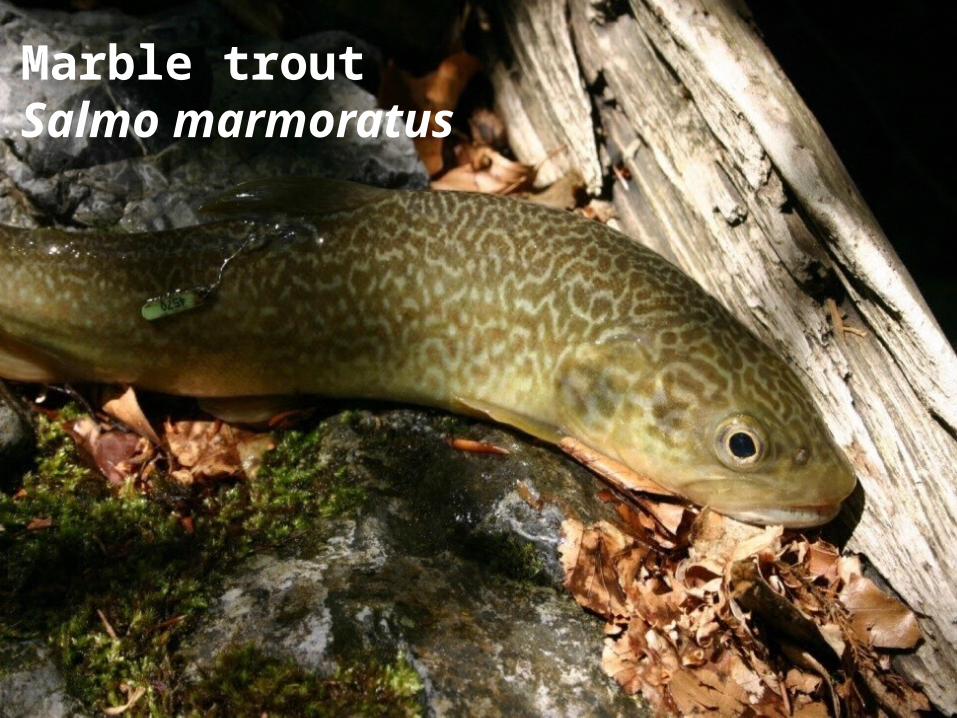
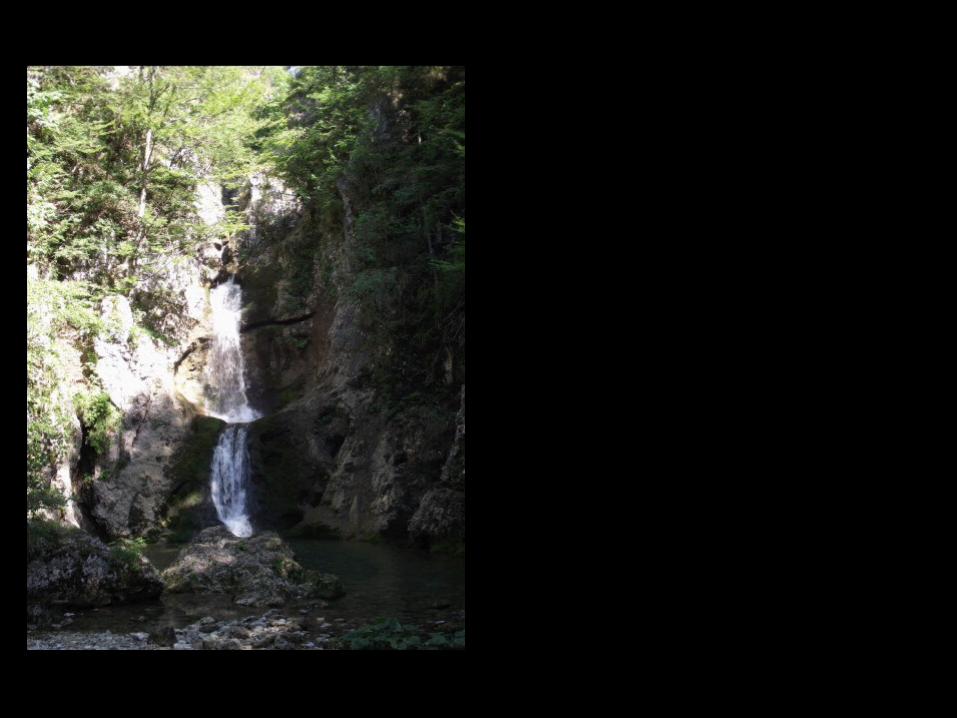
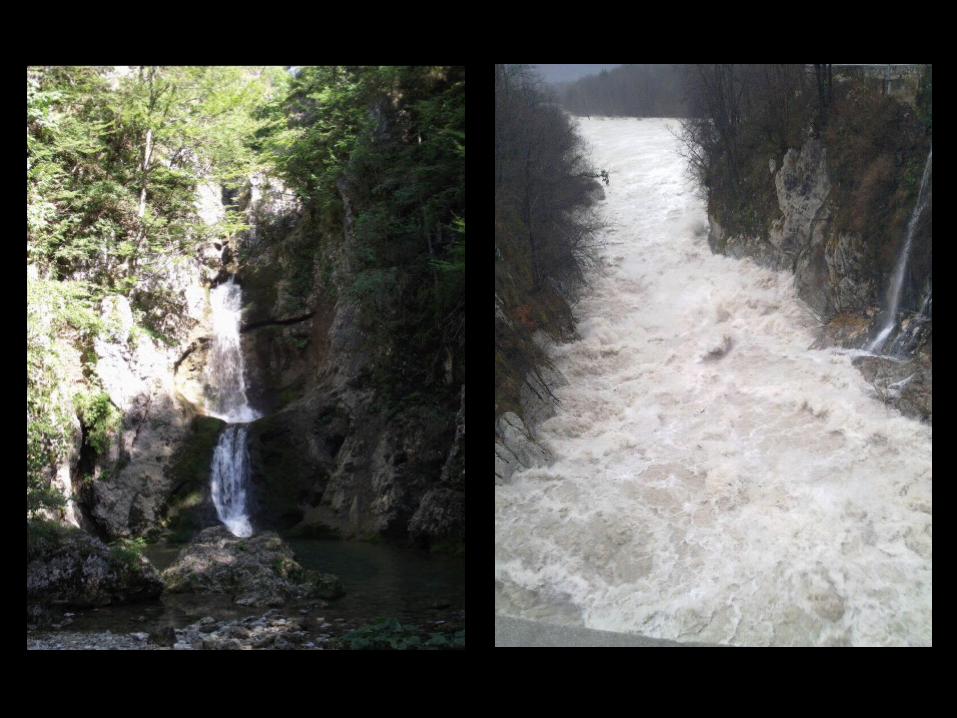
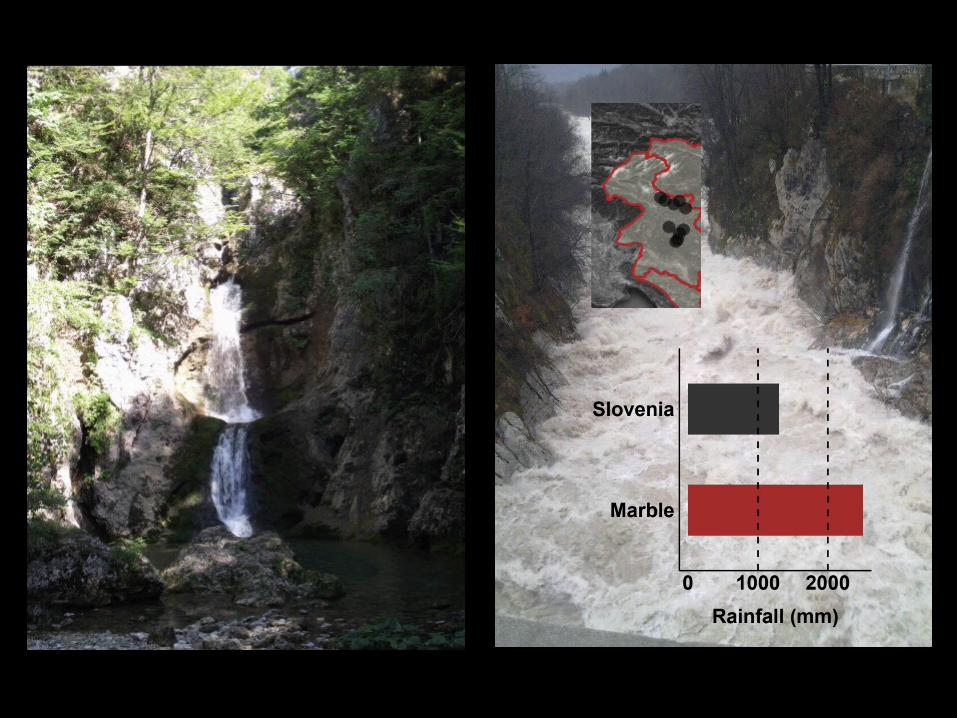
Marble trout Salmo marmoratus
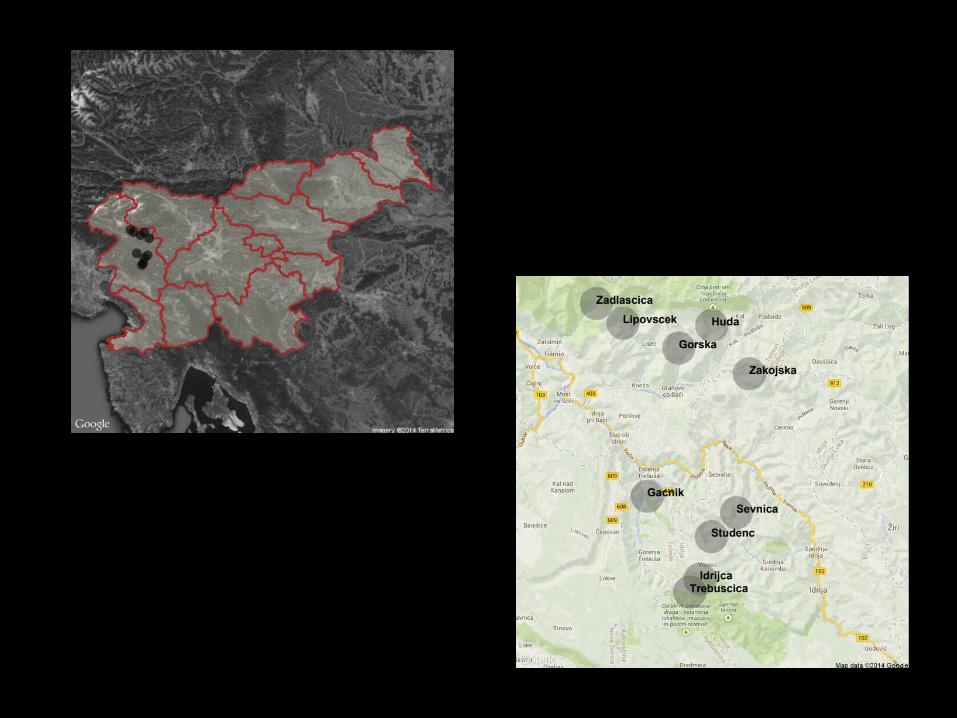
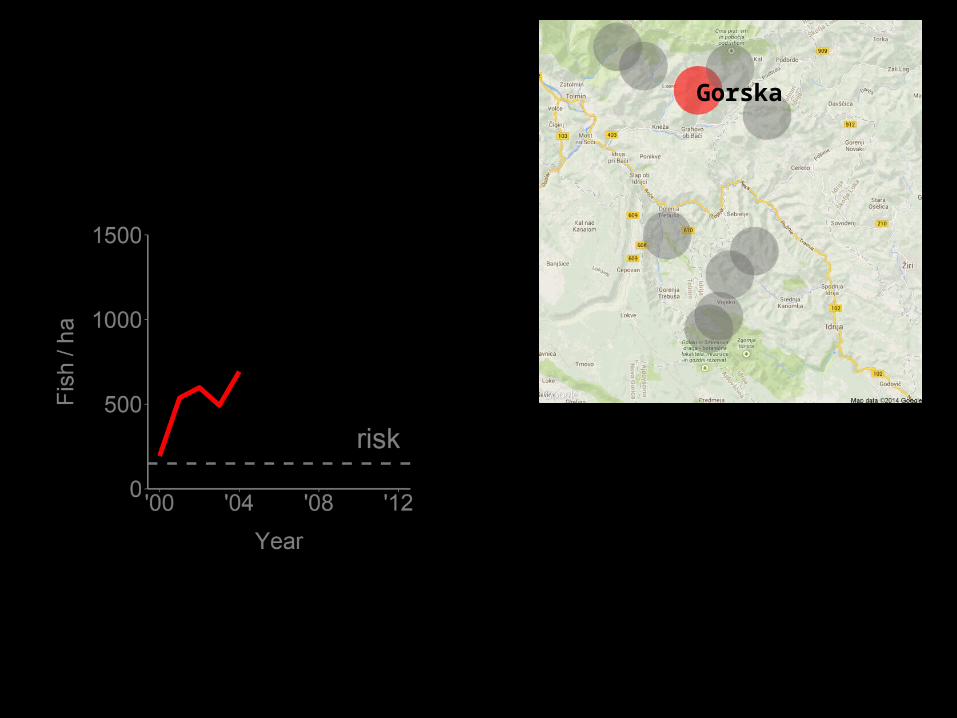
Gorska
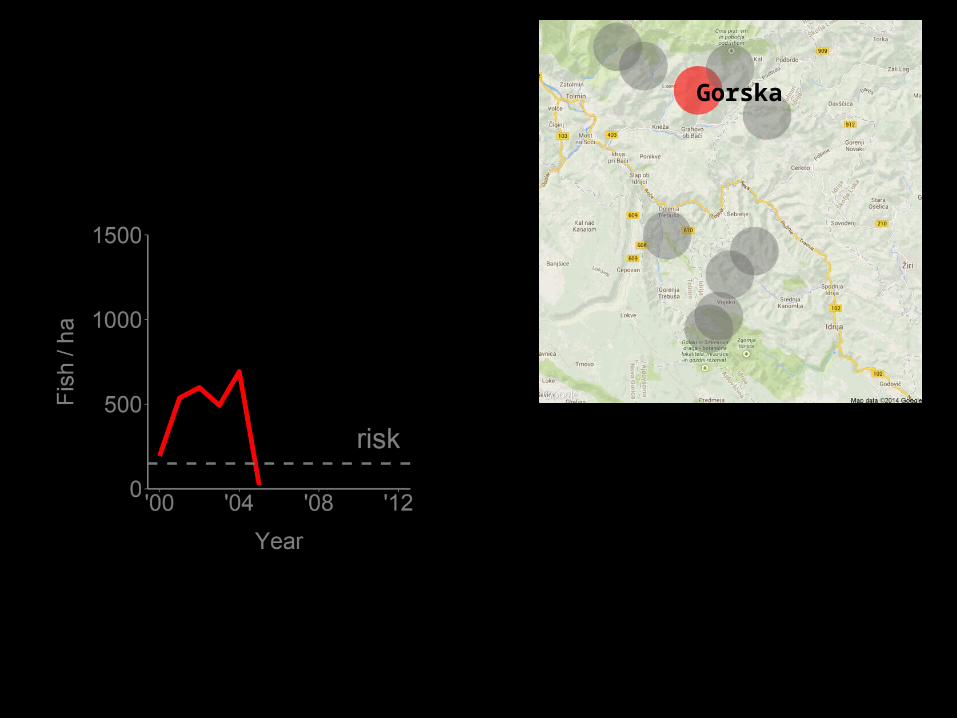
Gorska
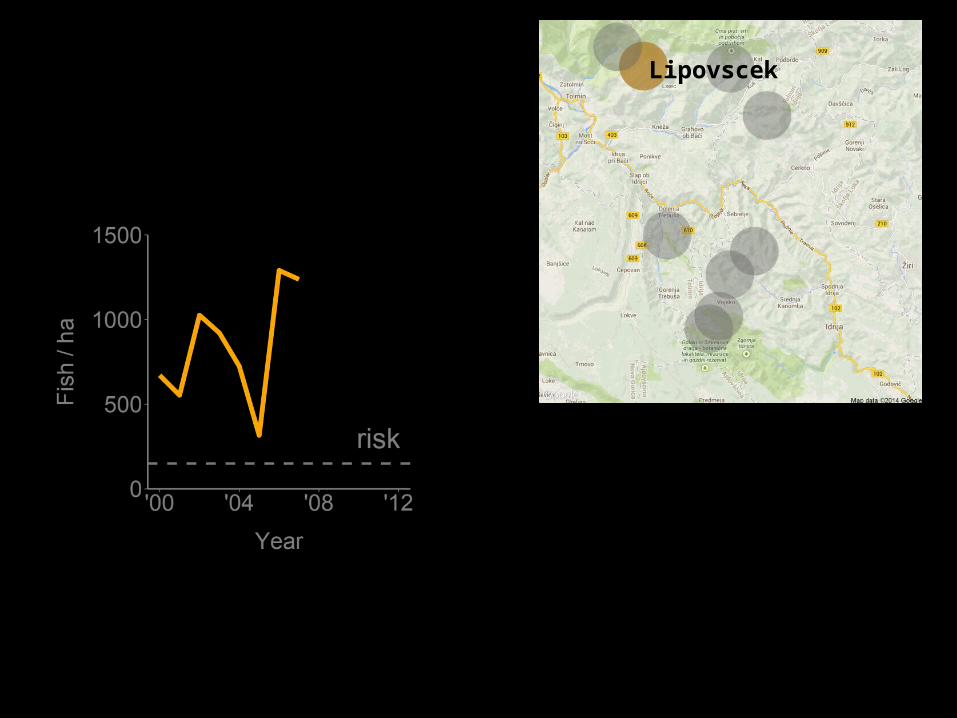
Lipovscek
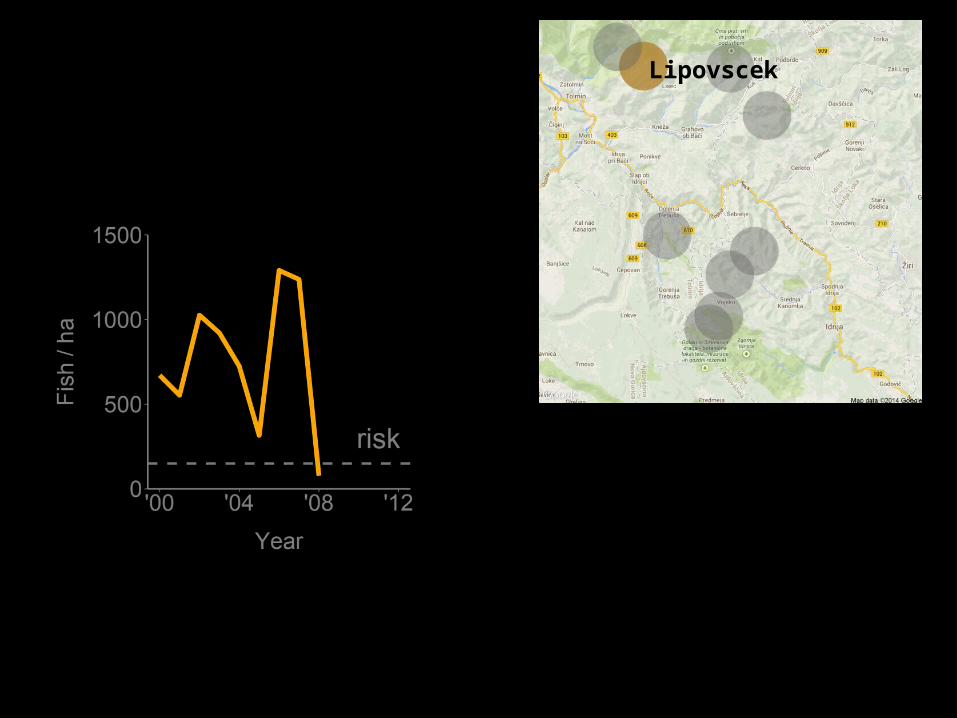
Lipovscek
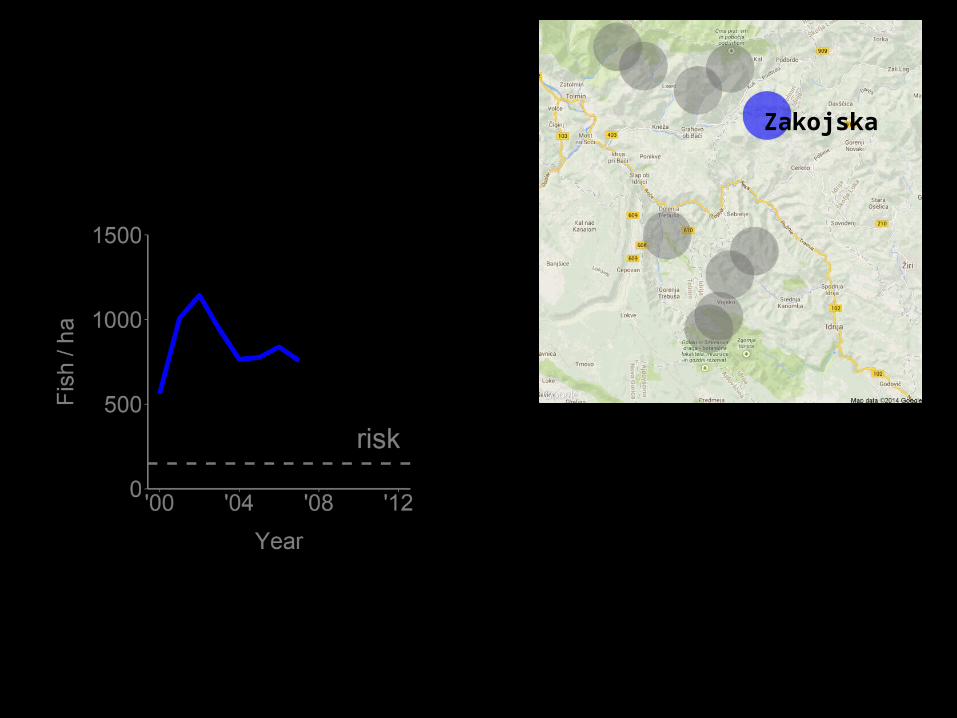
Zakojska
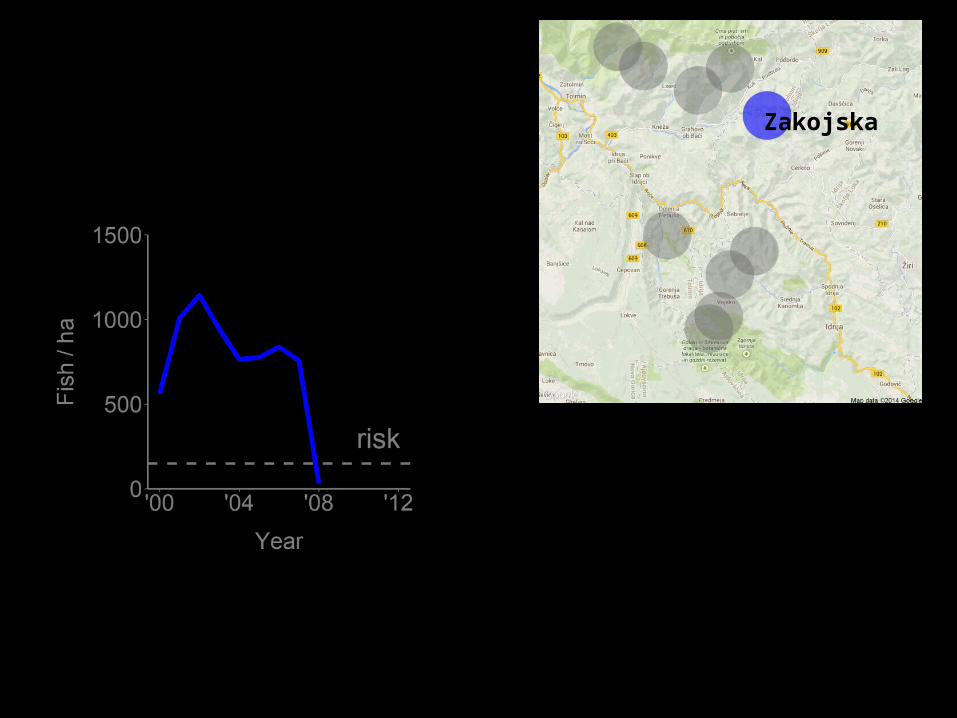
Zakojska
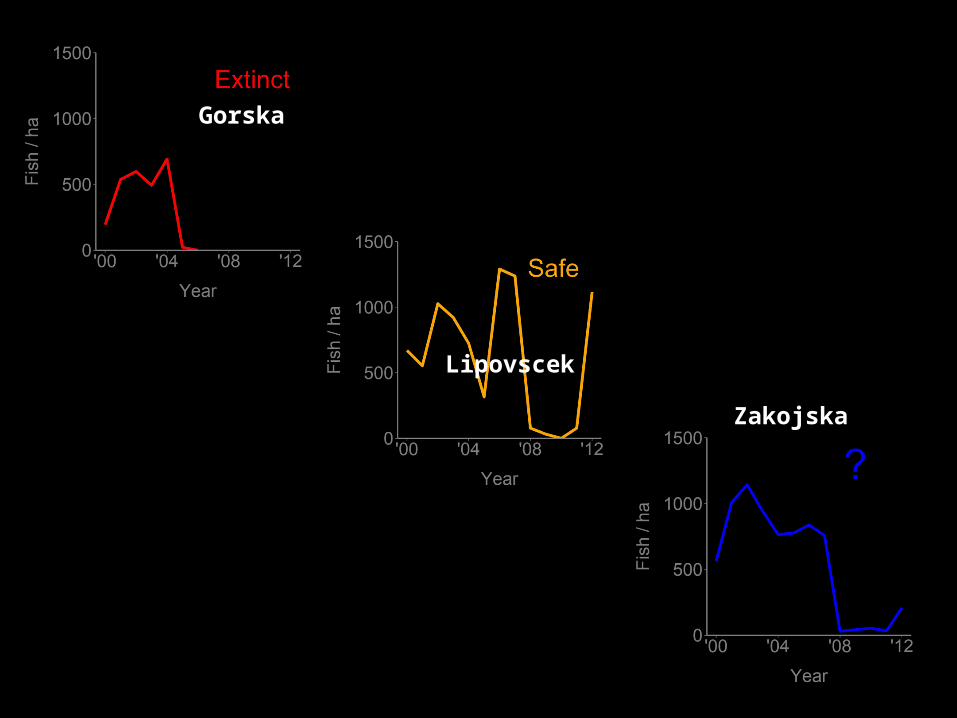
Zakojska
Lipovscek
Gorska
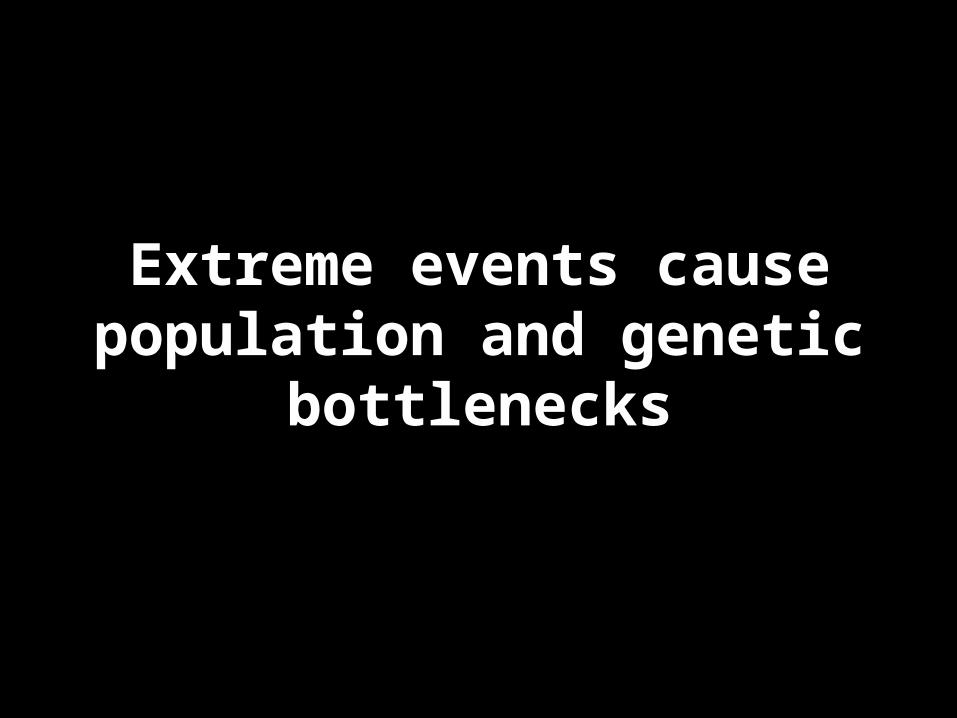
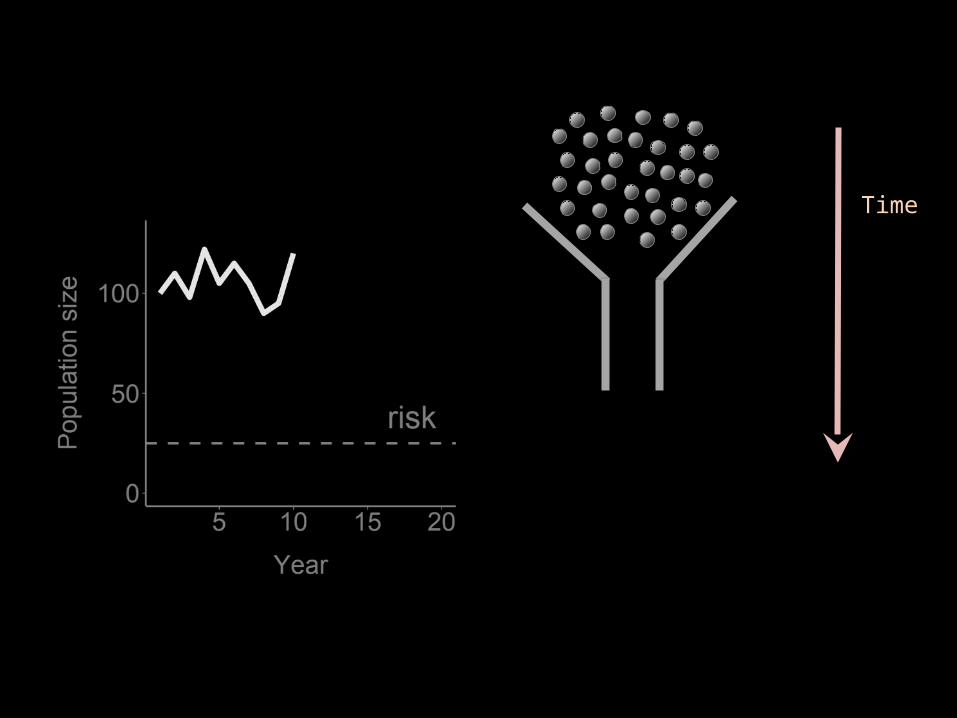
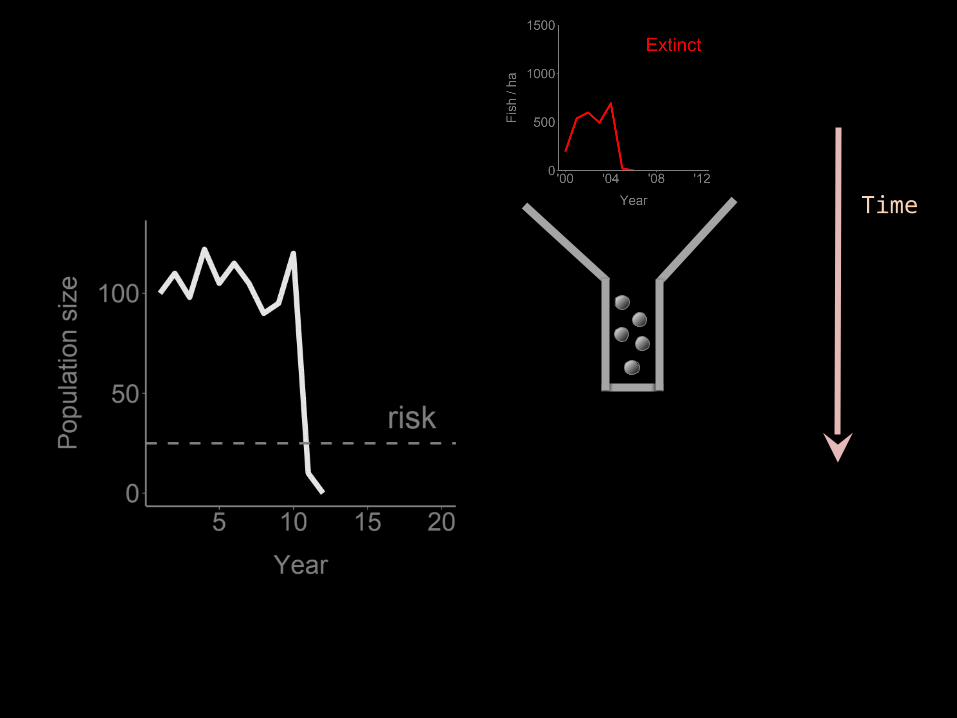
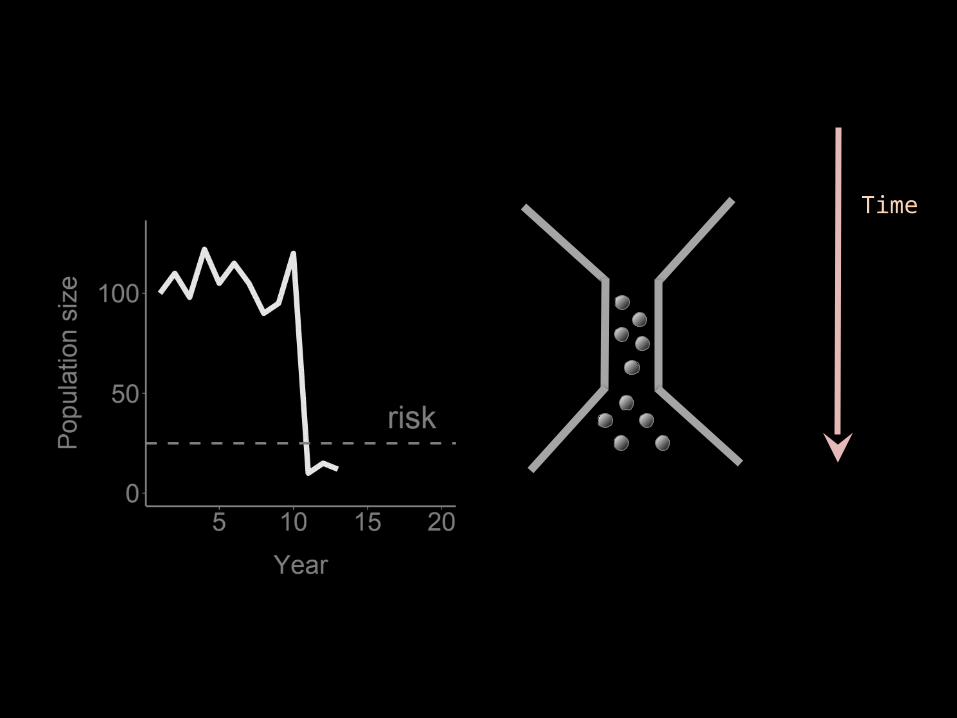
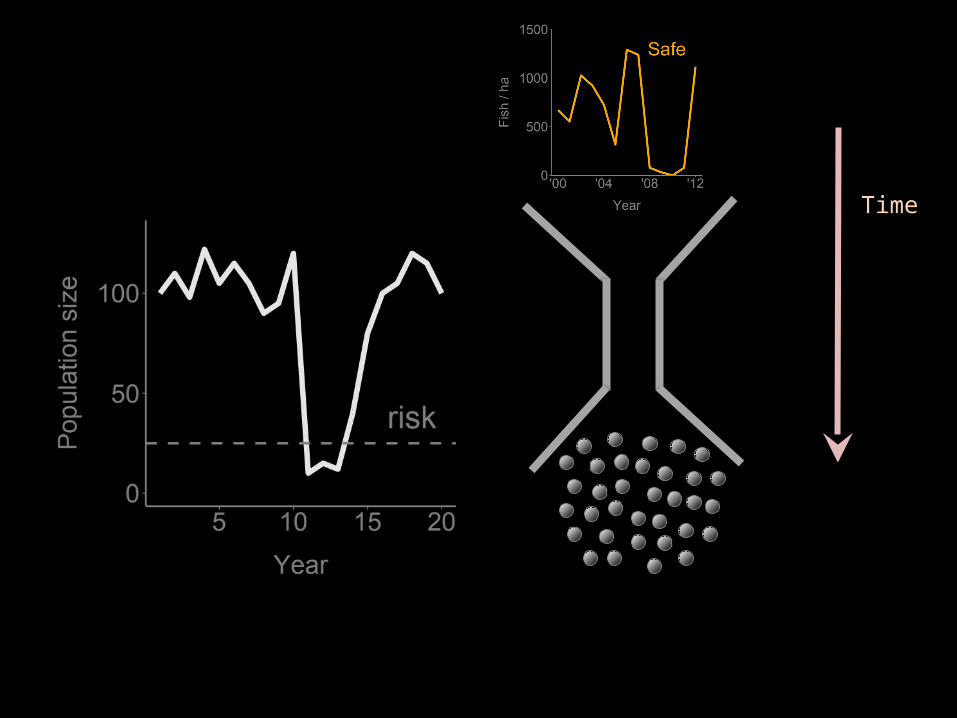
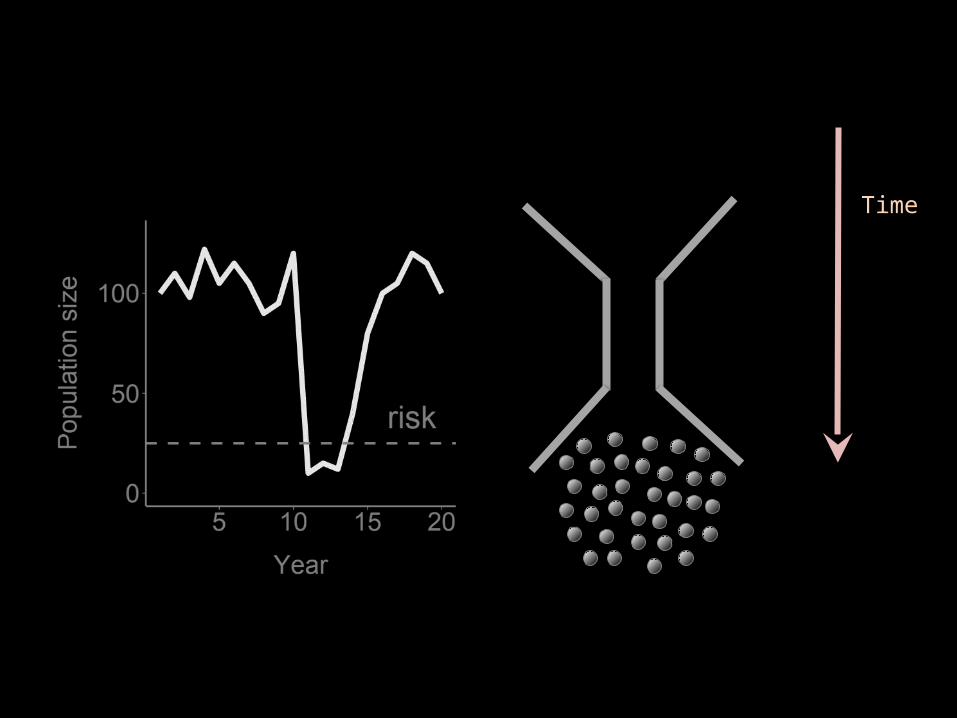
Extreme events cause population and genetic
bottlenecks
Time
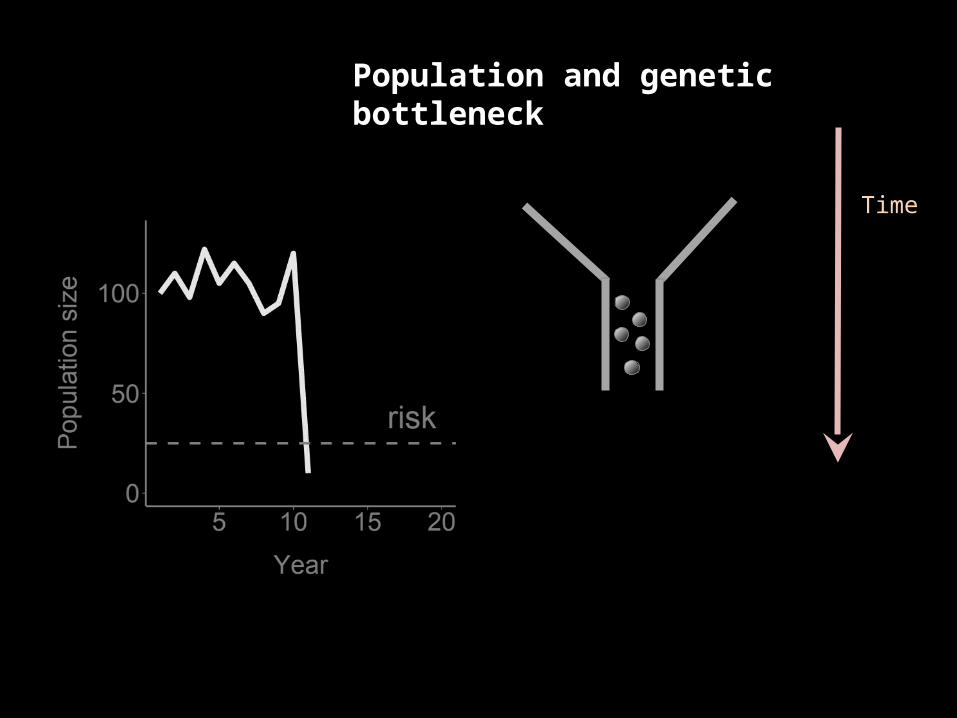
Population and genetic bottleneck
Time
Time
Time
Time
Time

Underreported
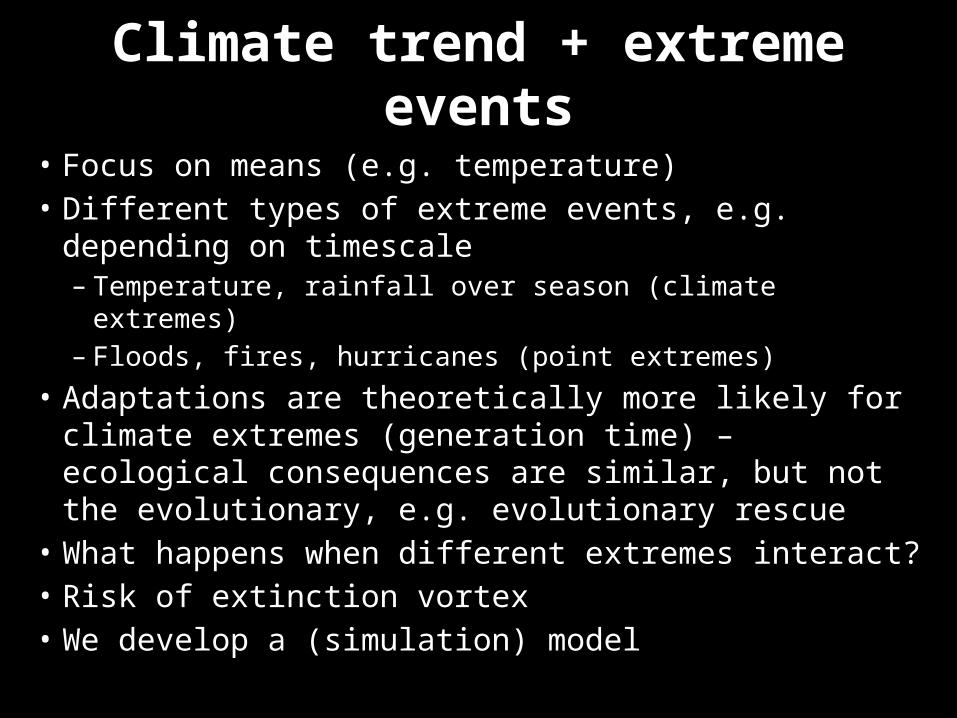
Climate trend + extreme events
• Focus on means (e.g. temperature)• Different types of extreme events, e.g.
depending on timescale– Temperature, rainfall over season (climate extremes)– Floods, fires, hurricanes (point extremes)
• Adaptations are theoretically more likely for climate extremes (generation time) – ecological consequences are similar, but not the evolutionary, e.g. evolutionary rescue
• What happens when different extremes interact?• Risk of extinction vortex• We develop a (simulation) model
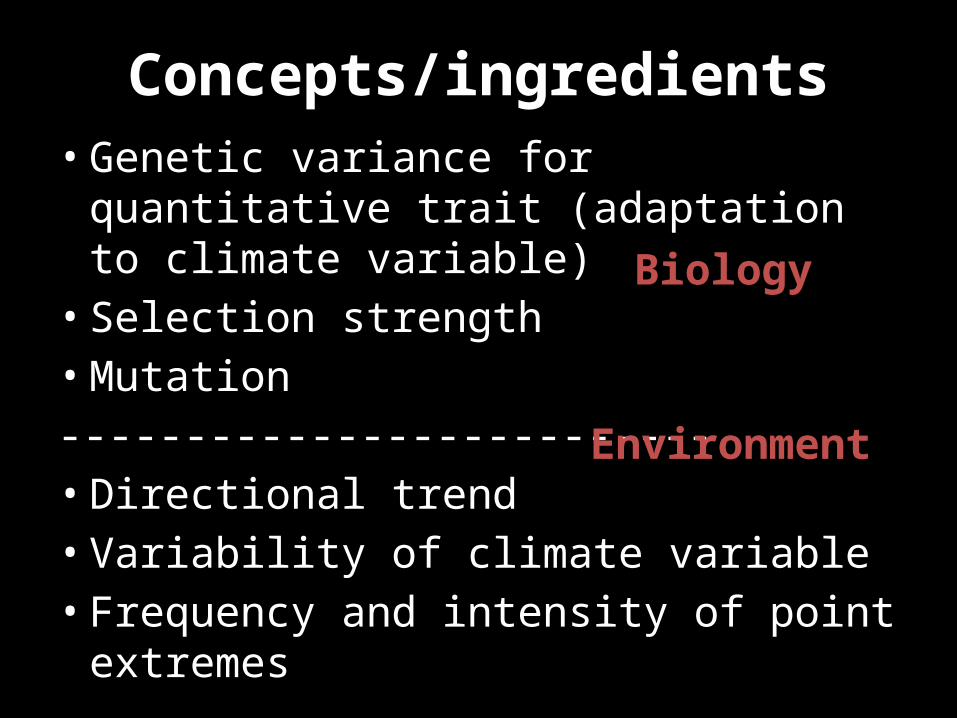
Concepts/ingredients• Genetic variance for quantitative
trait (adaptation to climate variable)• Selection strength• Mutation --------------------------• Directional trend• Variability of climate variable• Frequency and intensity of point
extremes
Biology
Environment
Environment
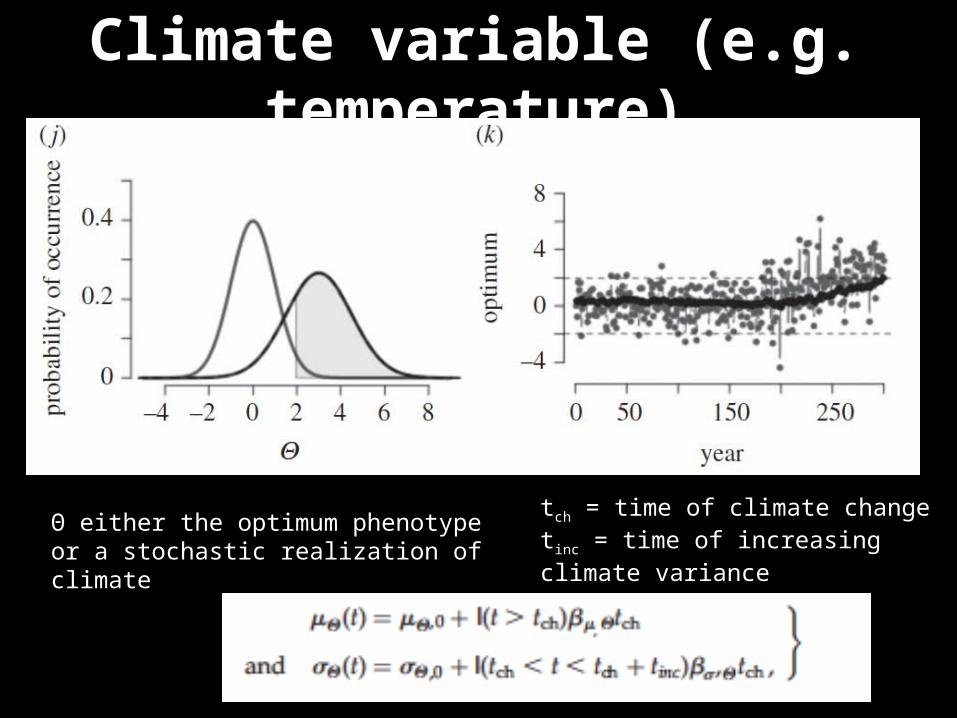
Climate variable (e.g. temperature)
tch = time of climate changetinc = time of increasing climate variance
Θ either the optimum phenotype or a stochastic realization of climate
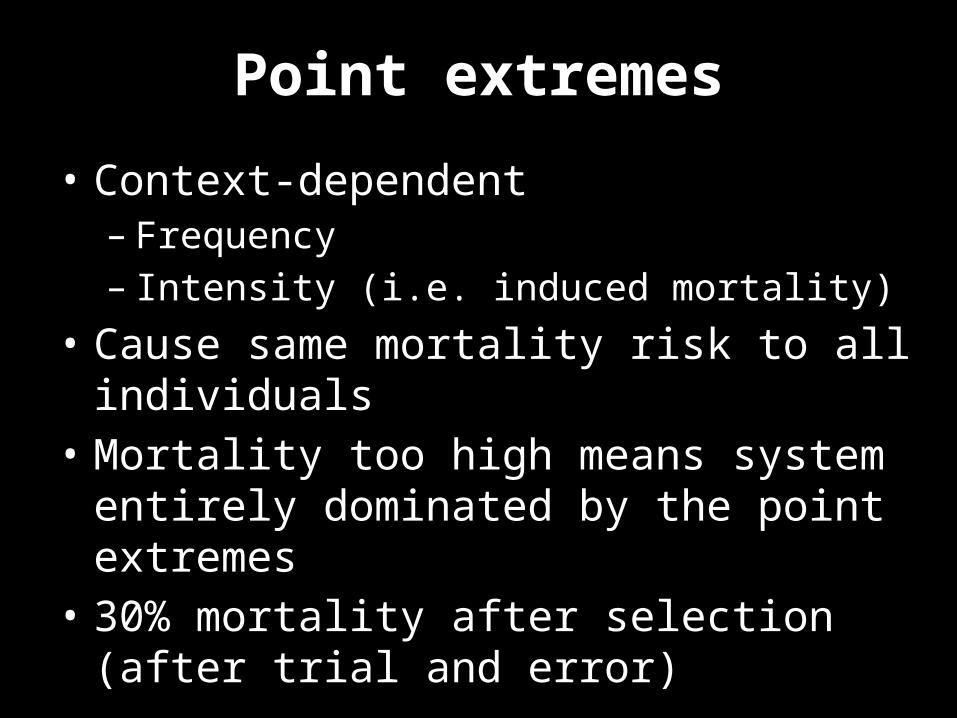
Point extremes• Context-dependent– Frequency – Intensity (i.e. induced mortality)
• Cause same mortality risk to all individuals
• Mortality too high means system entirely dominated by the point extremes
• 30% mortality after selection (after trial and error)

Biology
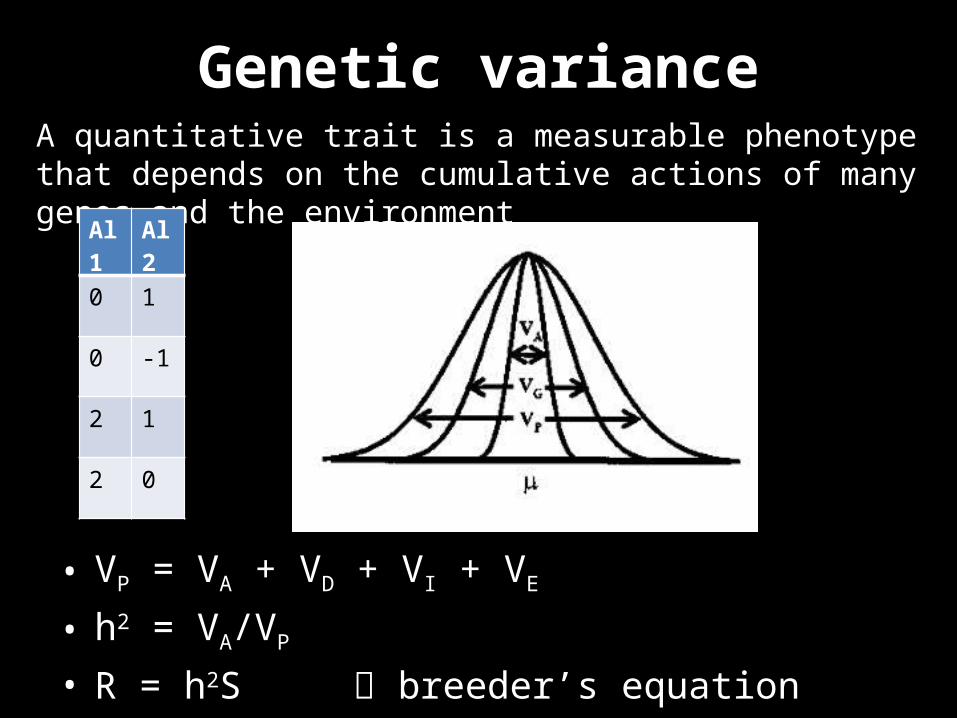
Genetic variance
• VP = VA + VD + VI + VE
• h2 = VA/VP
• R = h2S breeder’s equation
A quantitative trait is a measurable phenotype that depends on the cumulative actions of many genes and the environmentAl1 Al2
0 1
0 -1
2 1
2 0
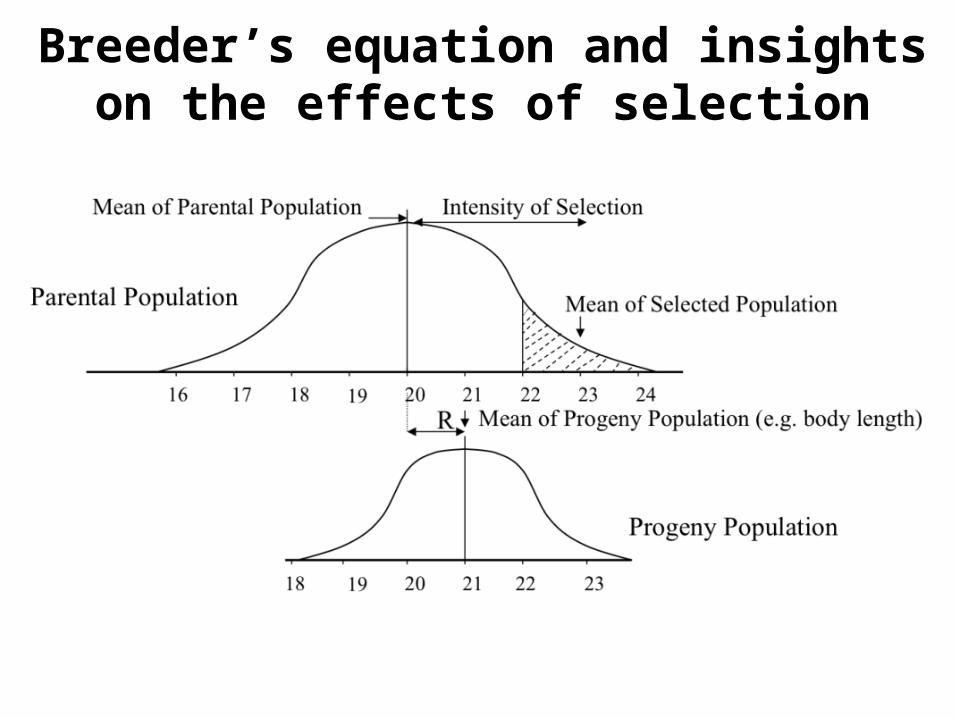
Breeder’s equation and insights on the effects of selection
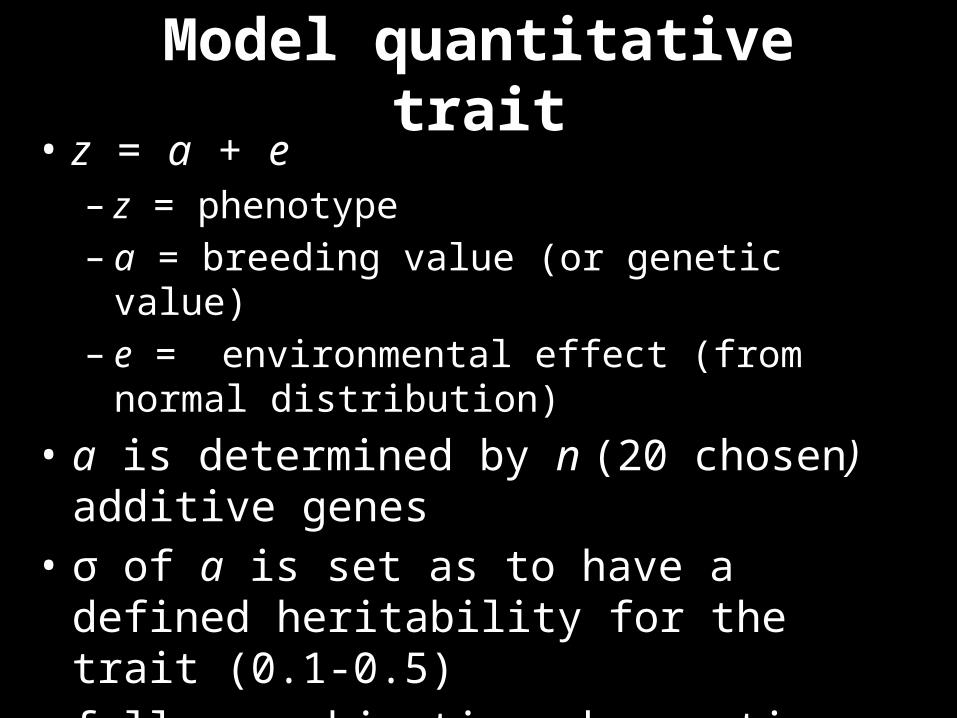
Model quantitative trait• z = a + e– z = phenotype– a = breeding value (or genetic value)– e = environmental effect (from normal
distribution)• a is determined by n (20 chosen)
additive genes • σ of a is set as to have a defined
heritability for the trait (0.1-0.5)• full recombination when mating
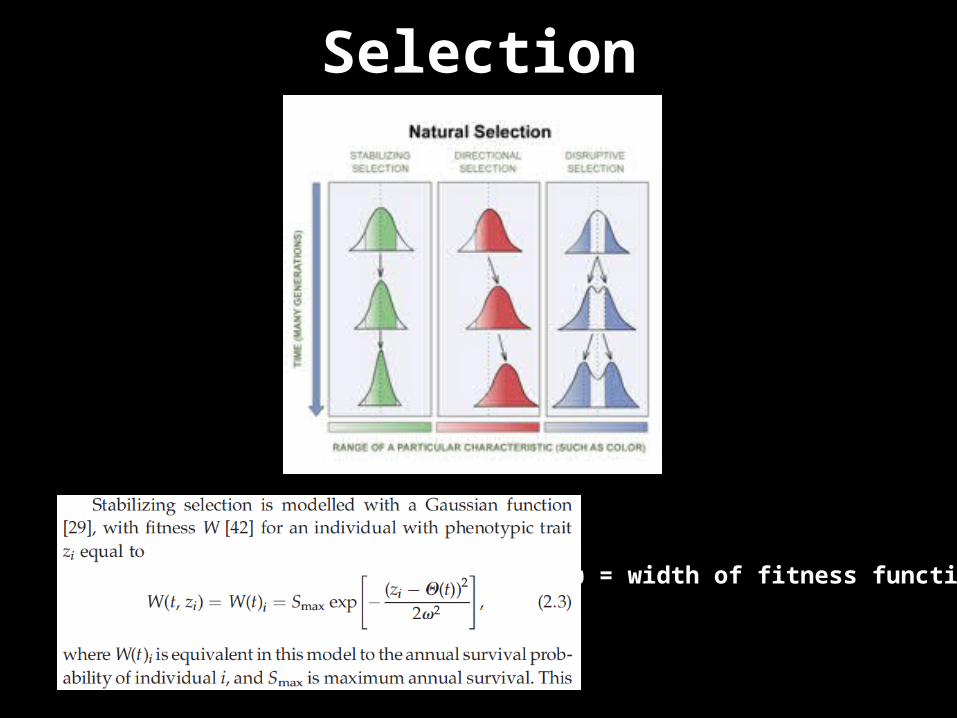
Selection
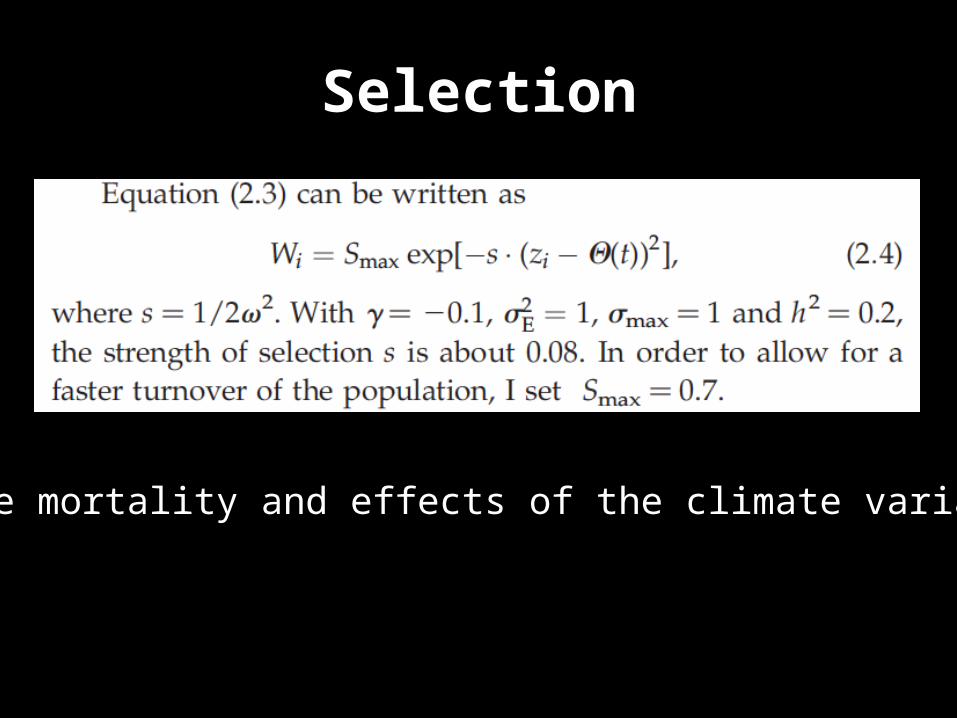
ω = width of fitness function
Selection
Base mortality and effects of the climate variable
Simulations• Simulations last 150 years after populations at
mutation-selection balance (500 individuals)• Offspring at time t become adults and are able to
reproduce at time t + 1 • At the start of each simulation, for each individual a
value of a and e is randomly drawn from their initial distribution.
• Sequence of operations: mortality of adults, mating and reproduction, mutation, mortality of offspring.
• Population extinct if n <2 • Mating pairs are randomly drawn from the pool of
adults• Each pair produces a number Pois(2) offspring• Point extremes induce mortality after selection
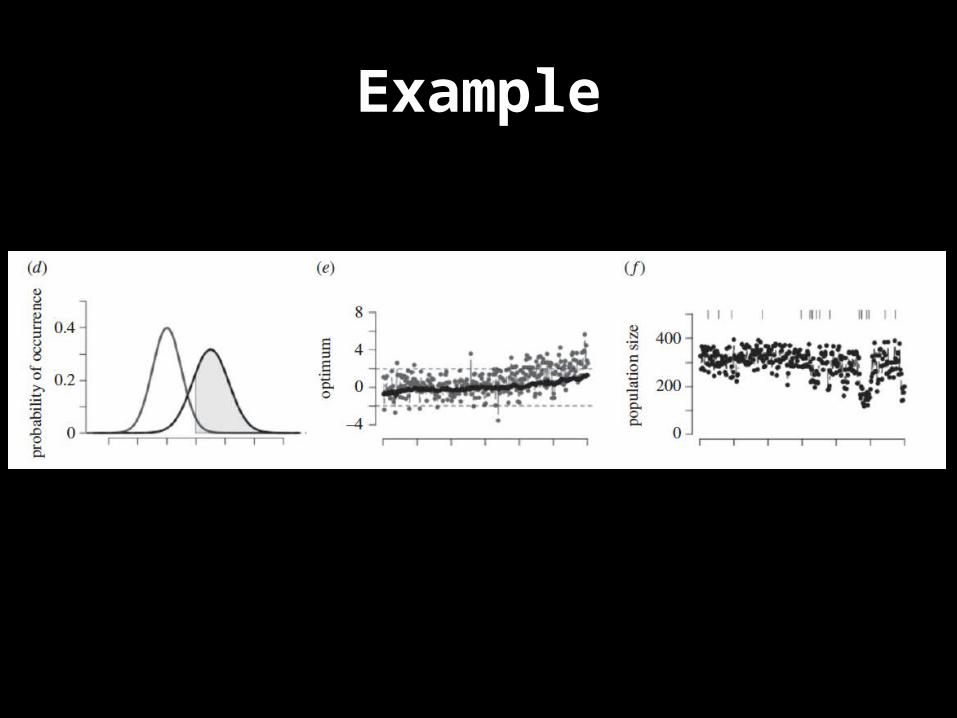
Example
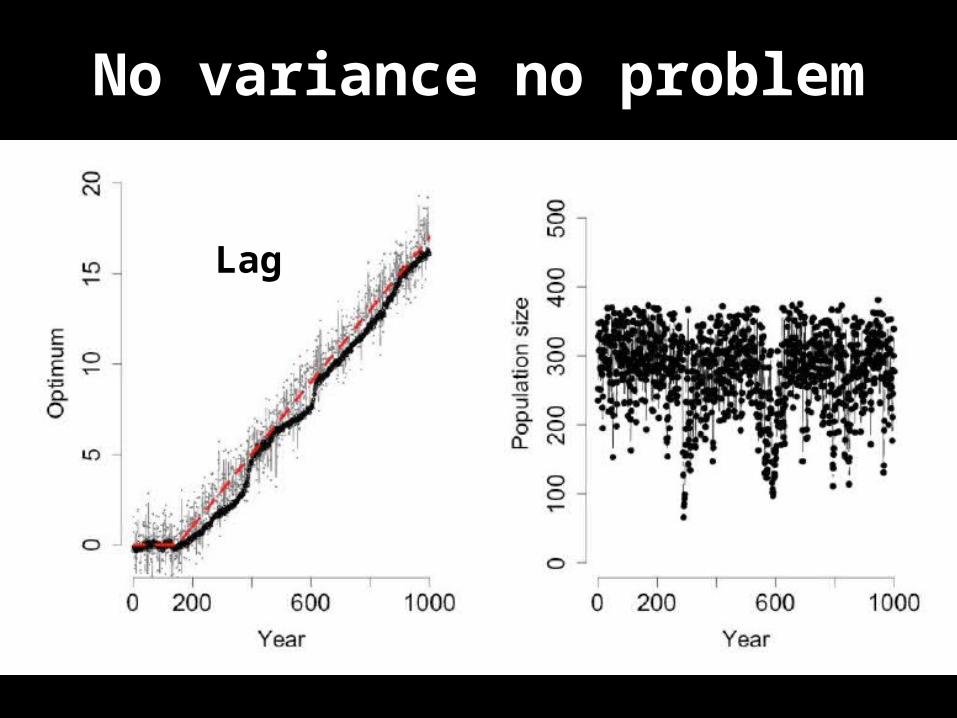
No variance no problem
Lag
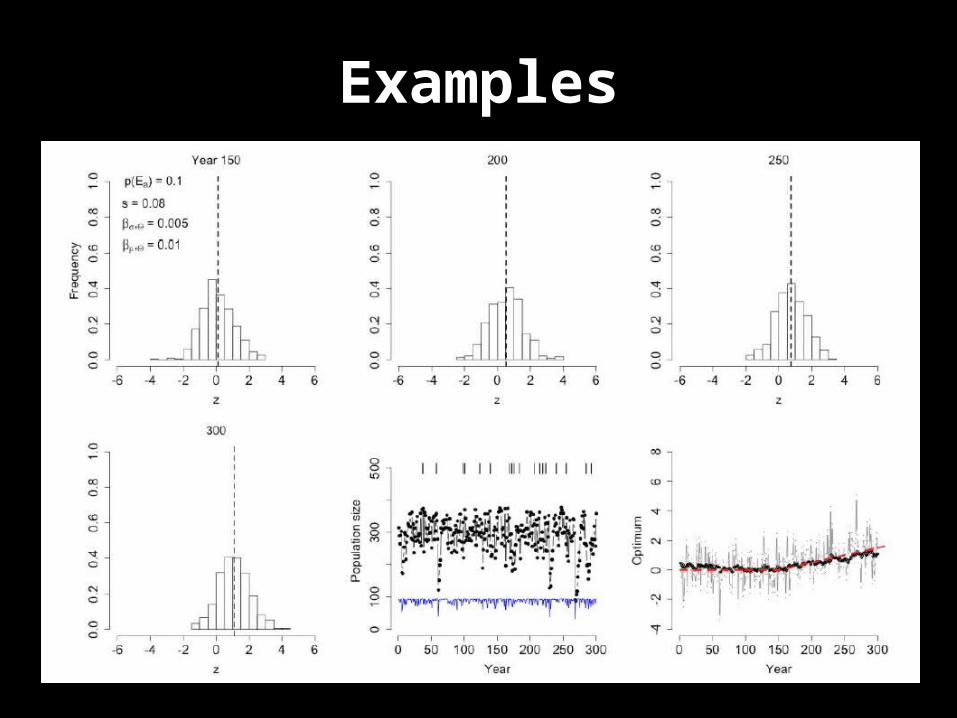
Examples
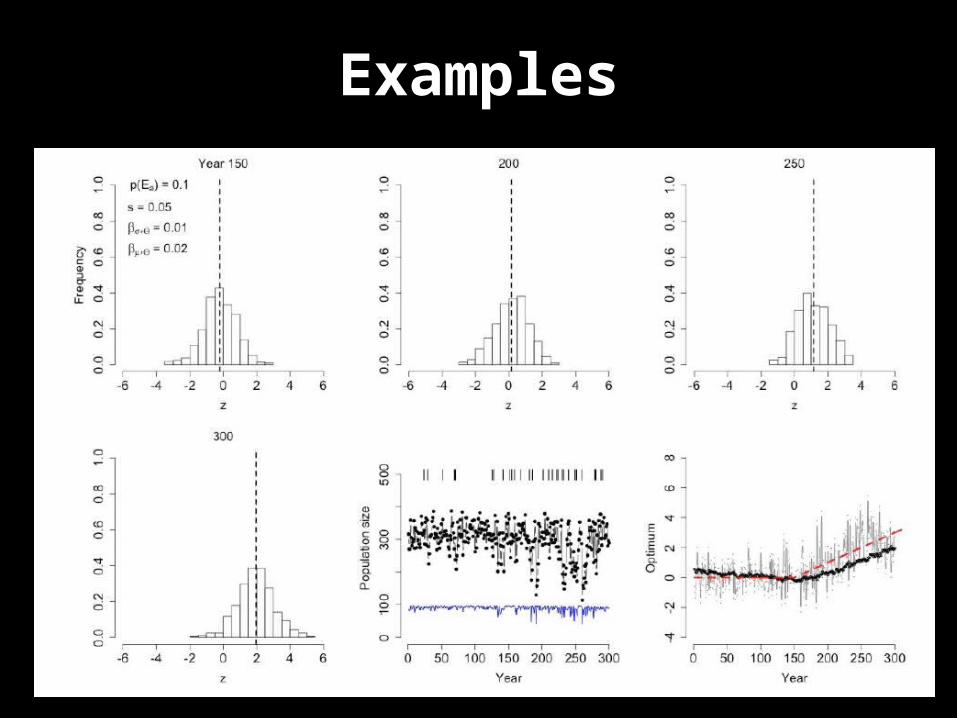
Examples
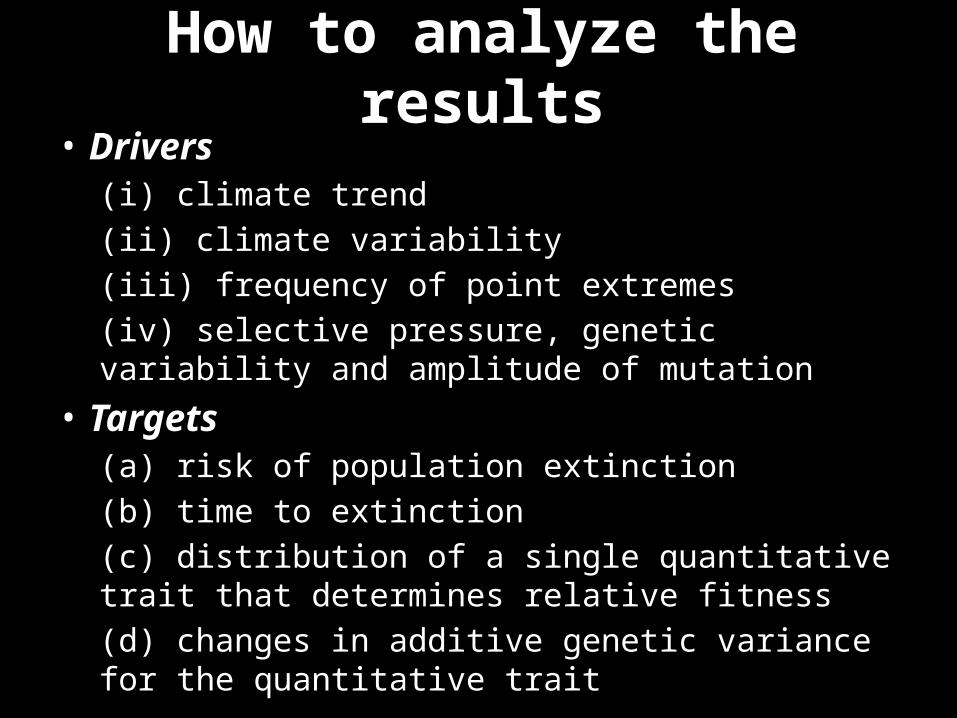
How to analyze the results• Drivers
(i) climate trend(ii) climate variability(iii) frequency of point extremes(iv) selective pressure, genetic variability and amplitude of mutation
• Targets(a) risk of population extinction(b) time to extinction(c) distribution of a single quantitative trait that determines relative fitness(d) changes in additive genetic variance for the quantitative trait
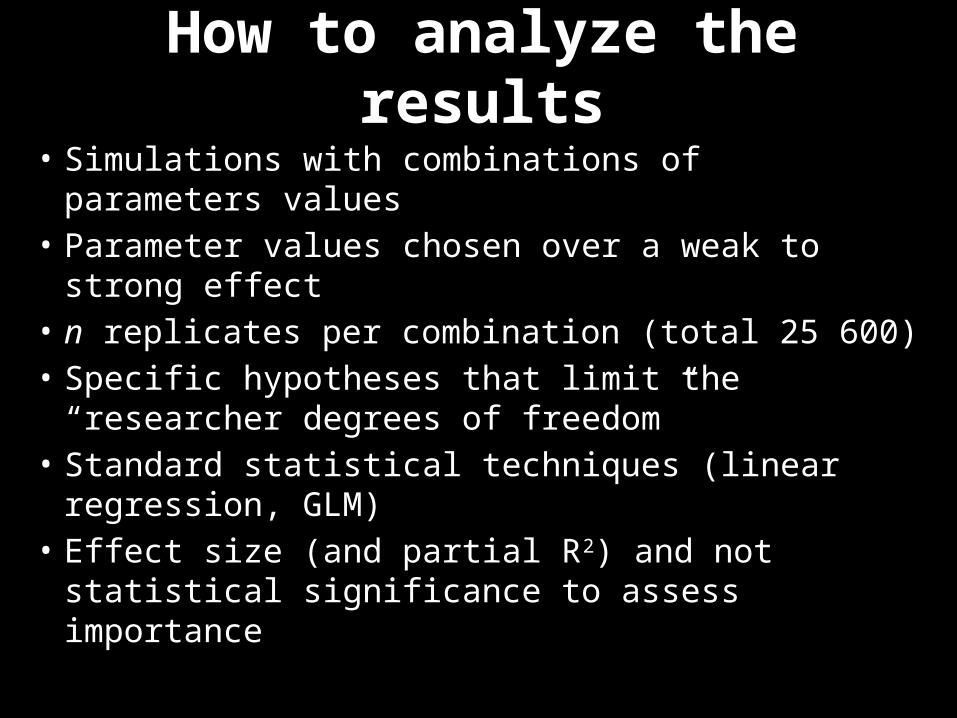
• Simulations with combinations of parameters values
• Parameter values chosen over a weak to strong effect
• n replicates per combination (total 25 600)• Specific hypotheses that limit the
“researcher degrees of freedom”• Standard statistical techniques (linear
regression, GLM)• Effect size (and partial R2) and not statistical
significance to assess importance
How to analyze the results
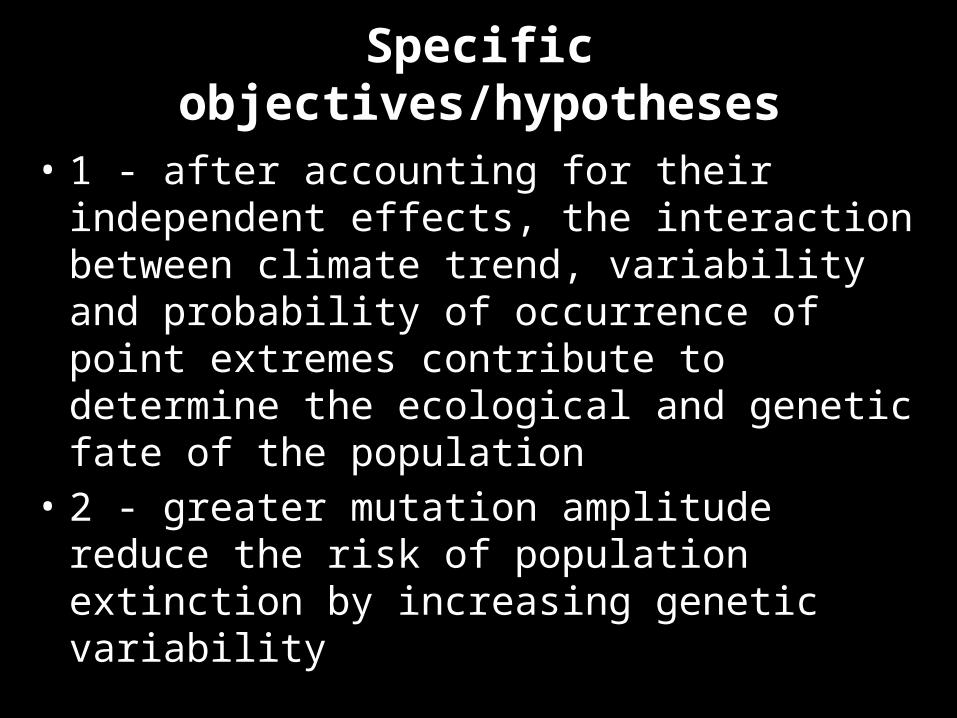
Specific objectives/hypotheses• 1 - after accounting for their
independent effects, the interaction between climate trend, variability and probability of occurrence of point extremes contribute to determine the ecological and genetic fate of the population
• 2 - greater mutation amplitude reduce the risk of population extinction by increasing genetic variability
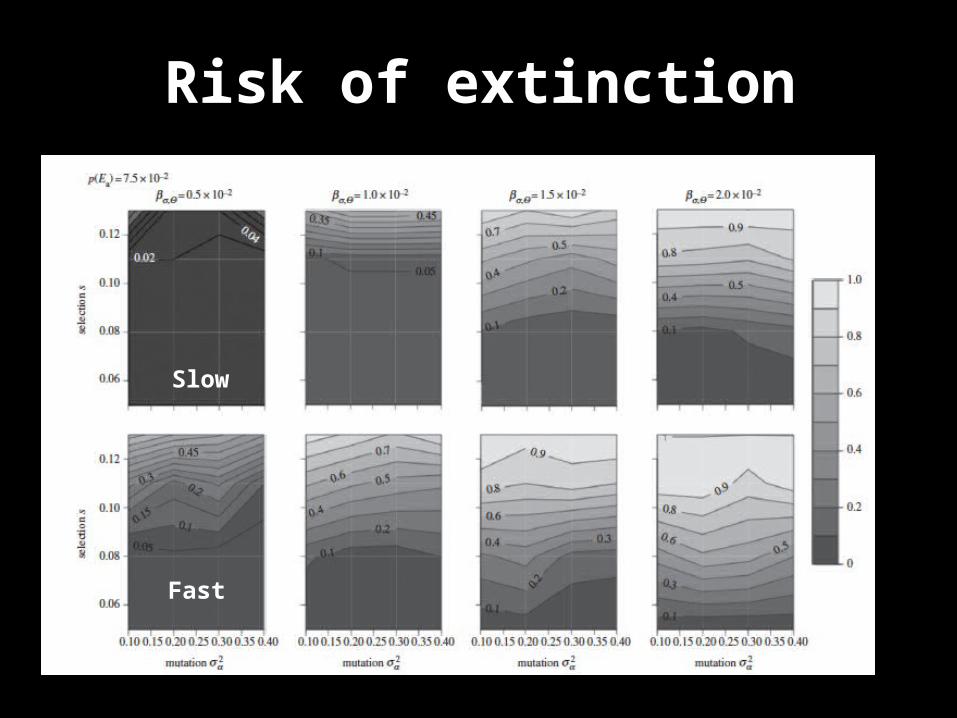
Risk of extinctionRisk of extinction
Slow
Fast
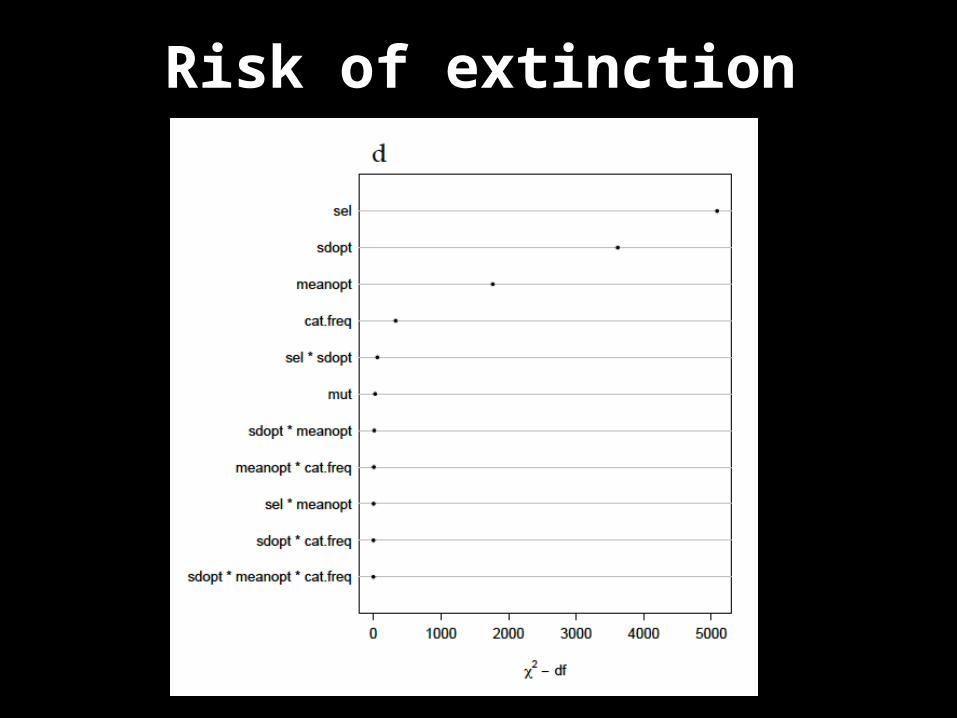
Risk of extinction
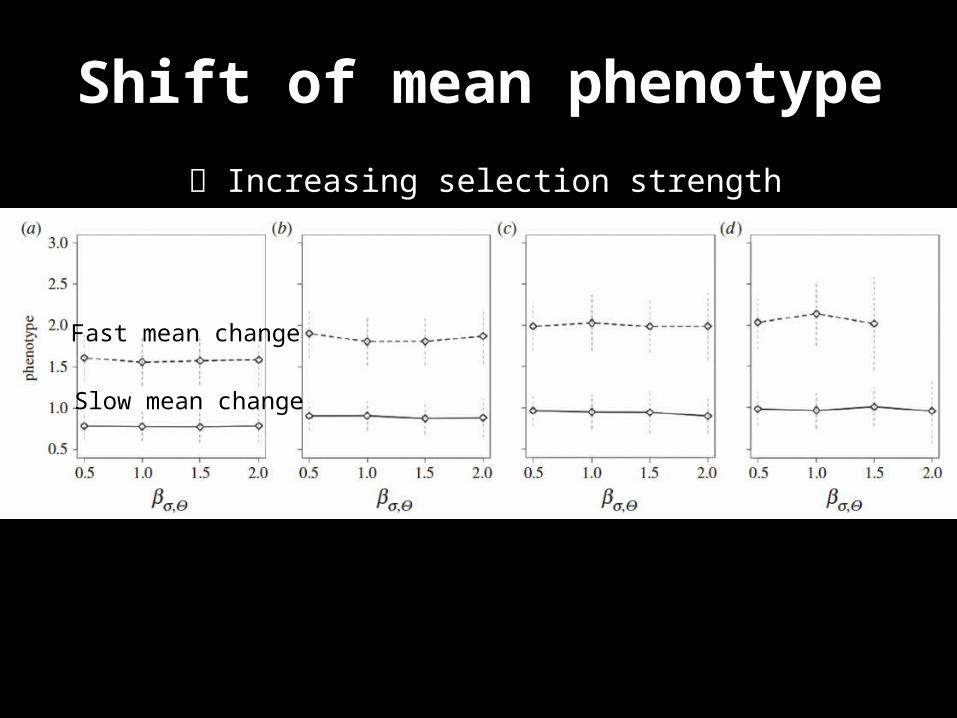
Shift of mean phenotype Increasing selection strength
Fast mean change
Slow mean change
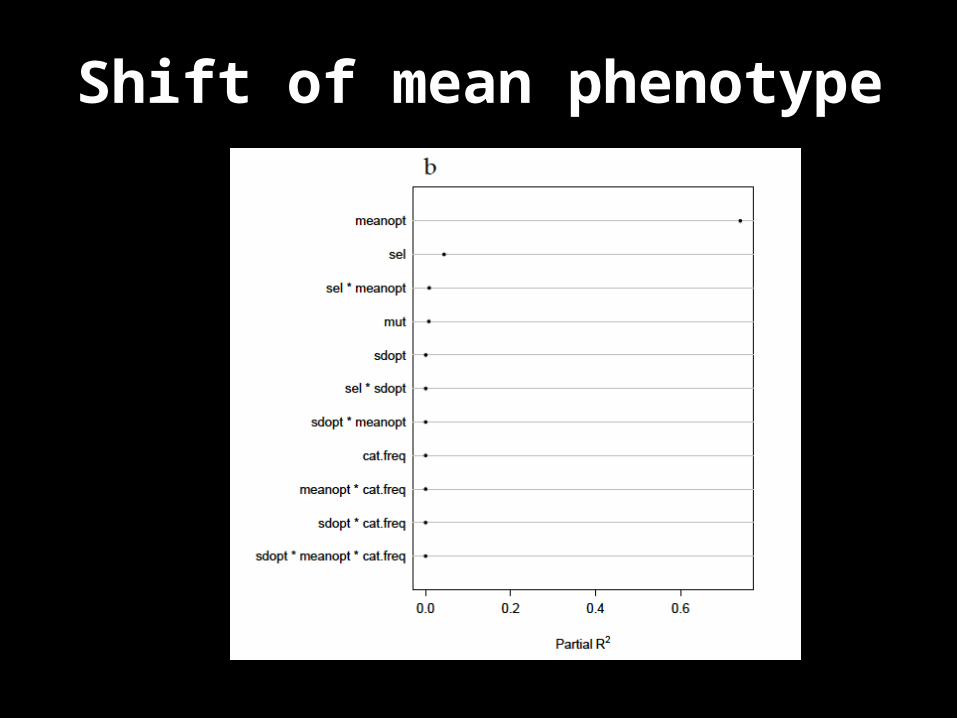
Shift of mean phenotype
Specific objectives/hypotheses
• 3) A GLM model including population size, selection strength, probability of point extremes and genetic variance for the quantitative trait under selection is able to predict contemporary risk of extinction.
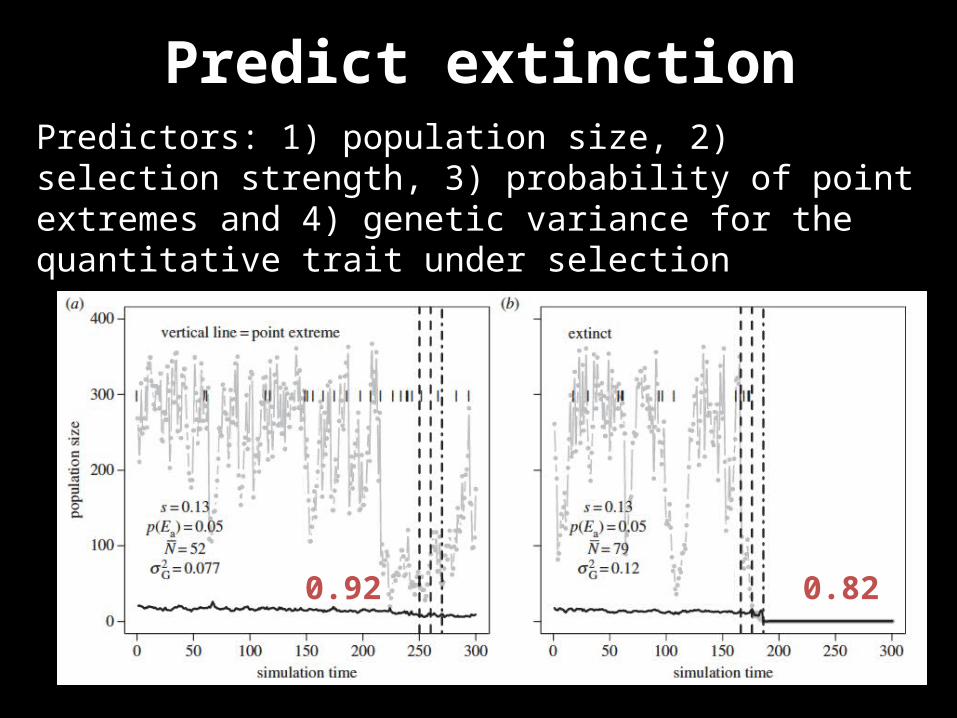
Predict extinctionPredictors: 1) population size, 2) selection strength, 3) probability of point extremes and 4) genetic variance for the quantitative trait under selection
0.92 0.82
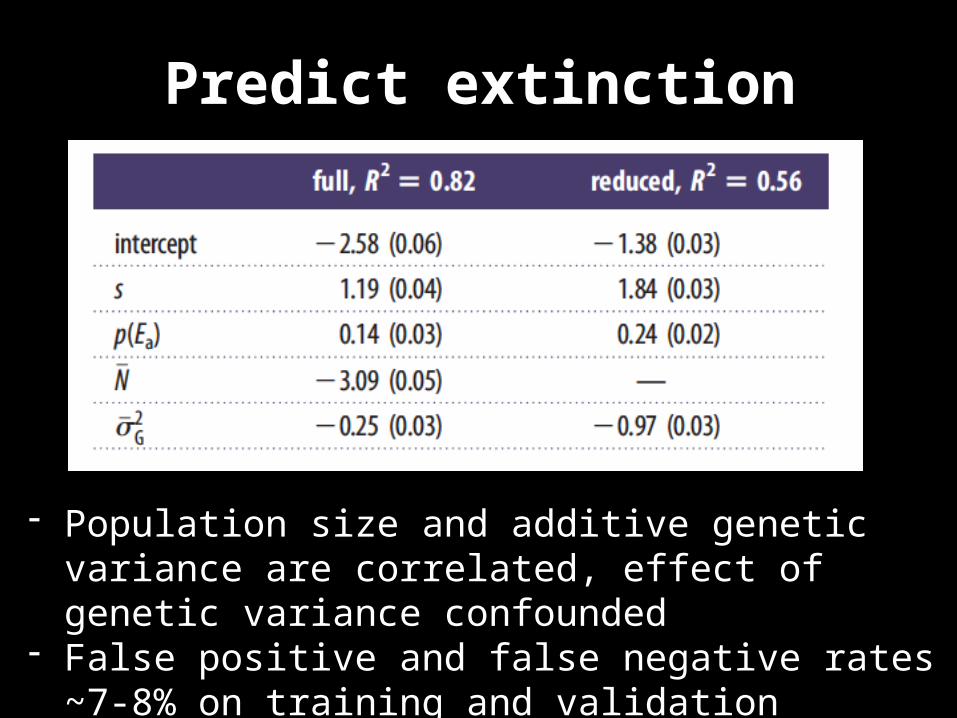
Predict extinction
- Population size and additive genetic variance are correlated, effect of genetic variance confounded
- False positive and false negative rates ~7-8% on training and validation datasets, excellent job!
Conclusions• The interaction among climate trend,
variability and probability of point extremes had minor effects
• Probability of occurrence of point extremes only slightly increased risk of extinction
• Stronger selection and greater climate variability increased extinction risk
• A simple model including four ecological, genetic and demographic measures provided excellent prediction of the immediate risk of population extinction.
ReferencesBürger, R., and M. Lynch. 1995. Evolution and extinction in a
changing environment: a quantitative-genetic analysis. Evolution 49:151–163.
Bürger, R., and M. Lynch. 1997. Adaptation and extinction in changing environments. Pages 209–39 in R. Bijlsma and V. Loeschcke, editors. Environmental Stress, Adaption and Evolution. Birkhauser Verlag, Basel, Switzerland.
Vincenzi, S. 2014. Extinction risk and eco-evolutionary dynamics in a variable environment with increasing frequency of extreme events. Journal of the Royal Society Interface 11:20140441.
Hill, W. G. 2010. Understanding and using quantitative genetic variation. Philosophical Transactions of the Royal Society of London. Series B, Biological sciences 365:73–85.
Johnson, T., and N. Barton. 2005. Theoretical models of selection and mutation on quantitative traits. Philosophical Transactions of the Royal Society of London. Series B, Biological sciences 360:1411–25.
Lynch, M., and R. Lande. 1993. Evolution and extinction in response to environmental change. Pages 234–250 in P. M. Kareiva, J. G. Kingsolver, and R. B. Huey, editors. Biotic Interactions and Global Change. Sinauer Associates, Sunderland, MA.