Embed Size (px)
Citation preview
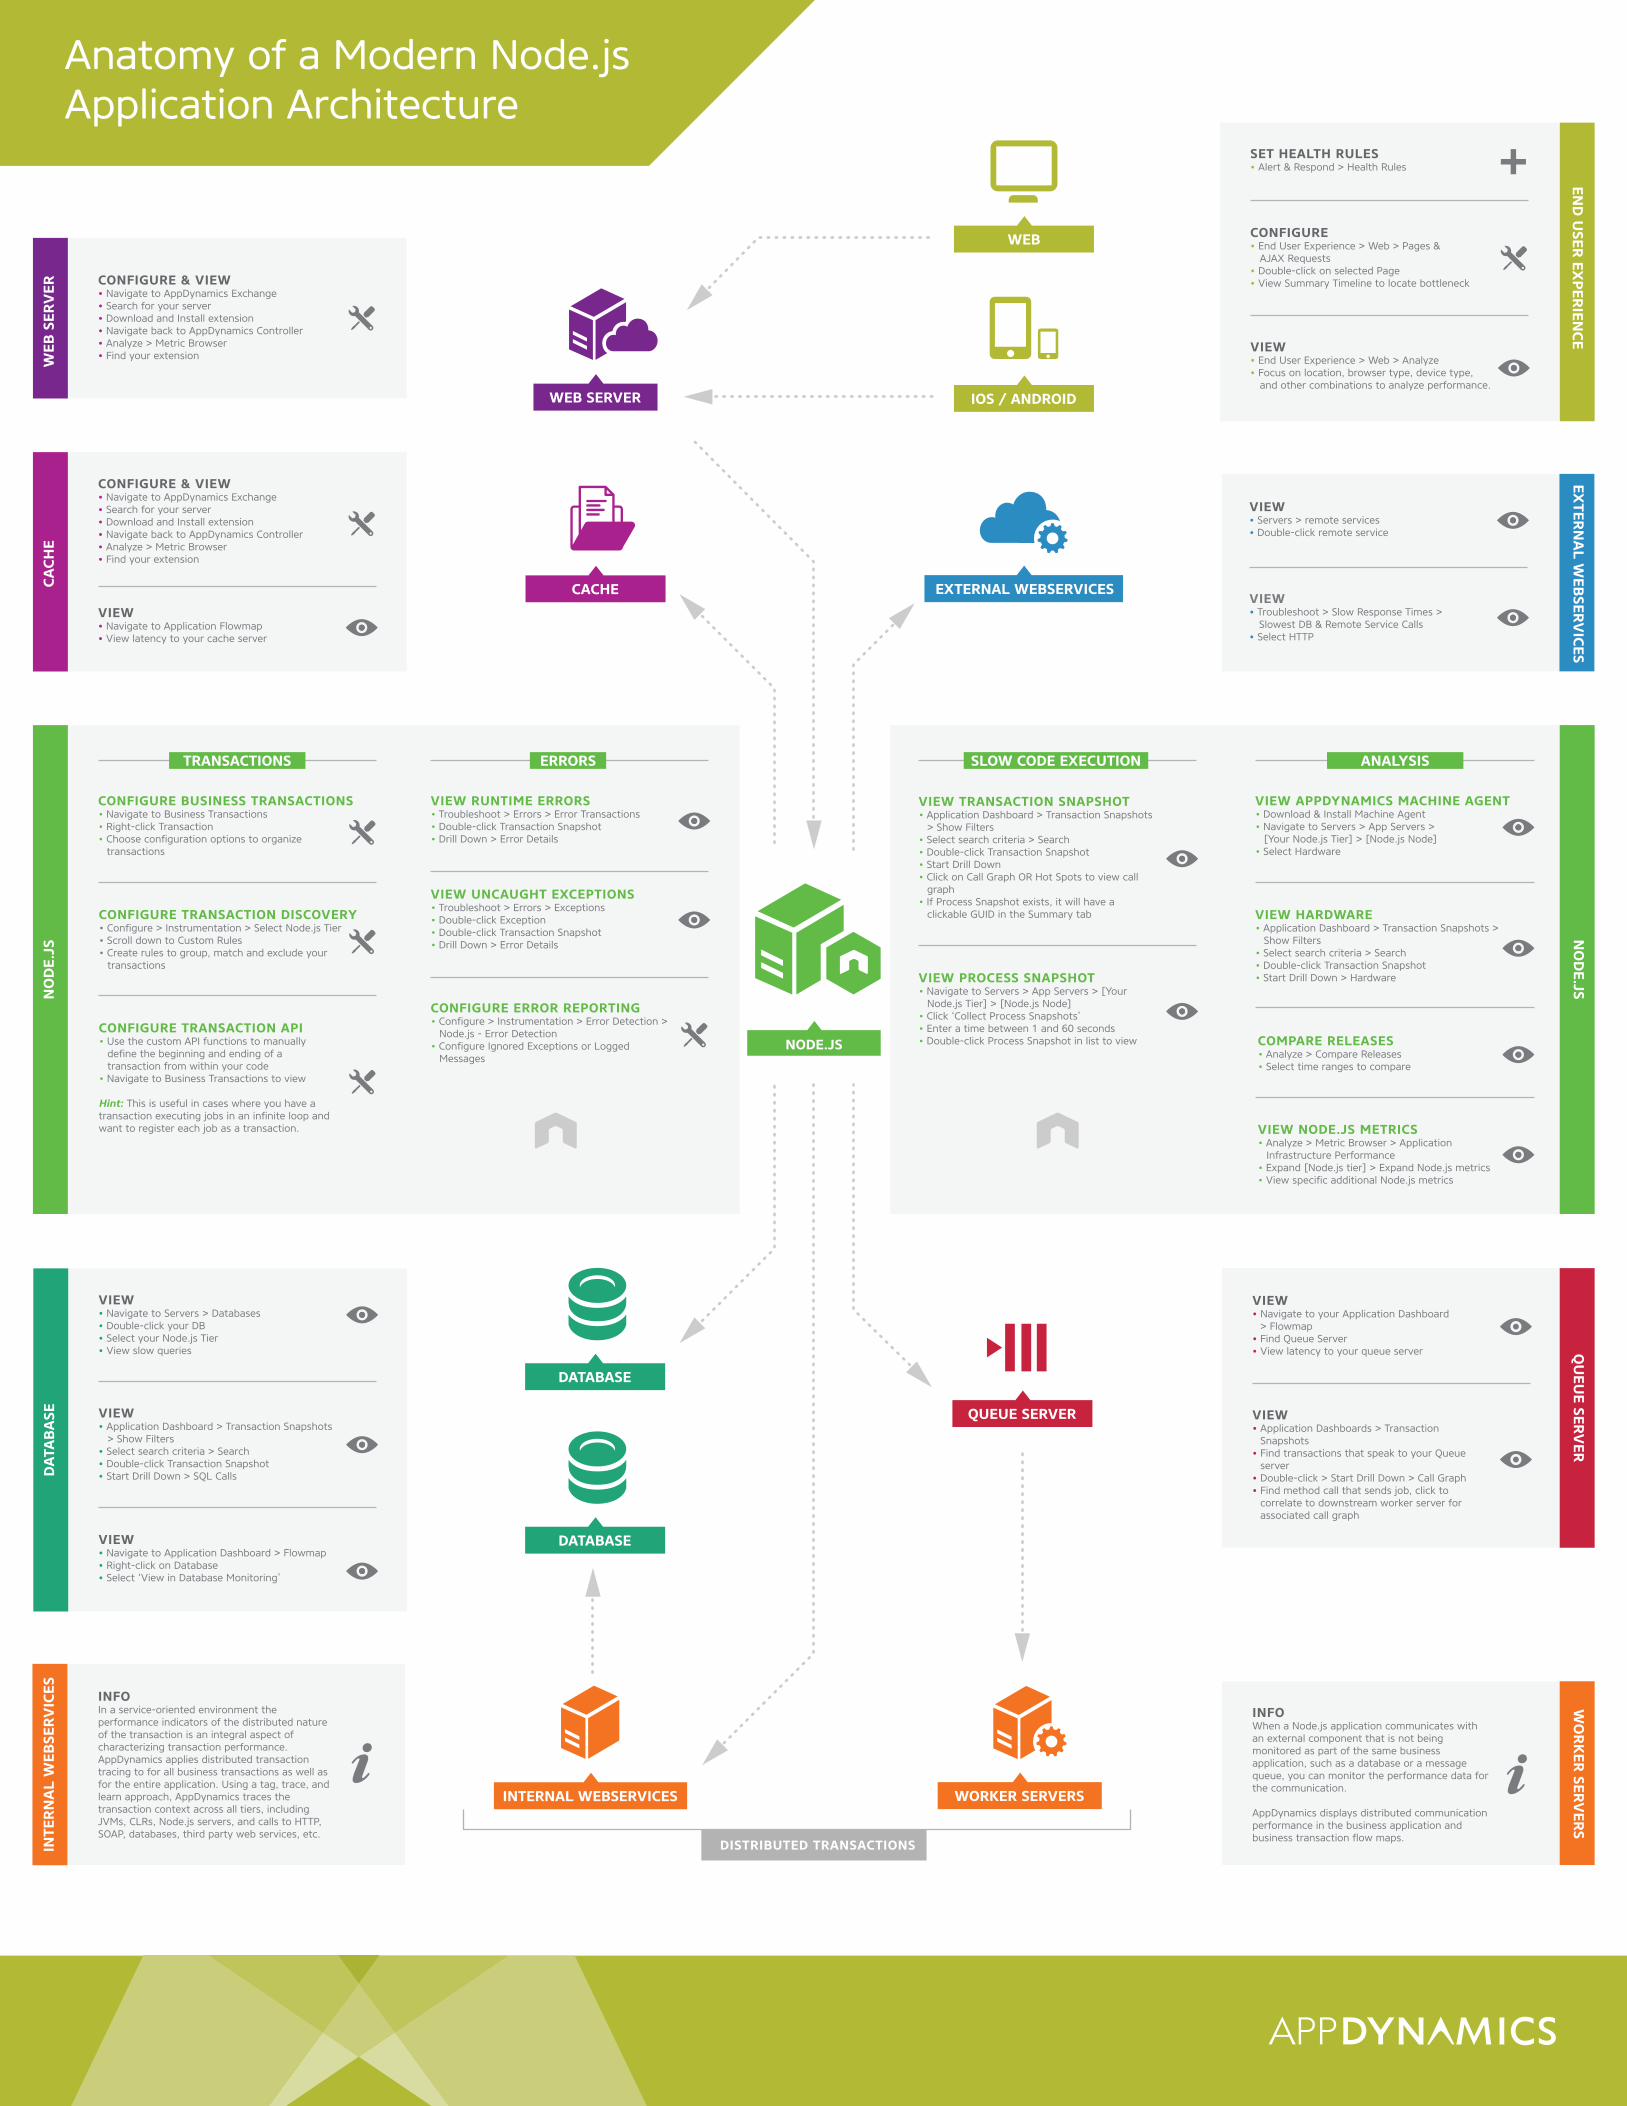
Anatomy of a Modern Node.js Application Architecture
WEB SERVER
QUEUE SERVER
WORKER SERVERS
CACHE
INTERNAL WEBSERVICES
DISTRIBUTED TRANSACTIONS
CONFIGURE & VIEW• Navigate to AppDynamics Exchange• Search for your server• Download and Install extension• Navigate back to AppDynamics Controller• Analyze > Metric Browser• Find your extension
VIEW• Navigate to Application Flowmap• View latency to your cache server
CACH
E
CONFIGURE & VIEW• Navigate to AppDynamics Exchange• Search for your server• Download and Install extension• Navigate back to AppDynamics Controller• Analyze > Metric Browser• Find your extensionW
EB S
ERV
ERIN
TER
NA
L W
EBSE
RVIC
ES INFOIn a service-oriented environment the performance indicators of the distributed nature of the transaction is an integral aspect of characterizing transaction performance. AppDynamics applies distributed transaction tracing to for all business transactions as well as for the entire application. Using a tag, trace, and learn approach, AppDynamics traces the transaction context across all tiers, including JVMs, CLRs, Node.js servers, and calls to HTTP, SOAP, databases, third party web services, etc.
VIEW• Navigate to your Application Dashboard > Flowmap• Find Queue Server• View latency to your queue server
VIEW• Application Dashboards > Transaction Snapshots• Find transactions that speak to your Queue server• Double-click > Start Drill Down > Call Graph• Find method call that sends job, click to correlate to downstream worker server for associated call graph
QU
EUE SERV
ERW
OR
KER
SERVER
S
INFOWhen a Node.js application communicates with an external component that is not being monitored as part of the same business application, such as a database or a message queue, you can monitor the performance data for the communication.
AppDynamics displays distributed communication performance in the business application and business transaction �ow maps.
NODE.JS
VIEW UNCAUGHT EXCEPTIONS• Troubleshoot > Errors > Exceptions • Double-click Exception• Double-click Transaction Snapshot• Drill Down > Error Details
VIEW RUNTIME ERRORS• Troubleshoot > Errors > Error Transactions• Double-click Transaction Snapshot• Drill Down > Error Details
CONFIGURE ERROR REPORTING• Con�gure > Instrumentation > Error Detection >
Node.js - Error Detection• Con�gure Ignored Exceptions or Logged
Messages
ERRORS
NO
DE.
JS
CONFIGURE TRANSACTION API• Use the custom API functions to manually
de�ne the beginning and ending of a transaction from within your code
• Navigate to Business Transactions to view
Hint: This is useful in cases where you have a transaction executing jobs in an in�nite loop and want to register each job as a transaction.
CONFIGURE BUSINESS TRANSACTIONS• Navigate to Business Transactions• Right-click Transaction• Choose con�guration options to organize
transactions
CONFIGURE TRANSACTION DISCOVERY• Con�gure > Instrumentation > Select Node.js Tier• Scroll down to Custom Rules• Create rules to group, match and exclude your
transactions
TRANSACTIONS
NO
DE.JS
VIEW APPDYNAMICS MACHINE AGENT• Download & Install Machine Agent• Navigate to Servers > App Servers >
[Your Node.js Tier] > [Node.js Node]• Select Hardware
VIEW HARDWARE• Application Dashboard > Transaction Snapshots >
Show Filters• Select search criteria > Search• Double-click Transaction Snapshot• Start Drill Down > Hardware
COMPARE RELEASES• Analyze > Compare Releases• Select time ranges to compare
VIEW NODE.JS METRICS• Analyze > Metric Browser > Application
Infrastructure Performance• Expand [Node.js tier] > Expand Node.js metrics• View speci�c additional Node.js metrics
ANALYSIS
EXTERNAL WEBSERVICES
EXTER
NA
L WEB
SERVICES
VIEW• Servers > remote services• Double-click remote service
VIEW• Troubleshoot > Slow Response Times > Slowest DB & Remote Service Calls• Select HTTP
DATABASE
DATABASE
DAT
AB
ASE
VIEW• Navigate to Servers > Databases• Double-click your DB• Select your Node.js Tier• View slow queries
VIEW• Application Dashboard > Transaction Snapshots > Show Filters• Select search criteria > Search• Double-click Transaction Snapshot• Start Drill Down > SQL Calls
VIEW• Navigate to Application Dashboard > Flowmap• Right-click on Database• Select ‘View in Database Monitoring’
WEB
IOS / ANDROID
CONFIGURE• End User Experience > Web > Pages & AJAX Requests• Double-click on selected Page• View Summary Timeline to locate bottleneck
VIEW• End User Experience > Web > Analyze• Focus on location, browser type, device type, and other combinations to analyze performance.
END
USER
EXPER
IENCE
SET HEALTH RULES• Alert & Respond > Health Rules
VIEW TRANSACTION SNAPSHOT• Application Dashboard > Transaction Snapshots
> Show Filters• Select search criteria > Search• Double-click Transaction Snapshot• Start Drill Down• Click on Call Graph OR Hot Spots to view call
graph• If Process Snapshot exists, it will have a
clickable GUID in the Summary tab
VIEW PROCESS SNAPSHOT• Navigate to Servers > App Servers > [Your
Node.js Tier] > [Node.js Node]• Click ‘Collect Process Snapshots’• Enter a time between 1 and 60 seconds• Double-click Process Snapshot in list to view
SLOW CODE EXECUTION