Embed Size (px)
Citation preview

Monitoring your Swift cluster health
Christian SchwedePrincipal Software Engineer, Red HatOpenStack Summit Vancouver, May 2015
All good things come in threes
Swift Architecture MetricsBasic Monitoring

A short Swift overview
Proxy server PUT http://swift.com/v1/account/container/objectname
disk
Se
rve
r
Re
pl ic
ato
r
Au
di to
r
Up
da
ter
disk
disk disk
disk
Se
rve
r
Re
pl ic
ato
r
Au
di to
r
Up
da
ter
disk
disk disk
disk
Se
rve
r
Re
pl ic
ato
r
Au
di to
r
Up
da
ter
disk
disk disk
disk
Se
rve
r
Re
pl ic
ato
r
Au
di to
r
Up
da
ter
disk
disk disk

Basic Monitoring
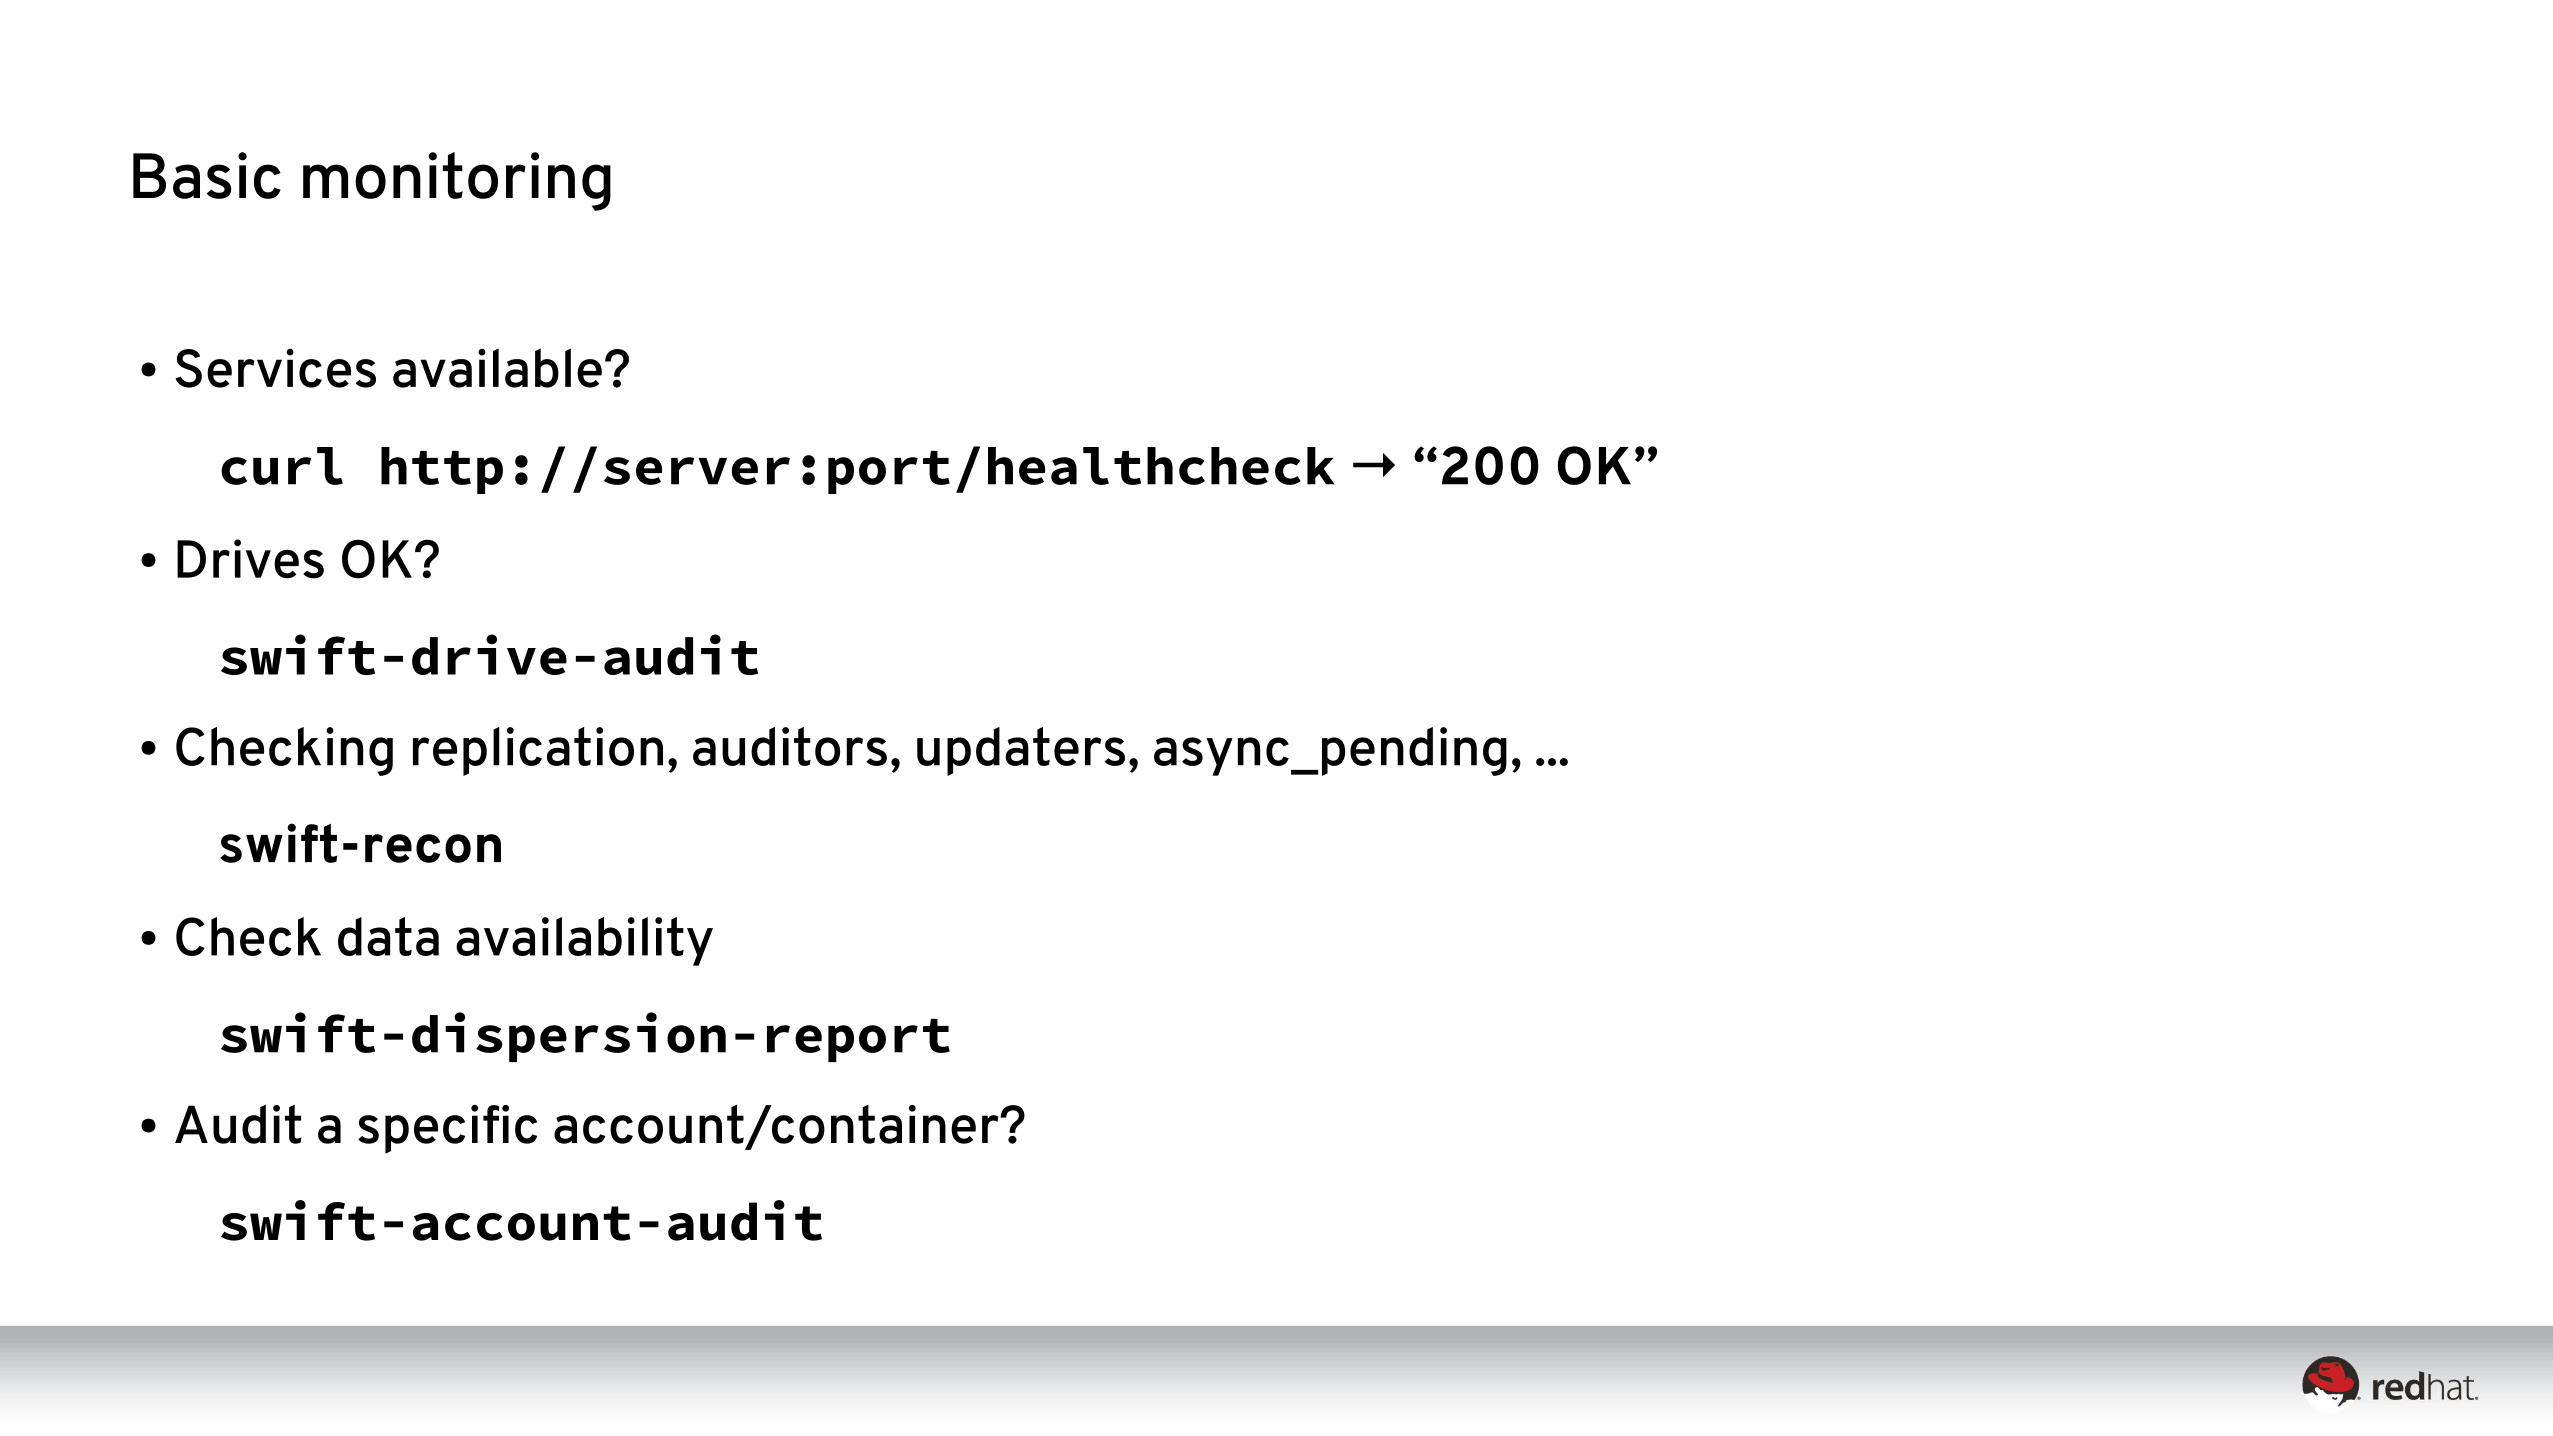
Basic monitoring
● Services available?
curl http://server:port/healthcheck → “200 OK”
● Drives OK?
swift-drive-audit
● Checking replication, auditors, updaters, async_pending, ...
swift-recon
● Check data availability
swift-dispersion-report
● Audit a speci-c account/container?
swift-account-audit

Metrics
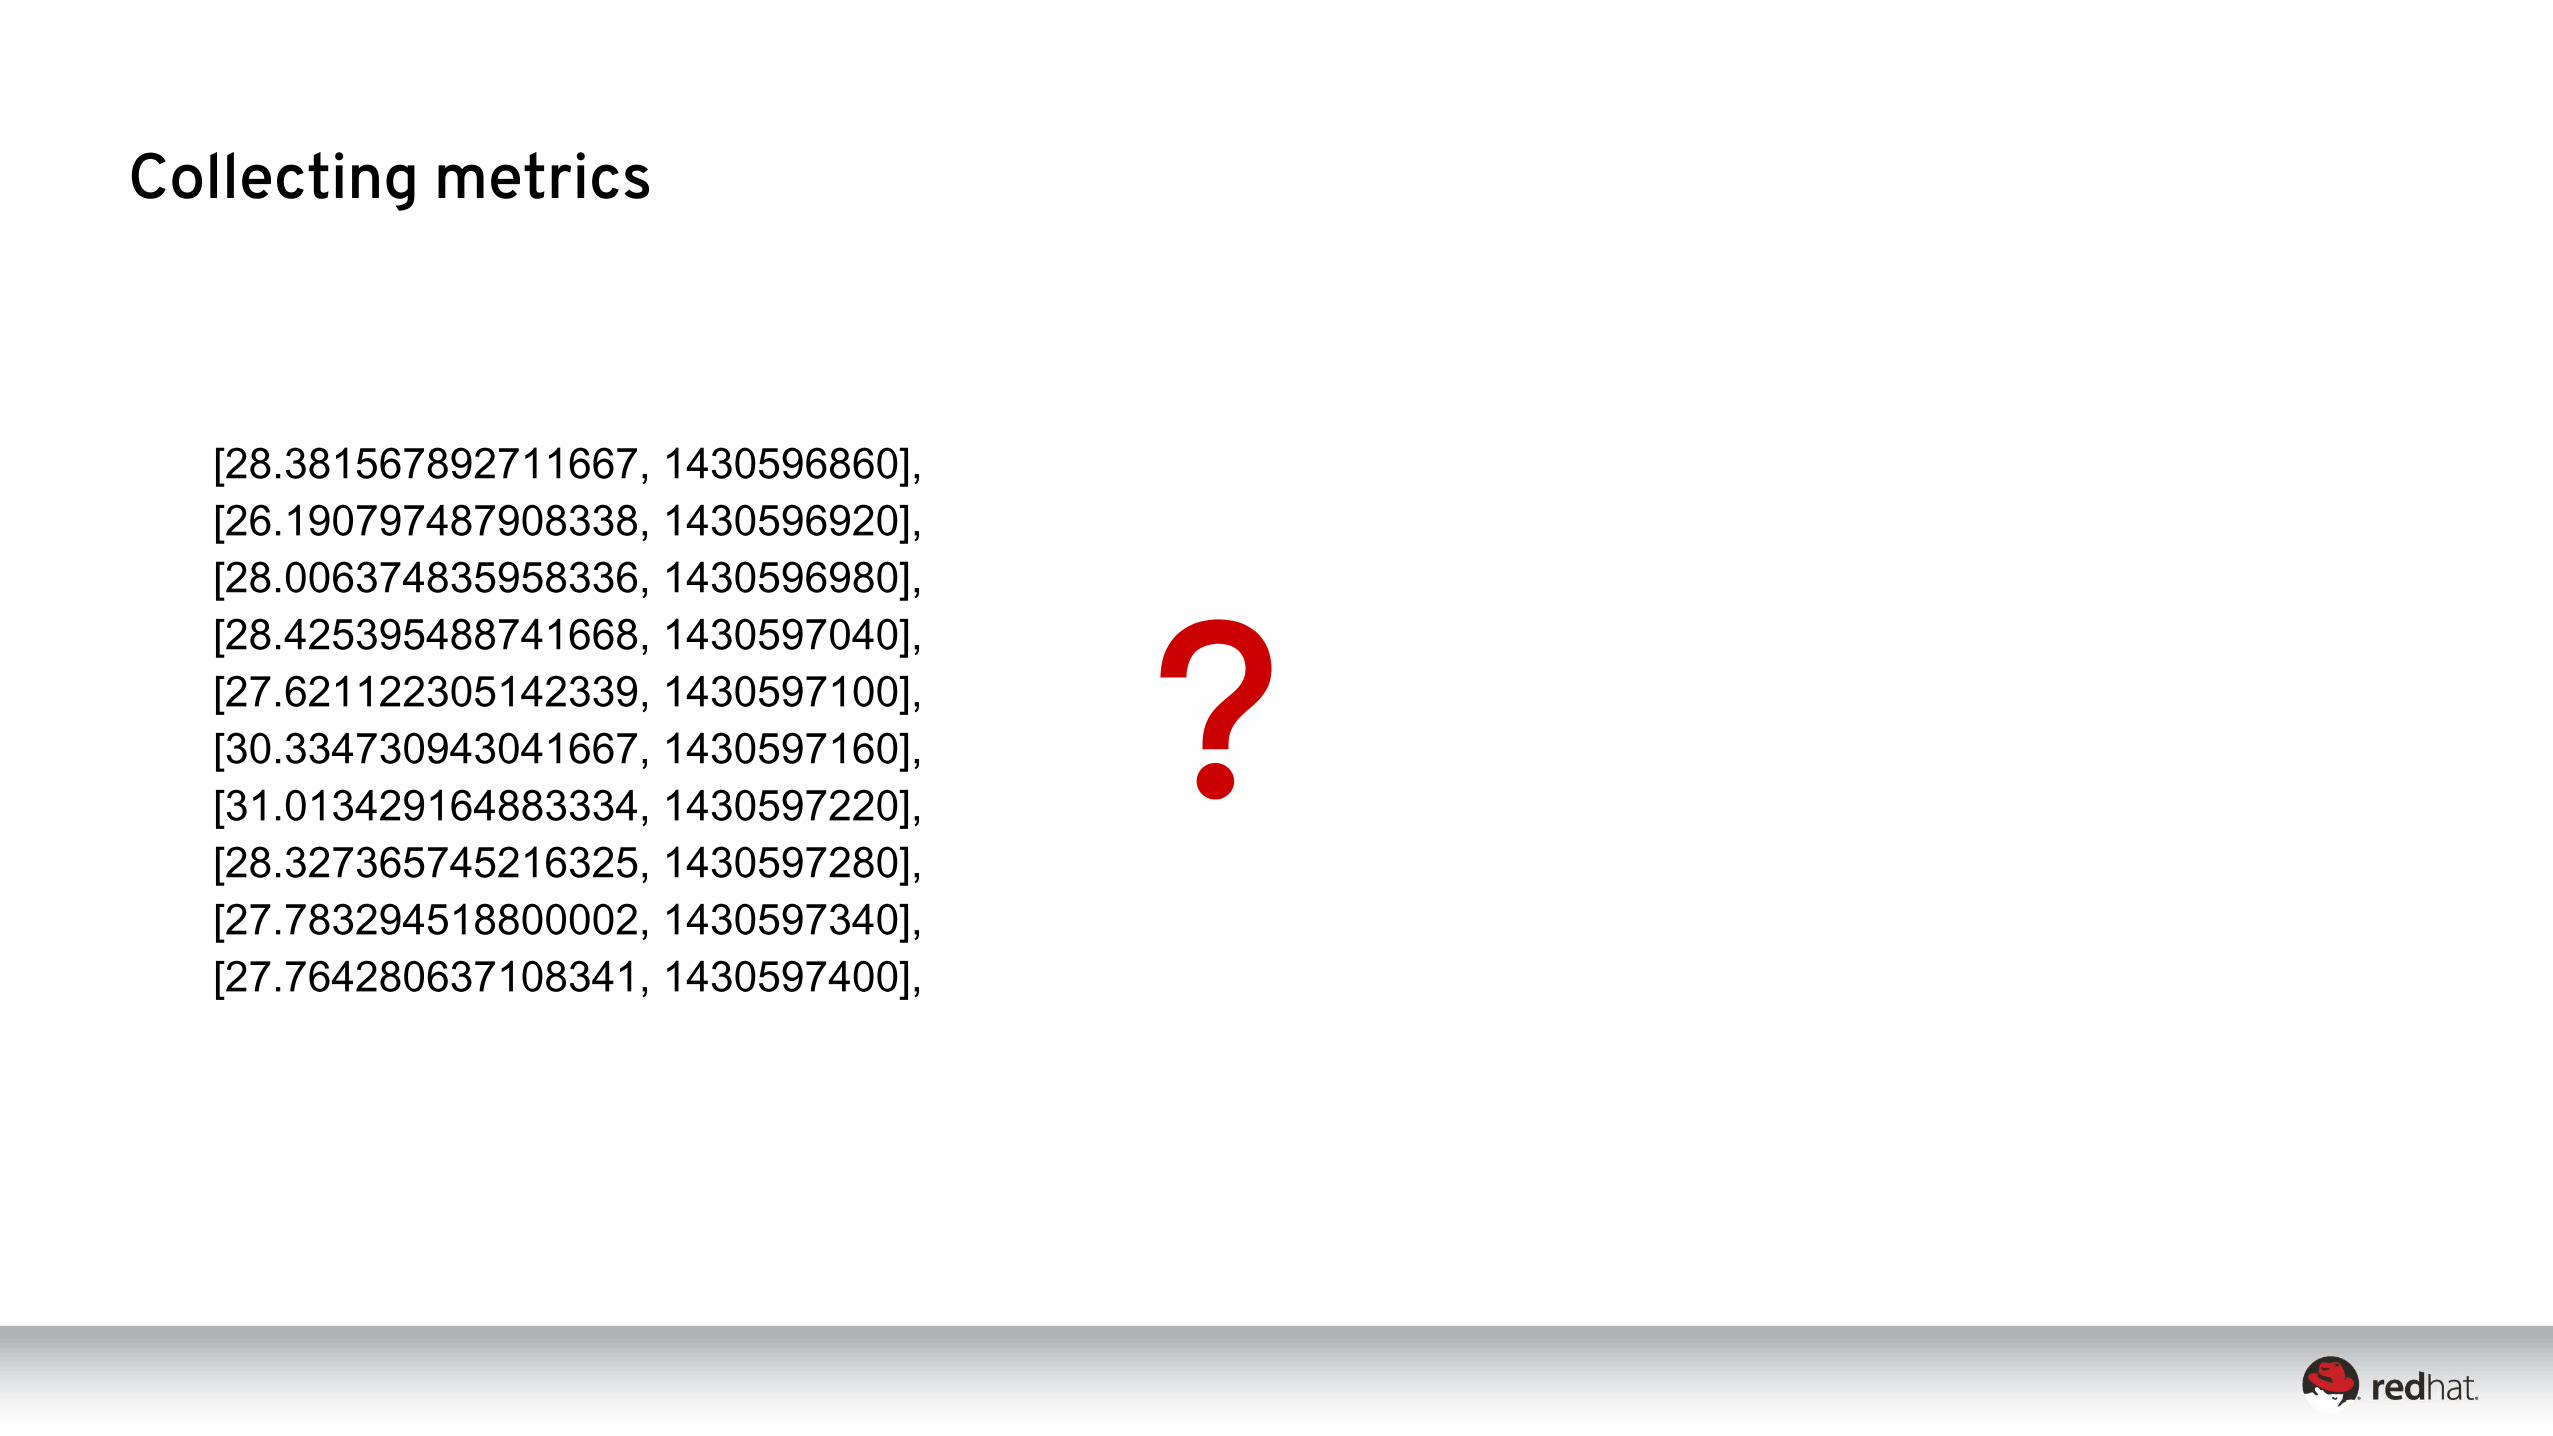
Collecting metrics
[28.381567892711667, 1430596860],
[26.190797487908338, 1430596920],
[28.006374835958336, 1430596980],
[28.425395488741668, 1430597040],
[27.621122305142339, 1430597100],
[30.334730943041667, 1430597160],
[31.013429164883334, 1430597220],
[28.327365745216325, 1430597280],
[27.783294518800002, 1430597340],
[27.764280637108341, 1430597400],
?
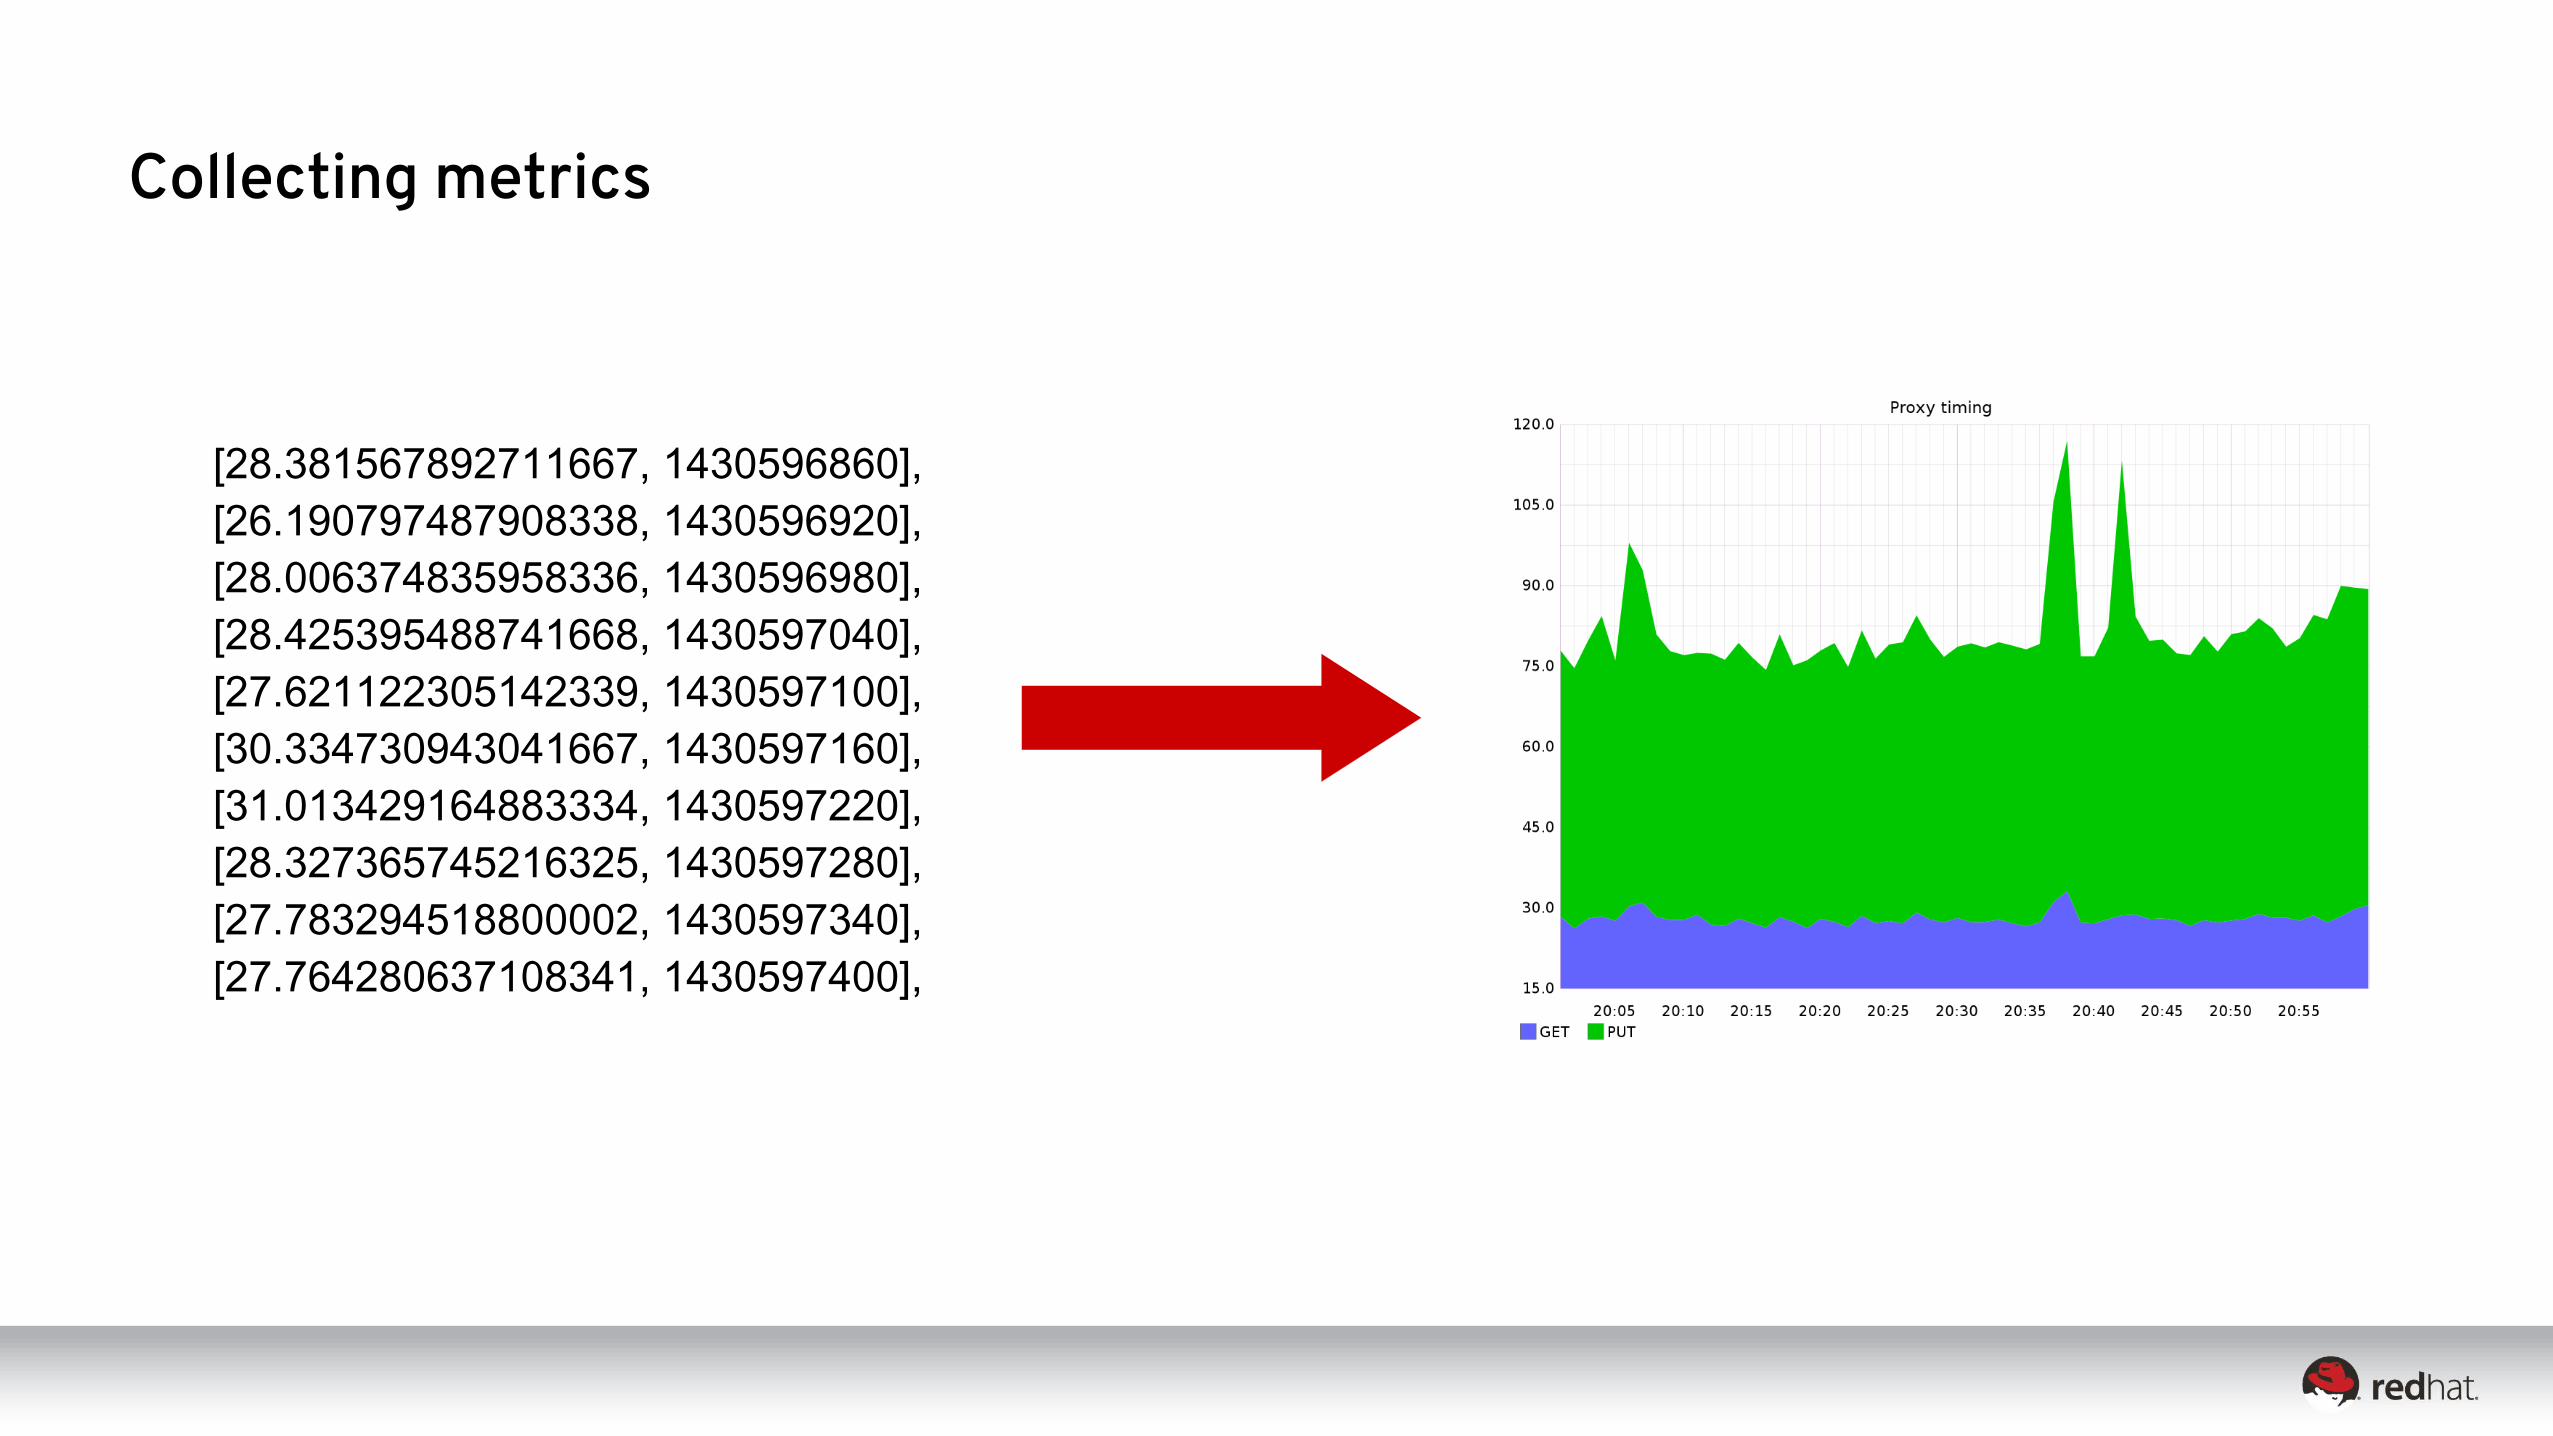
Collecting metrics
[28.381567892711667, 1430596860],
[26.190797487908338, 1430596920],
[28.006374835958336, 1430596980],
[28.425395488741668, 1430597040],
[27.621122305142339, 1430597100],
[30.334730943041667, 1430597160],
[31.013429164883334, 1430597220],
[28.327365745216325, 1430597280],
[27.783294518800002, 1430597340],
[27.764280637108341, 1430597400],
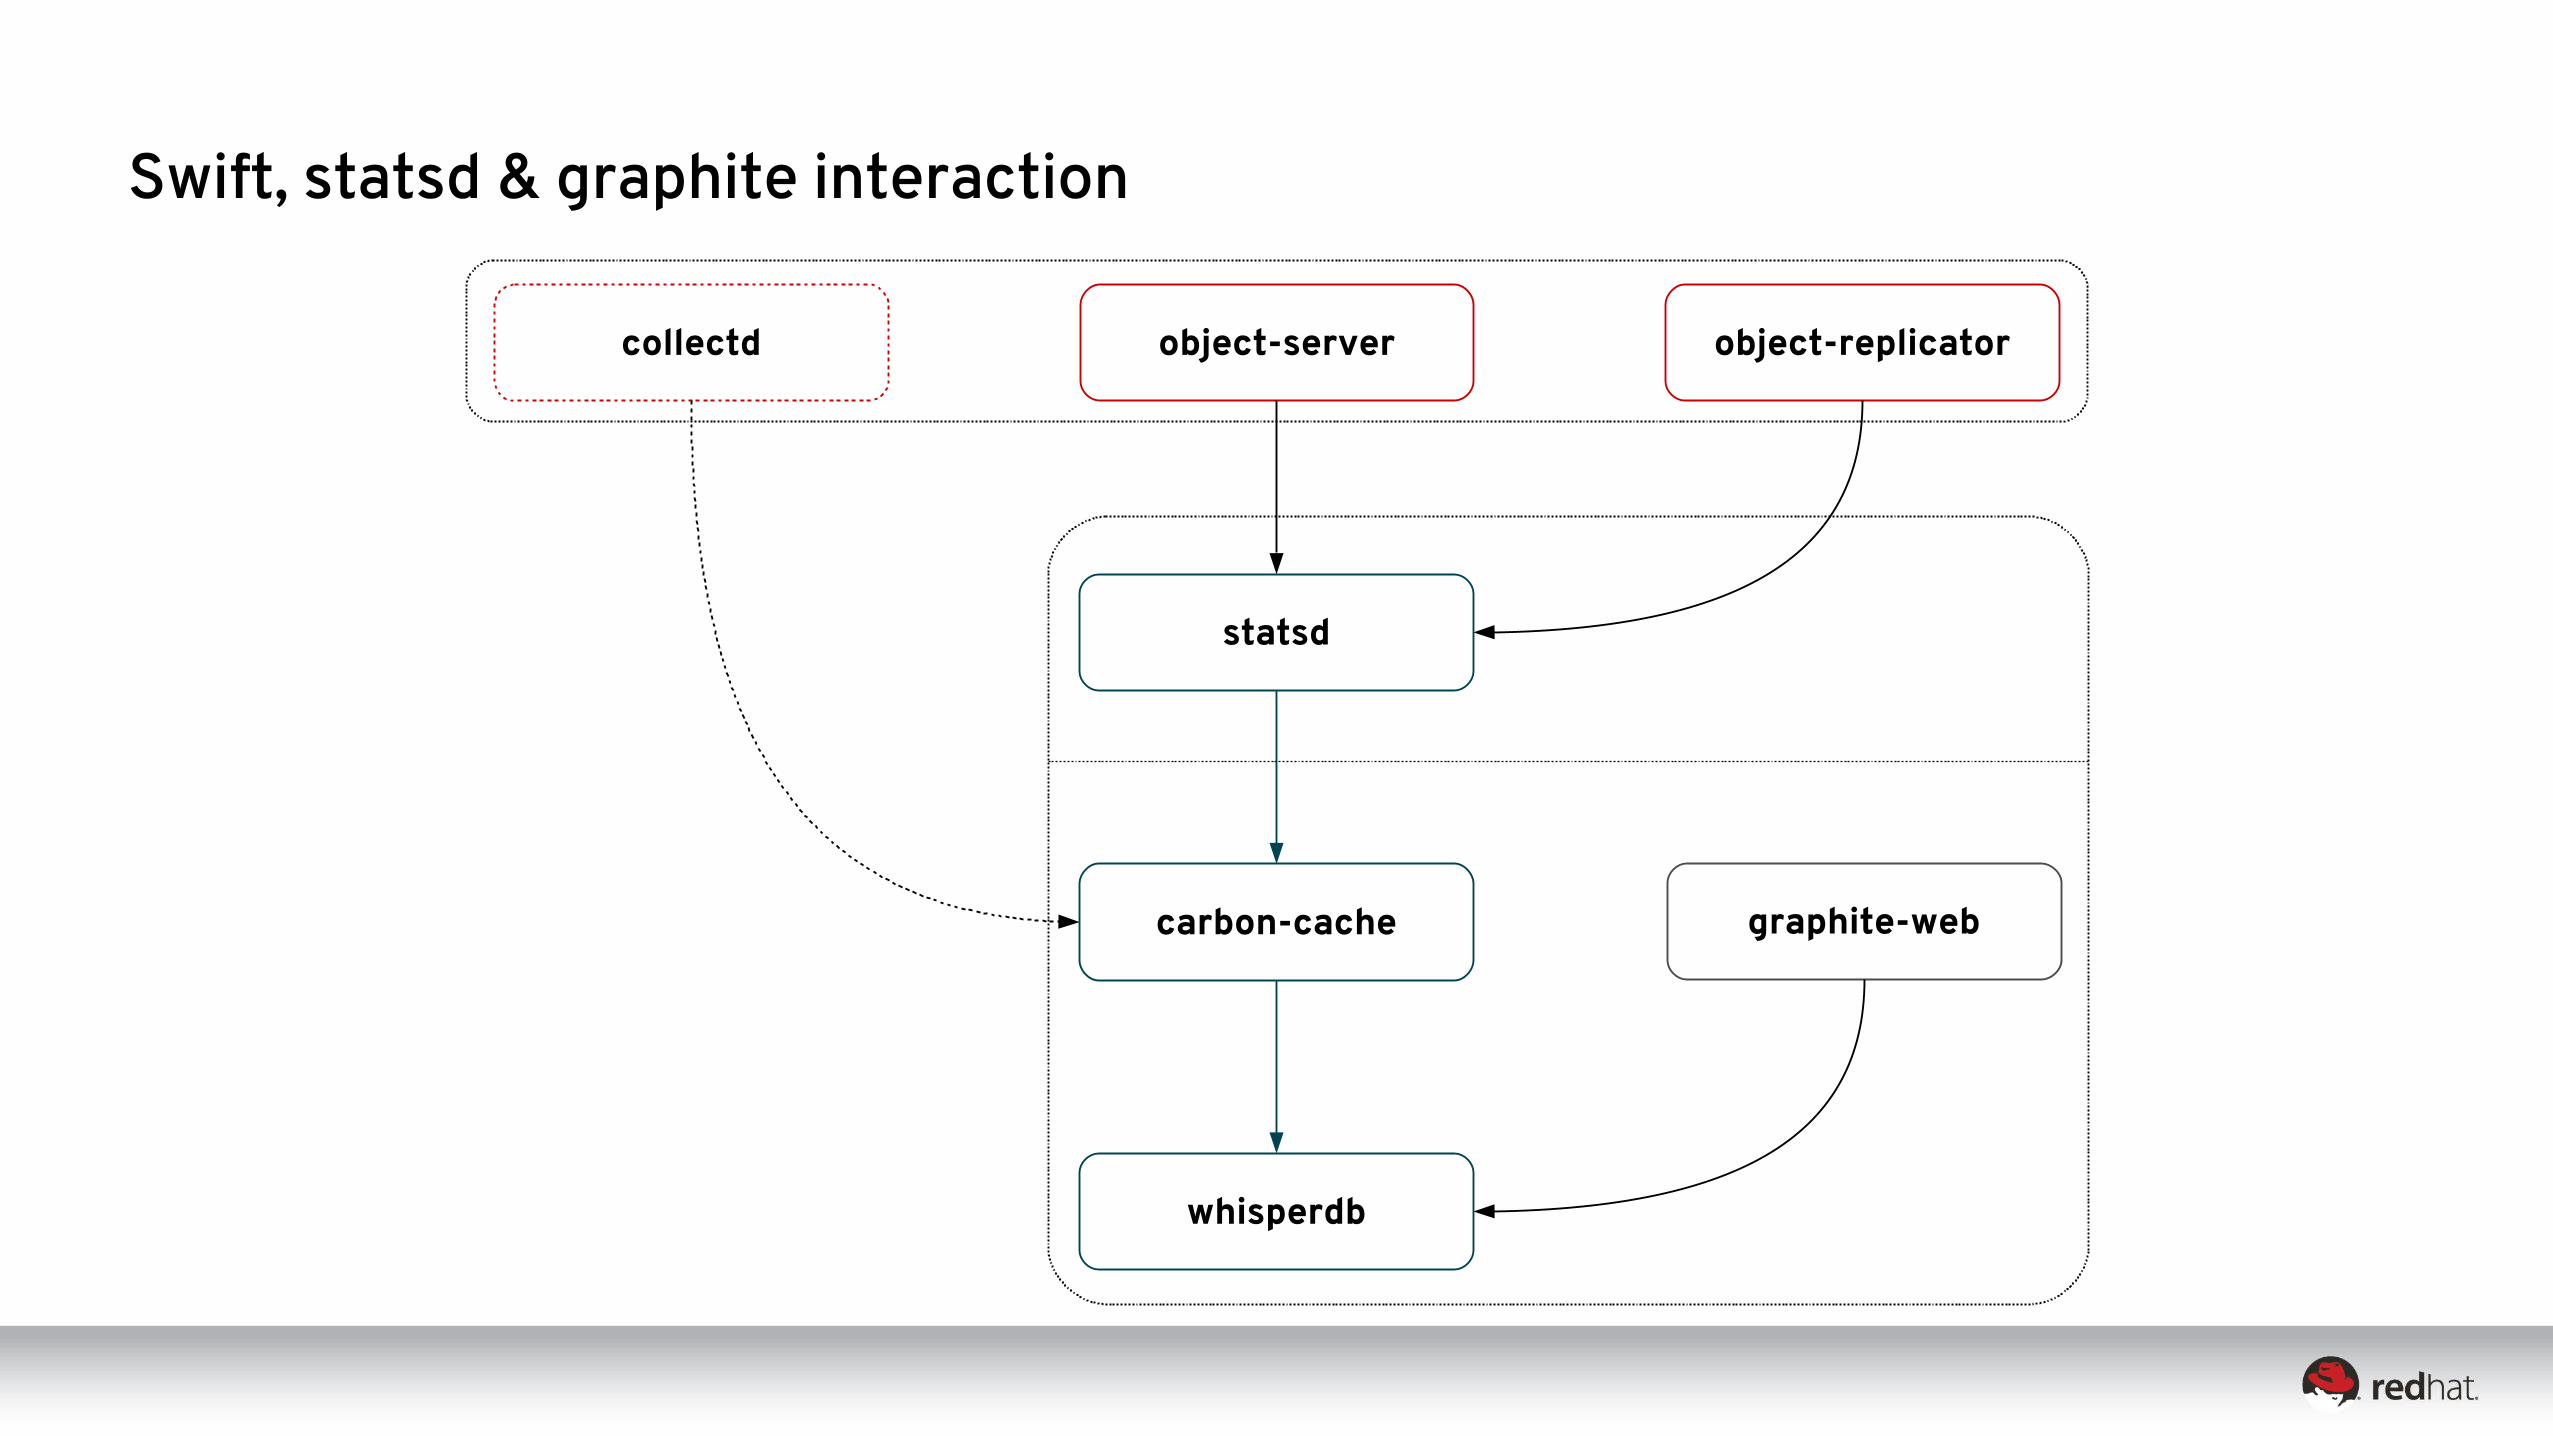
Swift, statsd & graphite interaction
object-server object-replicatorcollectd
statsd
carbon-cache
whisperdb
graphite-web

Installation & con-guration
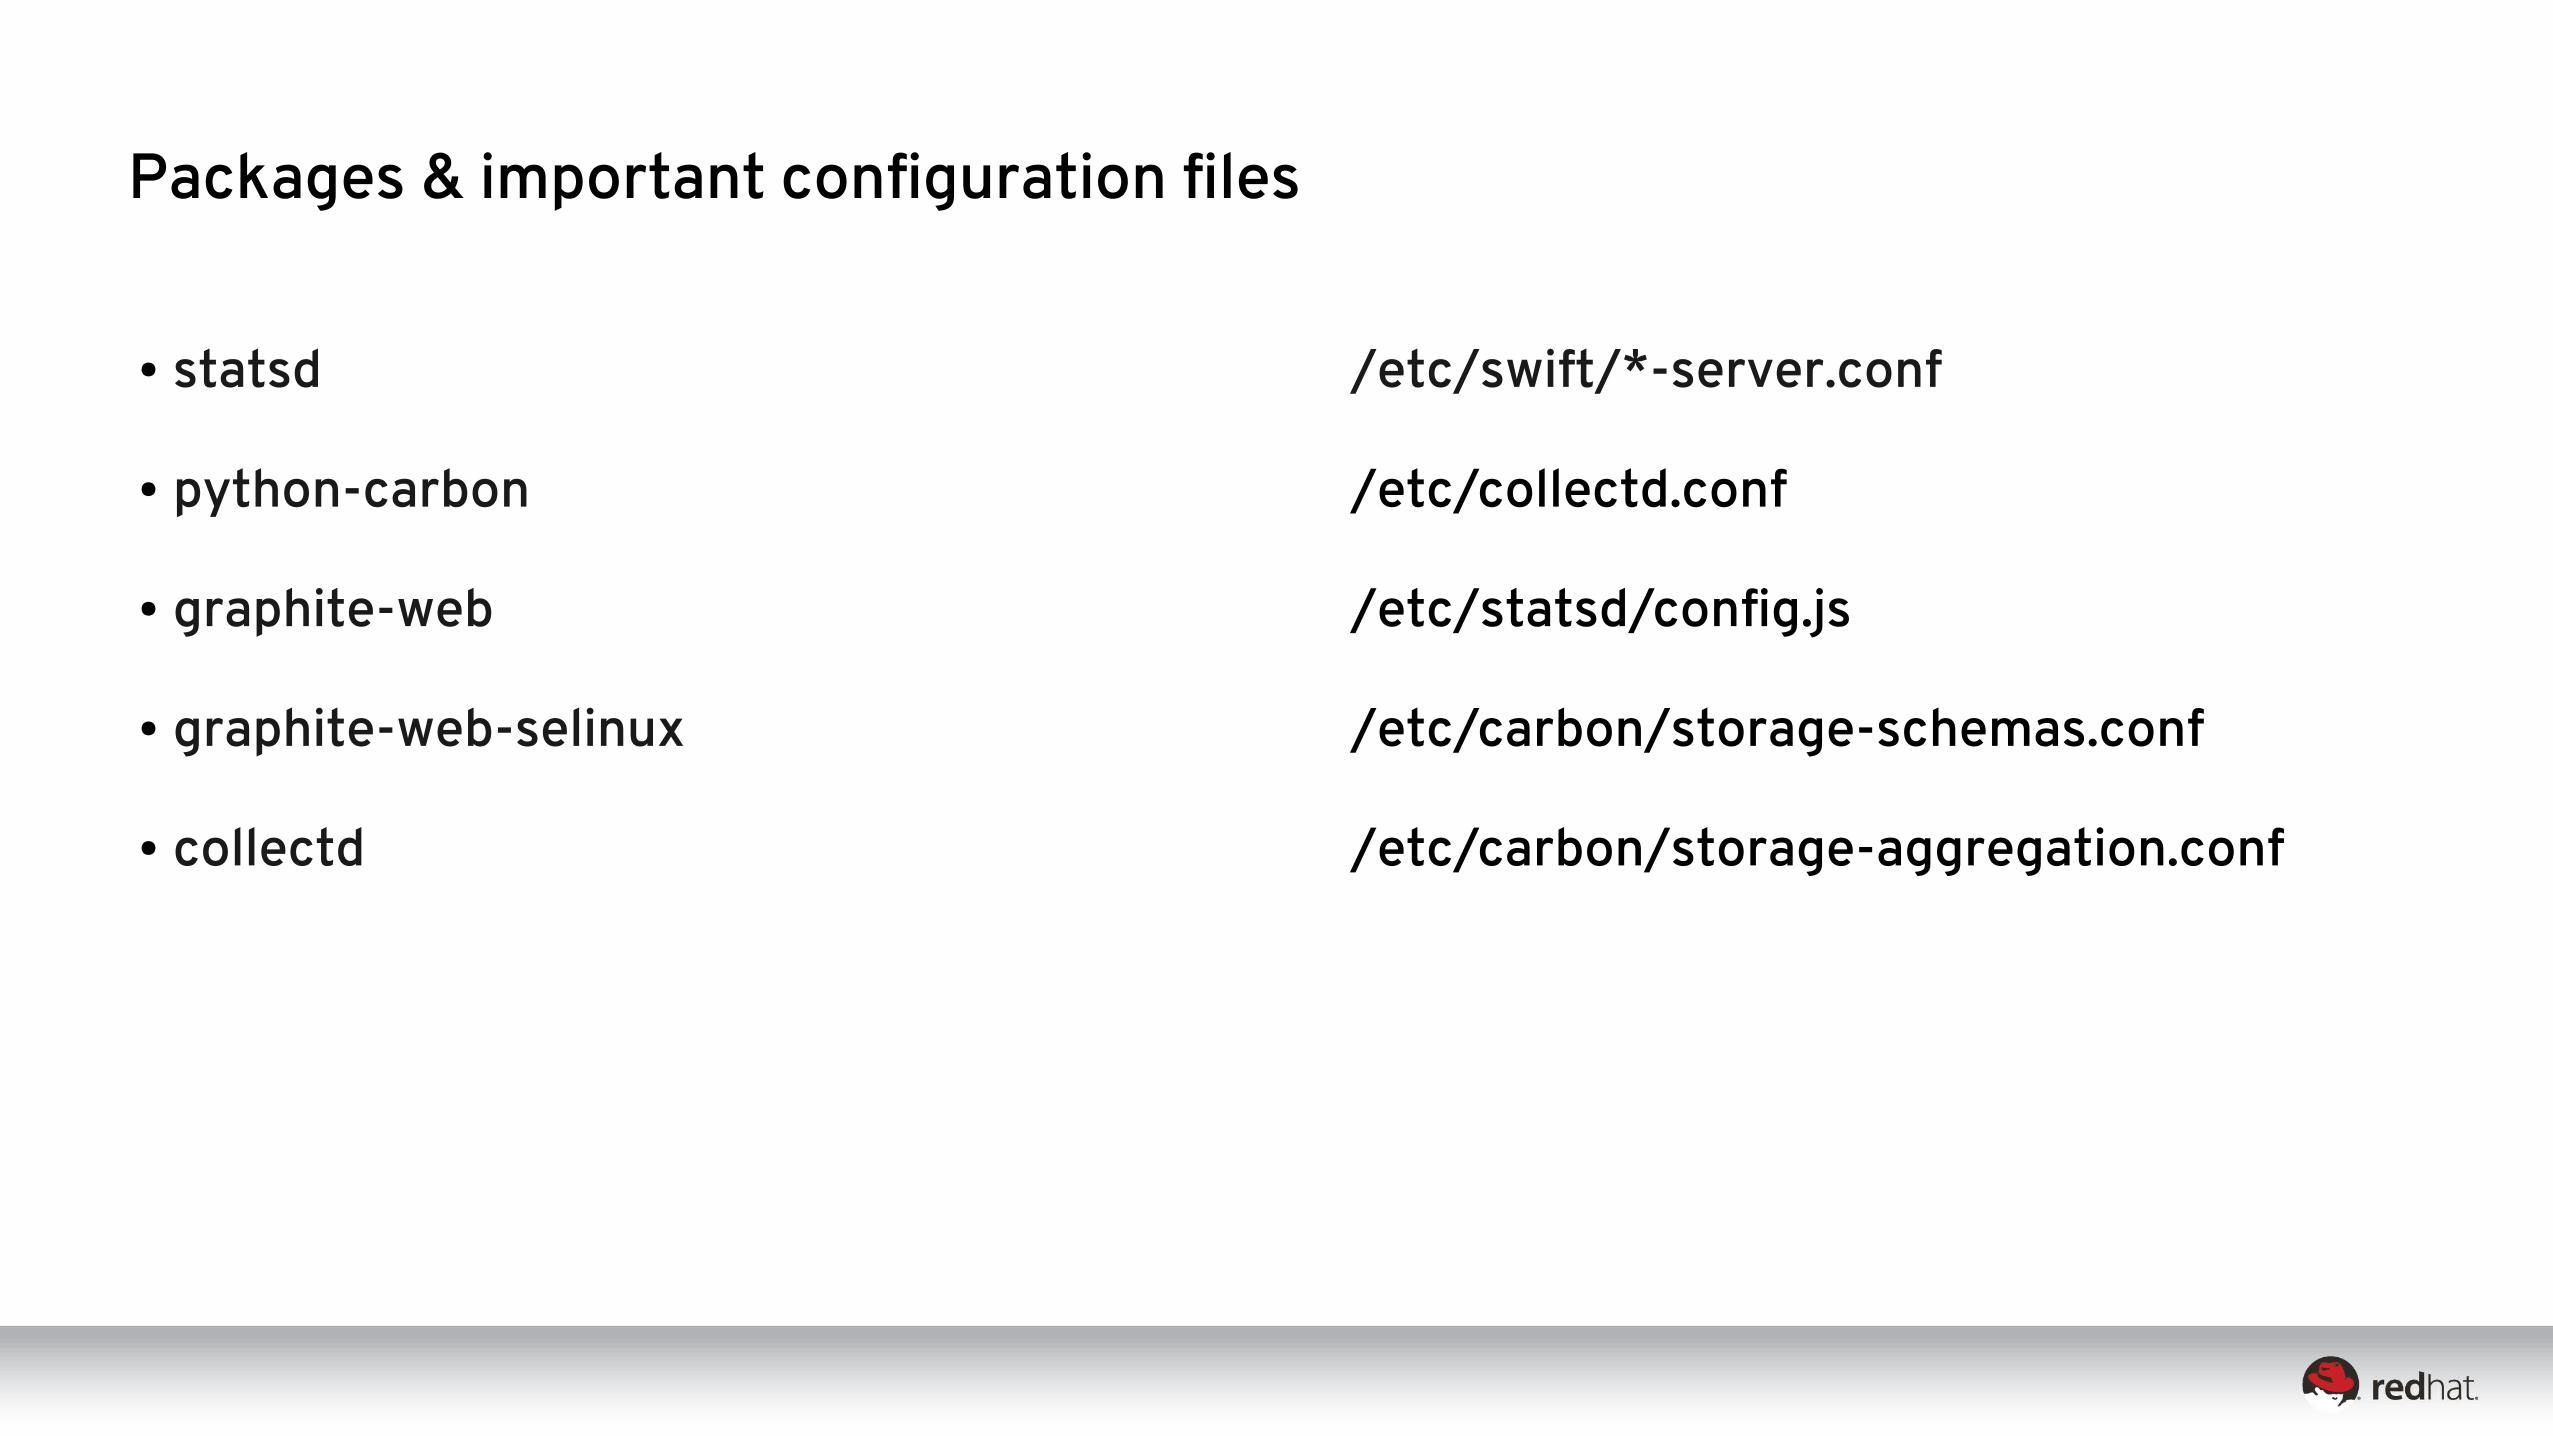
Packages & important con-guration -les
● statsd
● python-carbon
● graphite-web
● graphite-web-selinux
● collectd
/etc/swift/*-server.conf
/etc/collectd.conf
/etc/statsd/con-g.js
/etc/carbon/storage-schemas.conf
/etc/carbon/storage-aggregation.conf
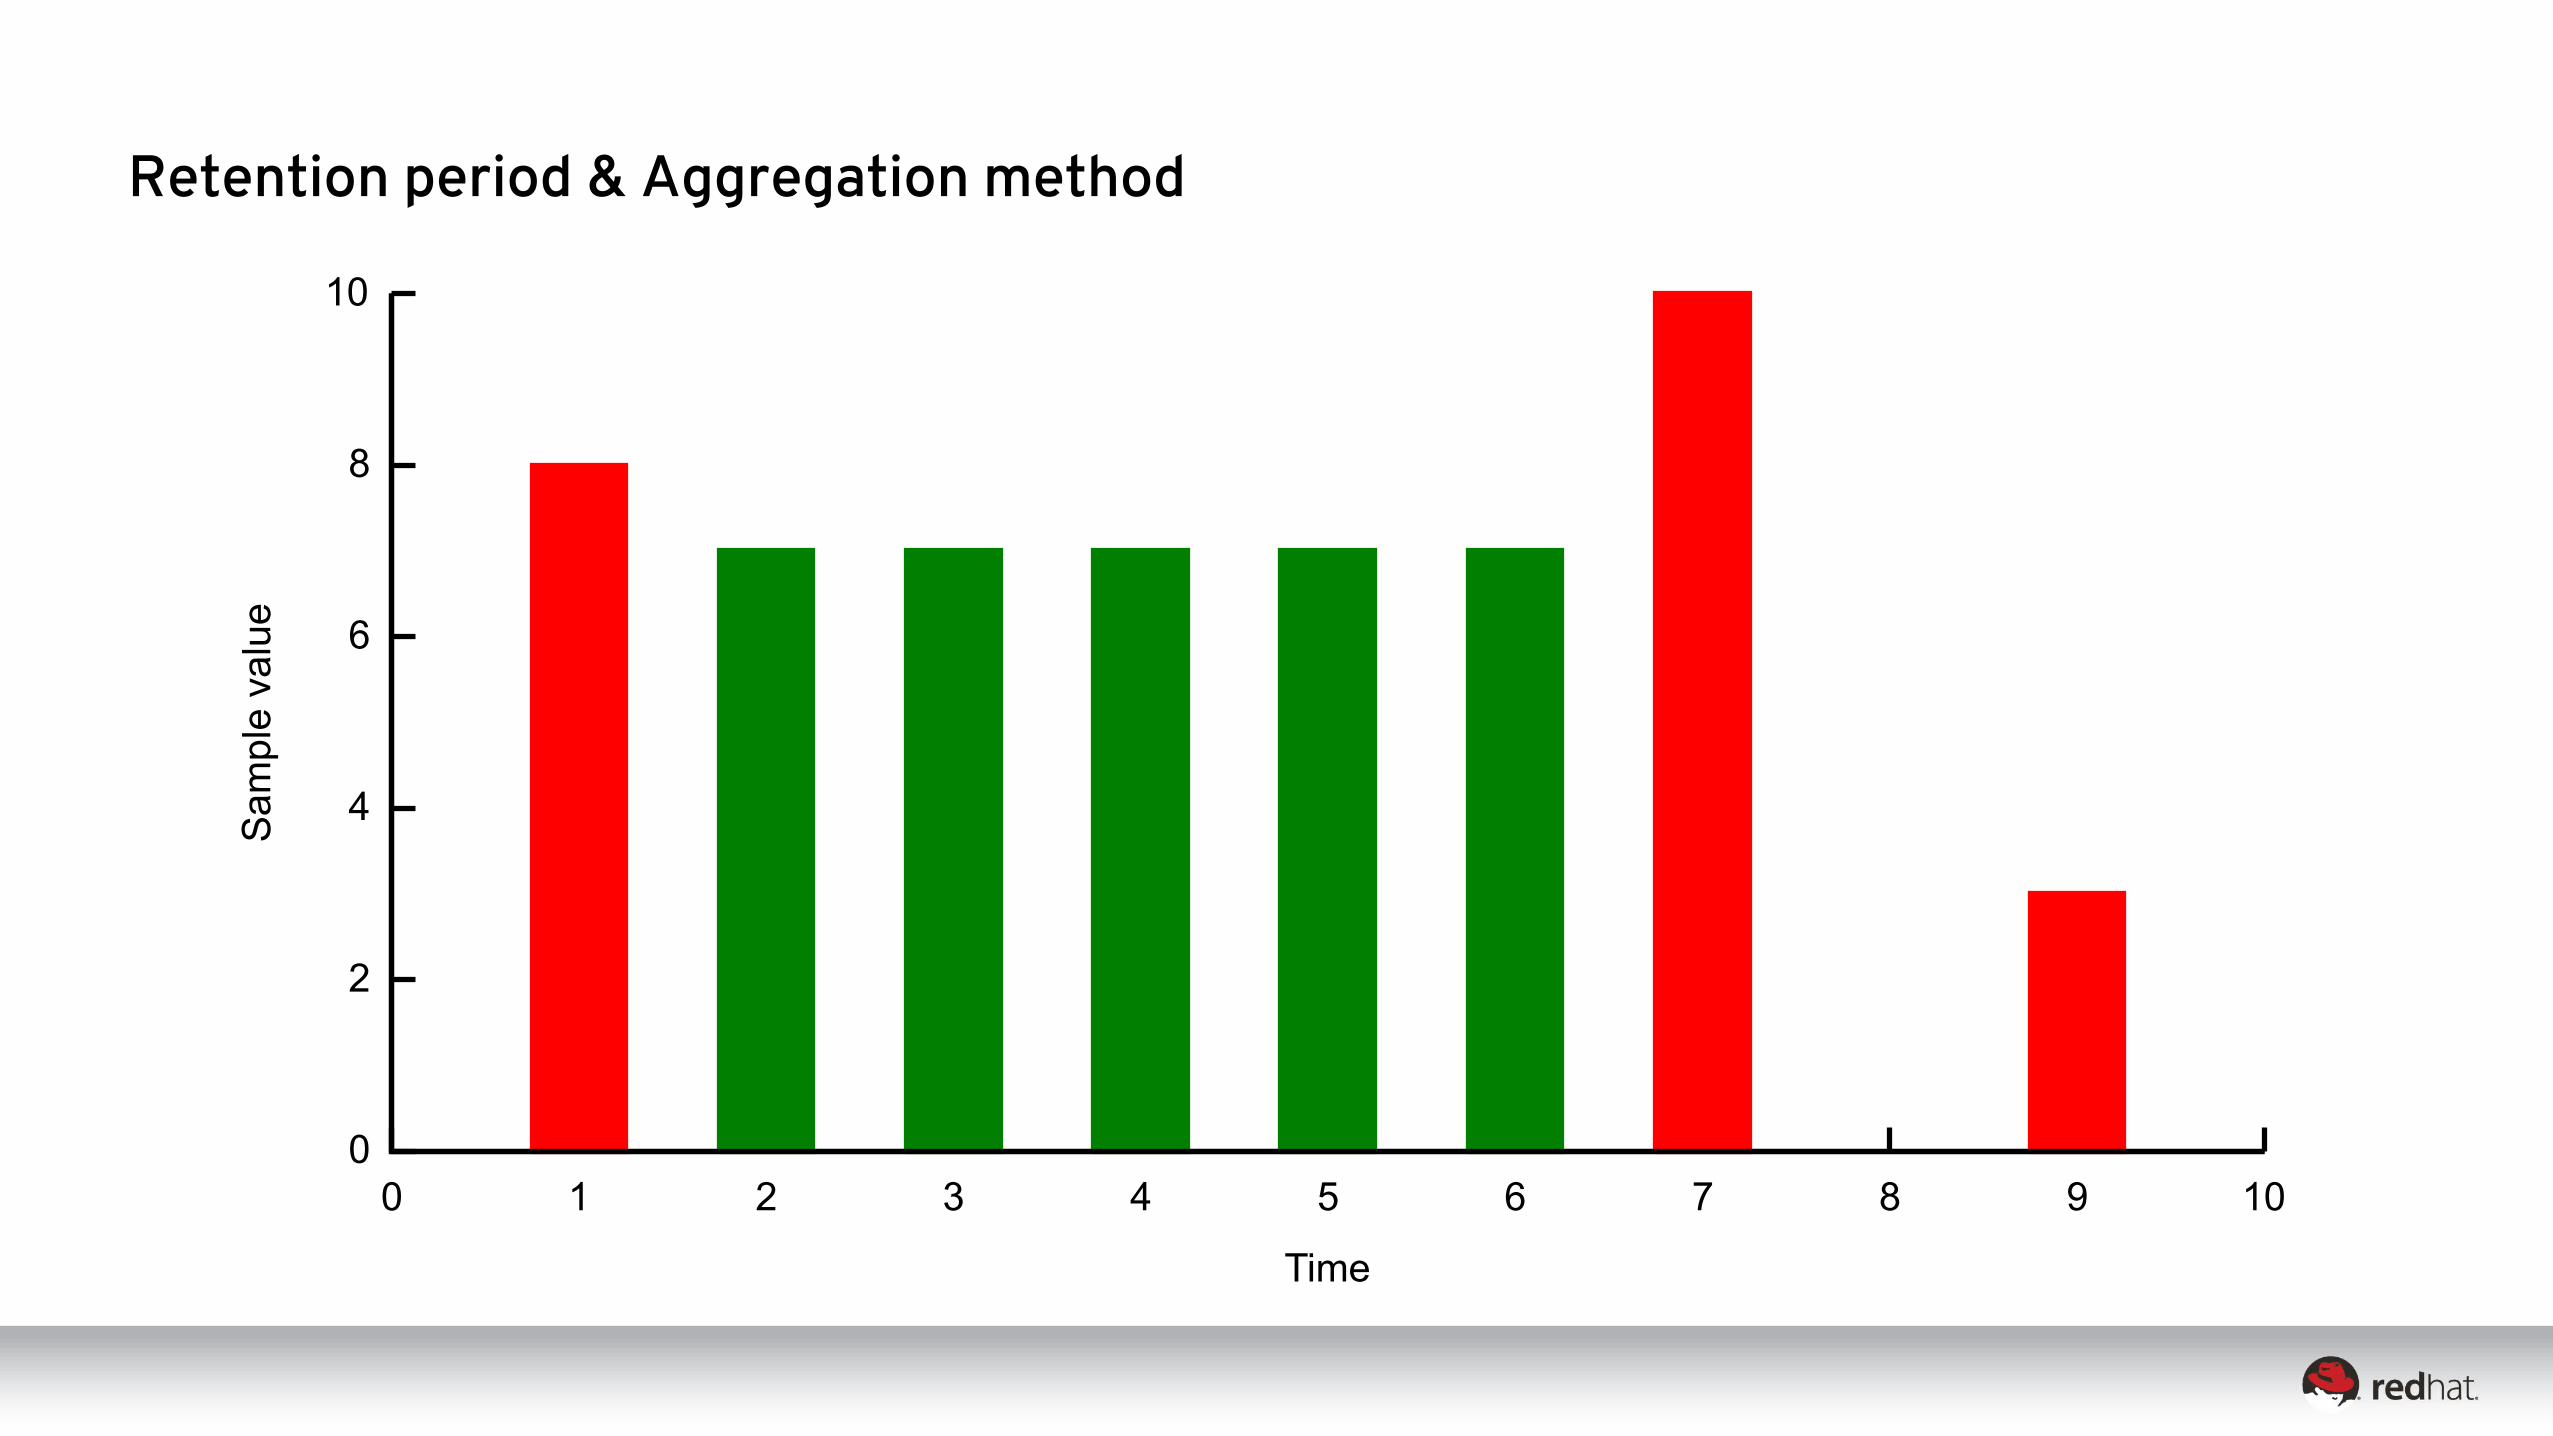
0
2
4
6
8
10
0 1 2 3 4 5 6 7 8 9 10
Sa
mple
valu
e
Time
Retention period & Aggregation method

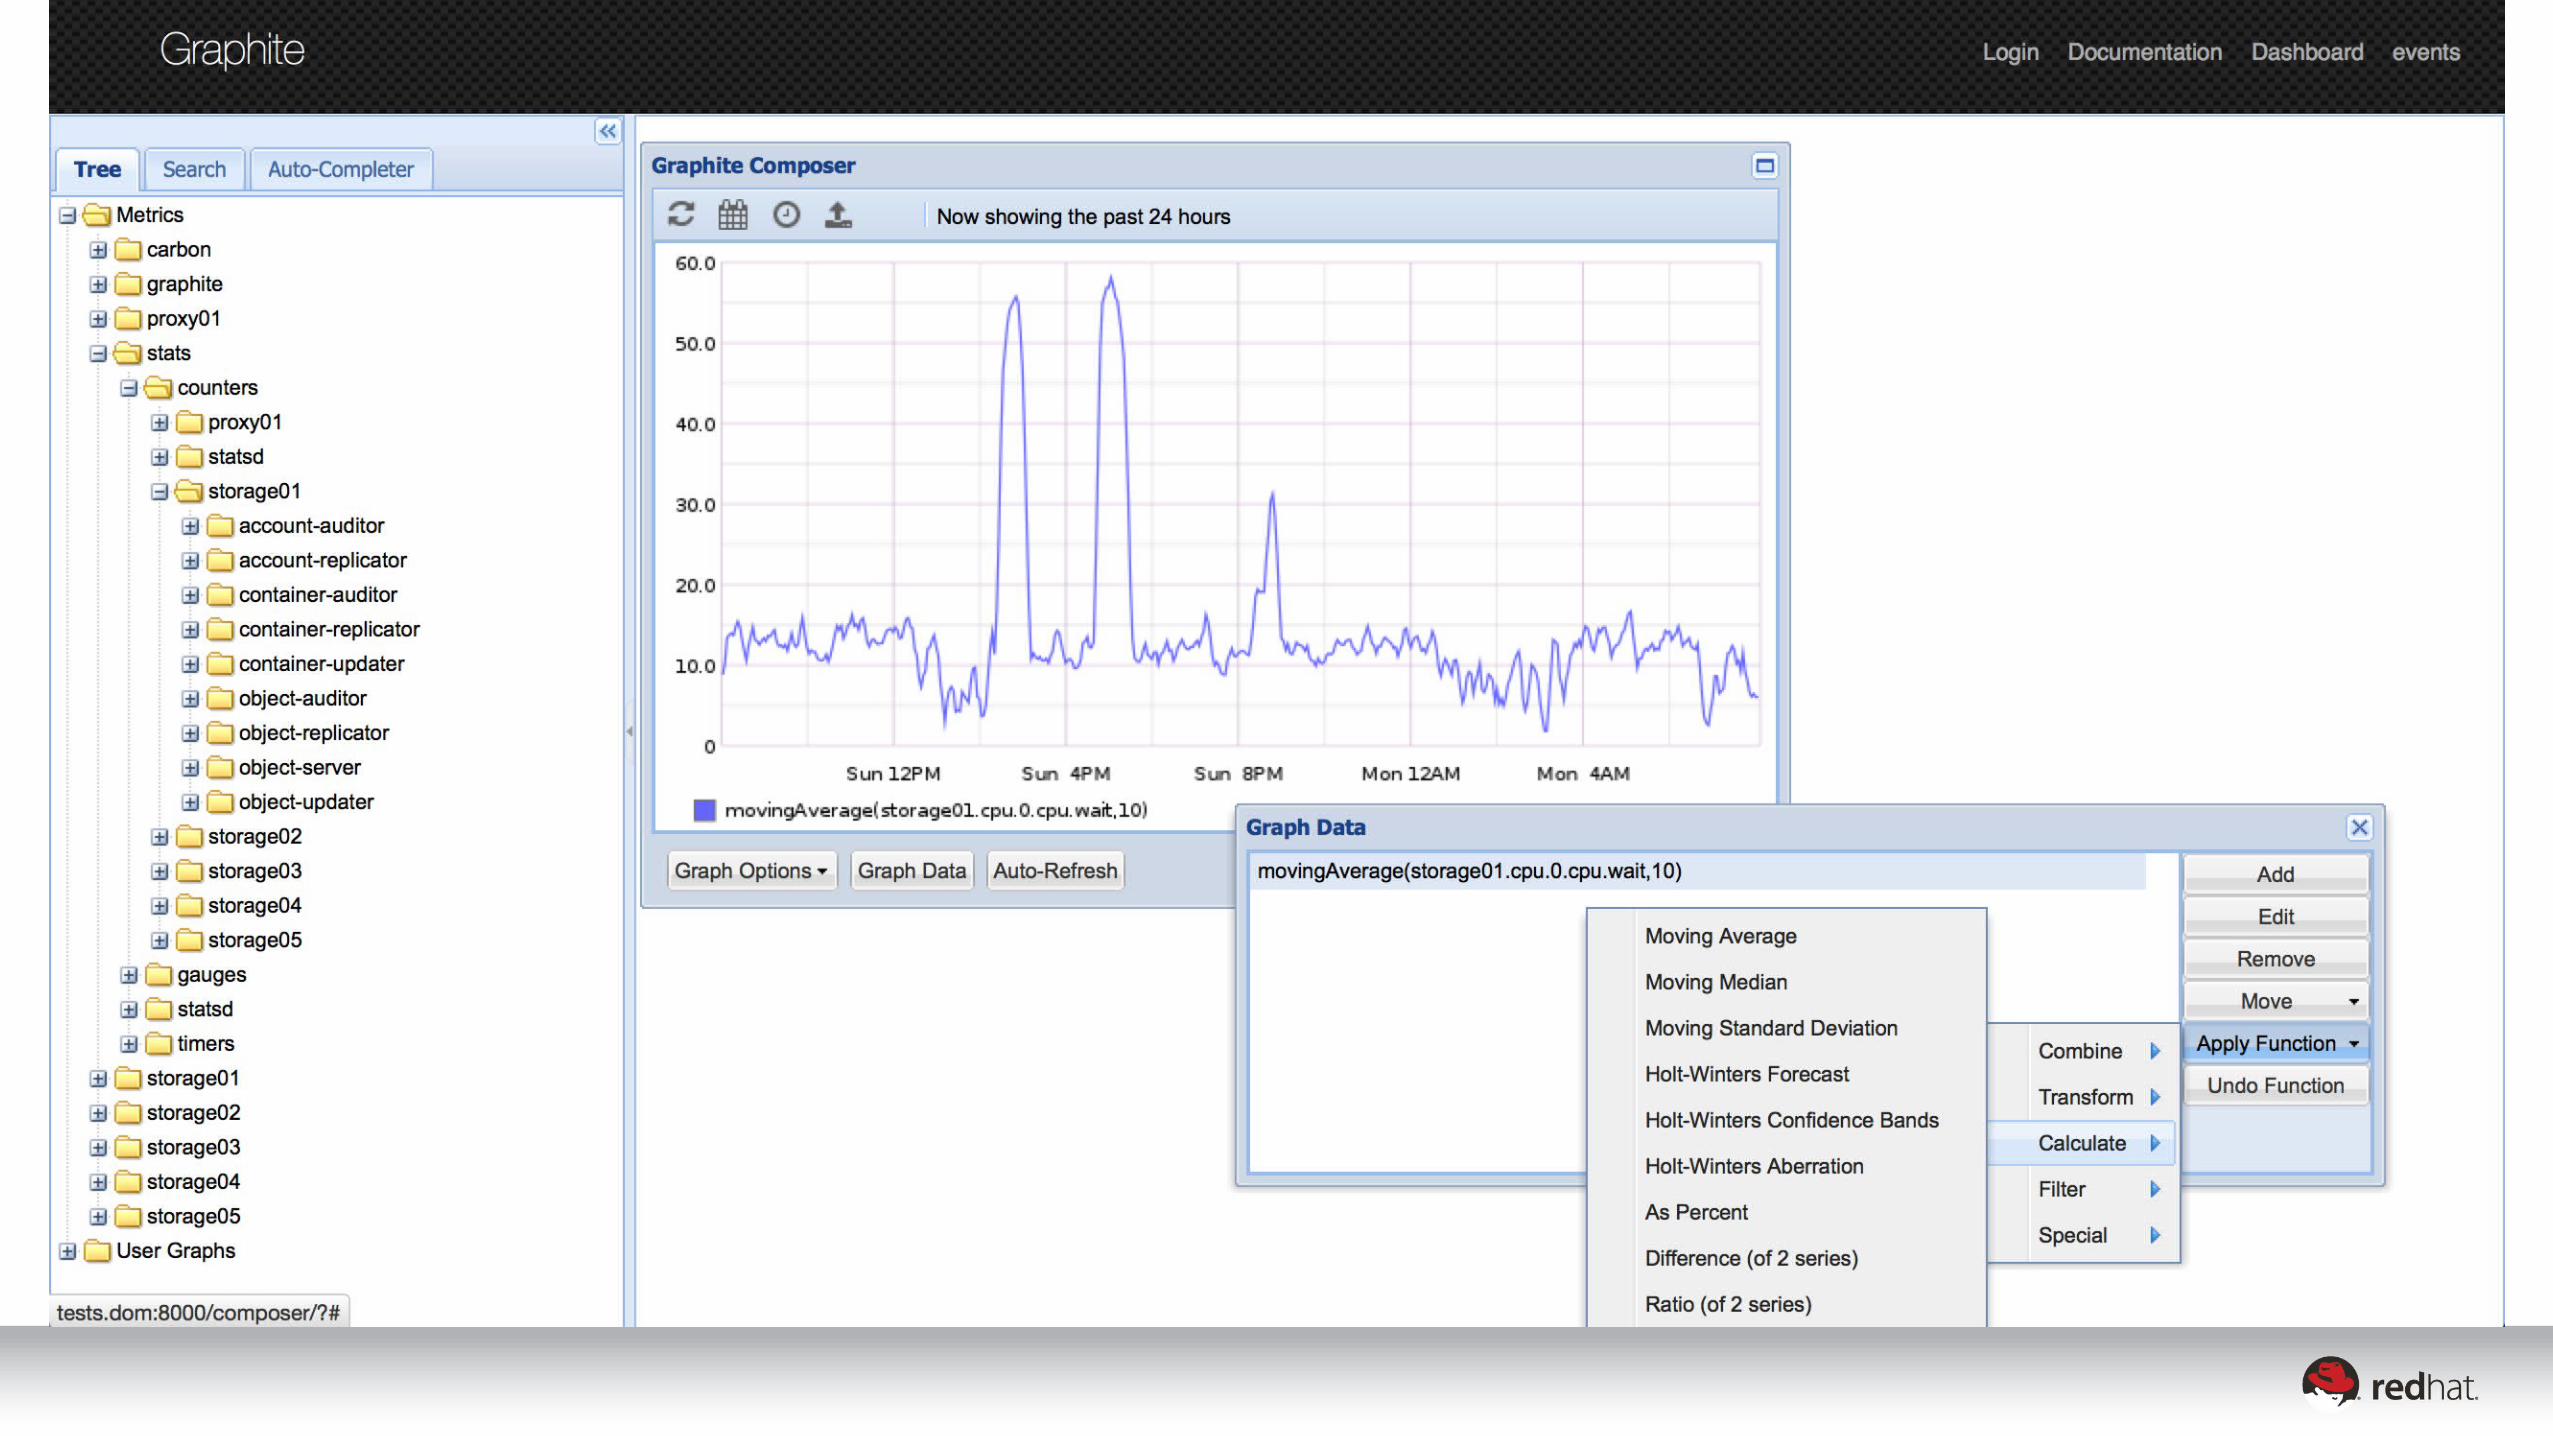
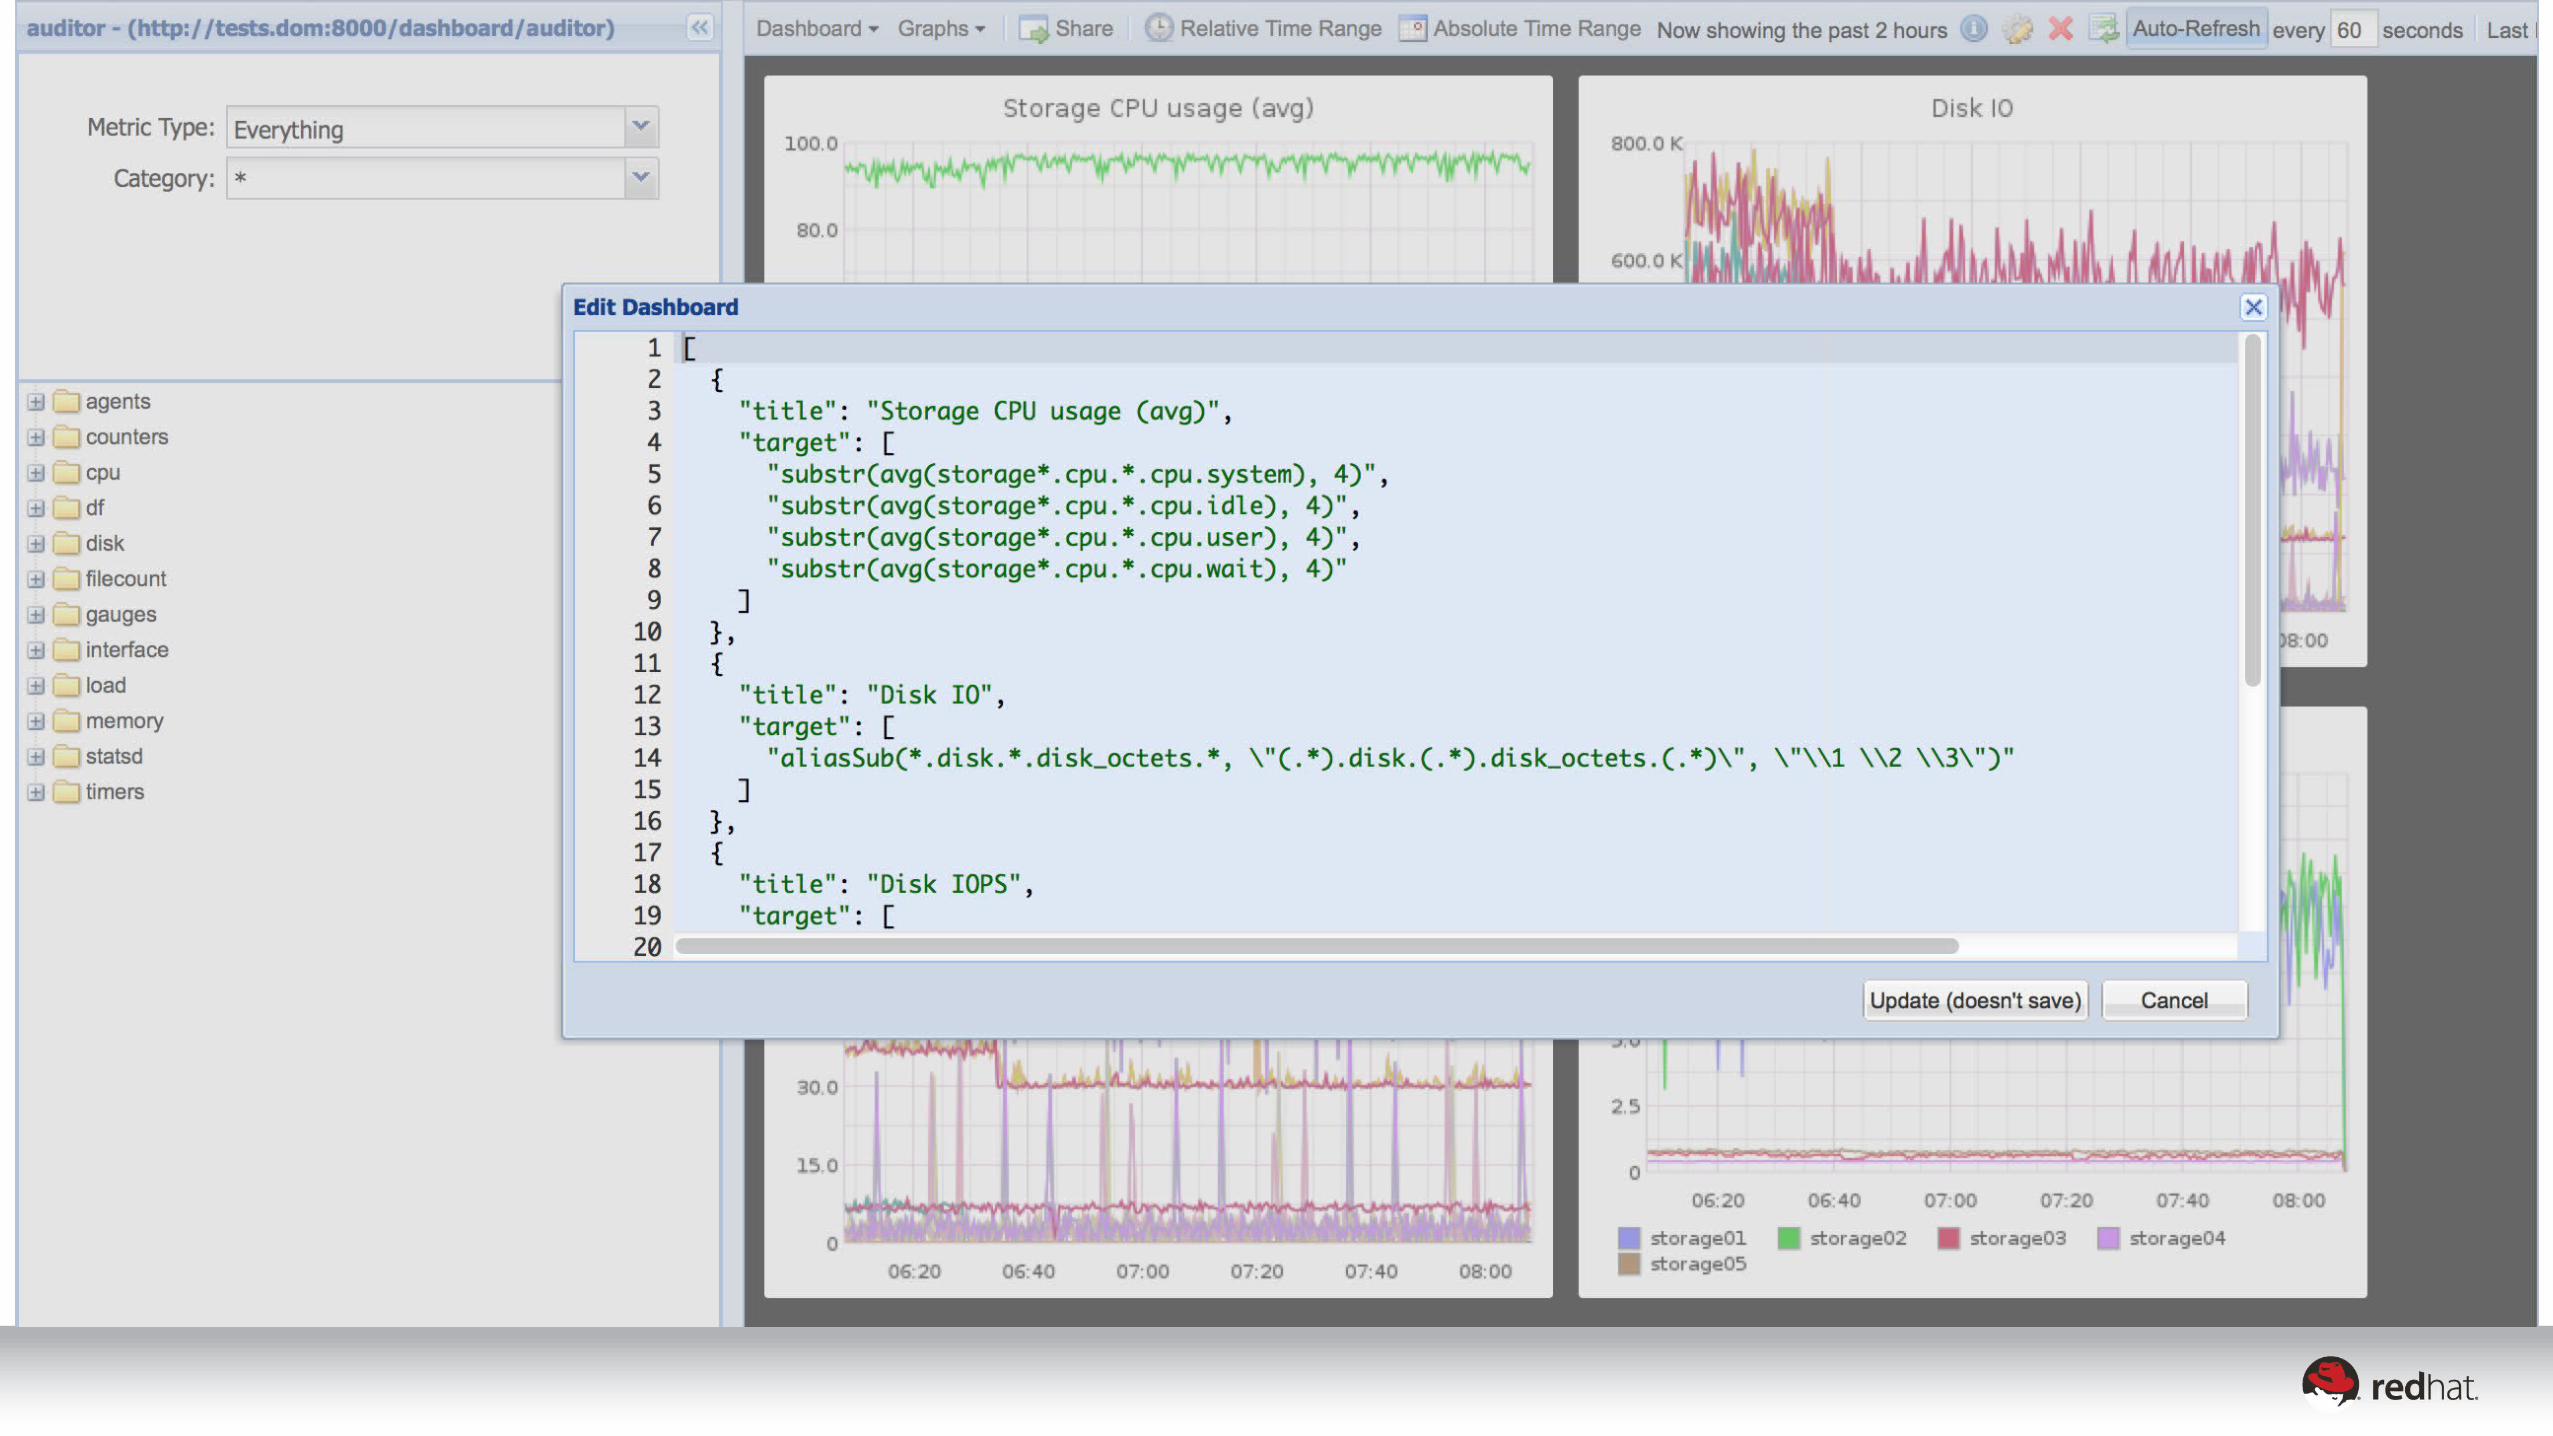
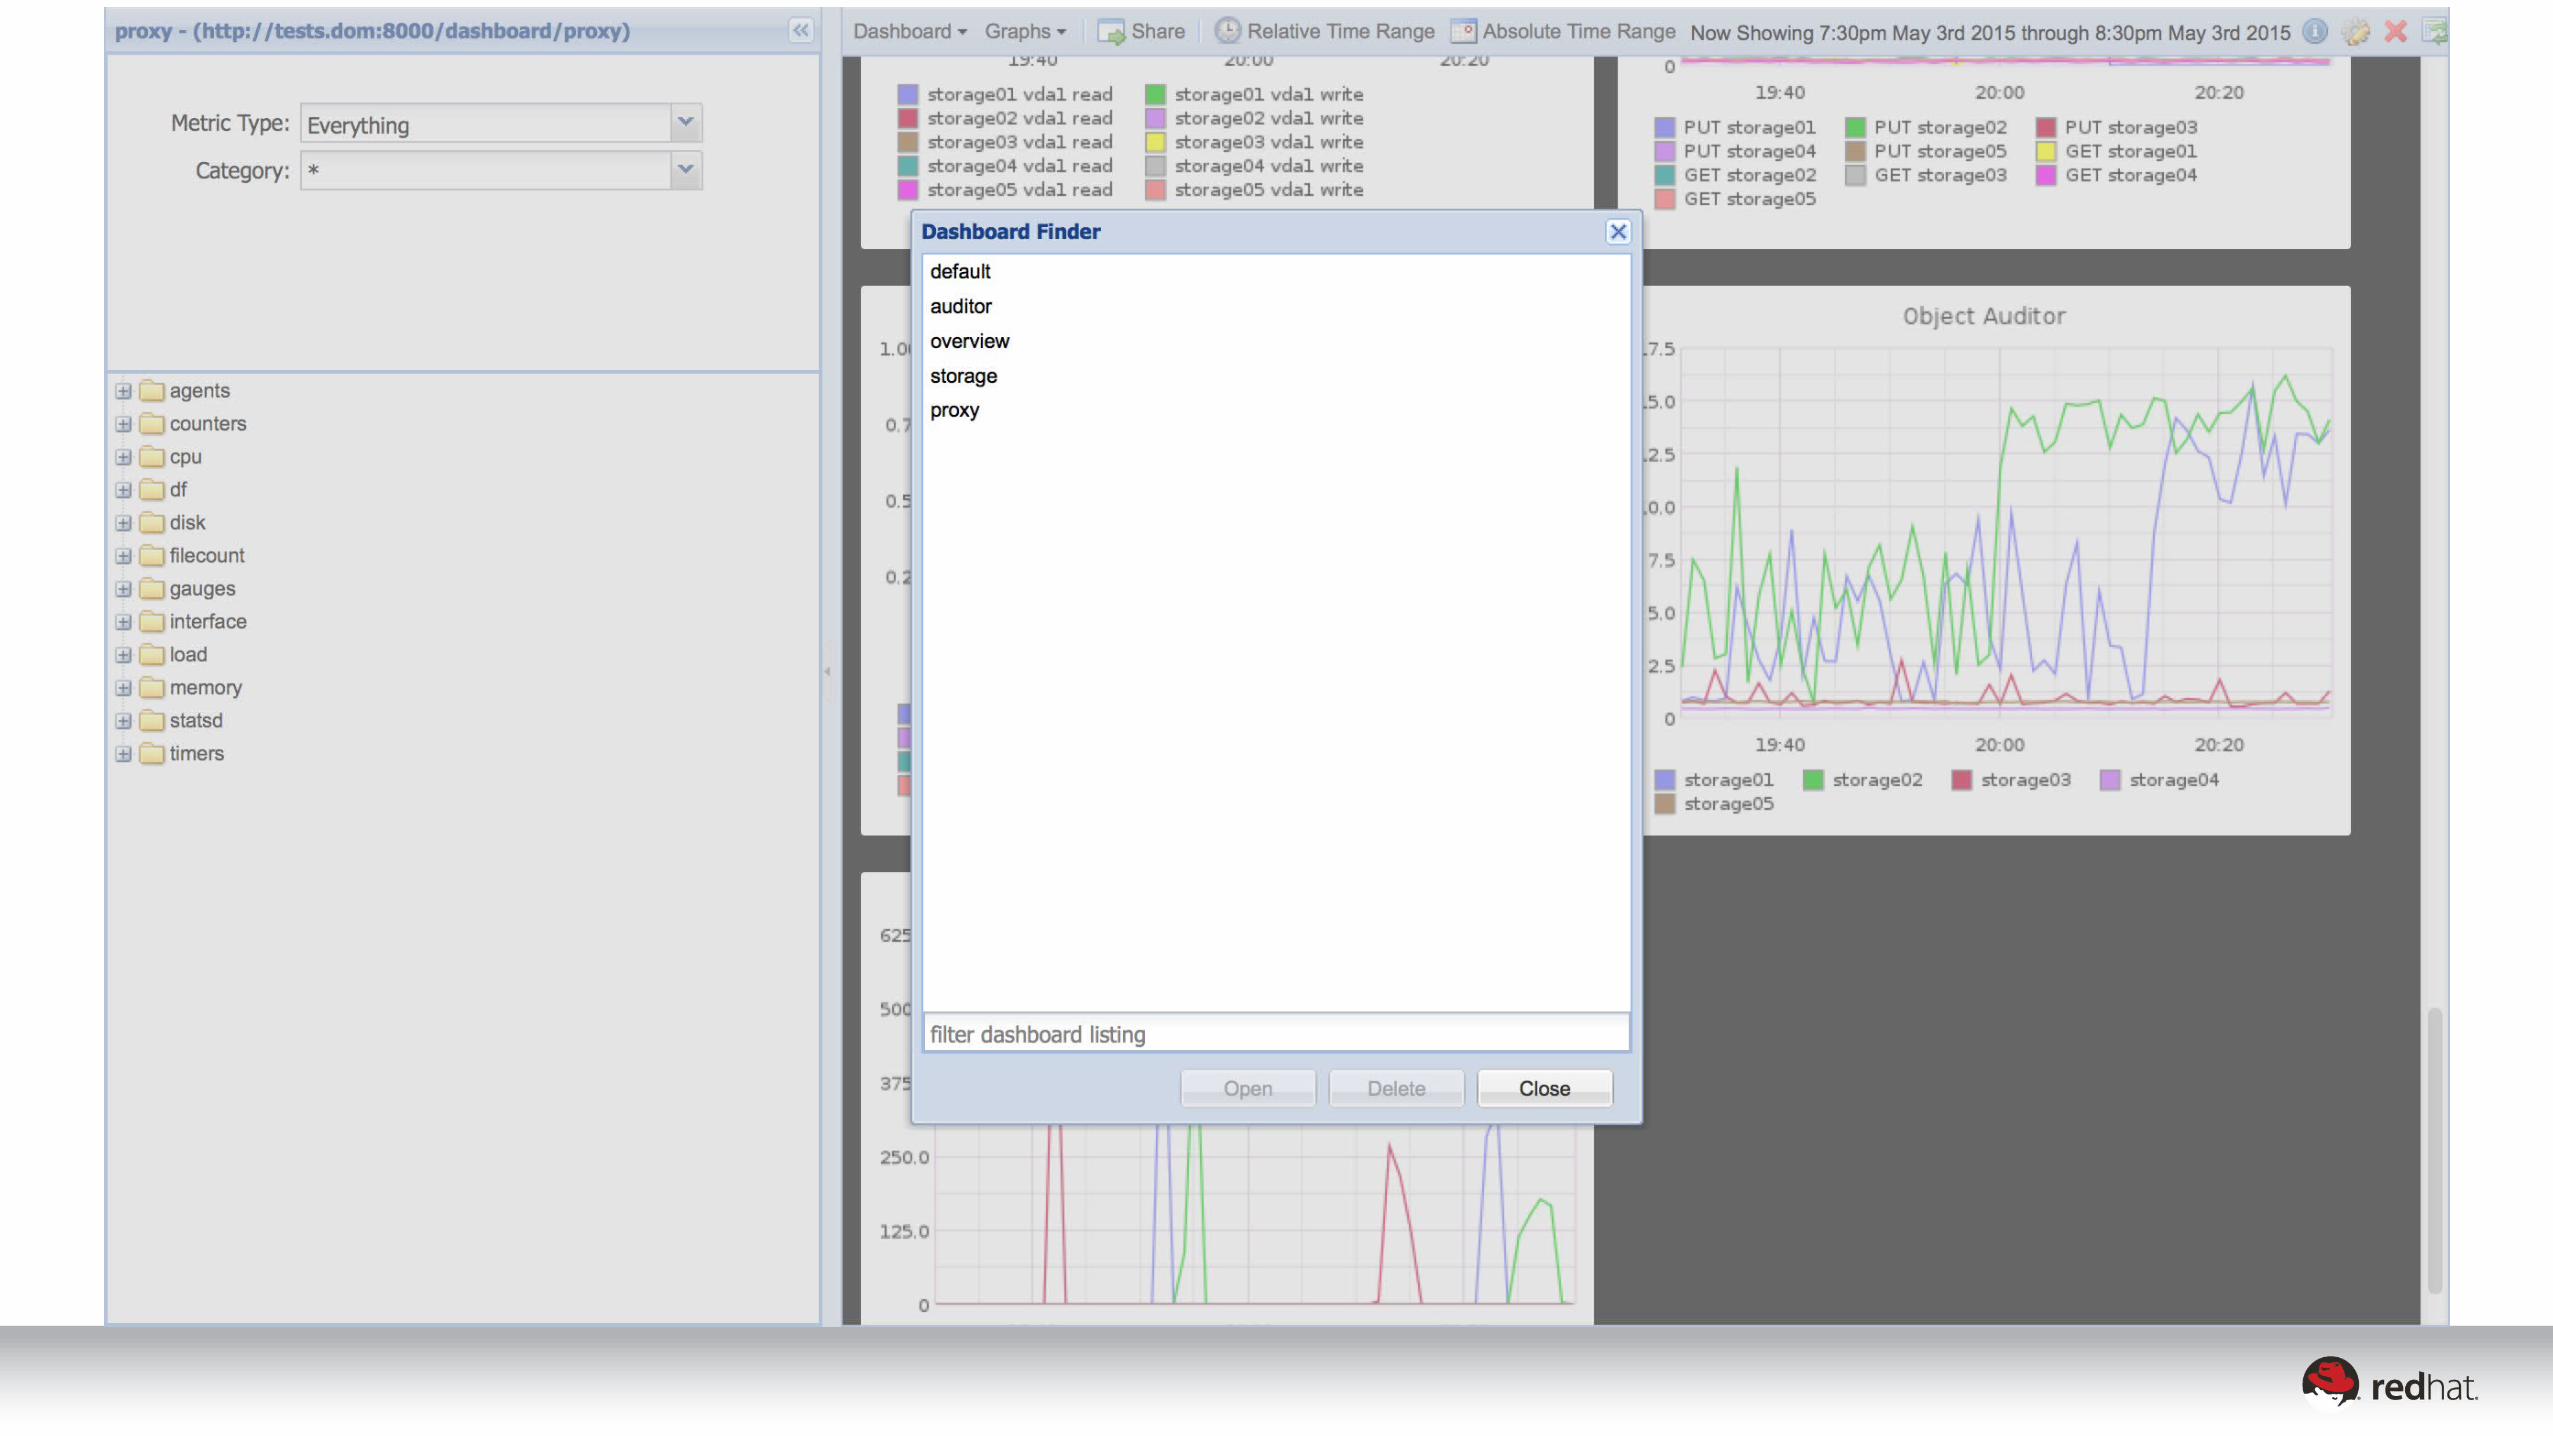
Working with graphite-web
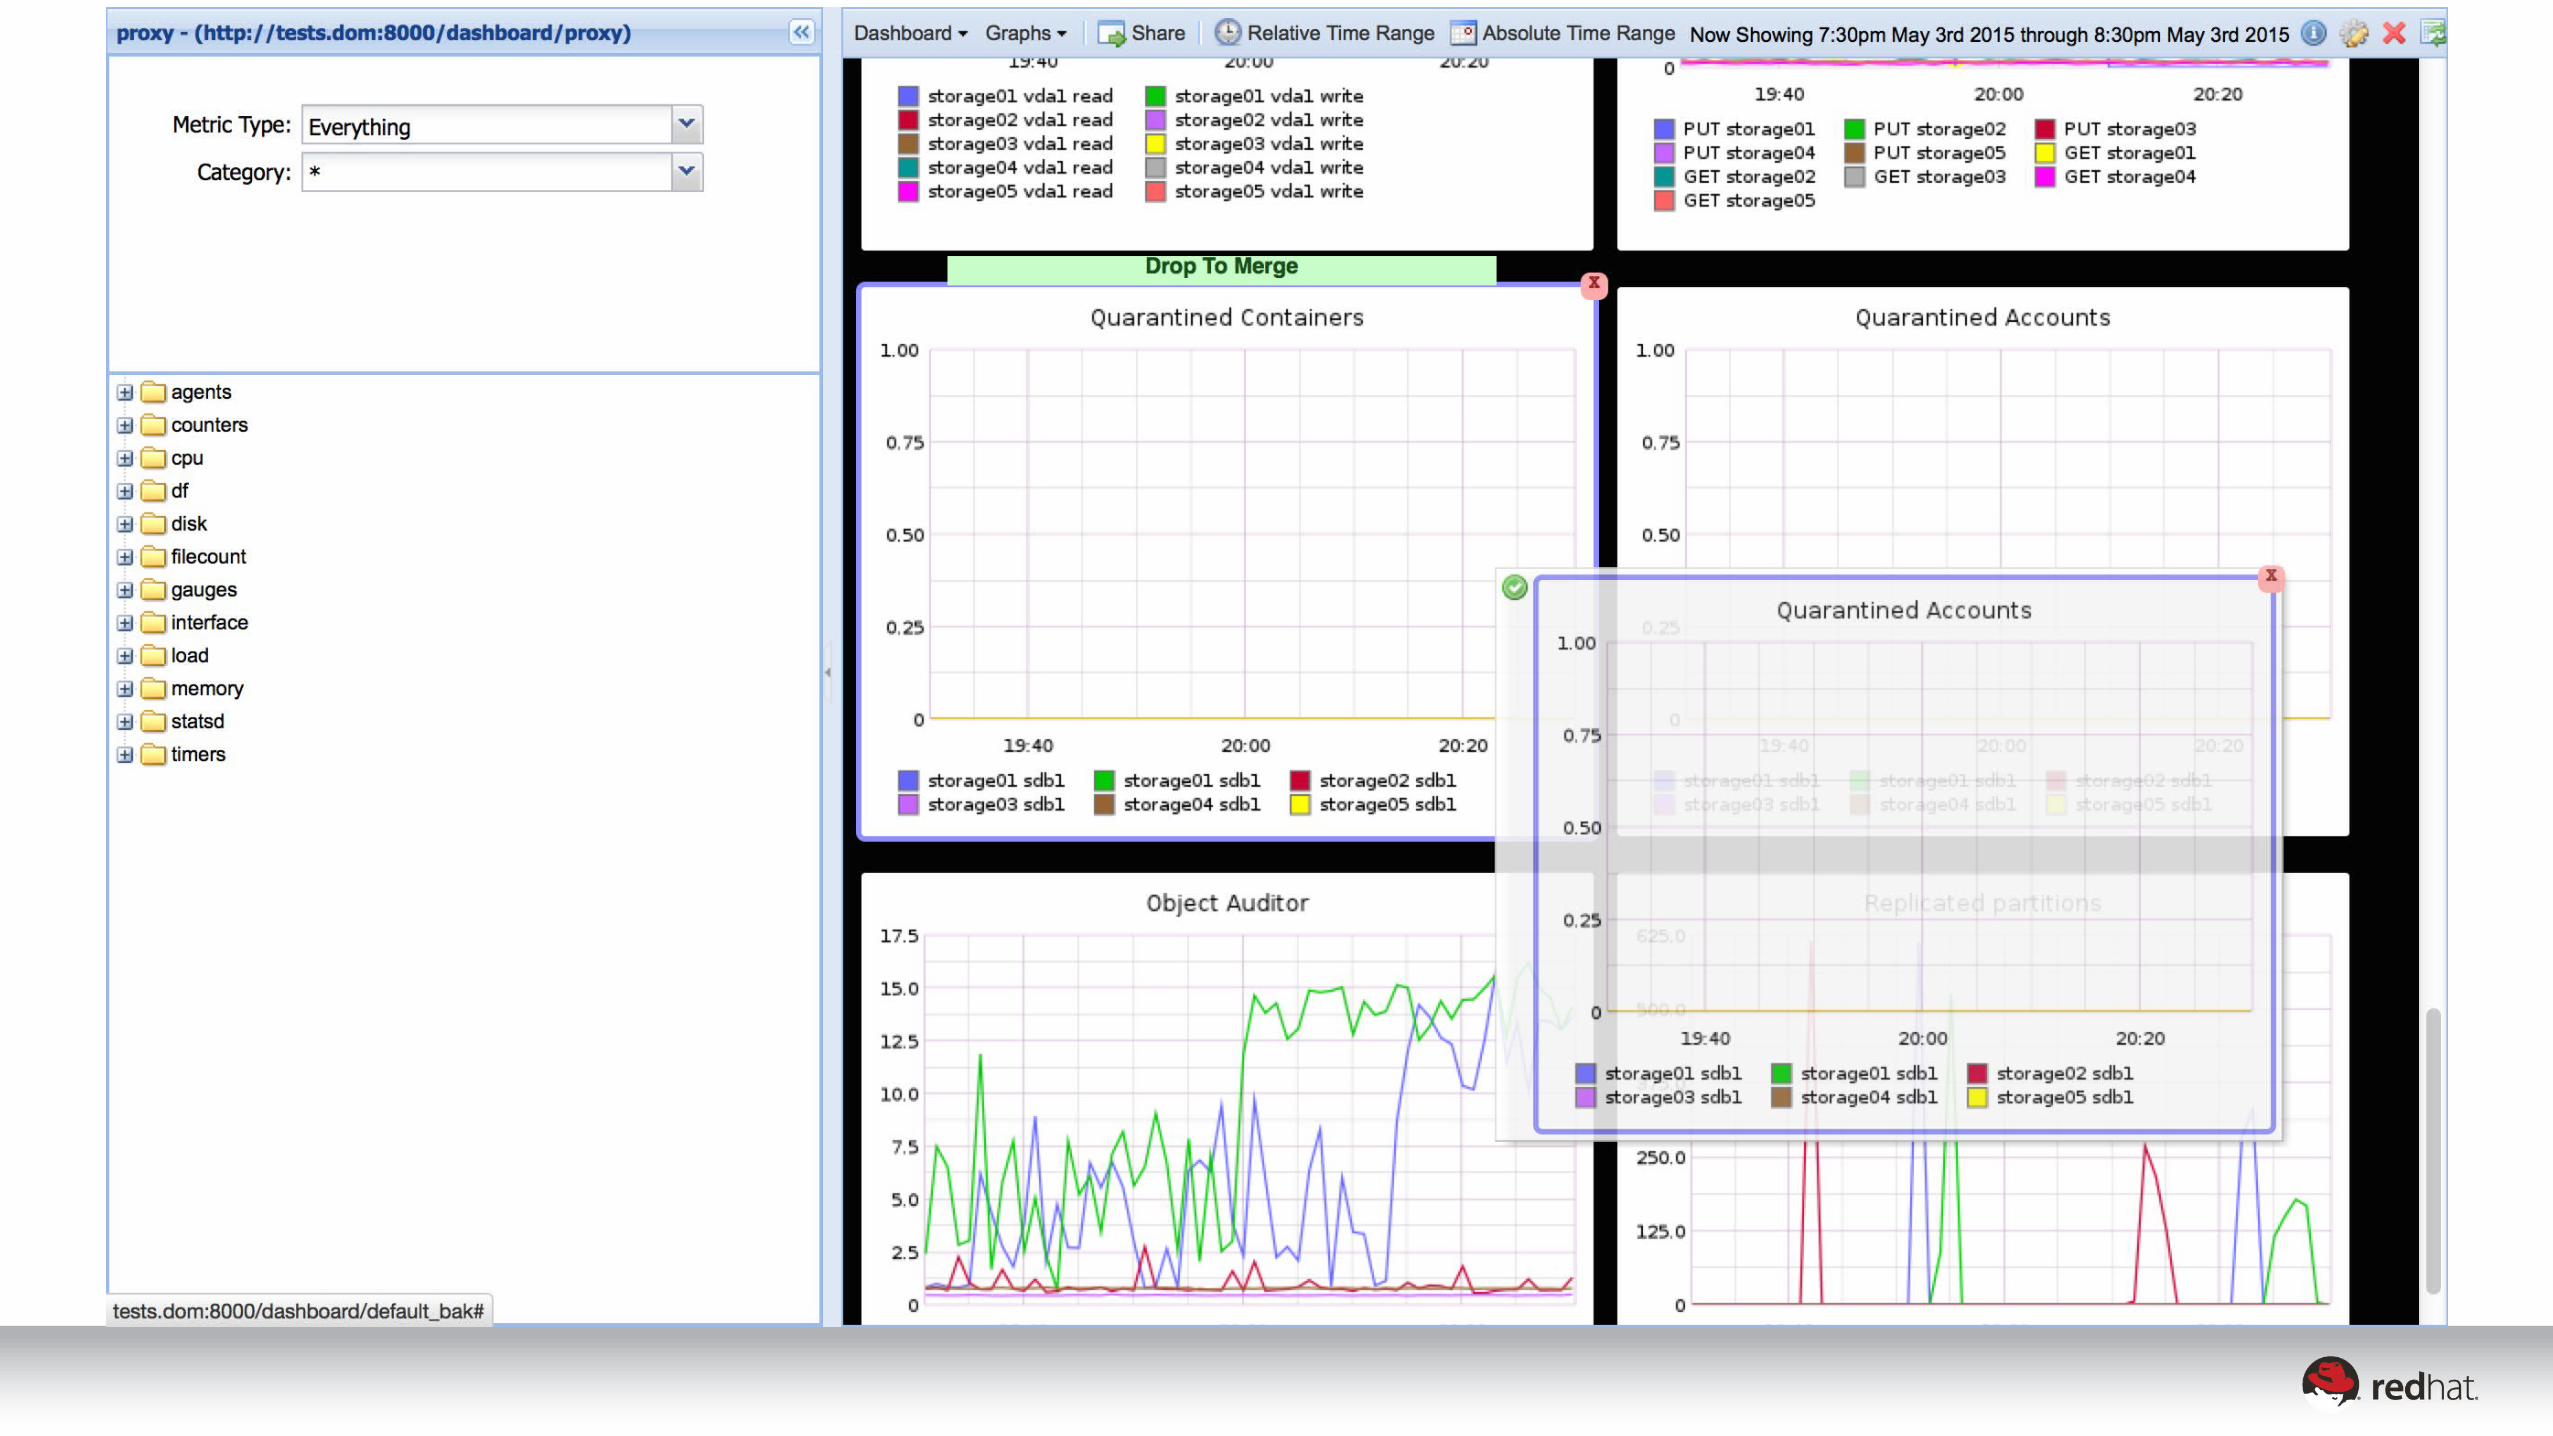

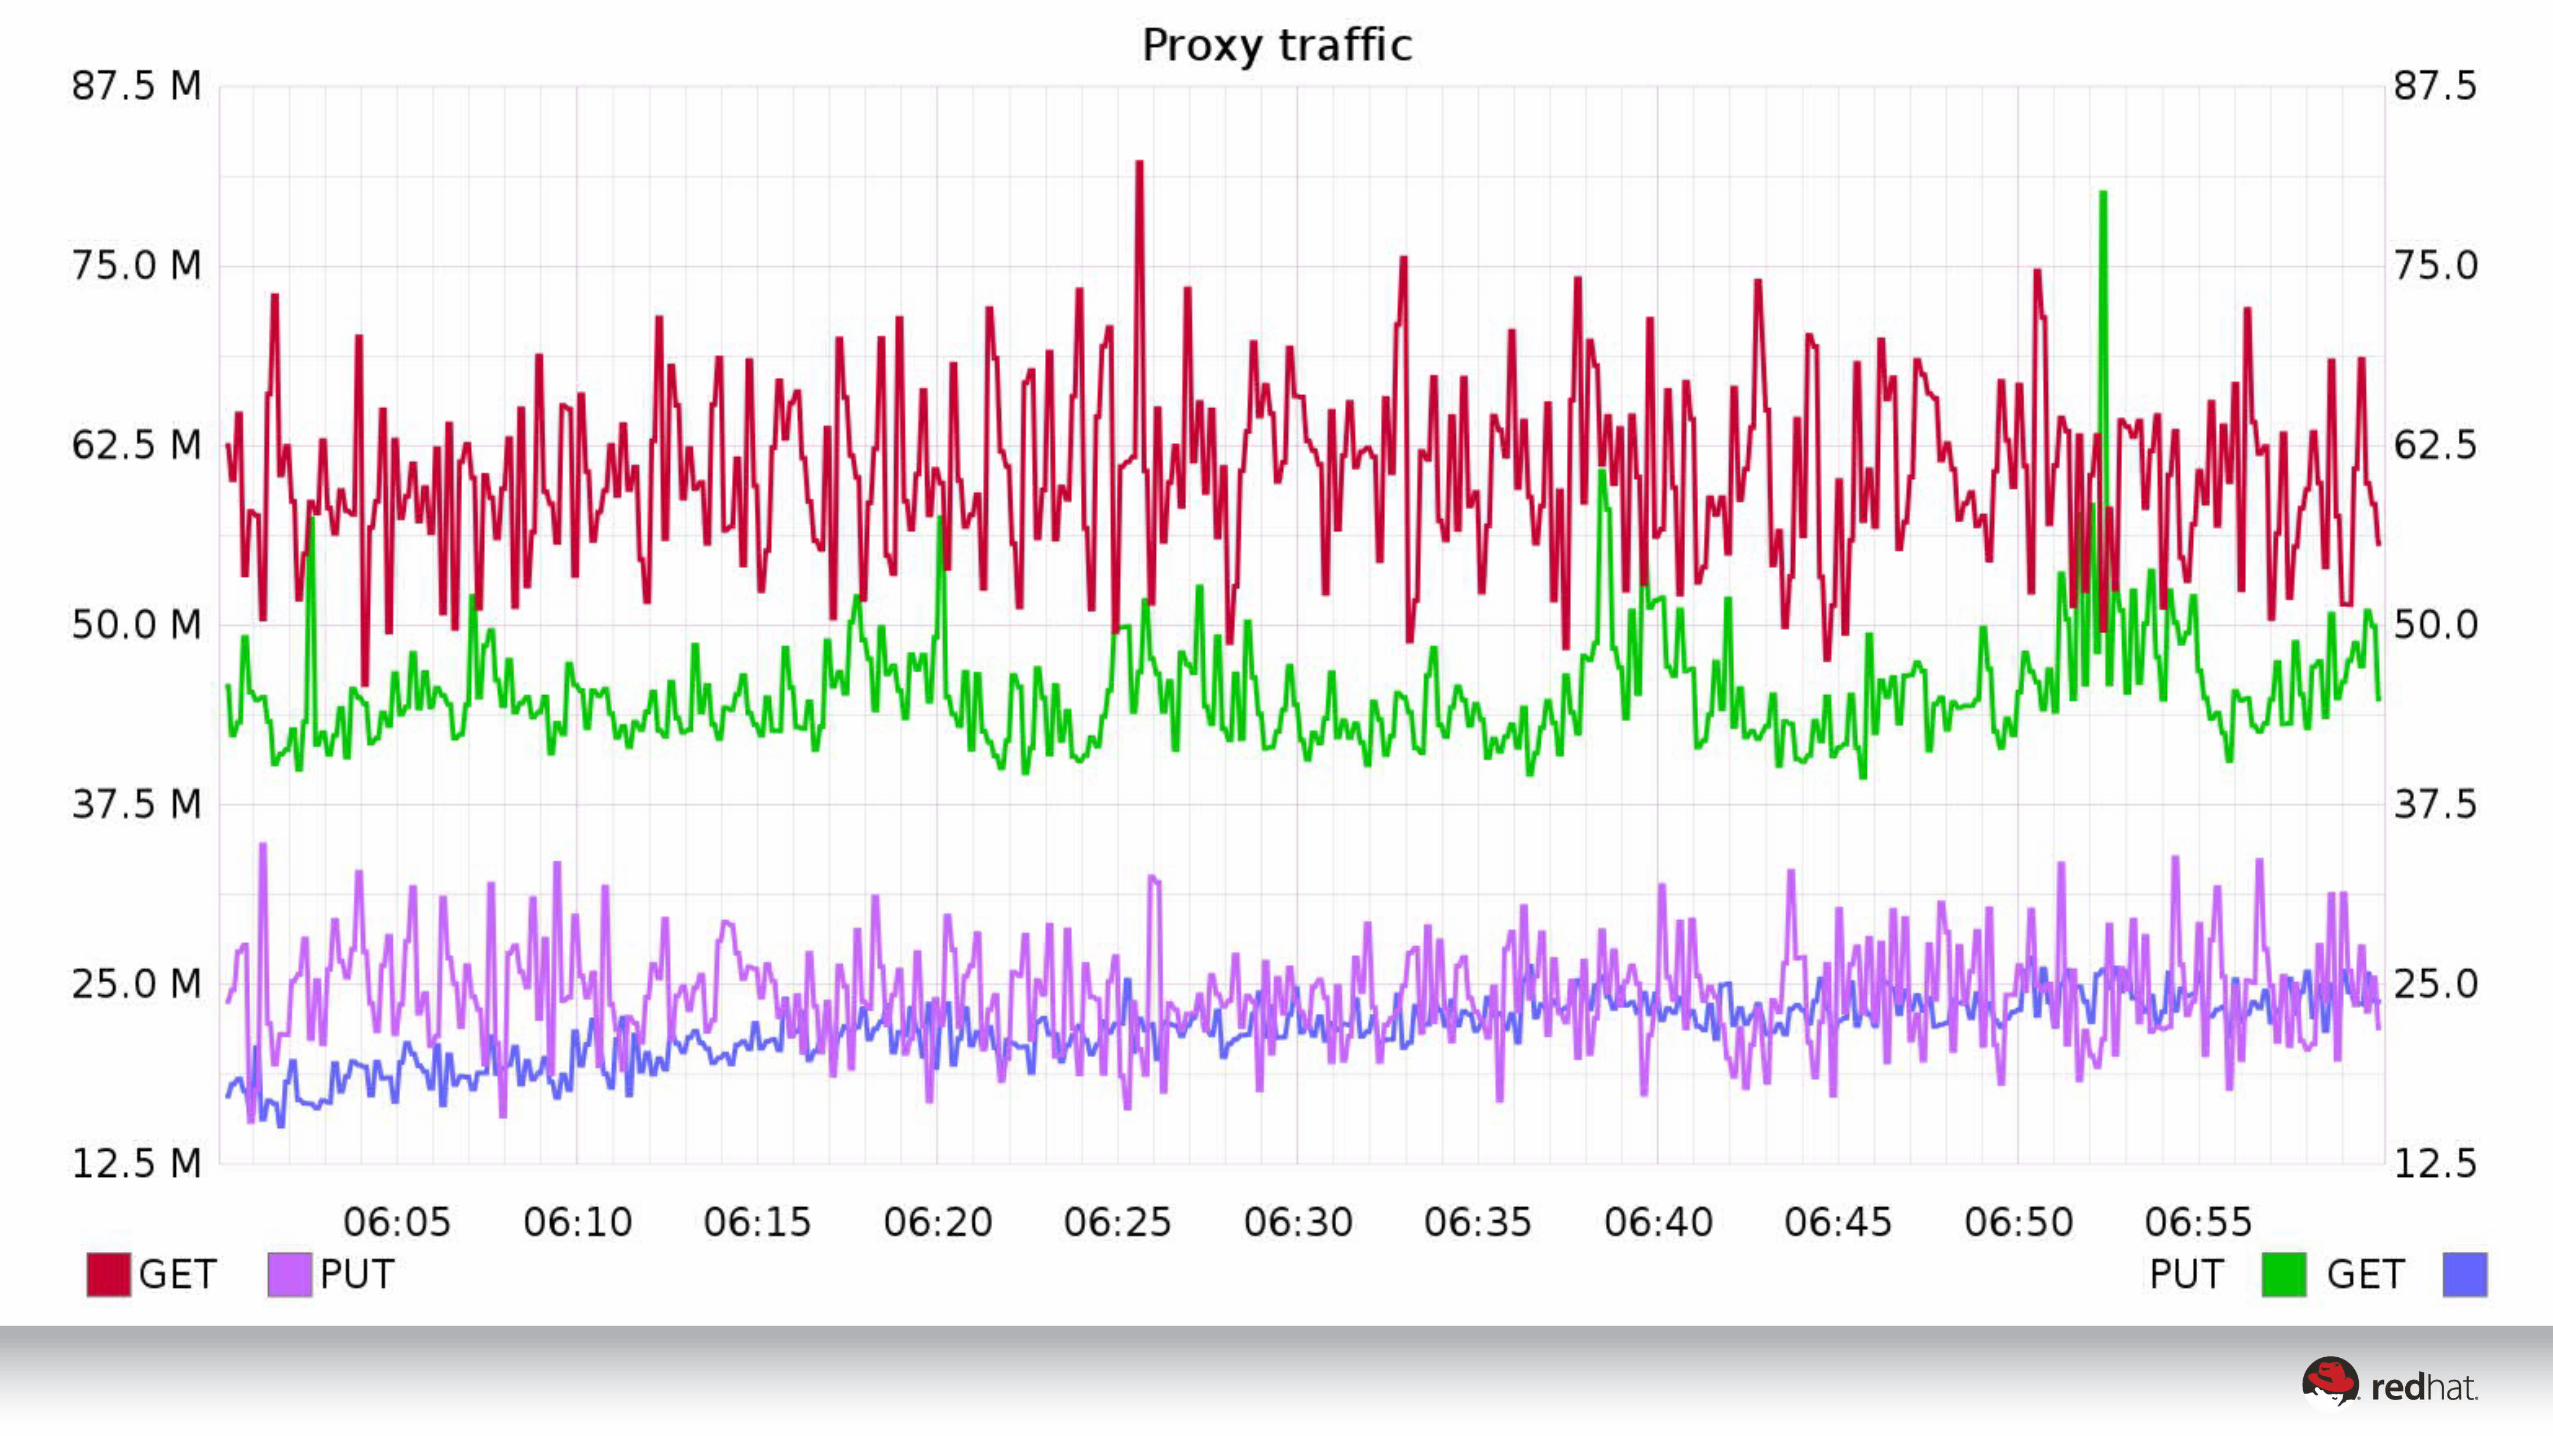
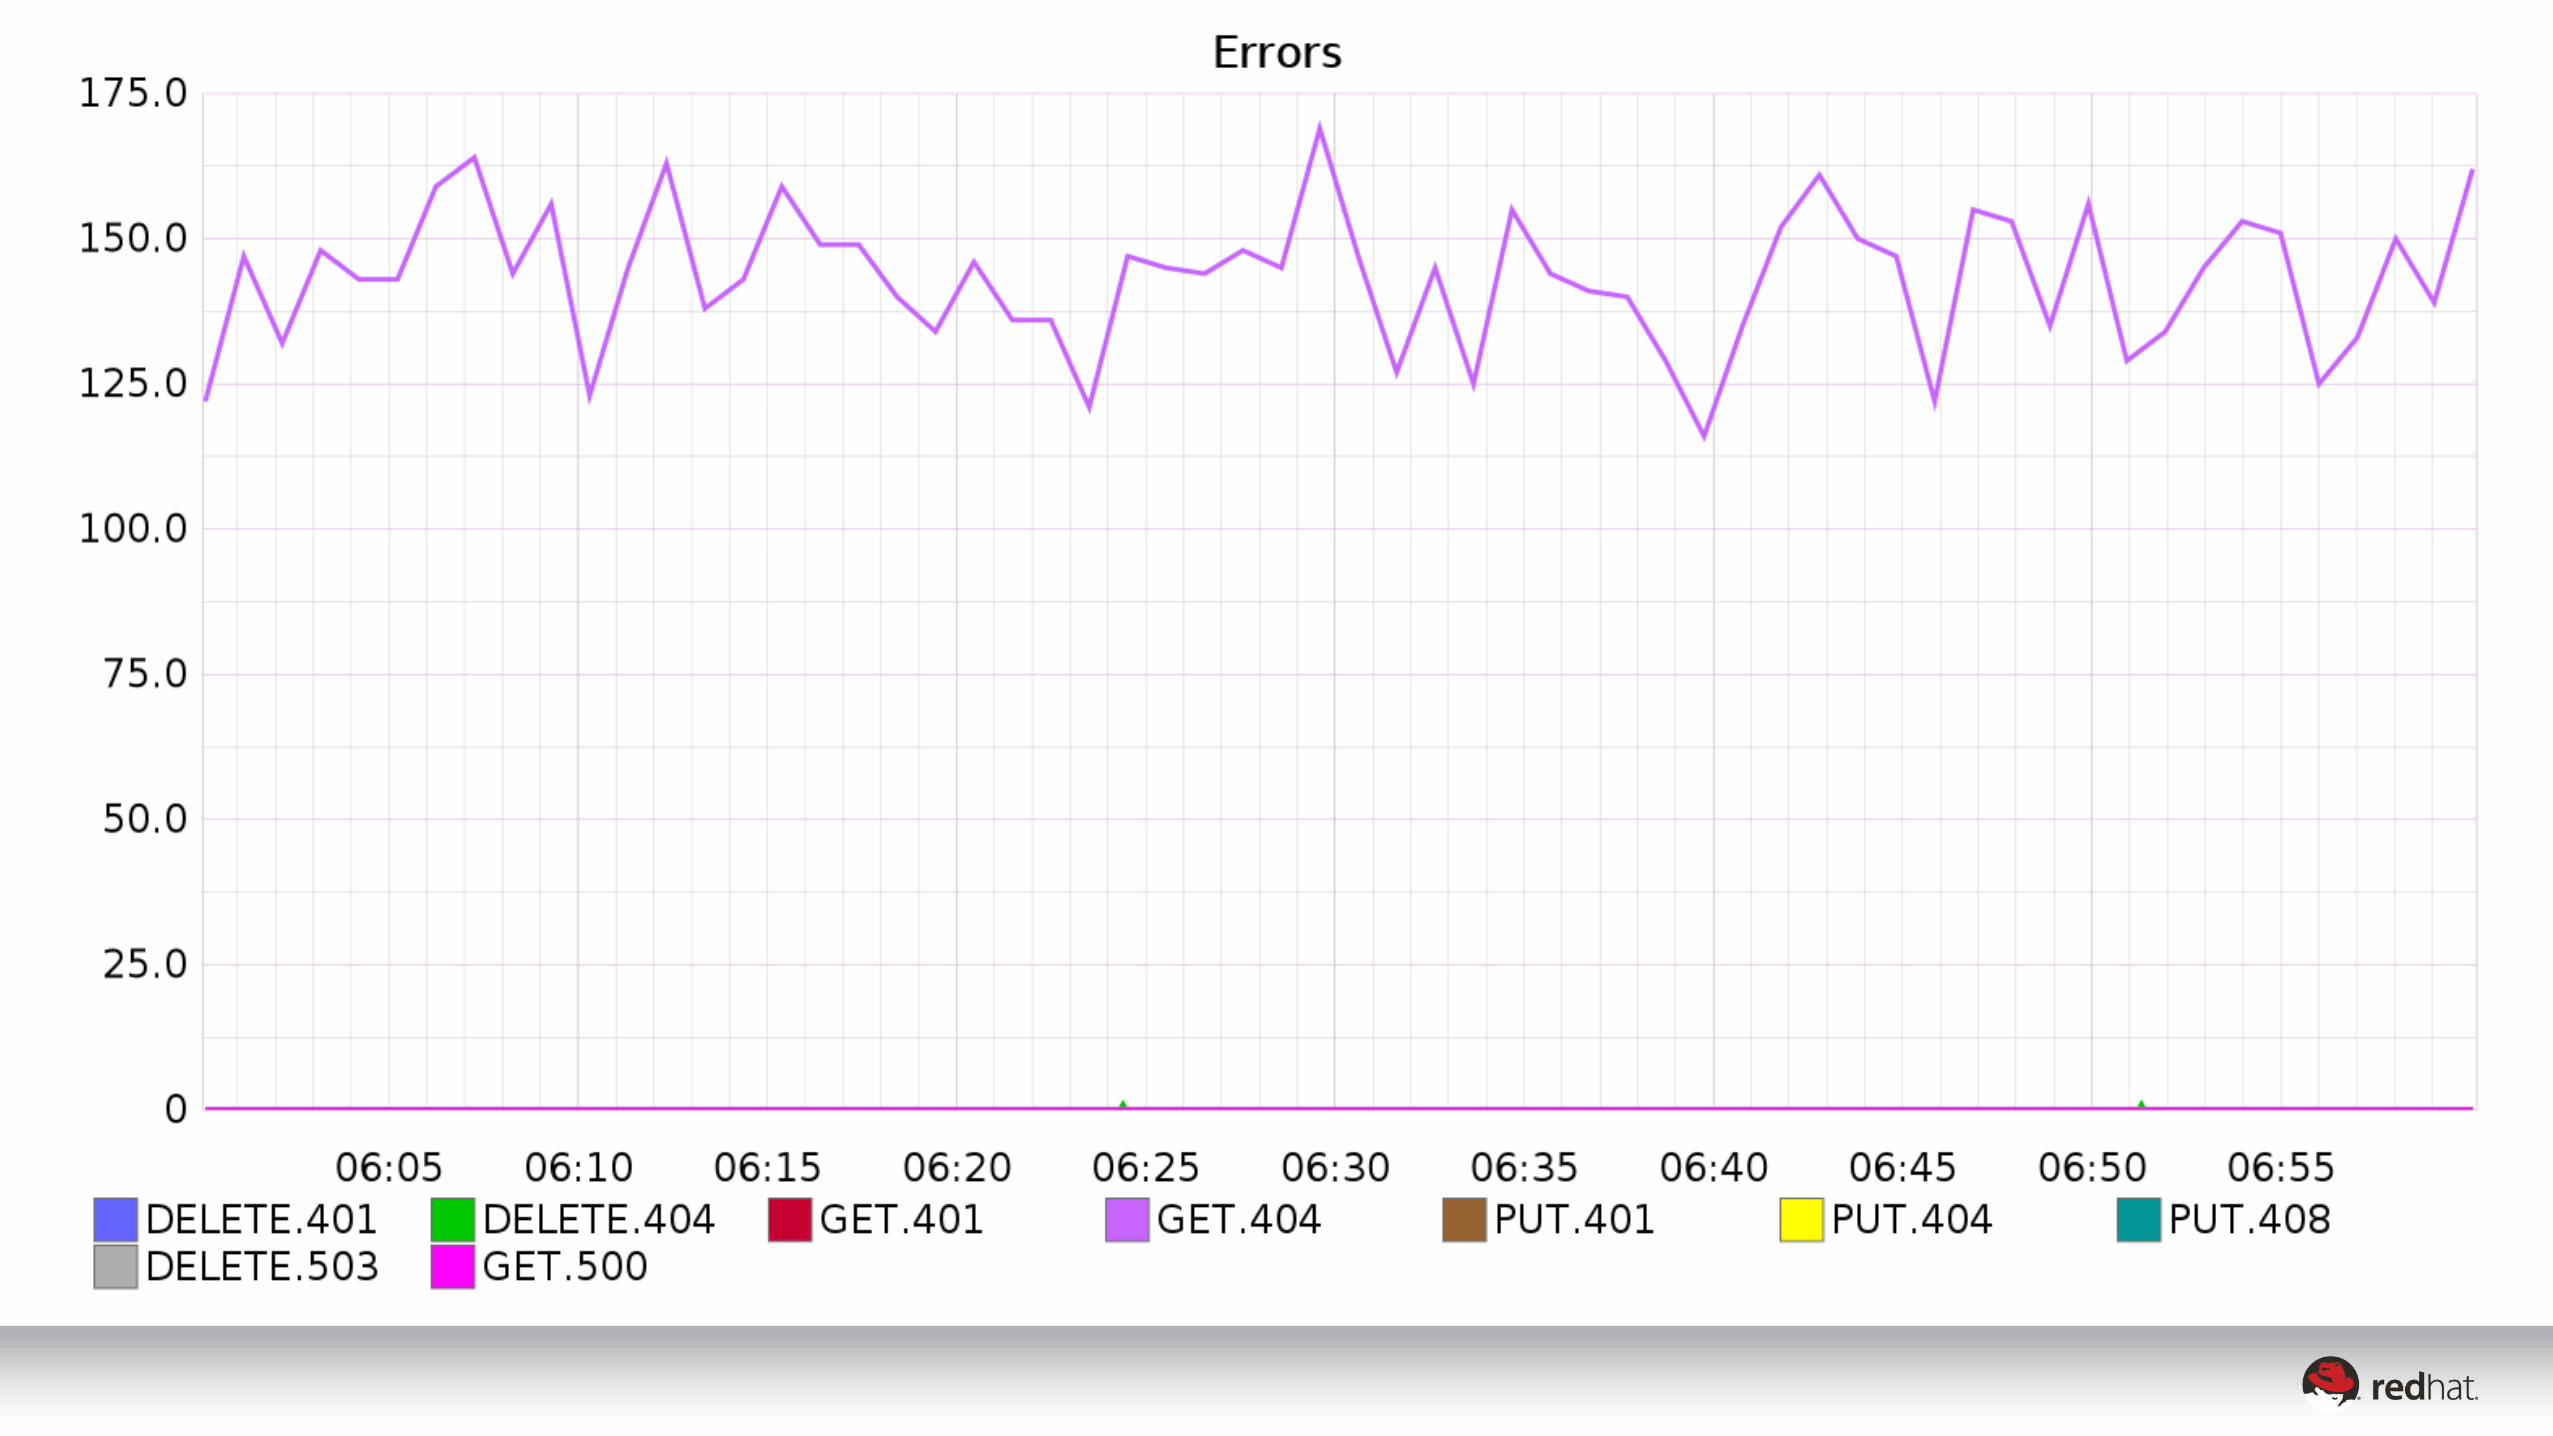
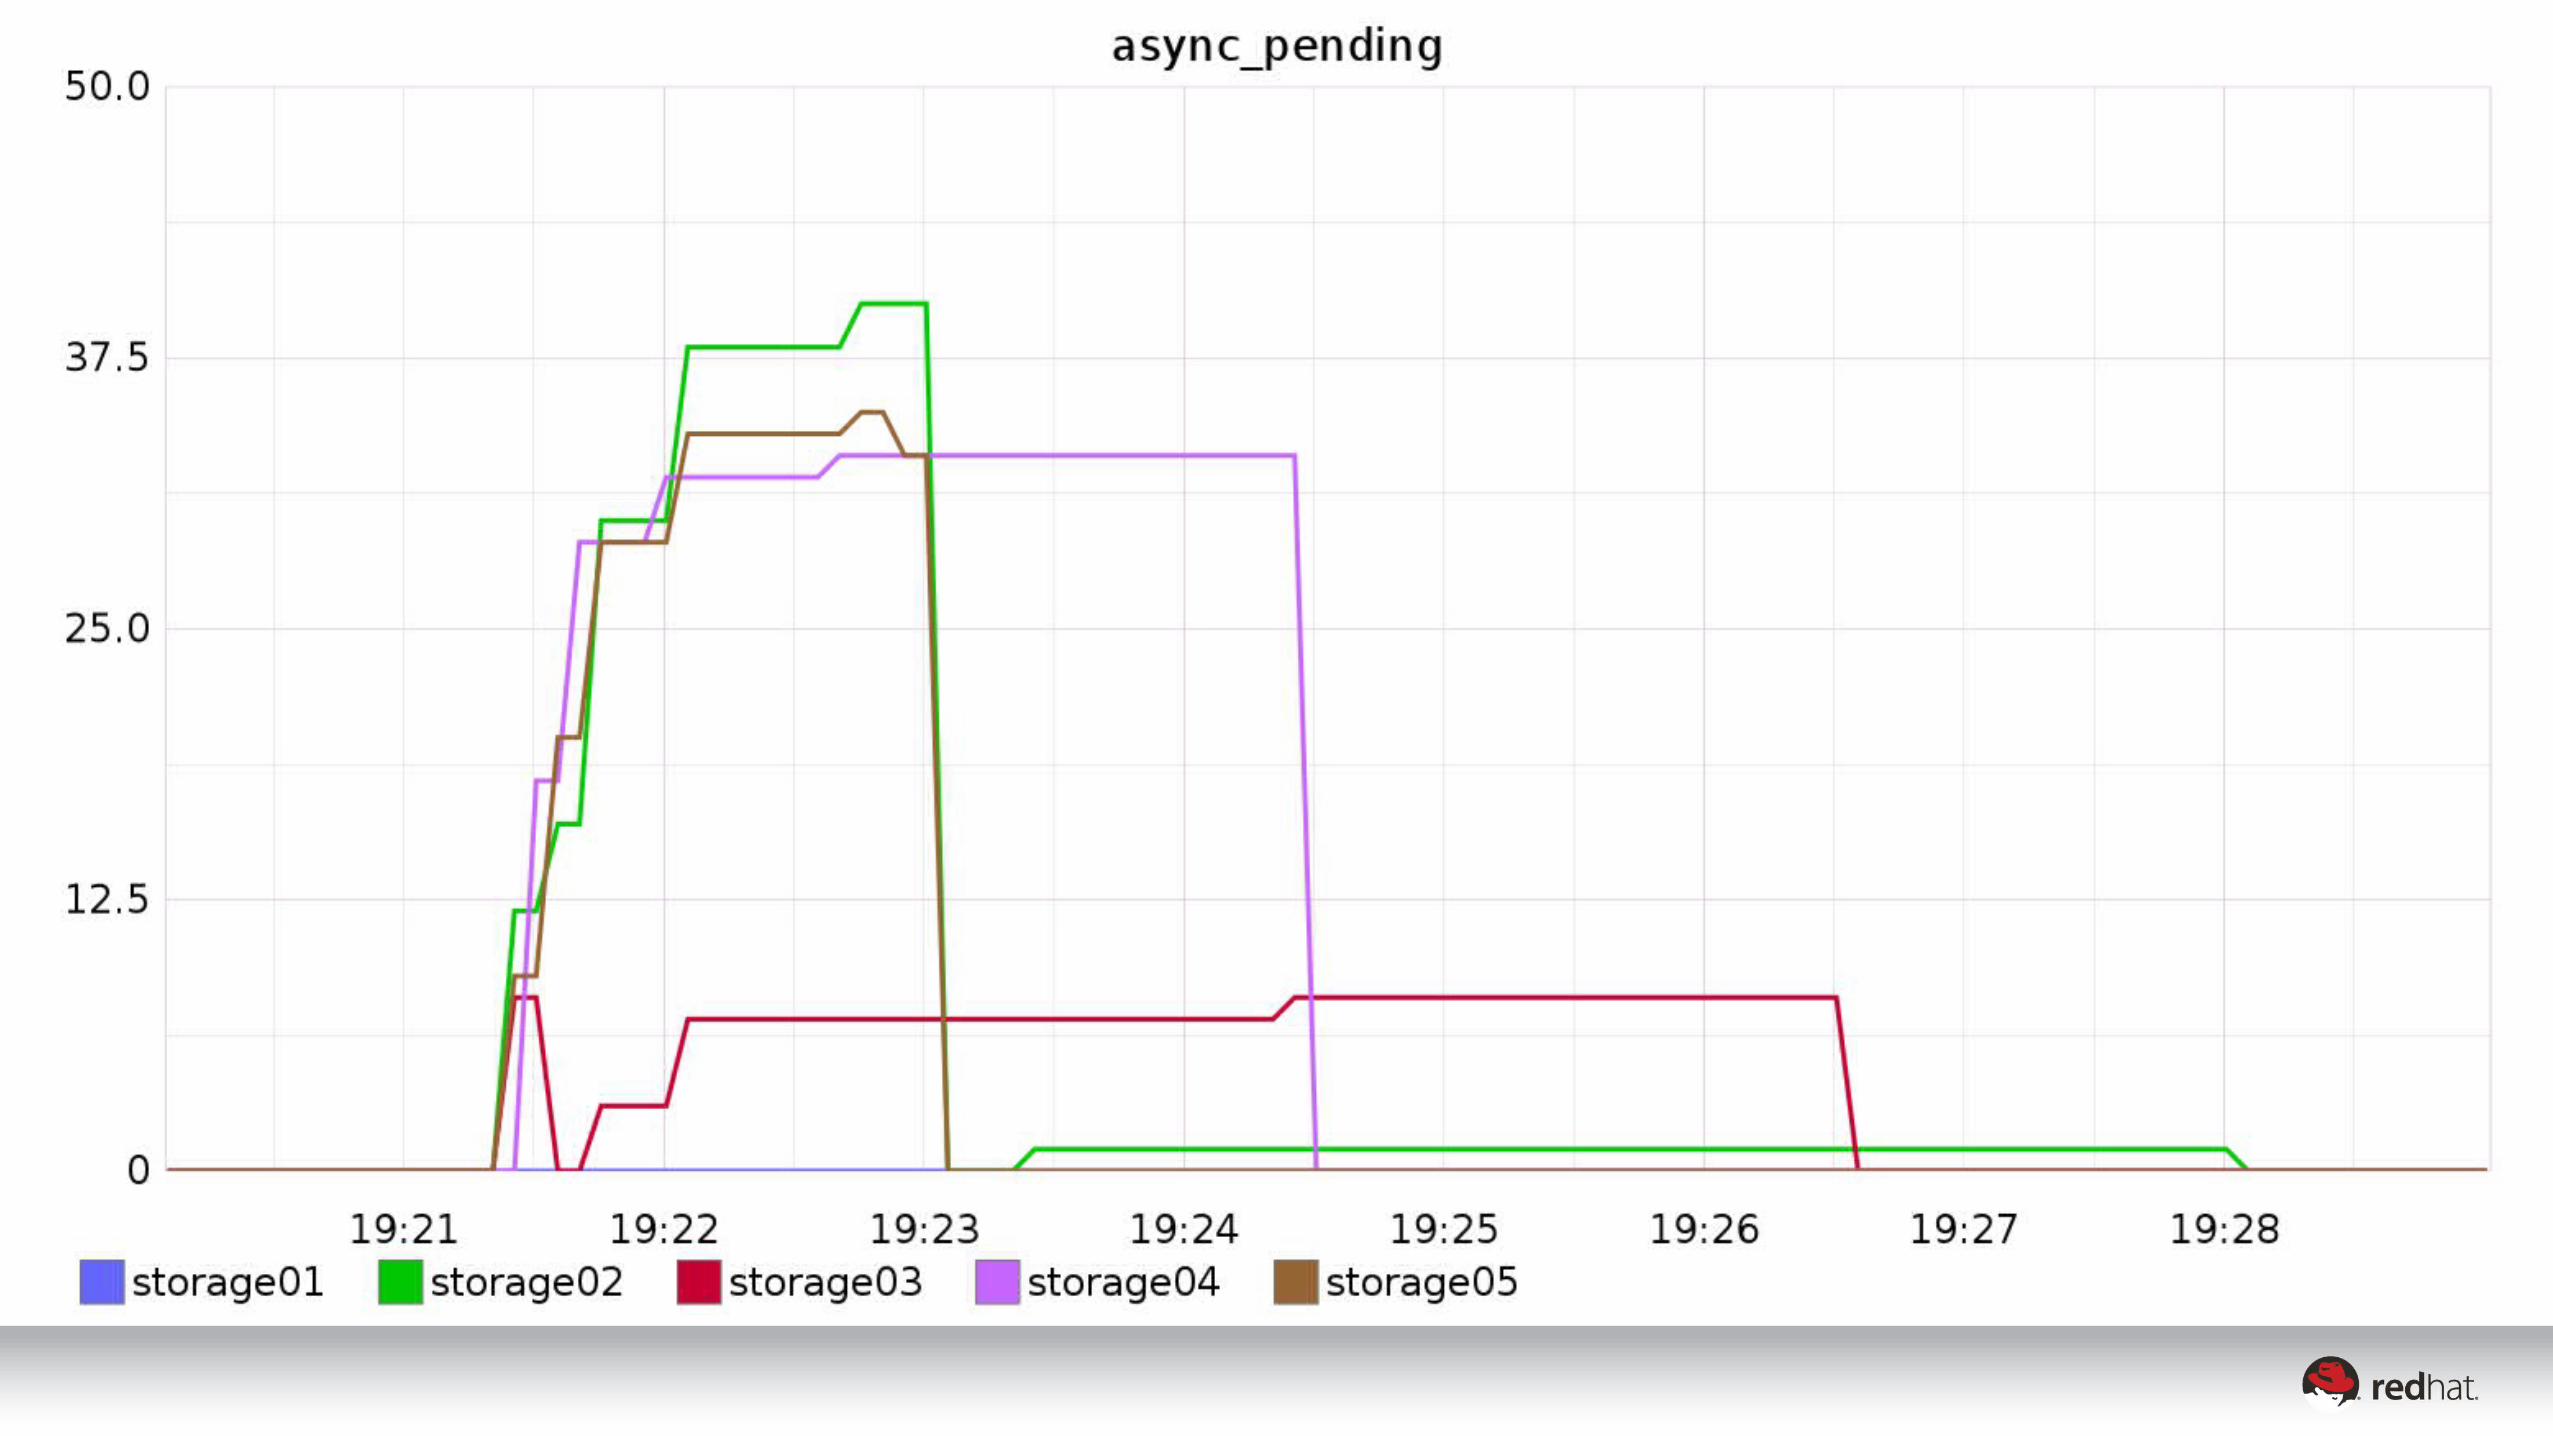
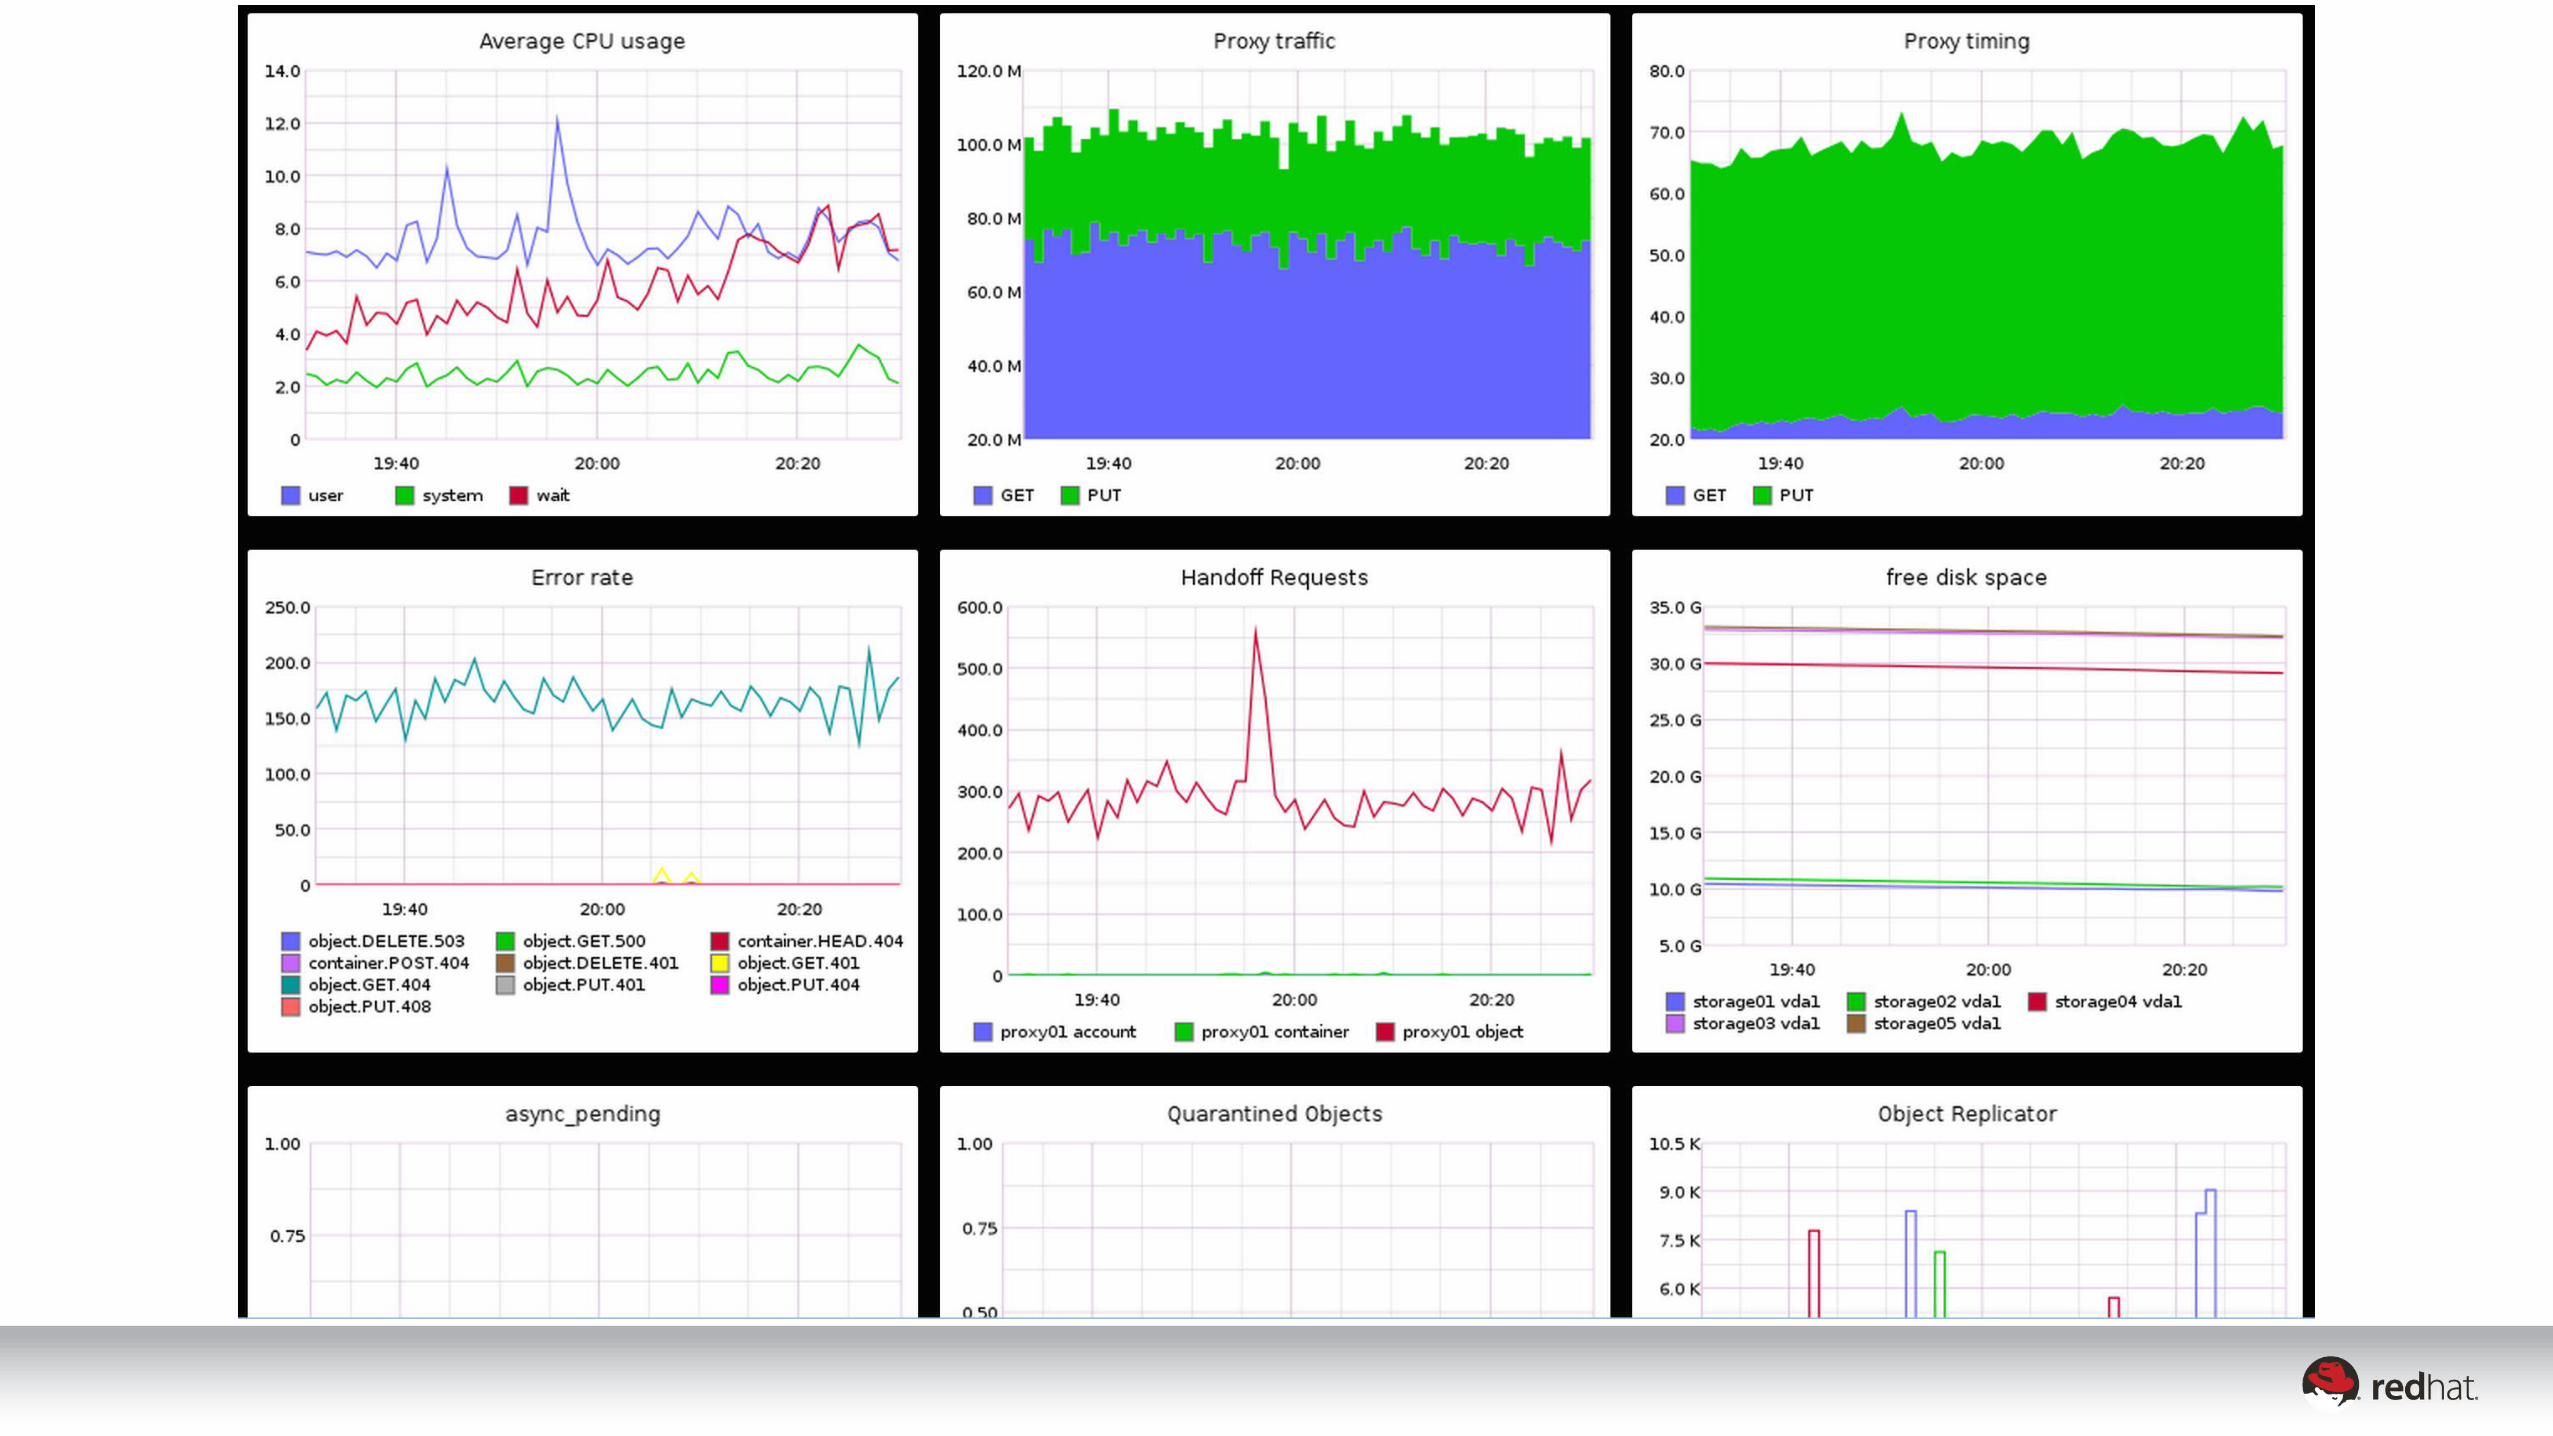
Selected Metrics
References
● docs.openstack.org/developer/swift/admin_guide.html#cluster-telemetry-and-monitoring
● docs.openstack.org/developer/swift/admin_guide.html#reporting-metrics-to-statsd
● github.com/etsy/statsd/blob/master/docs/graphite.md
● graphite.readthedocs.org/en/latest/
● graphite.readthedocs.org/en/latest/functions.html
● collectd.org/documentation/manpages/collectd.conf.5.shtml#plugin_write_graphite
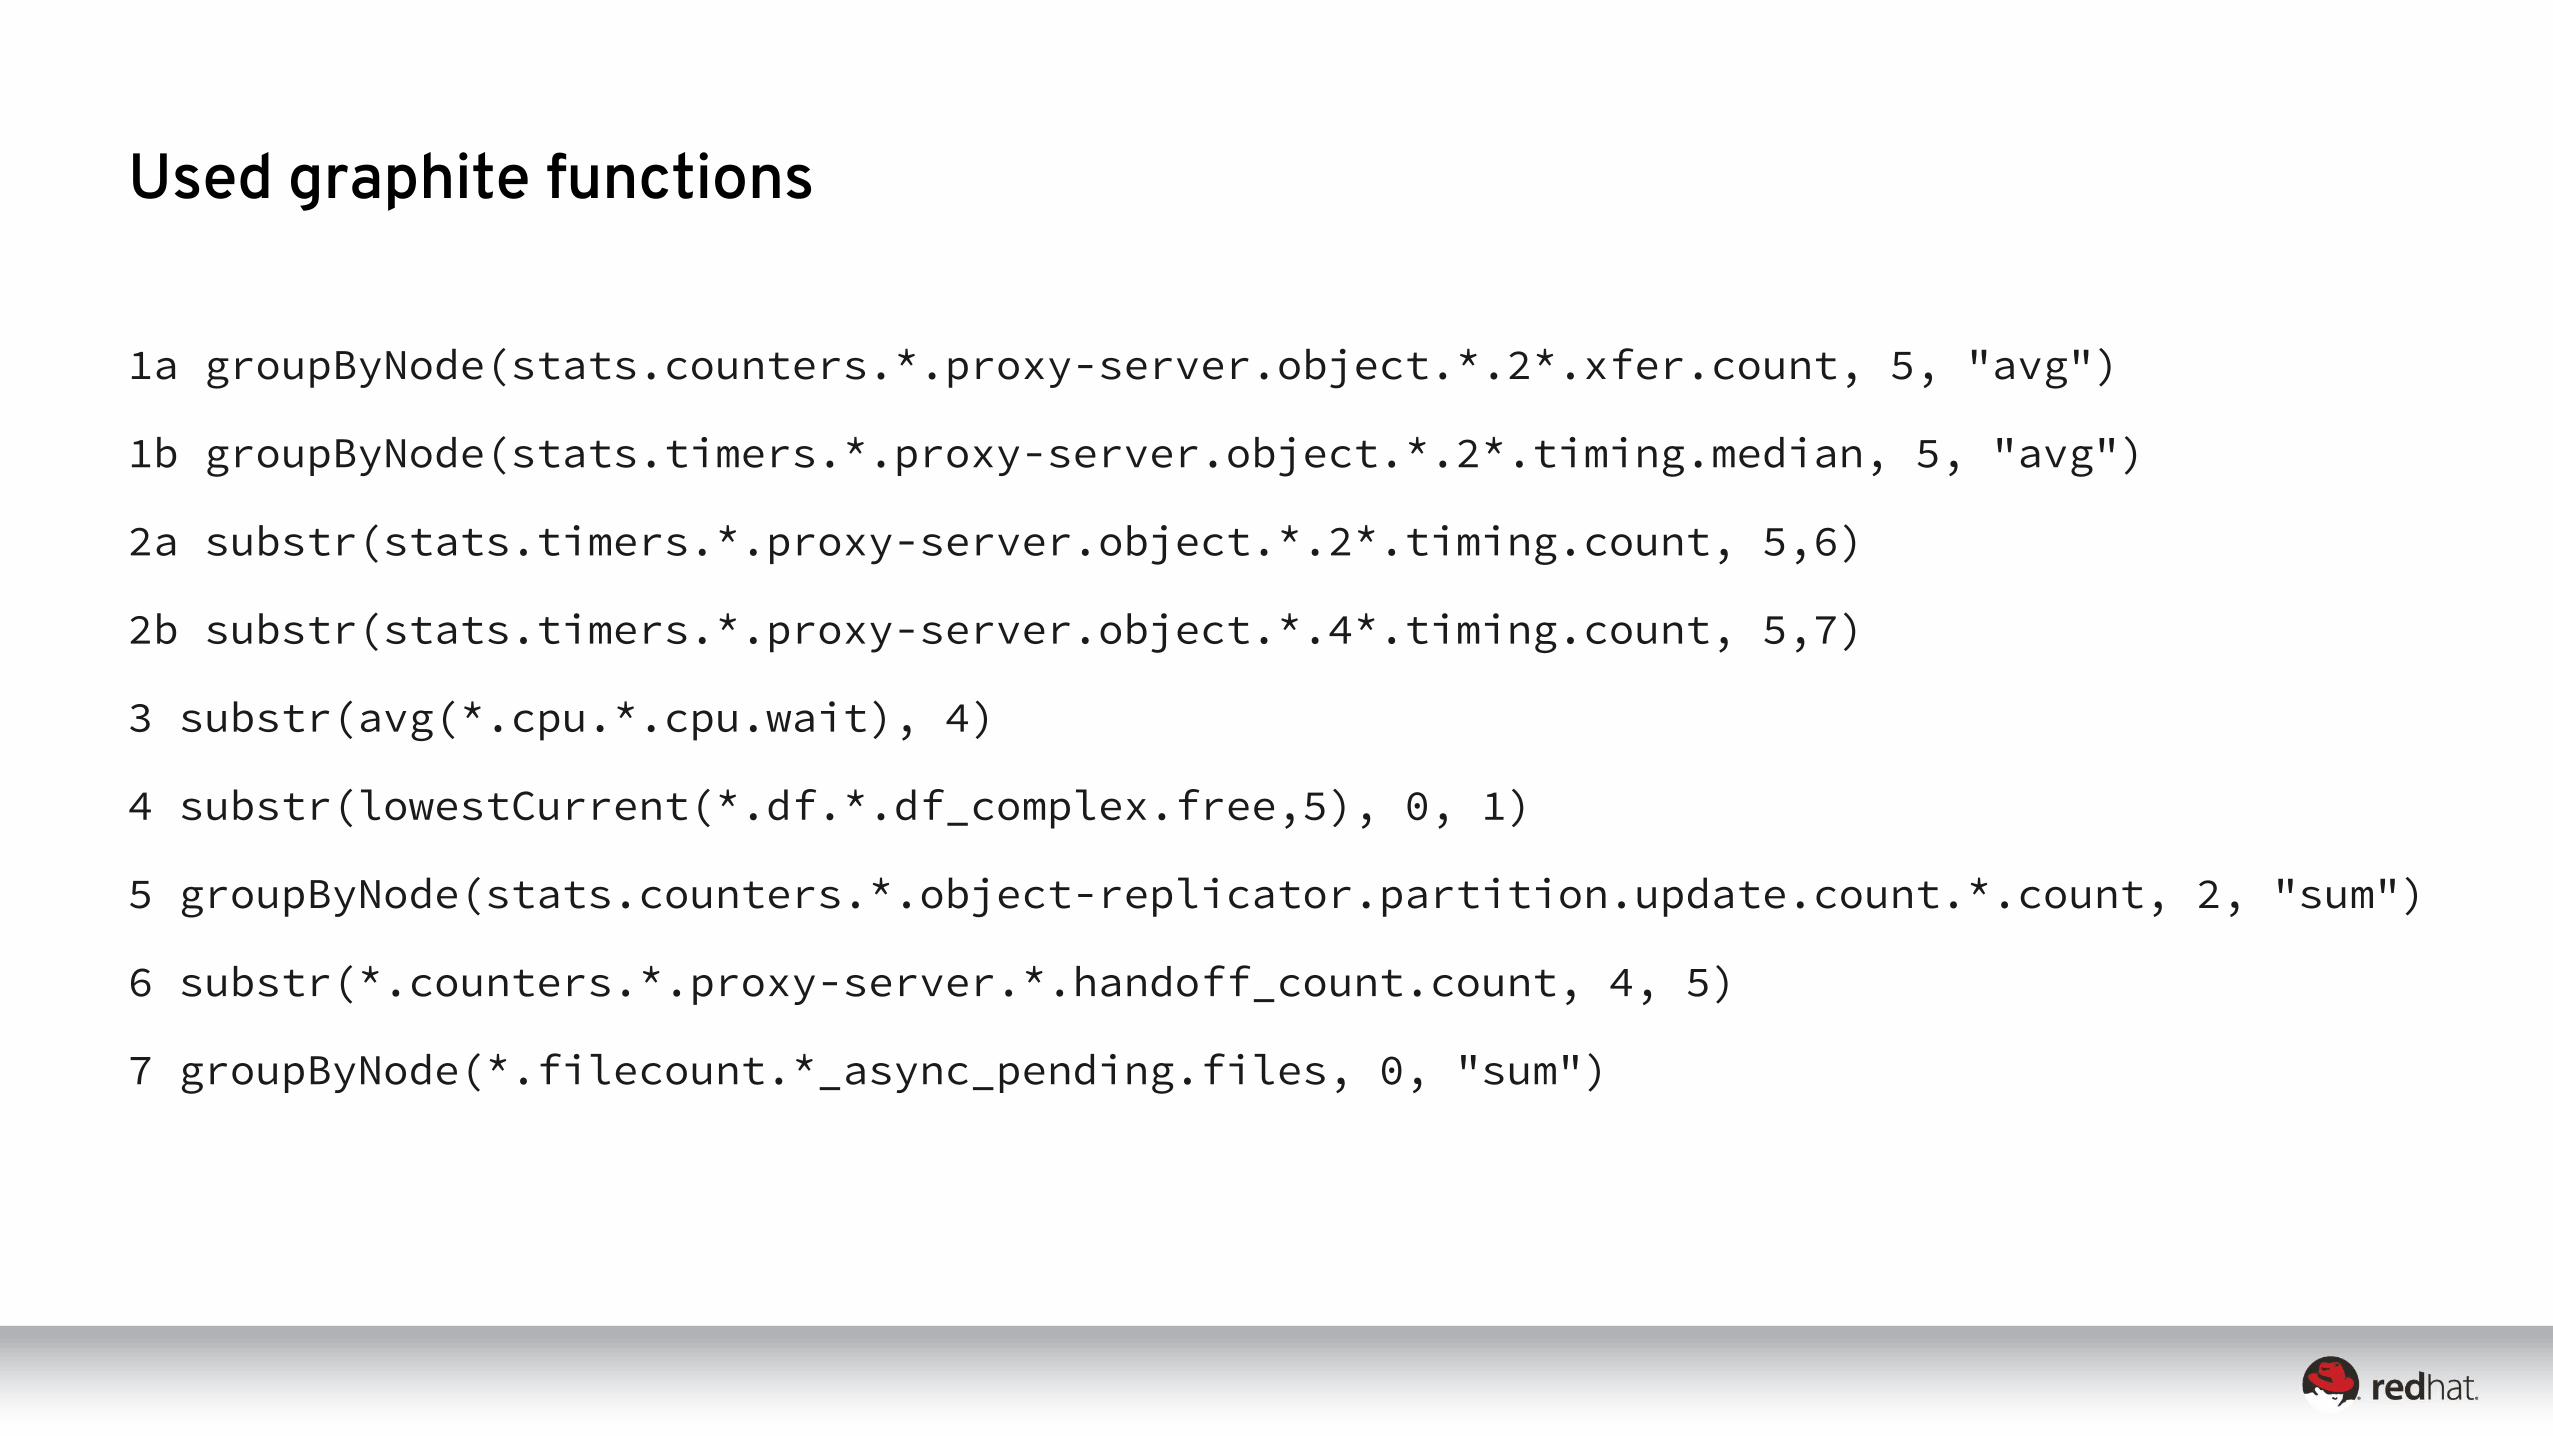
Used graphite functions
1a groupByNode(stats.counters.*.proxy-server.object.*.2*.xfer.count, 5, "avg")
1b groupByNode(stats.timers.*.proxy-server.object.*.2*.timing.median, 5, "avg")
2a substr(stats.timers.*.proxy-server.object.*.2*.timing.count, 5,6)
2b substr(stats.timers.*.proxy-server.object.*.4*.timing.count, 5,7)
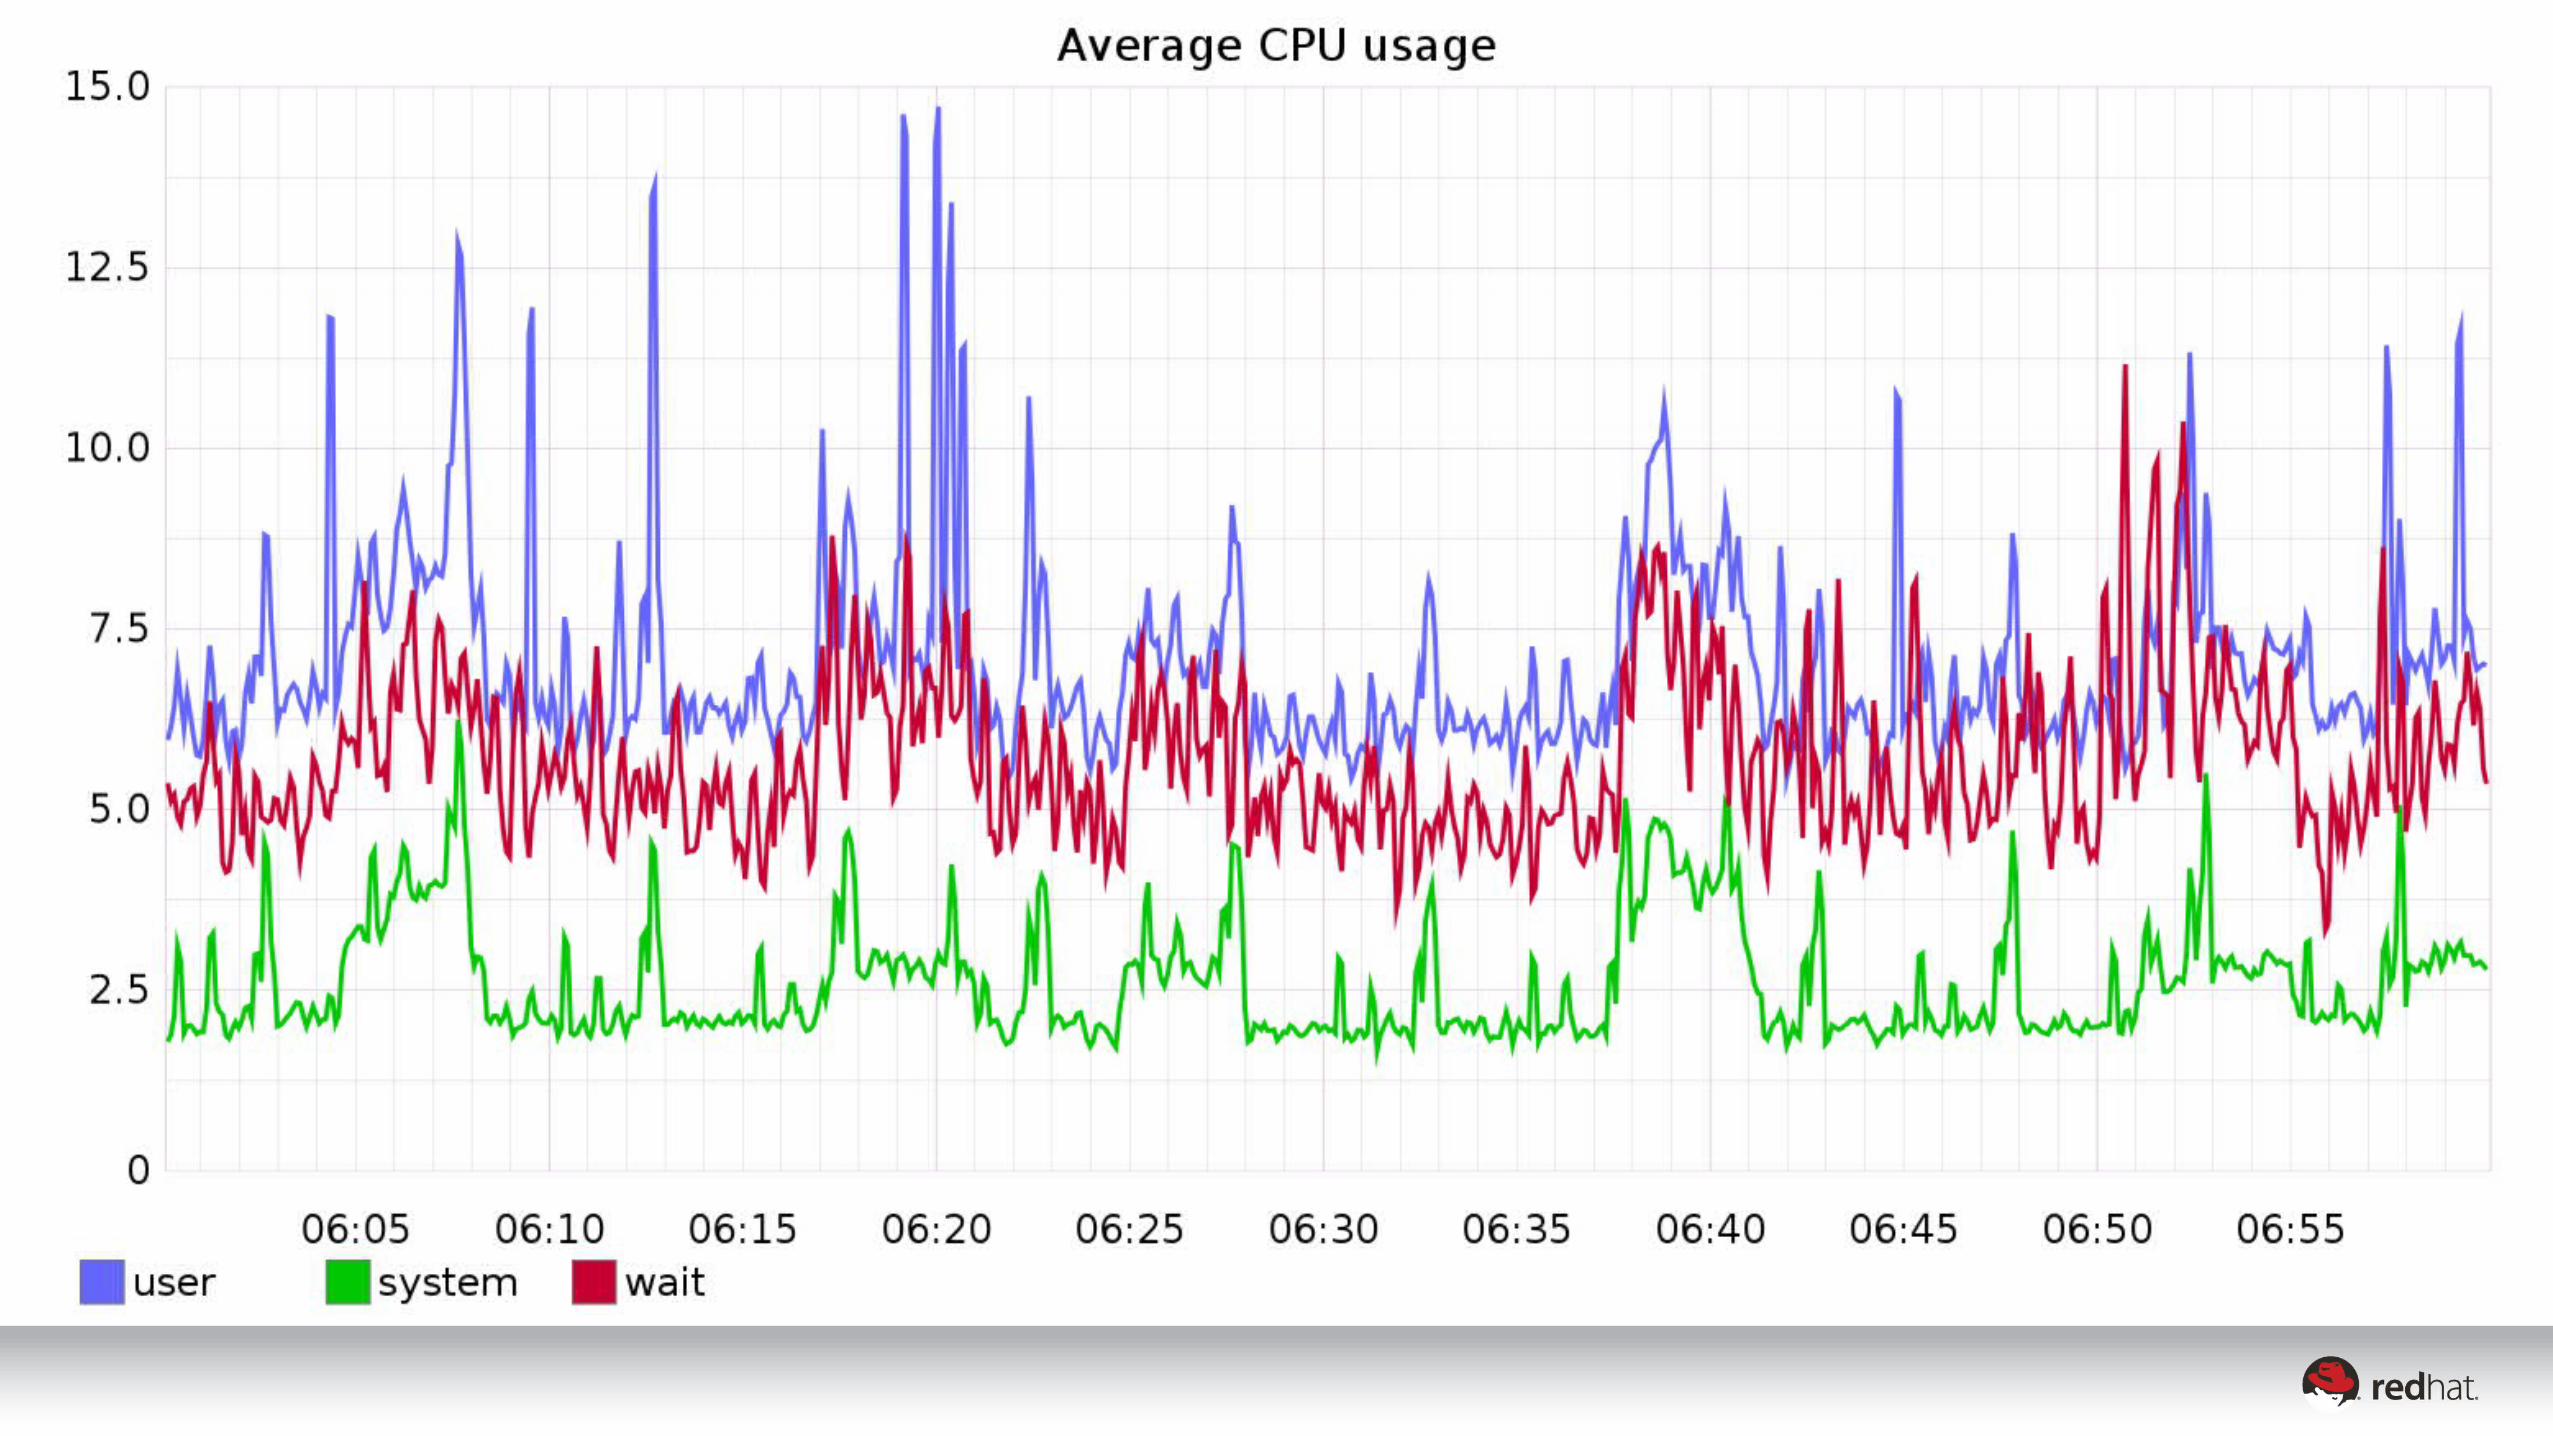
3 substr(avg(*.cpu.*.cpu.wait), 4)
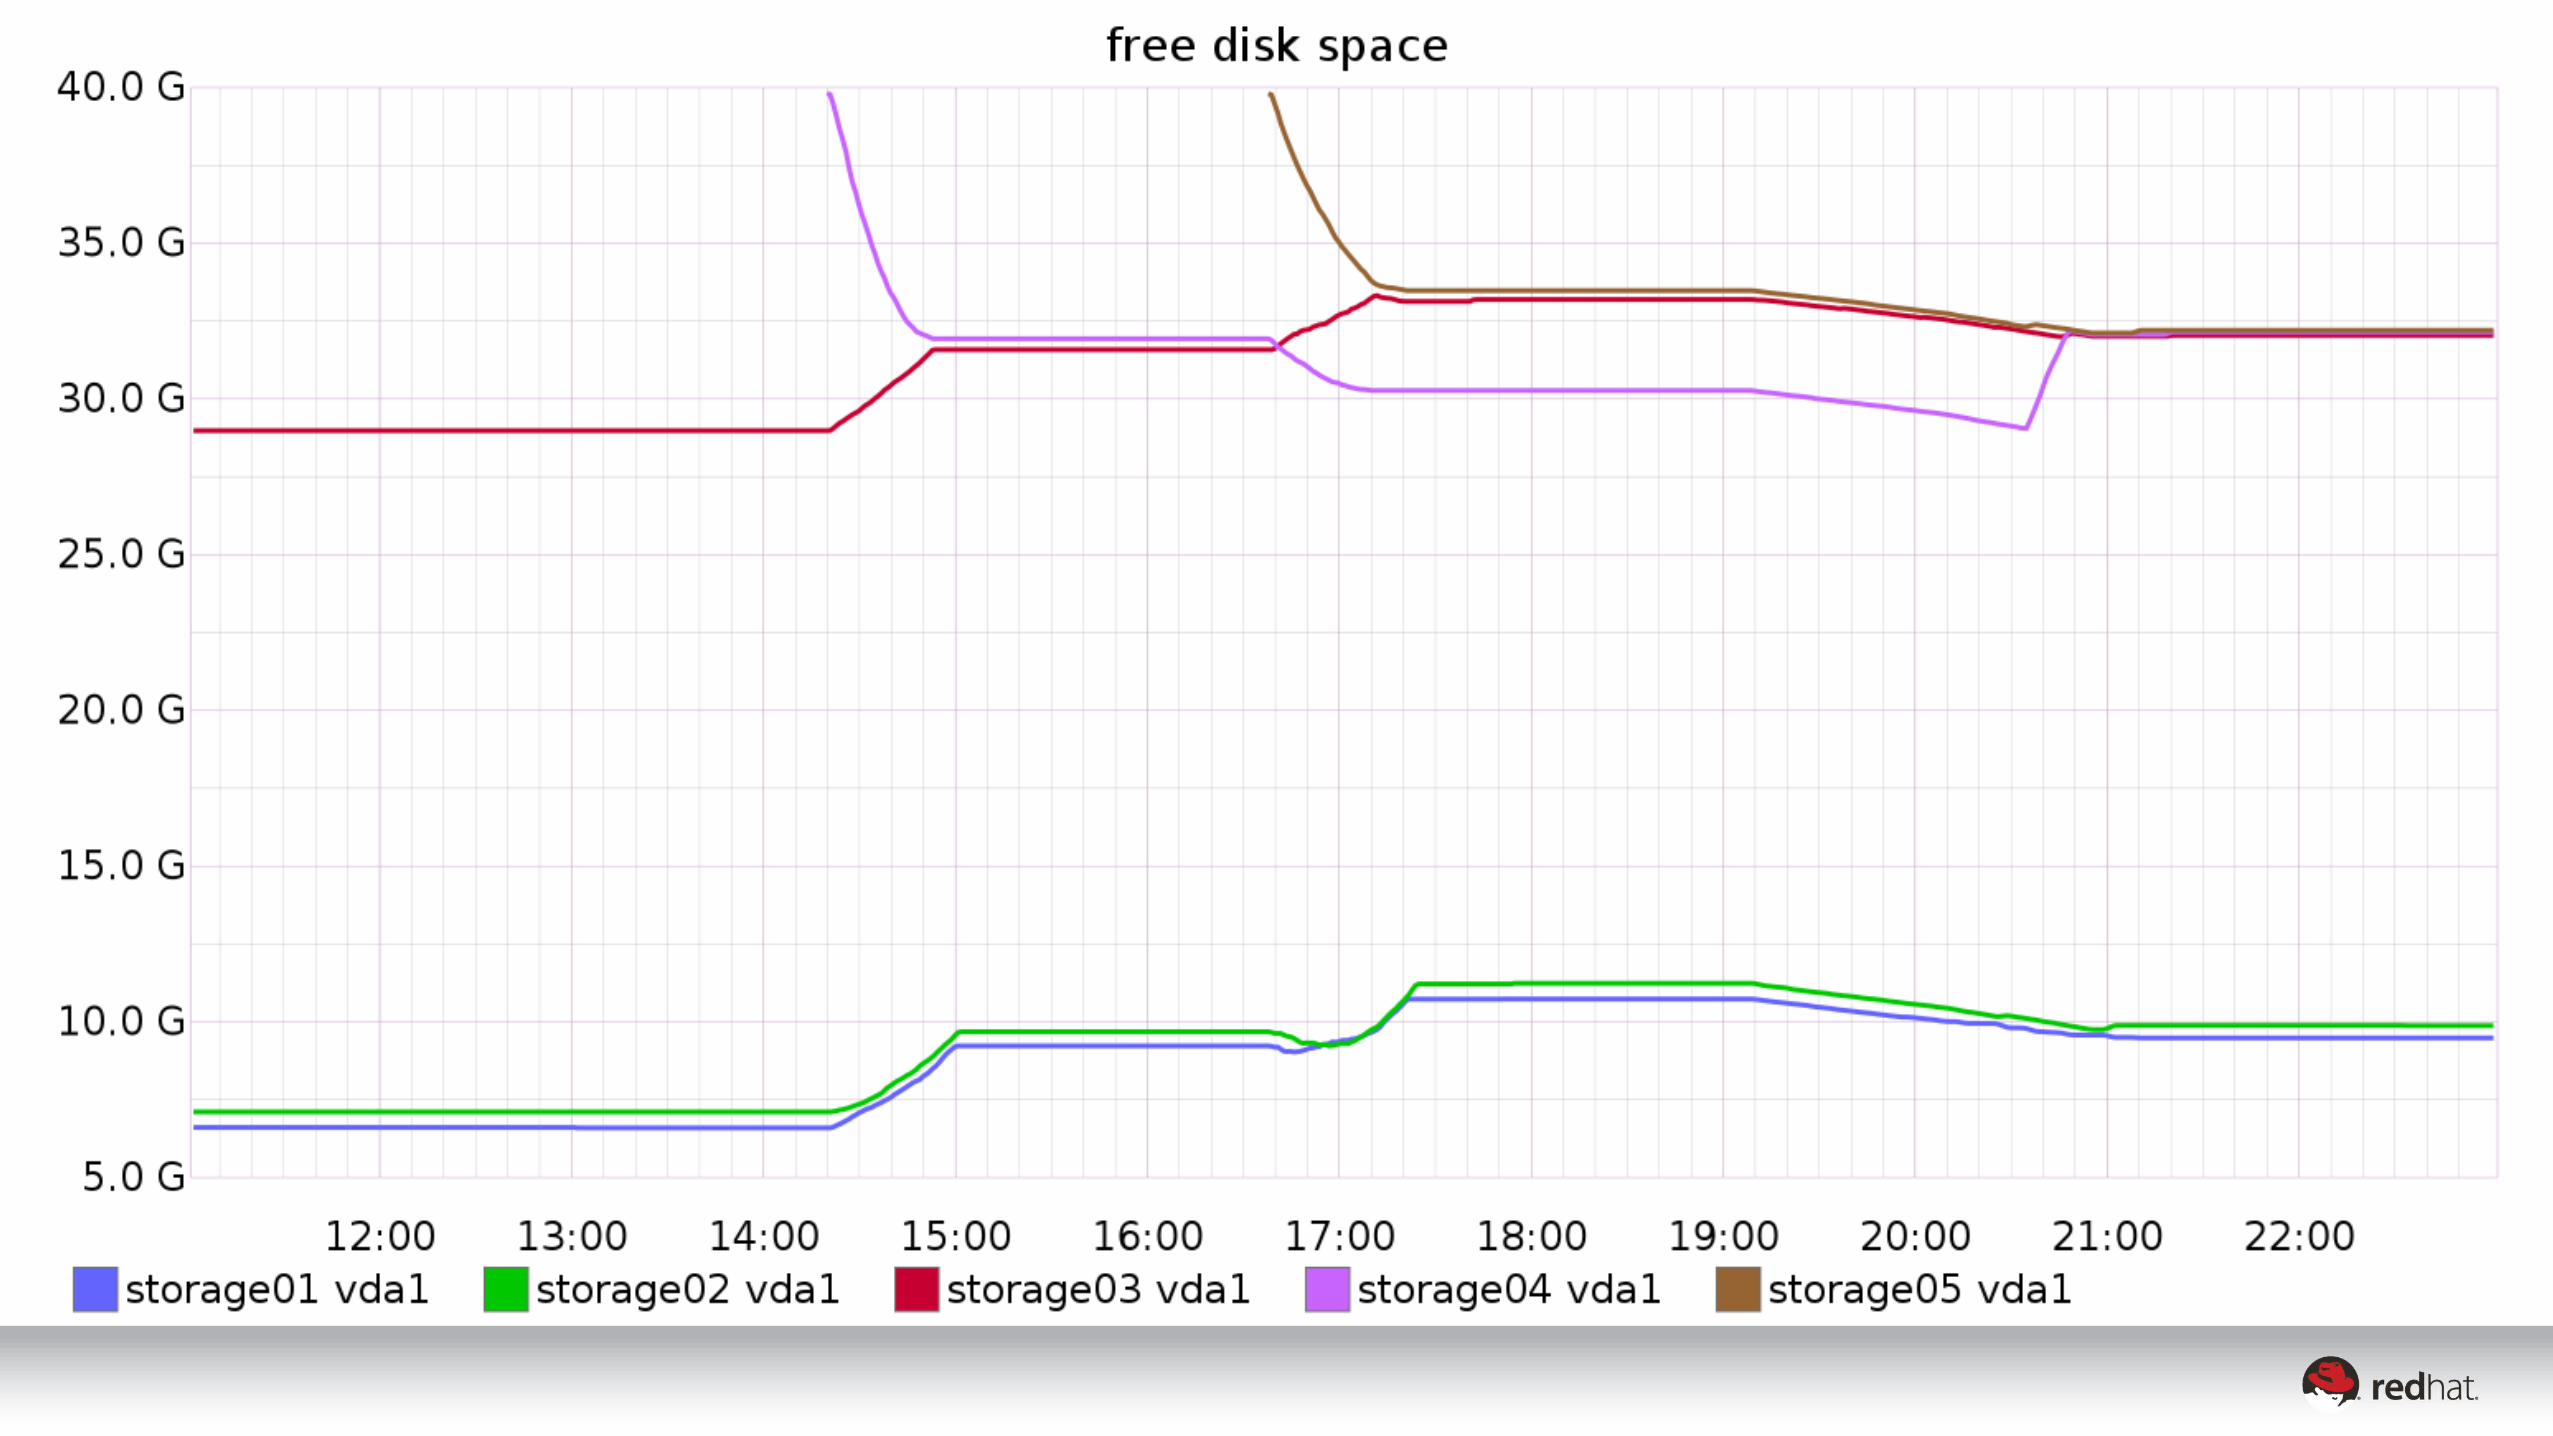
4 substr(lowestCurrent(*.df.*.df_complex.free,5), 0, 1)
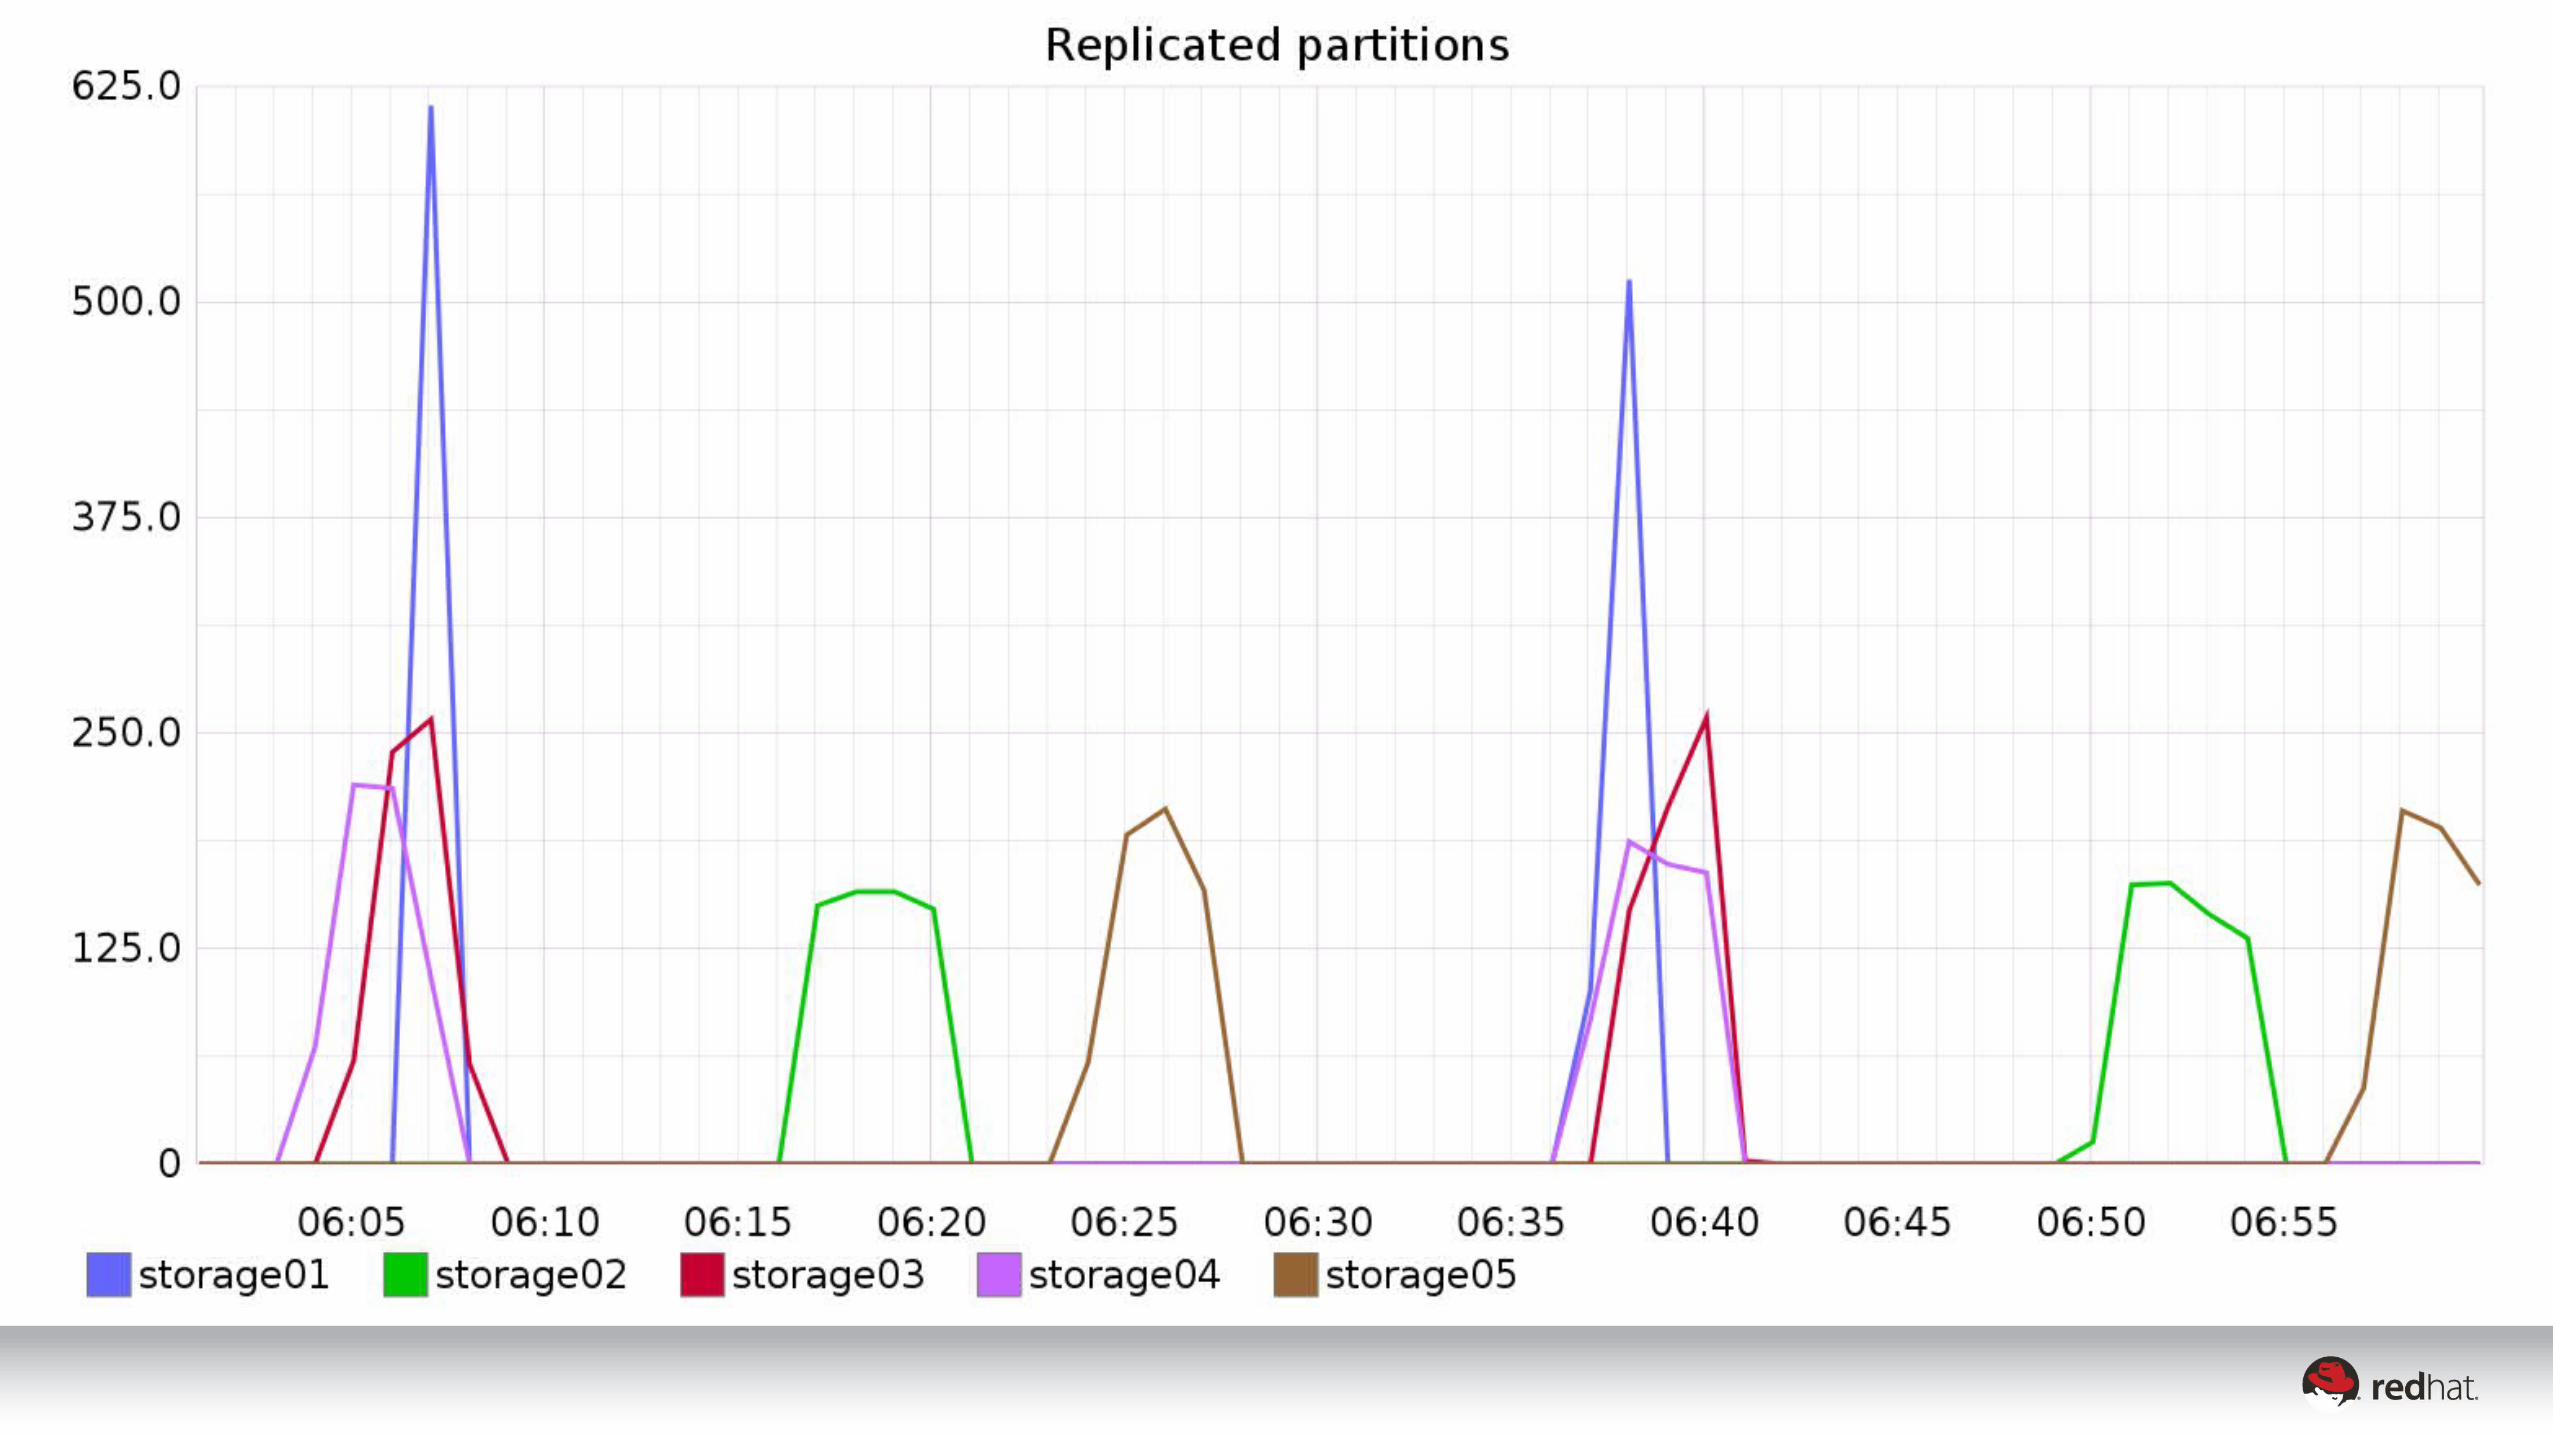
5 groupByNode(stats.counters.*.object-replicator.partition.update.count.*.count, 2, "sum")
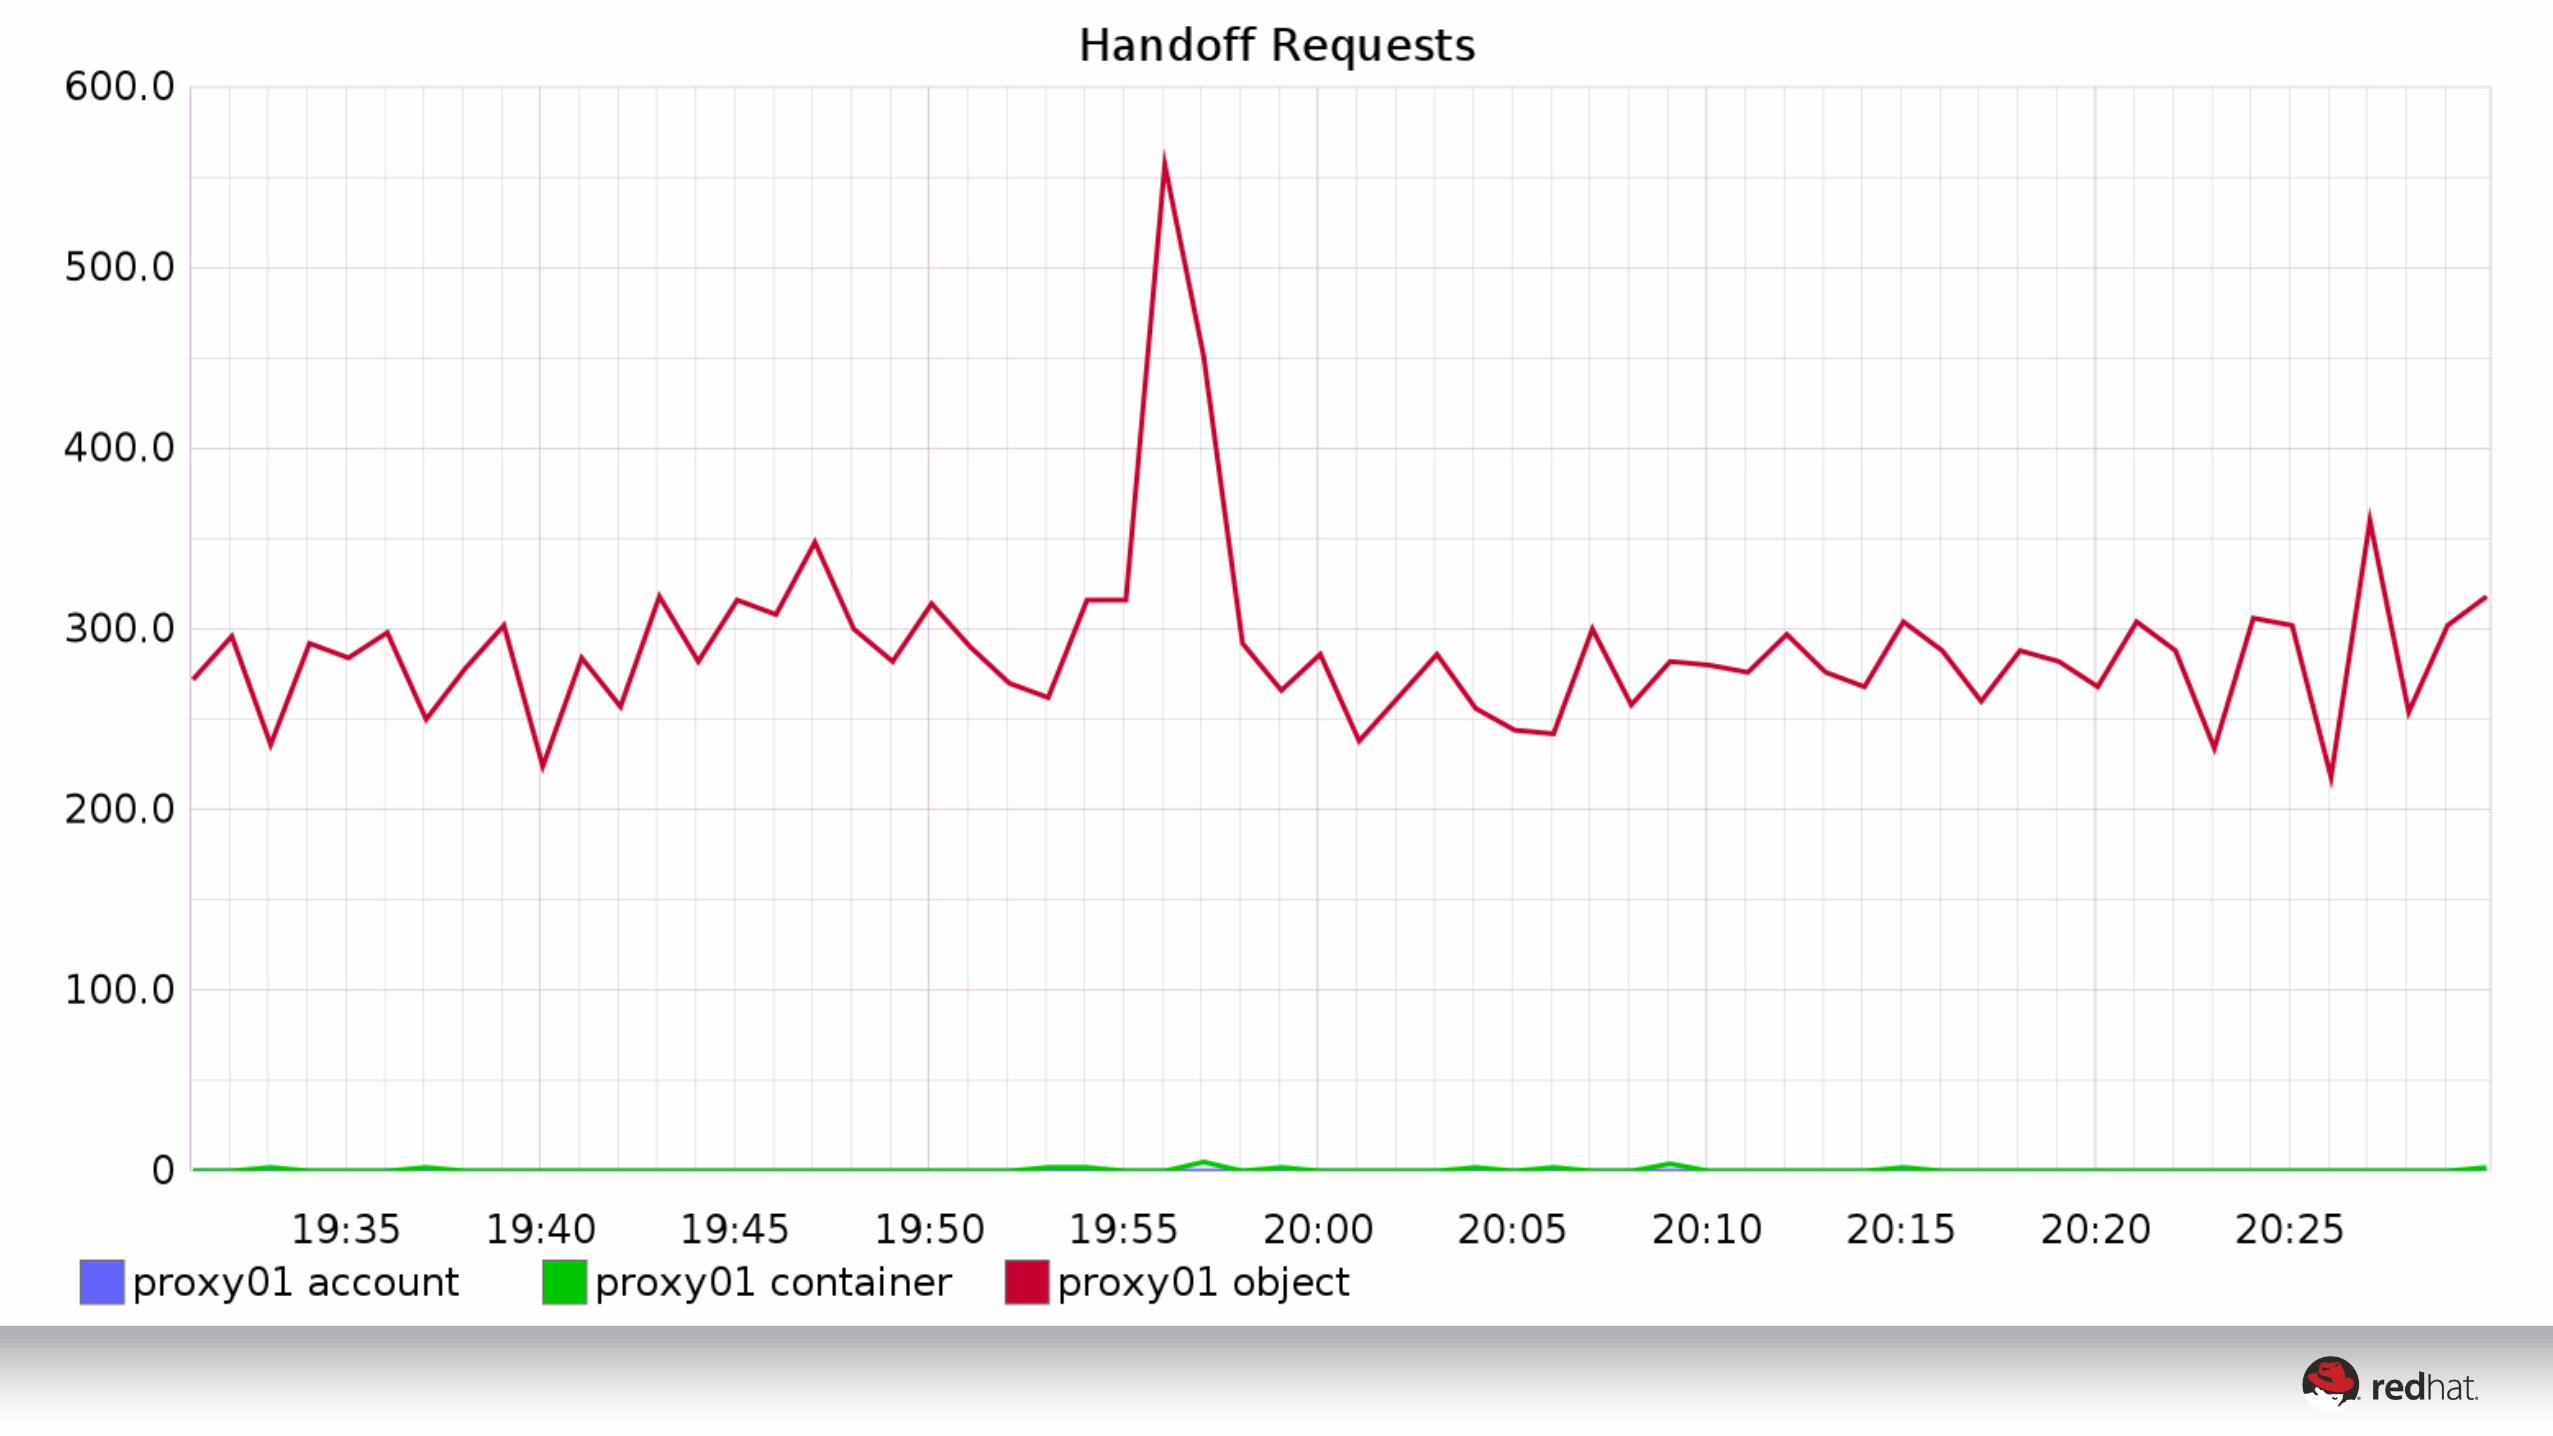
6 substr(*.counters.*.proxy-server.*.handoff_count.count, 4, 5)
7 groupByNode(*.filecount.*_async_pending.files, 0, "sum")